36
LightCycler ® 480 Instrument Quick Guide For life science research use only. Not for use in diagnostic procedures.

LightCycler® 480 Instrument Quick Guide
For life science research use only.Not for use in diagnostic procedures.

This page intentionally left blank.
LightCycler® 480 Quick Guide Page i5125-00-1113
General Information
The contents of this document, including all graphics and photographs, are the property of Roche Diagnostics. No part may be reproduced or transmitted in any form or by any means, electronic or mechanical, for any purpose, without the express written permission of Roche Diagnostics.
Roche Diagnostics has made every reasonable effort to ensure that all the information contained in this manual is correct at the time of printing. However, Roche Diagnostics reserves the right to make any changes necessary without notice as part of ongoing product development.
This LightCyler® 480 Instrument Quick Guide was created by the Roche Diagnostics Corporation Commercial Education department. Direct questions or concerns regarding the contents of this document to:Roche Diagnostics Corporation Commercial Education Department 9115 Hague RoadP.O. Box 50457Indianapolis, IN 46250-0457USA
5125-00-1113
LIGHTCYCLER is a trademark of Roche. The technology for LightCycler® is licensed from Idaho Technologies, Inc. All other trademarks are the property of their respective owners.©2013, Roche Diagnostics.
Distribution in USA by: Roche Diagnostics, Indianapolis, IN This LightCycler® 480 Instrument Quick Guide is printed in the US.
Additional copies of this document can be obtained by sending a message to: [email protected]

Page ii LightCycler® 480 Quick Guide5125-00-1113
Revision History
Revisions to this document are provided by Roche Diagnostics when necessary. No part of this document may be reproduced in any form or by any means without prior written consent.
Publication Reference Number Date Revision Purpose5125-00-1113 November 2013 New Document Creation

LightCycler® 480 Quick Guide Page 15125-00-1113
LightCycler® 480 Instrument Basics
General Required Materials
Standard Laboratory Equipment
Product Name
Microwell Plate Centrifuge
Nuclease-free, aerosol-resistant pipette tips
Microcentrifuge and 1.5 mL microcentrifuge tubes
Micropipettes (P10 or P20, P200, P1000 or equivalent)
Disposables
Product Name Catalog Number Description
LightCycler® 480 Multi-well Plate 96-well - White 04 729 692 001 50 plates and sealing foils
LightCycler® 480 Multi-well Plate 384-well - White 04 729 749 001 50 plates and sealing foils
LightCycler® 480 Multi-well Plate 96-well - Clear 05 102 413 001 50 plates and sealing foils
LightCycler® 480 Multi-well Plate 384-well - Clear 05 102 430 001 50 plates and sealing foils
LightCycler® 480 Sealing Foil 04 729 757 001 50 sealing foils
Reagents
Reaction Type Product Name Catalog Number Description
Reverse Transcription with RNAse H activity
Transcriptor 1st Strand cDNA Synthesis Kit
04 379 012 001 For 50 (20 µL) reactions
SYBR Green Master LightCycler® 480 SYBR Green I Master
04 707 516 001 5 mL (5 x 20 µL)2x concentrated Master Mix for 250 (20 µL) reactions
High Resolution Melting
LightCycler® 480 High Resolution Melting Master
04 909 631 001 5 mL (5 x 1 mL)2x concentrated 25 mL MgCl2 stock solution for 500 (20 µL) reactions
Hybridization Probes LightCycler® 480 Genotyping Master
04 707 524 001 1.5 mL5x concentrated Master Mix for 250 (20 µL) reactions
Hydrolysis Probes TaqMan® Probes or Universal Probe Library (UPL)
LightCycler® 480 Probes Master
04 707 494 001 5 mL (5 x 1 mL)2x concentrated Master Mix for 250 (20 µL) reactions
LightCycler® 480 Control Kit 04 710 924 001 Kit for quantitative Real-Time PCR and genotyping reactions

Page 2 LightCycler® 480 Quick Guide5125-00-1113
LightCycler® 480 Instrument Basics
This page intentionally left blank.
LightCycler® 480 Quick Guide Page 35125-00-1113
LightCycler® 480 Instrument Basics
Getting Started1. Log on to the LightCycler® computer.
Username: Operator
Password: LC480
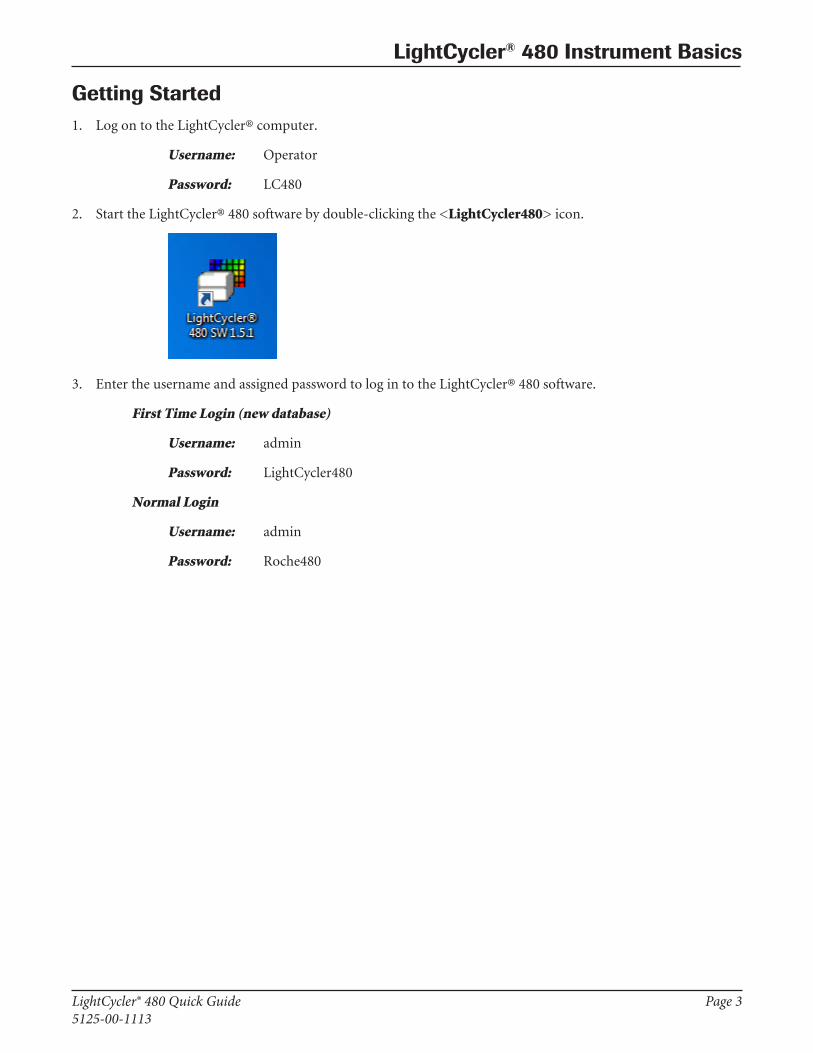
2. Start the LightCycler® 480 software by double-clicking the <LightCycler480> icon.
3. Enter the username and assigned password to log in to the LightCycler® 480 software.
First Time Login (new database)
Username: admin
Password: LightCycler480
Normal Login
Username: admin
Password: Roche480

Page 4 LightCycler® 480 Quick Guide5125-00-1113
LightCycler® 480 Instrument Basics
4. The overview screen displays. This screen allows entry of a new experiment with or without use of a template for the conditions, or run a previously programed macro.
LightCycler® 480 Quick Guide Page 55125-00-1113
LightCycler® 480 Instrument Basics
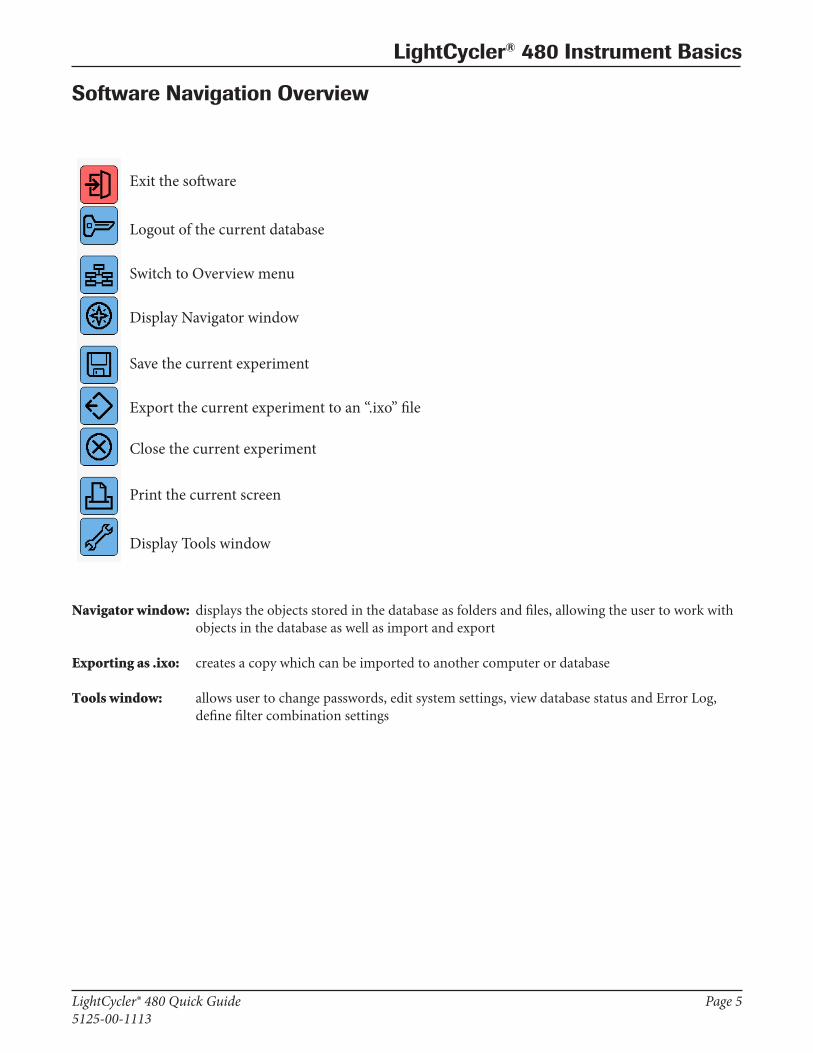
Software Navigation Overview
Exit the software
Logout of the current database
Switch to Overview menu
Display Navigator window
Save the current experiment
Export the current experiment to an “.ixo” file
Close the current experiment
Print the current screen
Display Tools window
Navigator window: displays the objects stored in the database as folders and files, allowing the user to work with objects in the database as well as import and export
Exporting as .ixo: creates a copy which can be imported to another computer or database
Tools window: allows user to change passwords, edit system settings, view database status and Error Log, define filter combination settings
Page 6 LightCycler® 480 Quick Guide5125-00-1113
LightCycler® 480 Instrument Basics
This page intentionally left blank.
LightCycler® 480 Quick Guide Page 75125-00-1113
New Experiment from Template
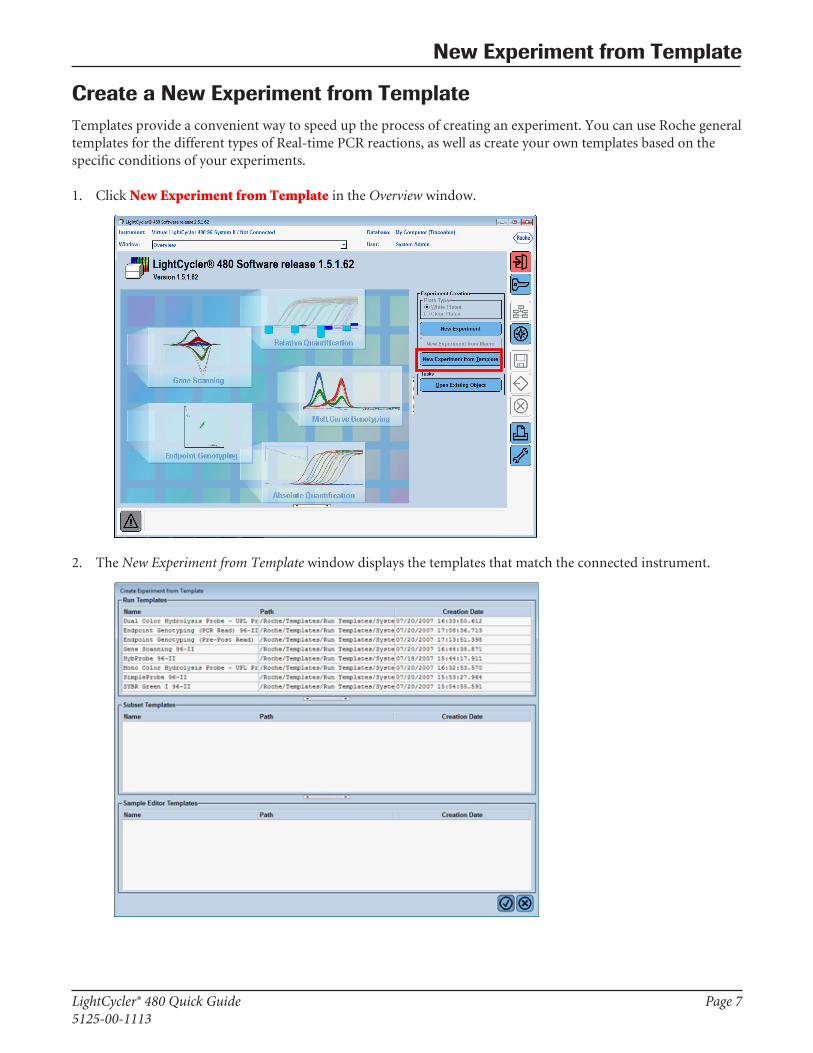
Create a New Experiment from TemplateTemplates provide a convenient way to speed up the process of creating an experiment. You can use Roche general templates for the different types of Real-time PCR reactions, as well as create your own templates based on the specific conditions of your experiments.
1. Click New Experiment from Template in the Overview window.
2. The New Experiment from Template window displays the templates that match the connected instrument.
Page 8 LightCycler® 480 Quick Guide5125-00-1113
New Experiment from Template
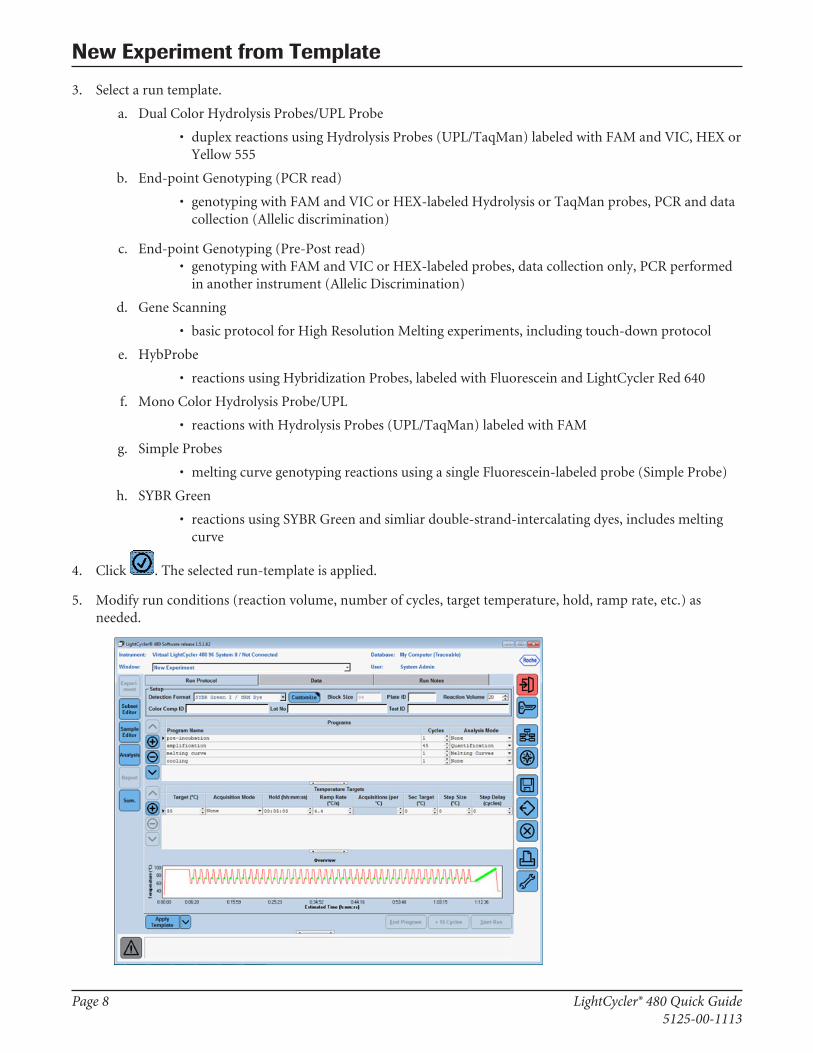
3. Select a run template.
a. Dual Color Hydrolysis Probes/UPL Probe
• duplex reactions using Hydrolysis Probes (UPL/TaqMan) labeled with FAM and VIC, HEX or Yellow 555
b. End-point Genotyping (PCR read)
• genotyping with FAM and VIC or HEX-labeled Hydrolysis or TaqMan probes, PCR and data collection (Allelic discrimination)
c. End-point Genotyping (Pre-Post read)• genotyping with FAM and VIC or HEX-labeled probes, data collection only, PCR performed
in another instrument (Allelic Discrimination)
d. Gene Scanning
• basic protocol for High Resolution Melting experiments, including touch-down protocol
e. HybProbe
• reactions using Hybridization Probes, labeled with Fluorescein and LightCycler Red 640
f. Mono Color Hydrolysis Probe/UPL
• reactions with Hydrolysis Probes (UPL/TaqMan) labeled with FAM
g. Simple Probes
• melting curve genotyping reactions using a single Fluorescein-labeled probe (Simple Probe)
h. SYBR Green
• reactions using SYBR Green and simliar double-strand-intercalating dyes, includes melting curve
4. Click . The selected run-template is applied.
5. Modify run conditions (reaction volume, number of cycles, target temperature, hold, ramp rate, etc.) as needed.

LightCycler® 480 Quick Guide Page 95125-00-1113
New Experiment from Template
6. The “Start Run” icon becomes active once the multi-well plate is loaded in the instrument.
7. Click Start Run.
8. Enter the experiment name in the dialog box.
Page 10 LightCycler® 480 Quick Guide5125-00-1113
New Experiment from Template
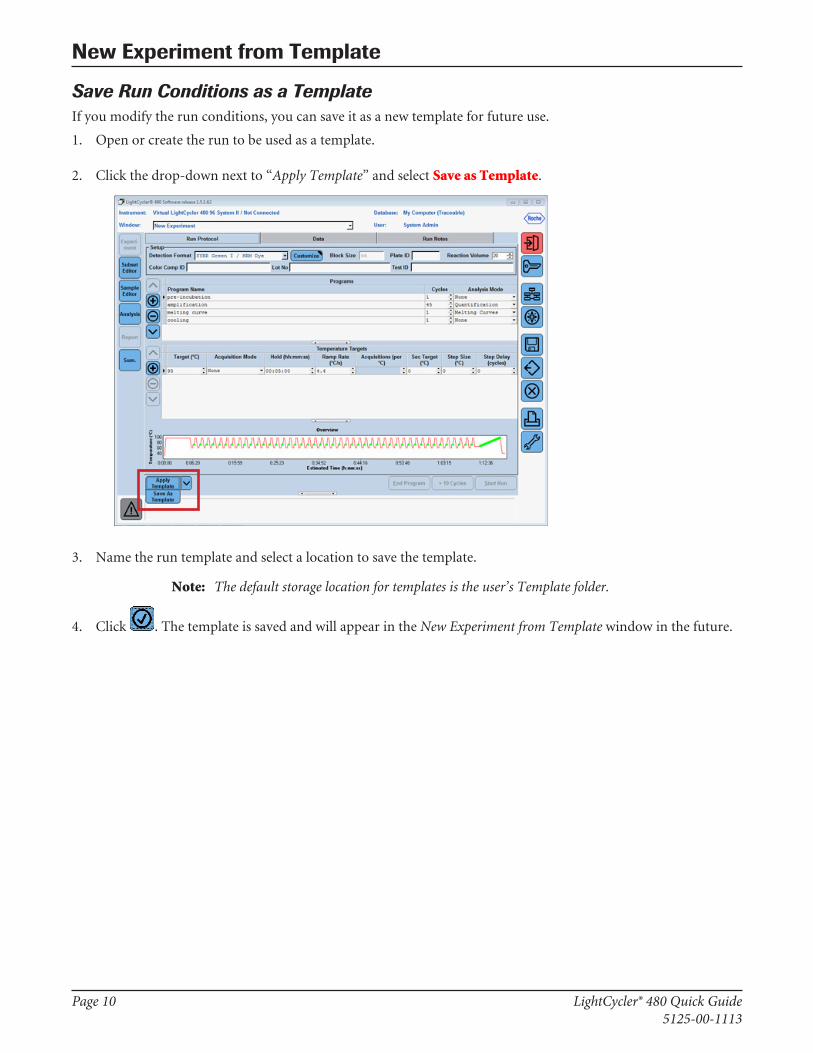
Save Run Conditions as a TemplateIf you modify the run conditions, you can save it as a new template for future use.
1. Open or create the run to be used as a template.
2. Click the drop-down next to “Apply Template” and select Save as Template.
3. Name the run template and select a location to save the template.
Note: The default storage location for templates is the user’s Template folder.
4. Click . The template is saved and will appear in the New Experiment from Template window in the future.

LightCycler® 480 Quick Guide Page 115125-00-1113
Basic Real-Time Chemistry Protocols
Typical SYBR Green Reaction Protocol
Reaction Setup
Reagent Final Concentration Volume (µL) / one reactionWater 1.0Primer - Forward (5 µM Stock) 0.5 µM 2.0Primer - Reverse (5 µM Stock) 0.5 µM 2.0LightCycler® 480 SYBR Green I Master
1x 10.0
Total 15.0Add 5 µL template DNA for a total volume of 20 µL
Run ProgramProgram Name Cycles Analysis Mode
Pre-incubation 1 None
Target (°C) Acquisition Mode Hold (hh:mm:ss)95 None 00:05:00
Program Name Cycles Analysis Mode
Amplification 45 Quantification
Target (°C) Acquisition Mode Hold (hh:mm:ss)95 None 00:00:1060 None 00:00:1072 Single 00:00:10
Program Name Cycles Analysis Mode
Melting Curve 1 Melting Curves
Target (°C) Acquisition Mode Hold (hh:mm:ss) Acquisitions (per °C) 95 None 00:00:0565 None 00:01:0097 Continuous 5
Program Name Cycles Analysis Mode
Cooling 1 None
Target (°C) Acquisition Mode Hold (hh:mm:ss)40 None 00:00:30
Page 12 LightCycler® 480 Quick Guide5125-00-1113
Basic Real-Time Chemistry Protocols
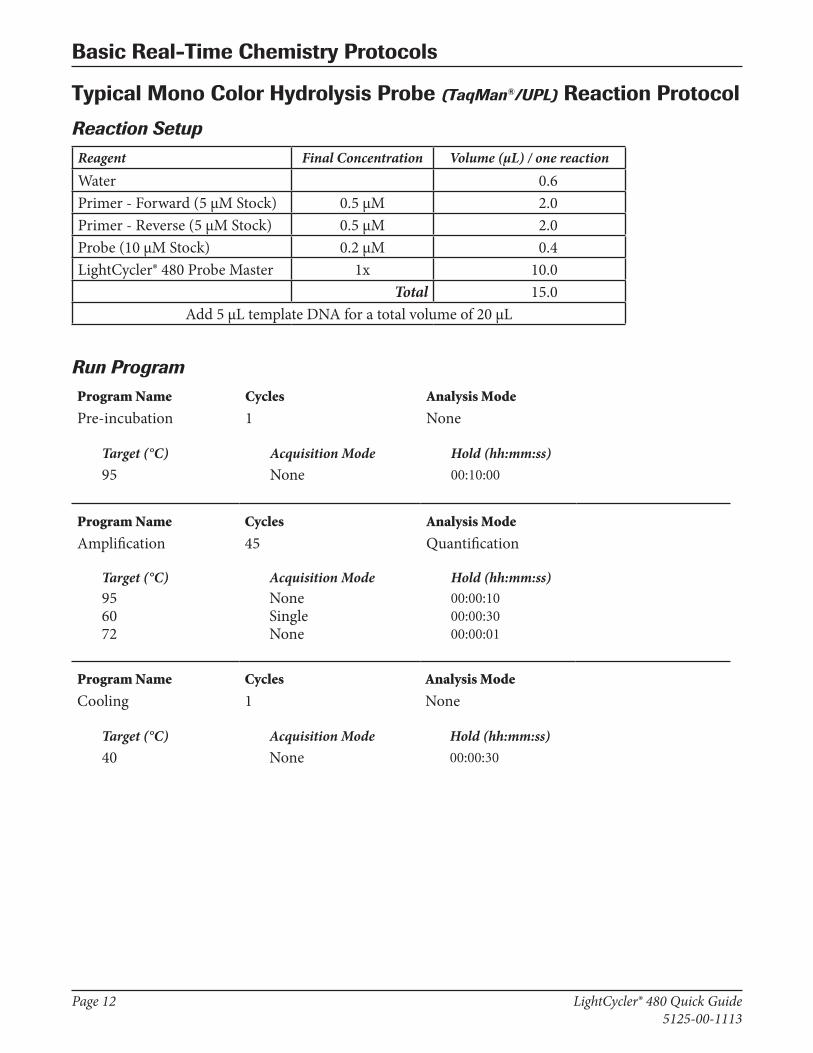
Typical Mono Color Hydrolysis Probe (TaqMan®/UPL) Reaction Protocol
Reaction Setup
Reagent Final Concentration Volume (µL) / one reactionWater 0.6Primer - Forward (5 µM Stock) 0.5 µM 2.0Primer - Reverse (5 µM Stock) 0.5 µM 2.0Probe (10 µM Stock) 0.2 µM 0.4LightCycler® 480 Probe Master 1x 10.0
Total 15.0Add 5 µL template DNA for a total volume of 20 µL
Run ProgramProgram Name Cycles Analysis Mode
Pre-incubation 1 None
Target (°C) Acquisition Mode Hold (hh:mm:ss)95 None 00:10:00
Program Name Cycles Analysis Mode
Amplification 45 Quantification
Target (°C) Acquisition Mode Hold (hh:mm:ss)95 None 00:00:1060 Single 00:00:3072 None 00:00:01
Program Name Cycles Analysis Mode
Cooling 1 None
Target (°C) Acquisition Mode Hold (hh:mm:ss)40 None 00:00:30

LightCycler® 480 Quick Guide Page 135125-00-1113
Basic Real-Time Chemistry Protocols
Typical Hybridization Probe (HybProbe) Reaction Protocol
Reaction Setup
Reagent Final Concentration Volume (µL) / one reactionWater 6.2Primer - Forward (5 µM Stock) 0.5 µM 2.0Primer - Reverse (5 µM Stock) 0.5 µM 2.0Fluorescein Probe (10 µM Stock) 0.2 µM 0.4Red Fluor Probe (10 µM Stock) 0.2 µM 0.4LightCycler® 480 Genotyping Master 1x 4.0
Total 15.0Add 5 µL template DNA for a total volume of 20 µL
Run ProgramProgram Name Cycles Analysis Mode
Pre-incubation 1 None
Target (°C) Acquisition Mode Hold (hh:mm:ss)95 None 00:10:00
Program Name Cycles Analysis Mode
Amplification 45 Quantification
Target (°C) Acquisition Mode Hold (hh:mm:ss)95 None 00:00:1060 Single 00:00:1072 None 00:00:10
Program Name Cycles Analysis Mode
Melting Curve 1 Melting Curves
Target (°C) Acquisition Mode Hold (hh:mm:ss) Acquisitions (per °C) 95 None 00:01:0040 None 00:02:0095 Continuous 5
Program Name Cycles Analysis Mode
Cooling 1 None
Target (°C) Acquisition Mode Hold (hh:mm:ss)40 None 00:00:30

Page 14 LightCycler® 480 Quick Guide5125-00-1113
Basic Real-Time Chemistry Protocols
This page intentionally left blank.
LightCycler® 480 Quick Guide Page 15125-00-1113
Absolute Quantification
Absolute Quantification AnalysisSample concentrations are calculated based on a standard curve created with standard samples along a concentration range with specific assigned values. The standard curve can be included within the run (internal standard curve) or generated in a previous run (external standard curve).
Important: To use an external standard curve imported from a previous run, the software needs a reference point included in the current run. One concentration standard must be on every run to align the standard curve into the new run. The software shifts the imported standard curve based on how the reference standard compares to the previously run concentration.
For more information, please consult Chapter D, Section 4.2.3 (pages 164-166) of the LightCycler® 480 Operator’s Manual.
Crossing point (Cp) values (Cp is equivalent to Ct) are used to determine unknown sample concentrations from a standard curve.
Performing an Absolute Quantification Analysis1. Open the experiment you want to analyze in the main window.
Note: Once the experimental run has completed, it remains open and ready to analyze. Previous experiments are located in the Experiments folder of the Navigator.
2. If sample information was entered during run setup, proceed to step 5. Otherwise, click Sample Editor on the left side of the active display.
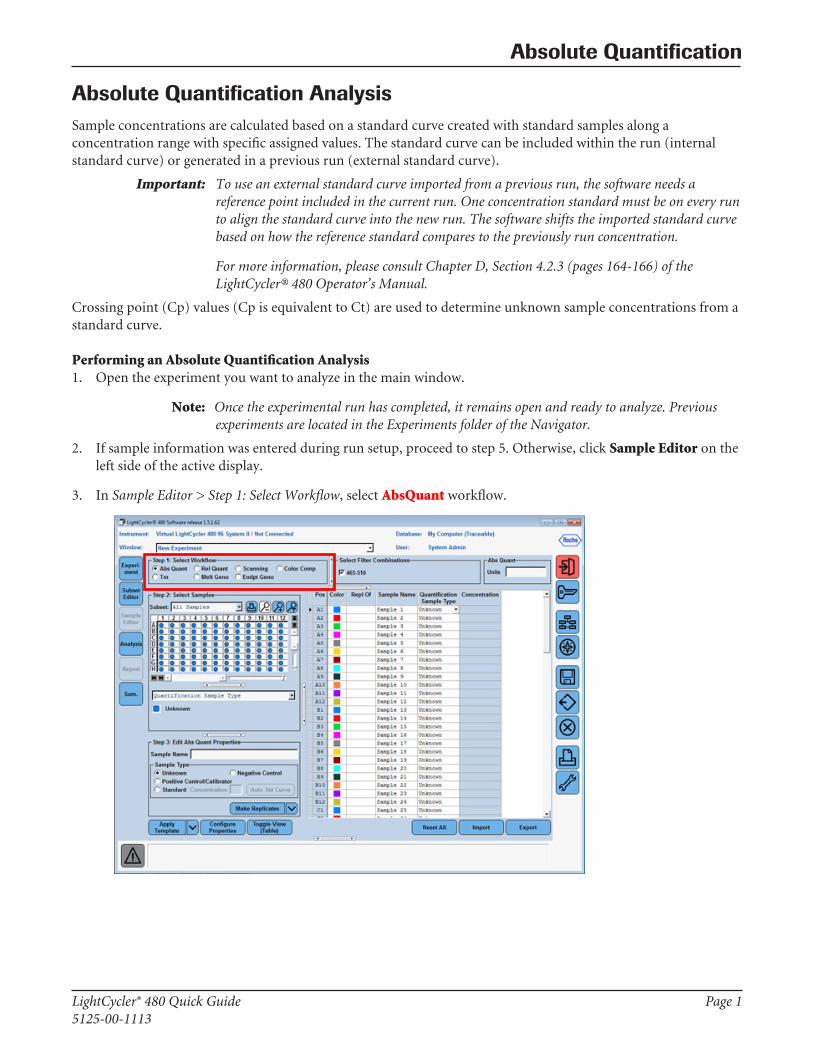
3. In Sample Editor > Step 1: Select Workflow, select AbsQuant workflow.

Page 2 LightCycler® 480 Quick Guide5125-00-1113
Absolute Quantification
4. Enter Sample information
a. In Sample Editor > Step 2: Select Samples, select wells.
b. In Sample Editor > Step 3: Edit Abs Quant Properties, enter the appropriate sample information for the selected wells. Identify samples as “Unknown” or “Standard” samples, entering the appropriate concentration for each standard.
c. For reactions in replicate, select all the wells and click “Make Replicates.”
5. Click Analysis.
LightCycler® 480 Quick Guide Page 35125-00-1113
Absolute Quantification
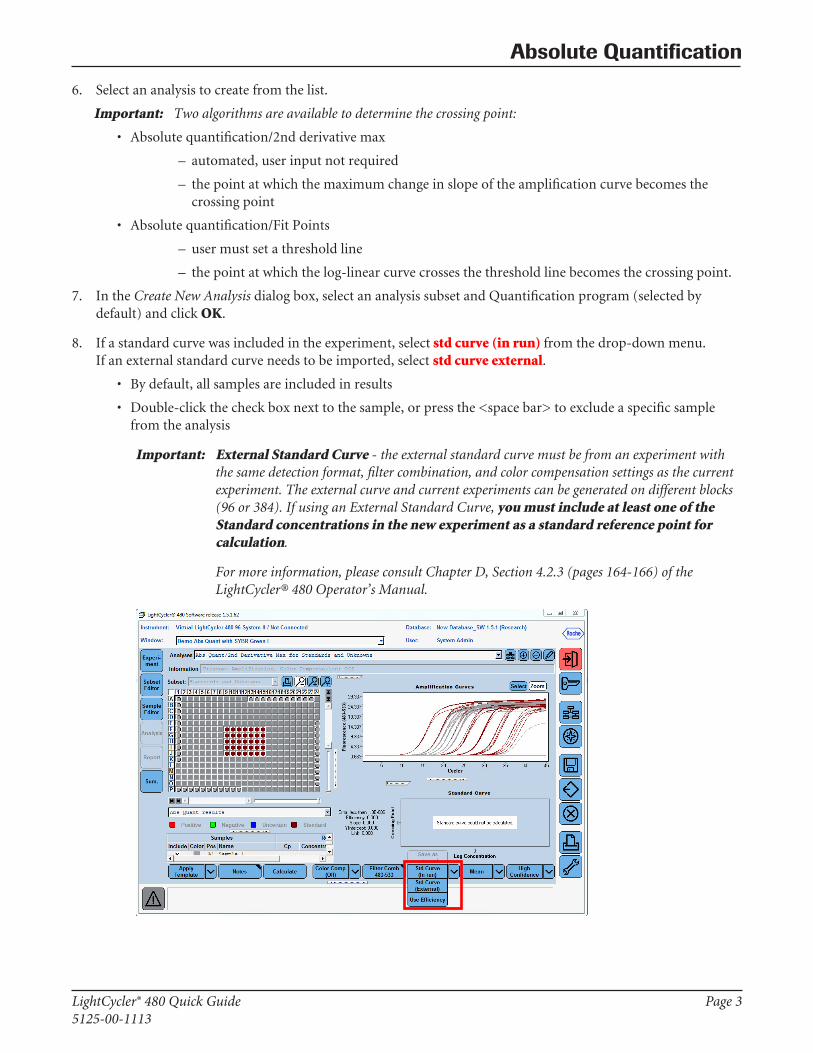
6. Select an analysis to create from the list.
Important: Two algorithms are available to determine the crossing point:
• Absolute quantification/2nd derivative max
– automated, user input not required
– the point at which the maximum change in slope of the amplification curve becomes the crossing point
• Absolute quantification/Fit Points
– user must set a threshold line
– the point at which the log-linear curve crosses the threshold line becomes the crossing point.
7. In the Create New Analysis dialog box, select an analysis subset and Quantification program (selected by default) and click OK.
8. If a standard curve was included in the experiment, select std curve (in run) from the drop-down menu. If an external standard curve needs to be imported, select std curve external.
• By default, all samples are included in results
• Double-click the check box next to the sample, or press the <space bar> to exclude a specific sample from the analysis
Important: External Standard Curve - the external standard curve must be from an experiment with the same detection format, filter combination, and color compensation settings as the current experiment. The external curve and current experiments can be generated on different blocks (96 or 384). If using an External Standard Curve, you must include at least one of the Standard concentrations in the new experiment as a standard reference point for calculation.
For more information, please consult Chapter D, Section 4.2.3 (pages 164-166) of the LightCycler® 480 Operator’s Manual.

Page 4 LightCycler® 480 Quick Guide5125-00-1113
Absolute Quantification
9. Click Calculate.
• To view the amplification curves for one or more samples, highlight the sample names in the sample list or click the corresponding well in the plate diagram.
10. To export individual data figures or tables, right-click within the information section you want to export, then choose the external format to use. Click the browse (...) button to browse to the location to save the file and assign a name to your export file. Click Export.
11. Export the entire experiment through the Navigator using the Export button. Map to the appropriate drive/folder for saving. The complete file experiment can be imported into another computer with the same release of LightCycler® 480 software.

LightCycler® 480 Quick Guide Page 15125-00-1113
Relative Quantification
Relative Quantification AnalysisRelative Quantification compares the levels of two different target sequences in a single sample (e.g., target gene of interest (GOI) and another gene) and expresses the final result as a ratio of these targets. For comparison purposes the second gene is a reference gene that is found in constant copy numbers under all test conditions. The reference is used for normalization of sample-to-sample differences.
The ratio of the same two sequences can be compared to a standard sample called a “calibrator.” The “calibrator” is typically a positive sample with a stable ratio of target-to-reference and is used to normalize all samples within one run, but in addition provides a constant calibration point between several LightCycler ® 480 System runs.
Important: For more information, please consult Chapter D, Section 4.3 (pages 179-205) of the LightCycler® 480 Operator’s Manual.
Performing a Relative Quantification Analysis1. Open the experiment for analysis in the main window.
Note: If the experiment just completed, the run will remain open and ready for analysis. Previously created and performed experiments are located in the <Experiments> folder of the Navigator.
2. If the sample information was entered during run setup, then proceed to step 5. Otherwise, click the Sample Editor icon.
Important: Relative Quantification Analysis uses the following identifiers for calculation, please note there are mandatory identifiers required:
Note: If you are performing an experiment using different filter combinations, make sure you select the appropriate filter combination for entering the sample information.
Page 2 LightCycler® 480 Quick Guide5125-00-1113
Relative Quantification
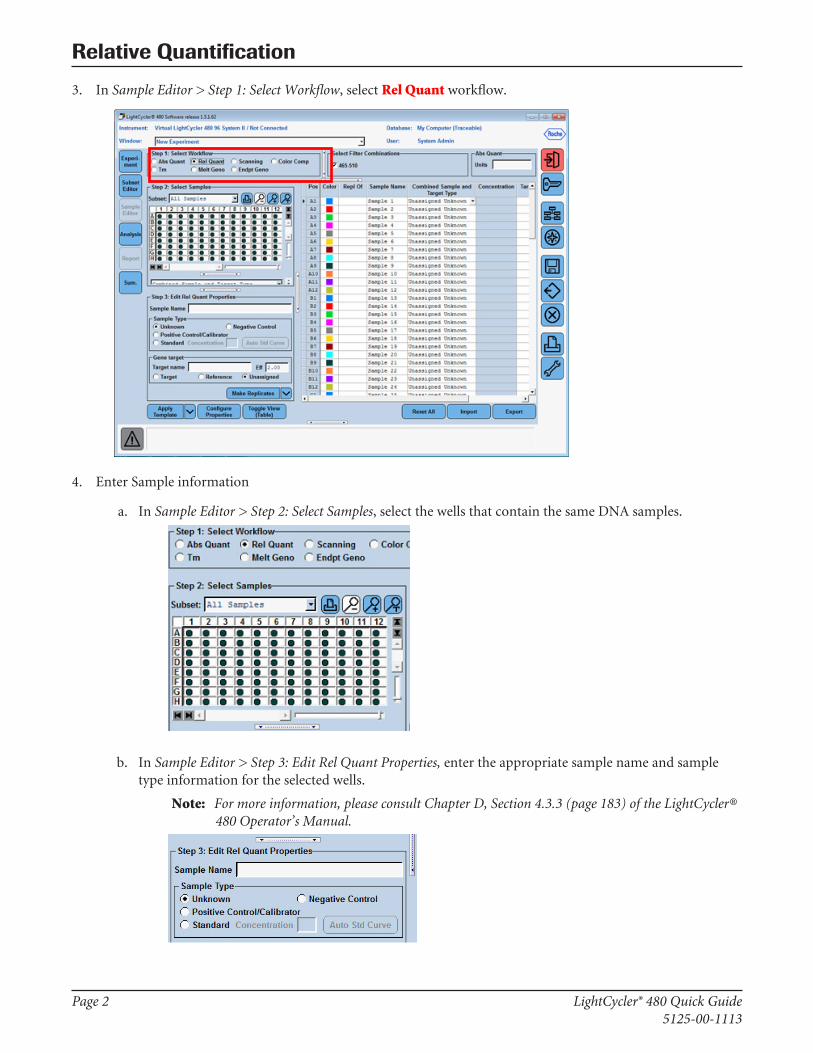
3. In Sample Editor > Step 1: Select Workflow, select Rel Quant workflow.
4. Enter Sample information
a. In Sample Editor > Step 2: Select Samples, select the wells that contain the same DNA samples.
b. In Sample Editor > Step 3: Edit Rel Quant Properties, enter the appropriate sample name and sample type information for the selected wells.
Note: For more information, please consult Chapter D, Section 4.3.3 (page 183) of the LightCycler® 480 Operator’s Manual.

LightCycler® 480 Quick Guide Page 35125-00-1113
Relative Quantification
5. Enter Gene target information.
a. In Sample Editor > Step 2: Select Samples, select the wells that contain the same gene target.
b. In Sample Editor > Step 3: Edit Rel Quant Properties, enter the appropriate target name and select target type (target or reference) information for the selected wells
Note: Target is the gene of interest and Reference is the housekeeping gene (e.g., actin)
6. In Sample Editor > Step 2: Select Samples, select all the wells and set replicates by clicking Auto Replicate.
Page 4 LightCycler® 480 Quick Guide5125-00-1113
Relative Quantification
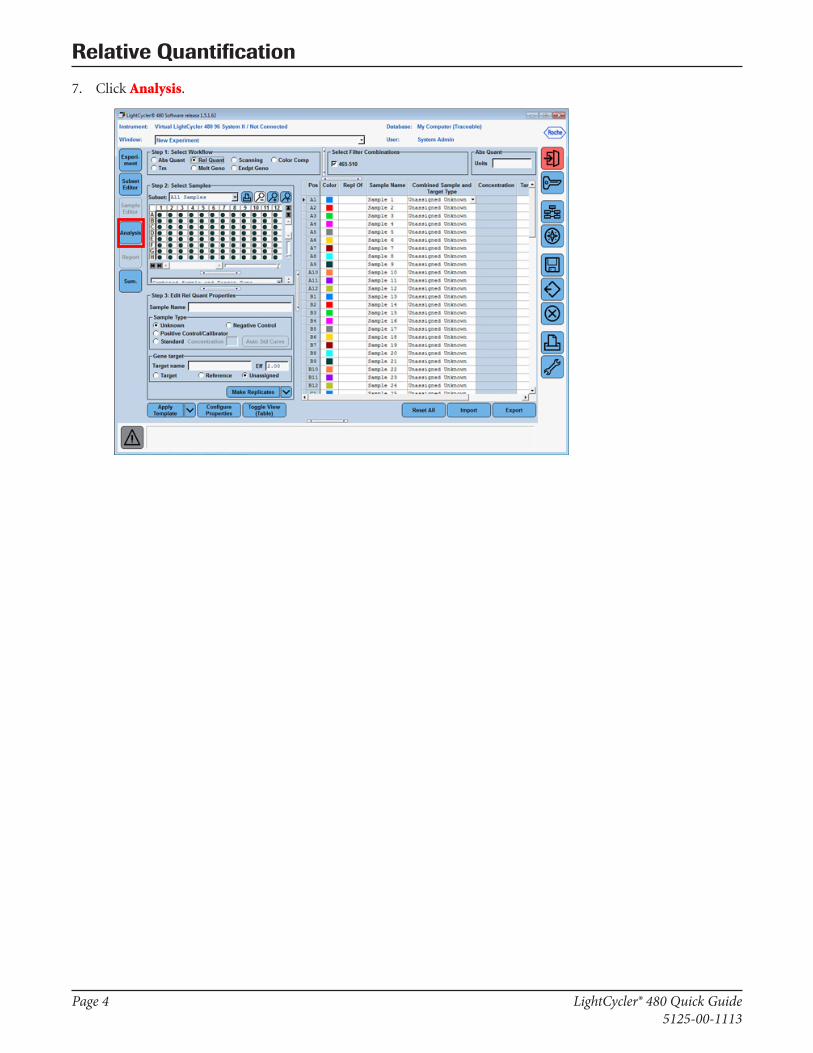
7. Click Analysis.
LightCycler® 480 Quick Guide Page 55125-00-1113
Relative Quantification
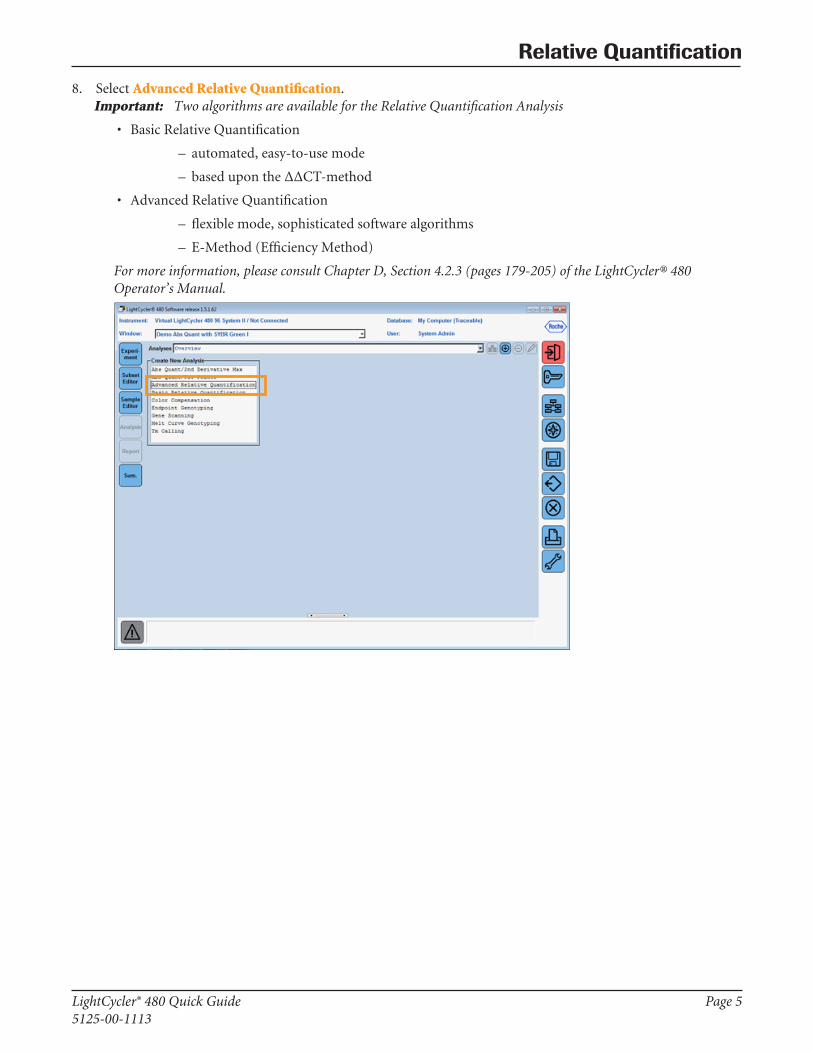
8. Select Advanced Relative Quantification.Important: Two algorithms are available for the Relative Quantification Analysis
• Basic Relative Quantification
– automated, easy-to-use mode
– based upon the ΔΔCT-method• Advanced Relative Quantification
– flexible mode, sophisticated software algorithms
– E-Method (Efficiency Method)
For more information, please consult Chapter D, Section 4.2.3 (pages 179-205) of the LightCycler® 480 Operator’s Manual.

Page 6 LightCycler® 480 Quick Guide5125-00-1113
Relative Quantification
9. Select all samples or subset to be analyzed and click .
10. Leave defaults and click .
Note: For more information about this dialog box, please consult Chapter D, Section 4.3.5 (pages 190-192) of the LightCycler® 480 Operator’s Manual.

LightCycler® 480 Quick Guide Page 75125-00-1113
Relative Quantification
11. The software automatically pairs the target to the corresponding reference.
a. To obtain results, click Calculate.
Note: If a calibrator sample was used, the normalized ratio is the fold difference between samples and calibrator, represented as a red bar in the bar chart.
If a calibrator sample was not used, then the Target/Ref Ratio column will provide results, comparing only target to reference amounts within a single sample, represented as a blue bar in the bar chart.
Note: For more information, please consult Chapter D, Section 4.3.7 (pages 198-199) of the LightCycler® 480 Operator’s Manual.
Page 8 LightCycler® 480 Quick Guide5125-00-1113
Relative Quantification
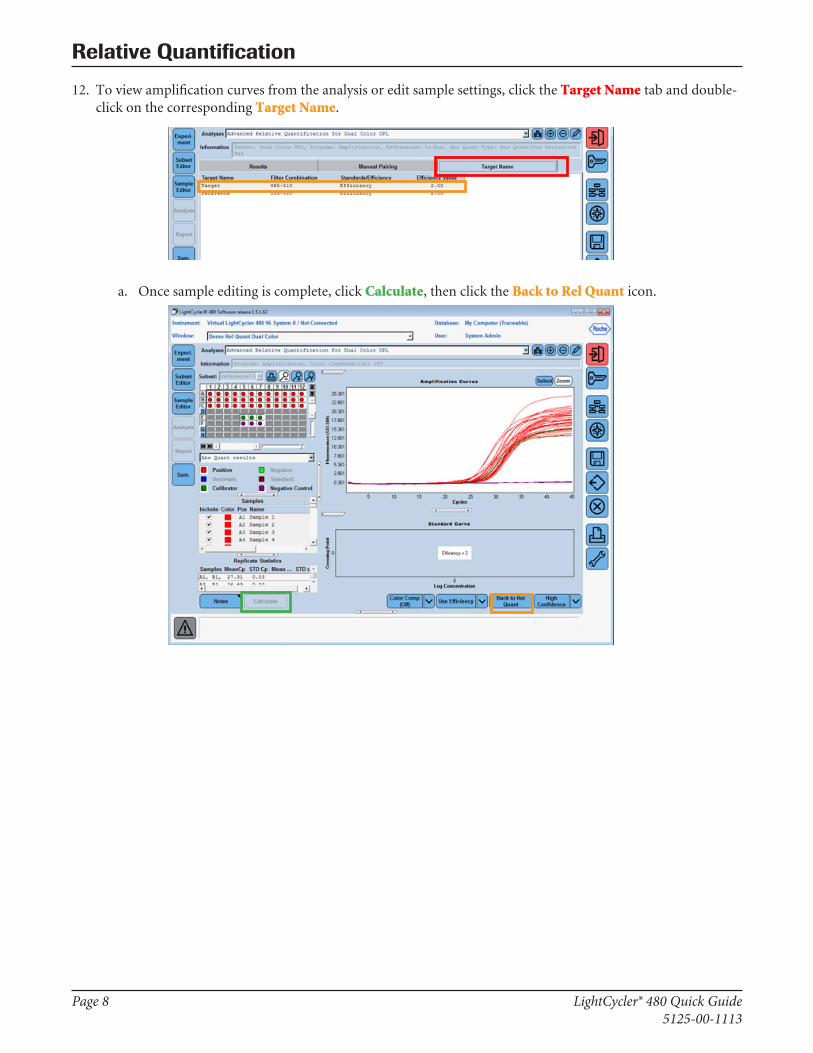
12. To view amplification curves from the analysis or edit sample settings, click the Target Name tab and double-click on the corresponding Target Name.
a. Once sample editing is complete, click Calculate, then click the Back to Rel Quant icon.
LightCycler® 480 Quick Guide Page 95125-00-1113
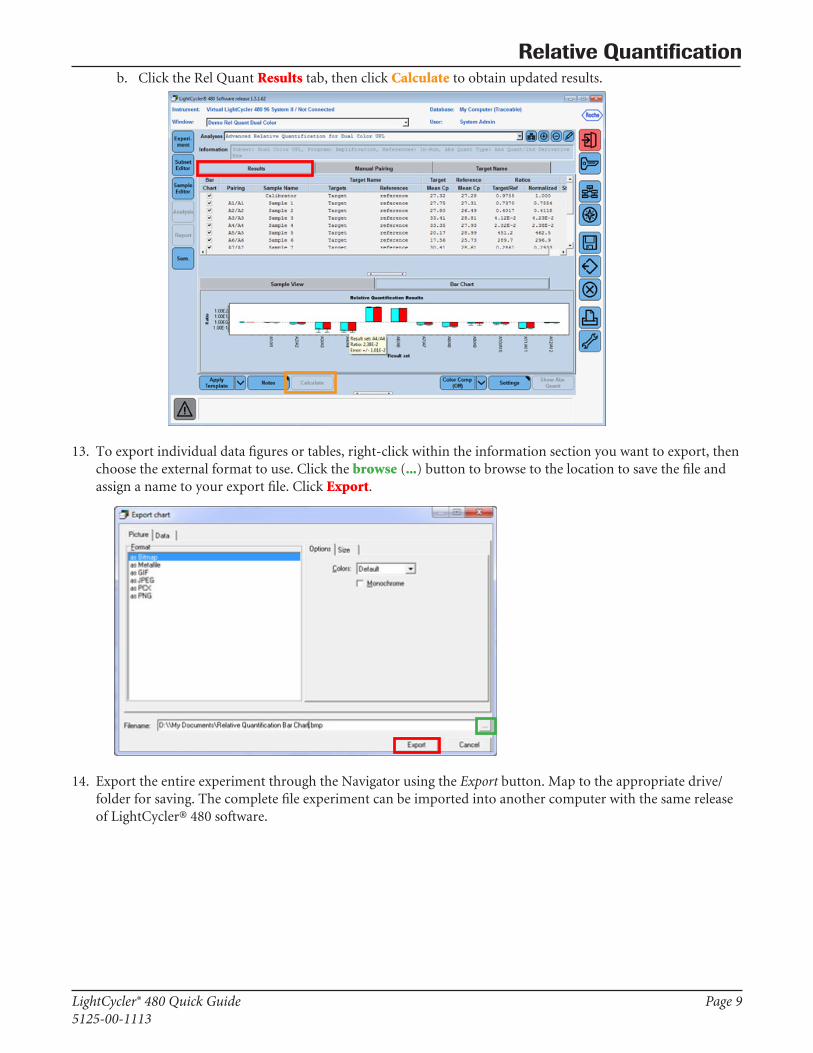
Relative Quantificationb. Click the Rel Quant Results tab, then click Calculate to obtain updated results.
13. To export individual data figures or tables, right-click within the information section you want to export, then choose the external format to use. Click the browse (...) button to browse to the location to save the file and assign a name to your export file. Click Export.
14. Export the entire experiment through the Navigator using the Export button. Map to the appropriate drive/folder for saving. The complete file experiment can be imported into another computer with the same release of LightCycler® 480 software.

LightCycler® 480 Quick Guide Page 15125-00-1113
Color Compensation
Color CompensationColor Compensation is used to subtract fluorescent bleed-through from a reporter into inappropriate channels outside its dominant channel. While unnecessary for singleplex (one color) applications, color compensation is critical for multiplexed assays to resolve overlapping signals.
0
500000
1000000
1500000
2000000
2500000
3000000
400 450 500 550 600 650 700 750 800
Wav e le ngth nm
Flu
ore
sce
nce
In
ten
sity
w.E
Cyan 500
Fluorescein
Hex
Red 610
Red 640
Cy5
494 nm 521 nm 555 nm 607 nm 640 nm 668 nm
488DF20
HTC II Emission Channels and Dye Spectra
Why color compensate data? The premise of color compensation is that samples containing more than one fluorescence segregated from other contributing fluorescent signals. This is necessary because fluorescent dyes do not simply emit fluorescence at a single wavelength; rather their fluorescence is emitted over a broad range of wavelengths. The cast majority of fluorescent dyes have emission spectra covering a range of 100-200 nm. Therefore, each emission produces at least some signal in each of the higher wavelength channels. The color compensation file makes it possible for the LightCycler® 480 instrument to exclusively “see,” in any one channel, the fluorescent signal from the dye designated for that channel.
Should I color compensate my Data?Color compensation is necessary only when running reactions that contain more than one signal-producing dye in a single well.

Page 2 LightCycler® 480 Quick Guide5125-00-1113
Color Compensation
How do I setup color compensation reactions for a two or more color fluorescent system?
• Dedicate a reaction to each dye and one for a blank (no dye). For example, in a two color system, three reactions are necessary.
• Use dye concentrations similar to those used in the actual PCR
– 0.05 - 0.2 µM for individual hydrolysis probes
– 0.1 - 0.3 µM for HybProbe acceptor probes
– 0.2 µM for donor (FLUOS-labeled) HybProbe probes
Note: The total concentration for FLUOS-labeled donor HybProbe probes in the mix should not exceed 1.2 µM. Prepare an equimolar mix of all donor HybProbe probes used in the assay.
– Check the quality of the dyes and probes used
Note: High amounts of free, unlabeled dye can cause a high background signal that might impact color compensation.
• The free dye can be chosen if using a self-quenched probe (e.g., TaqMan® or Molecular Beacon) but a positive reaction for the individual probe in the mix will also work
• DNA template must be added for the TaqMan® Probe Color Compensation (adjust water volume)
• It is recommended to run the reactions in replicates of five. Below is a typical reaction setup:

LightCycler® 480 Quick Guide Page 35125-00-1113
Color Compensation
Example Reaction Setup for Hydrolysis/TaqMan® probe-based Assay
Reaction Blank Dye 1 Dye 210 µL Master Mix 10 µL Master Mix 10 µL Master Mix10 µL Water 2.6 µL Water 2.6 µL Water
1 µL (10 µM stock) primer-forward target 1
1 µL (10 µM stock) primer-forward target 2
1 µL (10 µM stock) primer-reverse target 1
1 µL (10 µM stock) primer-reverse target 2
0.4 µL probe target 1 0.4 µL probe target 25 µL DNA template 5 µL DNA template
Example Reaction Setup for HybProbe-based Assay
Reaction Blank Dye 1 - Fluorescein Dye 2 Dye 3 10 µL Master Mix 10 µL Master Mix 10 µL Master Mix 10 µL Master Mix10 µL Water 8 µL Water 8 µL Water 8 µL Water
2 µL Probe or Free Dye 2 µL Probe or Free Dye 2 µL Probe or Free Dye
Page 4 LightCycler® 480 Quick Guide5125-00-1113
Color Compensation
How do I generate color compensation data?The temperature profile used in a color compensation protocol always includes heating, cycling, temperature, gradient, and cooling programs. The cycling program mimics a typical PCR, including data acquisition. Instead of running a separate color compensation experiment, you can also run the color compensation reactions in parallel to your experimental samples. In this case, apply the appropriate experimental PCR protocol but always add a temperature gradient or melting curves program with the color compensation analysis mode.
Note: For hydrolysis probe color compensation runs, you must perform a real PCR, as cleavage of the probe by the Taq® DNA polymerase during cycling is required to generate a fluorescent signal.
Procedure1. Open the LightCycler® 480 Basic Software version 1.5.1 and setup a run protocol as follows (adjust the
amplification conditions to mimic the PCR you normally perform). The example below may differ from your PCR run.
Program Name Cycles Analysis Mode
Pre-incubation 1 None
Target (°C) Acquisition Mode Hold (hh:mm:ss)95 None 00:05:00
Program Name Cycles Analysis Mode
Amplification 45 Quantification
Target (°C) Acquisition Mode Hold (hh:mm:ss)95 None 00:00:1060 Single 00:00:3072 None 00:00:01
Program Name Cycles Analysis Mode
Melting Curve 1 Color Compensation
Target (°C) Acquisition Mode Hold (hh:mm:ss) Acquisitions (per °C) 95 None 00:00:0040 None 00:00:3095 Continuous 1
Program Name Cycles Analysis Mode
Cooling 1 None
Target (°C) Acquisition Mode Hold (hh:mm:ss)40 None 00:00:30
2. Create a Subset including only the samples to create the color compensation.
3. In the Sample Editor, select the workflow Color Comp.
4. Select samples, identifying the color compensation subset to help navigate and enter sample information under the Color Comp Properties.

LightCycler® 480 Quick Guide Page 55125-00-1113
Color Compensation
5. In the Color Comp Properties, also enter sample information, indicating the appropriate dominant wavelength for each dye used in a particular well.
How do I analyze the data?Following the color compensation run, the LightCycler® 480 Basic Software version 1.5 saves the data generated as a normal experimental file.
Important: For these data to be used for color compensation, you must first convert the data of the temperature gradient or melting curves program into a CC Object and save it separately.
Procedure1. When the experiment is finished, click Analysis.
2. From the Create New Analysis list, select Color Compensation.
3. In the Create New Analysis dialog box, select an analysis subset and a program in the experiment (typically there is only one color compensation or melting program selected by default). Click OK.
4. Click Calculate in the Action button area to perform the analysis.
5. Click Save CC Object. By default, the CCC folder in your Special Data folder is selected as the location.
6. Apply the color compensation data to another analysis or experiment if desired.
How do I apply the color compensation?Procedure1. Select the filter combination to display and compensate (Filter Combination button) for the analysis.
2. Click the down arrow next to the Color Compensation button and choose between the options <In Use> or <In Database>.
3. Select the color compensation object to apply and click OK.
The experiment or the analysis charts are redrawn using the compensated data. Note that the Color Compensation button label indicates “On.”
Note: The CC Object may also be applied to the Experiment/Data page, allowing the color compensation to be selected in all further analyses created on the experiment file.


![MutaPLEX® Neisseria gonorrhoeae€¦ · Neisseria-gonorrhoeae-DNA in klinischen Proben mittels Real-time-PCR in offenen Real-time-PCR-Systemen (z.B. LightCycler 480 [Roche], RotorGene](https://static.documents.pub/doc/80x56/605fad29cc1bc16c705a5315/mutaplex-neisseria-neisseria-gonorrhoeae-dna-in-klinischen-proben-mittels-real-time-pcr.jpg)


