Page 1
PG&E’s Emerging Technologies Program ET12PGE2291
Lighting Demonstration Showcase Effectiveness
Study – Pacific Energy Center
ET Project Number: ET12PGE2291
Product Manager: David Lewbin Pacific Gas and Electric Company Prepared By: Kevin Wachowiak RDA Group 450 Enterprise Court Bloomfield Hills, MI 48302
Issued: November 30, 2012
Copyright, 2012, Pacific Gas and Electric Company. All rights reserved.
Page 2
i
PG&E’s Emerging Technologies Program ET12PGE2291
ACKNOWLEDGEMENTS
Pacific Gas and Electric Company’s Emerging Technologies Program is responsible for this project. It was developed as part of Pacific Gas and Electric Company’s Emerging Technology – demonstration showcase program under internal project number ET12PGE2291. Kevin Wachowiak conducted this technology evaluation for Pacific Gas and Electric Company with overall guidance and management from David Lewbin and Philip Broaddus. For more information on this project, contact David Lewbin at [email protected] , or Philip Broaddus at [email protected] .
LEGAL NOTICE
This report was prepared for Pacific Gas and Electric Company for use by its employees and agents. Neither Pacific Gas and Electric Company nor any of its employees and agents:
(1) makes any written or oral warranty, expressed or implied, including, but not limited to those concerning merchantability or fitness for a particular purpose;
(2) assumes any legal liability or responsibility for the accuracy, completeness, or usefulness of any information, apparatus, product, process, method, or policy contained herein; or
(3) represents that its use would not infringe any privately owned rights, including, but not limited to, patents, trademarks, or copyrights.
Page 3
ii
PG&E’s Emerging Technologies Program ET12PGE2291
ABBREVIATIONS AND ACRONYMS
PEC Pacific Energy Center
ETC Energy Training Center
PP Percentage Points
Page 4
iii
PG&E’s Emerging Technologies Program ET12PGE2291
CONTENTS
EXECUTIVE SUMMARY ____________________________________________________ 1
BACKGROUND __________________________________________________________ 2
PEC demonstration schedule ............................................... 2
RESULTS _______________________________________________________________ 3
RECOMMENDATIONS _____________________________________________________ 6
APPENDIX _____________________________________________________________ 7
Demonstration Script, or Narrative ...................................... 7
Page 5
1
PG&E’s Emerging Technologies Program ET12PGE2291
EXECUTIVE SUMMARY
PROJECT GOAL
The primary objective of the study is to measure the impact of the lighting installations and
demonstrations to increase the participants’ knowledge of and likely adoption of the new
and innovative lighting technologies designed to improve energy efficiency.
Specifically, objectives include:
Measure pre- and post-levels of knowledge regarding the lighting products
demonstrated,
Determine the likelihood to purchase, recommend, install, or specify the lighting
products demonstrated, and
Measure ratings of the lighting products demonstrated in regard to key
characteristics. Some of these characteristics include: cost, energy savings, quality,
controllability, ease of retrofit/installation, durability, and reduced maintenance.
PROJECT DESCRIPTION
To meet the study objectives, a hard-copy survey was used to collect feedback from class
participants at the Pacific Energy Center. In total, 116 surveys were completed among the
participants.
PROJECT FINDINGS/RESULTS
The analysis of the surveys indicate that the lighting demonstrations successfully improve
participant familiarity with the advanced lighting products. Further, the demonstrations
successfully influence the participants to act on the products demonstrated (i.e.
recommend, specify, purchase, install, and seek additional training).
When asked for suggestions for improving the demonstrations, participants most frequently
mention offering more or continuing the classes with a larger selection of days and times,
provide more specific, detailed interactive demonstrations, and improve the
organization/timeliness of demonstrations.
PROJECT RECOMMENDATIONS
The lighting demonstrations should not only be continued but should also be considered for
expansion through classes at other locations, additional lighting products demonstrated, and
invitations to more professionals with the empowerment to purchase, specify and install the
products.
Page 6
2
PG&E’s Emerging Technologies Program ET12PGE2291
BACKGROUND During the summer of 2012, the Emerging Technologies program at PG&E collaborated with
PG&E’s training center in San Francisco, the Pacific Energy Center (PEC), to update existing
lighting installations– replacing what are now generally considered to be standard fixtures in
terms of technology and energy efficiency, with newer, more advanced lighting and control
technologies. The lighting classes offered at the PEC are directed at internal and external
parties, including customers, contractors, designers, architects, installers, low income
segment outreach specialists, and other trade allies. The wide array of fixtures installed in
the main lighting classroom will enable a lighting class instructor to demonstrate and
compare multiple types of light fixtures and technologies and discuss the advantages and
disadvantages of each.
As a rule, class participants at the PEC generally include more lighting designers and
architects. Accordingly, at the PEC, in addition to being able to compare a wide range of
pendant, troffer, and downlight lighting, the fixtures are networked and controllable by
wireless, digital controls, which are of greater interest to the designer and architect
communities. The combination of advanced controls and fixtures allows for dynamic
lighting, which is the manipulation of color temperature and light intensity which can be
used to imitate the rhythms of natural light that in turn enhance mood and sense of well-
being.
This report analyzes the surveys gathered after demonstrations to four different classes held
at the PEC in September through October 2012.
PEC DEMONSTRATION SCHEDULE
Below is the schedule of classes at the PEC during the course of which the class
participants observed a demonstration of the newly installed advanced lighting and
subsequently completed a survey, the analysis of which is the subject of this report.
PACIFIC ENERGY CENTER (PEC) SAN FRANCISCO, CA
CLASS DATE EVENT # SURVEYS # TOTAL PARTICIPANTS
9/21/2012 LED vs. Everything Else 46 47
9/28/2012 Hands On Lighting 33 33
10/04/2012 Interplay of Daylight and Electrical Lighting
24 58
10/18/2012 Lighting Fundamentals 13 Not Available
Total 116 Not Available
Page 7
3
PG&E’s Emerging Technologies Program ET12PGE2291
RESULTS Of those attending a demonstration at the PEC, familiarity (8-10 on a 10-pt. scale) with the
lighting products improves dramatically (up 48PP to 68%), while only 2% report being
unfamiliar (1-3 on a 10-pt. scale) at the conclusion of the demonstration.
Note: Proportions may not add to 100%, due to rounding.
Nearly all (93%) PEC demonstration participants are likely (Very/Somewhat) to recommend
a lighting product to a colleague, while a vast majority are likely to specify a lighting
product in designs (84%) or purchase a lighting product (83%). Roughly three-fourths
(74%) are likely to install a lighting product.
6%
0%
14%
18%
16% 16%
14%
8%
6%
3%
10 9 8 7 6 5 4 3 2 1
PEC – Familiarity w/ Products Before
Demo
Familiar Not at all
Familiar (n=116)
20%
17%
(Mean=5.62)
10%
25%
33%
11% 9% 8%
3% 2% 0% 0%
10 9 8 7 6 5 4 3 2 1
PEC – Familiarity w/ Products After
Demo
Familiar Not at all
Familiar (n=116)
68%
2%
(Mean=7.75)
45%
40%
50%
46%
48%
44%
33%
28%
0% 20% 40% 60% 80% 100%
Recommend to Colleague
Specify in Designs
Purchase
Install
PEC Lighitng Products – Likelihood to...
Somewhat Very
93%
84%
83%
74%
(n=113)
(n=105)
(n=105)
(n=109)
Page 8
4
PG&E’s Emerging Technologies Program ET12PGE2291
In regard to dynamic lighting (where a combination of light, color and intensity can be
adjusted to imitate natural day light changes, or be controlled to achive a desired mood or
atmosphere), more than nine of ten (91%) PEC participants are likely to recommend
dynamic lighting solutions to a colleague, while a substantial majority are likely to seek
additional training (86%), specify in designs (85%), or purchase (83%). Roughtly three-
fourths (76%) are likely to install.
Offering more or continueing the classes with a larger selection of days and times is the
most frequently mentioned suggestion among PEC participants (19%). Other suggestions
include: more specific, detailed, interactive demonstrations (15%) and simplify, improve
organization or timeliness of demonstrations (15%).
PEC – Suggestions Proportion
Offer More/Continue Classes/Larger Selection of Days/Times 19%
More Specific/Detailed/Interactive Demonstrations 15%
Simplify/Improve Organization/Timeliness of Demonstrations 15%
Improve Quality/Effectiveness/Knowledge of Presenter 12%
Nothing/Satisfied 38%
Sample Size 26*
*Low sample size; results should be reviewed with caution.
Verbatim Comments:
“Ever considered offering training courses to people taking their architectural
licensing exams? This would be a great resource!”
“More specific on what fixtures yield what lighting effects that were observed (i.e.
translate the subjective effects into design guidelines).”
“Know your technology a little better to make class run smoother and on time. Seemed
very disorganized.”
46%
38%
47%
54%
50%
45%
48%
38%
29%
26%
0% 20% 40% 60% 80% 100%
Recommend to Colleague
Seek Additional Training
Specify
Purchase
Install
PEC – Dynamic Lighting – Likelihood to...
Somewhat Very
91%
86%
85%
83%
76%
(n=110)
(n=109)
(n=105)
(n=105)
(n=105)
Page 9
5
PG&E’s Emerging Technologies Program ET12PGE2291
Participants at the PEC demonstrations mostly comprised of architechs, designers,
participants with an interest in energy efficiency lighting products, and students or interns.
5%
6%
6%
6%
14%
15%
16%
17%
Mgt./Supervision
Contractor
Auditor
Consultant
Student/Intern
Interested Participant
Designer
Architech
PEC – Occupation of Participants
(n=103)
Page 10
6
PG&E’s Emerging Technologies Program ET12PGE2291
RECOMMENDATIONS Continue conducting lighting demonstrations, and consider expanding the demonstrations
by offering classes at additional training locations with a larger selection of days and times.
Further, consider demonstrating other emerging technogies.
Through advertisements in trade publications and direct communications, strive to increase
class attendance among professionals with the empowerment to purchase, specify and
install the products. Such communications should focus on the energy savings from using
the products, as well as the products’ light quality and longevitiy.
Continually verify class instructors are well prepared and knowledgeable about the products
demonstrated.
Page 11
7
PG&E’s Emerging Technologies Program ET12PGE2291
APPENDIX
DEMONSTRATION SCRIPT, OR NARRATIVE
The script, or narrative, below, was written by Milena Simeonova, RA, IES, LC,
Lighting Program Coordinator at the PEC. Milena designed the layout of the lighting
for the Lighting classroom at the PEC and performed the demonstrations. Milena did
not intend the ‘narrative’ to be read verbatim during a demonstration, rather to
serve as a guide for demonstrating the various types of lighting applications and
wireless controls in the room.
PEC Lighting Retrofit Demo and Evaluation – Narrative
A. Intro to Space
We are in the PEC Lighting Classroom and you can see that there is a variety of lighting products. Our goal
is to provide you with awareness of the different lighting fixtures and technologies, and we will touch a
little bit on controls.
First, let us orient in the classroom space. We have a Front wall with Lighting Fundamentals class learning
tools. On one side we have the color booths, and on the other we have a focal niche and lamps technology
trilons display. And then we have the central ceiling with many lighting fixtures.
Fig.1: PEC Lighting Classroom space
B. Intro to Fixtures We have various lighting products/fixtures that can be used in commercial and residential buildings for
retrofits and/or new construction. We group fixtures in Types. You can see in the classroom main ceiling
the following types: 2x2 lensed fixtures, 2x2 parabolic fixtures, linear pendants, downlights, and some
track lighting.
C. Intro to Controls and Graphic Displays
We have lighting controls that enable us to turn on and off the different types of fixtures.
As we turn on lighting products, you will see on the screen displayed information pertaining to these
particular type of fixtures. Sometimes the information is about the optics of the fixtures and their efficacy,
in other words, how much light is produced. This information also contains general light levels and energy
used (watts) per sf.
Page 12
8
PG&E’s Emerging Technologies Program ET12PGE2291
Fig 2: Graphic displays information
Other lighting fixtures provide a report on their real time usage of energy that is called energy dashboard.
In this case, the fixtures that are controlled with wireless controls have energy dashboard, which by the way
will also indicate what fixture is malfunctioning and
what is the cause (bad driver in this case, marked with a red cross).
Fig 3: Energy dashboard with real time energy use indicating the actual watts
per each fixture type. The red X indicates a fixture that is malfunctioning.
D. Lighting Technologies Comparison For each type of fixture, the 2x2 lensed, 2x2 parabolic, linear pendants, and down-lights, we have
examples of different lighting technologies. We are now going to compare within each type of fixtures, the
performance of each technology in terms of energy
use and lighting quality.
a) 2x2 Parabolic fixtures (open louver with exposed lamp)
For instance, the 2x2 parabolics, we can compare between (2) Biax 40W FL lamps or (2)-(3) 2’ 17W FL
lamps or (3) 2’ 17W FL lamps. In most instances, when we audit existing buildings to implement Energy
Page 13
9
PG&E’s Emerging Technologies Program ET12PGE2291
Efficiency Measures, we will encounter the Biax FL parabolic fixtures, that each uses the total of about
80W. And most often we will retrofit
these fixtures with 2’ straight FL lamps, decreasing the energy use by 30%-60%.
Fig 4: Retrofit kits for 2x2 parabolic fixtures provide up to 60% energy savings.
Parabolic fixtures are controlled with Adura wireless and DMX controls.
In addition, the retrofit fixtures provide better air ventilation, lamps breath better and have longer lamp life.
Light levels from the retrofit fixtures are also adequate for wo
b) 2x2 Lensed fixtures Now let’s compare FL to LED technology with the 2x2 lens fixtures. On the side of the color booths (South
ceiling) we have 6 FL lens fixtures, and on the side of the focal niche and trilons (North ceiling) we have 6
LED lens fixtures. These fixtures are identical as looks, and the LEDs are soft to the eye from behind the
lens. The energy use of both the FL and LED lens fixtures are similar and at about 36W each fixture.
However, when we look at how much light is on the walls or the desk surfaces, and when we measure light
levels, we notice that the LED fixtures provide 30% more light. This means that we can dim down the LED
fixtures and save about 30%, while providing adequate levels of light.
Page 14
10
PG&E’s Emerging Technologies Program ET12PGE2291
Fig 5: LED lens fixtures (to the right) provide 30% more light for the same energy use
Note: Audience will have Illuminance meters and will measure light levels and compare light levels under
LED lens (north side) and under FL lens (south side) fixtures.
Note: Volunteers at the dashboard reading aloud the watts/per fixture.
c) 8’ Linear Pendants
We also can compare linear pendants LED and FL technology, how they perform as light delivery, and how
much energy each pendant uses. We also can observe the difference in light distribution. The LEDs are one
directional ( for heat dissipation), while FL fixtures can have both downlight and upward light. You can
observe this on the ceiling, that is lighted above the FL and darker above the LED pendants.
Fig 6: What we find is that LED pendants use half of the energy used for FL pendants,
while delivering more focused light on the desk surface.
Note: Volunteers at the dashboard reading aloud the watts/per fixture.
d) 6” Downlights
We have Halogen, CFL, and LED downlights. We can compare 50W Halogen with only 12W LED
downlights, and we see how much more light we have. We have many different LED fixtures, from screw-
in LED PAR lamp to modules that can be relamped
in less than 1 minute.
E. Dimming Capabilities Time to compare dimming capabilities of LED and FL fixtures, and how efficient is dimming, do we have
a linear or non-linear function, between dimming and power used.
You can observe from the energy dashboard displaying the real time energy use, that when FL fixtures are
dimmed down to 30%, the use of power is decreased by about 50%.
If it was a linear function for the FL fixtures between dimming and power use, the power decrease should
have been 70%.
Page 15
11
PG&E’s Emerging Technologies Program ET12PGE2291
Now let’s see how LED fixtures behave under dimming. We find out that LED fixtures are almost a linear
function, and when dimming them down to 30% we save almost 70% in power use. So it is more efficient
to dim LEDs and there is some truth to the saying that dimming Fluorescent lamps is not that efficient.
Note: We will have volunteers from the audience to come to the energy dashboard and call out the Watts
changes as we dim fixtures. Audience to remember initial watts and dimmed fixtures watts and do the math
at the end.
Fig 7: Comparison of power use between 100% on and 30% dimmed down pendants.
F. Demand Response and Daylight Harvesting We have simulation of Demand Response and Daylight Harvesting scenes.
a) Demand Response
Demand Response is when the Utilities place a call asking to shade power loads during peak hours.
Demand Response is usually through dimming down the lights. In this case we have dimming of the linear
pendants down to 30%.
Fig 8: Demand Response scene with linear pendants dimmed uniformly down to 30%.
b) Daylight Harvesting
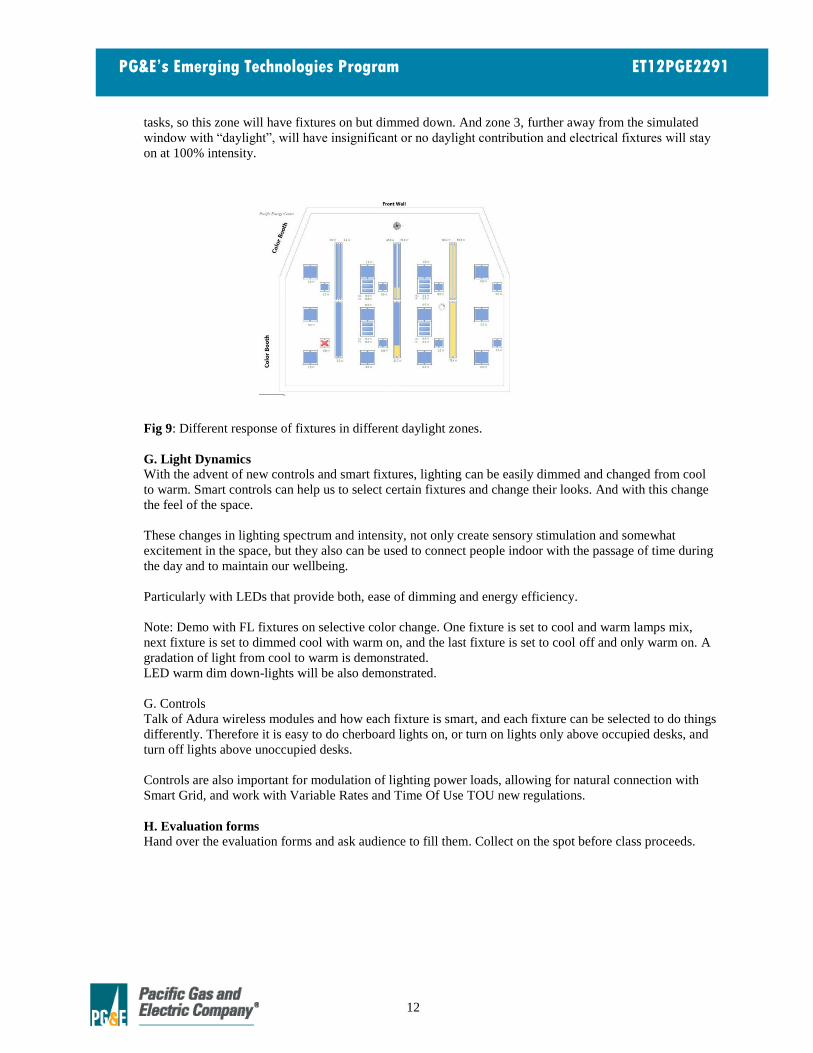
Daylight Harvesting in this case is demonstrated with 3 daylight zones. In Zone 1, near the color booths
that simulate daylight, fixtures will extinguish or turn completely off. There is plenty of “daylight” in this
zone and so we can save energy by turning the electrical fixtures off. Zone 2 has some “daylight” but
insufficient to perform work
Page 16
12
PG&E’s Emerging Technologies Program ET12PGE2291
tasks, so this zone will have fixtures on but dimmed down. And zone 3, further away from the simulated
window with “daylight”, will have insignificant or no daylight contribution and electrical fixtures will stay
on at 100% intensity.
Fig 9: Different response of fixtures in different daylight zones.
G. Light Dynamics With the advent of new controls and smart fixtures, lighting can be easily dimmed and changed from cool
to warm. Smart controls can help us to select certain fixtures and change their looks. And with this change
the feel of the space.
These changes in lighting spectrum and intensity, not only create sensory stimulation and somewhat
excitement in the space, but they also can be used to connect people indoor with the passage of time during
the day and to maintain our wellbeing.
Particularly with LEDs that provide both, ease of dimming and energy efficiency.
Note: Demo with FL fixtures on selective color change. One fixture is set to cool and warm lamps mix,
next fixture is set to dimmed cool with warm on, and the last fixture is set to cool off and only warm on. A
gradation of light from cool to warm is demonstrated.
LED warm dim down-lights will be also demonstrated.
G. Controls
Talk of Adura wireless modules and how each fixture is smart, and each fixture can be selected to do things
differently. Therefore it is easy to do cherboard lights on, or turn on lights only above occupied desks, and
turn off lights above unoccupied desks.
Controls are also important for modulation of lighting power loads, allowing for natural connection with
Smart Grid, and work with Variable Rates and Time Of Use TOU new regulations.
H. Evaluation forms Hand over the evaluation forms and ask audience to fill them. Collect on the spot before class proceeds.


![[Showcase];[US navy social media recruiment showcase]](https://static.documents.pub/doc/80x56/55a19fe11a28ab3e5c8b477b/showcaseus-navy-social-media-recruiment-showcase.jpg)


