energies Article Harmonics and Reduction of Energy Consumption in Lighting Systems by Using LED Lamps Natthanon Phannil, Chaiyan Jettanasen and Atthapol Ngaopitakkul * Faculty of Engineering, King Mongkut’s Institute of Technology Ladkrabang, Bangkok 10520, Thailand; [email protected] (N.P.); [email protected] (C.J.) * Correspondence: [email protected]; Tel.: +66-(0)2-329-8330 Received: 1 October 2018; Accepted: 12 November 2018; Published: 15 November 2018 Abstract: This paper proposes the study and analysis of harmonics, energy consumption and power quality of light emitting diode (LED) lamps equipped in building lighting systems. LED lamps with external (LED MR16) and internal (LED light bulb) drivers are investigated using an experimental setup to compare the results. The power quality of both LED lamps is studied by using a power quality meter to measure the generated harmonic currents from various case studies. The case study is divided into four major cases: one LED lamp is turned on with one driver, two LED lamps are turned on using the two drivers, eight LED lamps are turned on with one driver, and eight LED lamps are turned on with the eight drivers. As harmonics are related to total power factor (PF), which affects the energy savings of the building, hence, a filtering circuit to reduce harmonic current has been designed and implemented to improve power quality and/or power factor of the system. The different cases of harmonic filter insertion at the input of an LED lamp’s driver are discussed and then compared with a lighting standard to show the effectiveness of the passive filtering technique used in the studied system. In addition, the obtained result can be applied to both newly built and retrofitted buildings that aim to use LED technology to increase energy efficiency and decrease energy costs, and could be a helpful guide for end-users and manufacturers in addressing and developing LED issues. Keywords: energy consumption; harmonic; light emitting diode; lighting system; power quality 1. Introduction The world is facing significant energy challenges due to the rapid increase in energy demand stemming from the constantly growing world economy and population. With the rapid increase in energy consumption rates, limited fossil fuel resources and associated environmental issue, many countries are pushing energy policies with the objective of supporting renewable energy and increasing energy efficiency in every sector, in particular in urban buildings [1,2]. According to data from Energy Policy & Planning Office (EPPO) of the Ministry of Energy [3], Thailand’s total energy consumption in 2014 has been steadily increasing at a rate of 2.6% over the previous year. Considering the share of electricity consumption by sector in Thailand, based on historical energy data and statistical review [3–5], the growth of energy consumption in the business and residential sectors considerably surpassed economic growth. With this energy trend, the near future power generation capacity may not be able to keep up with electricity demand. It is worldwide accepted that energy conservation and energy efficiency improvement are essential issues to address the aforementioned challenges. One of the methodologies to improve energy situation is increasing energy conservation and energy efficiency in building. The efficient use of lighting in buildings is another effective method for improving energy efficiency since lighting electricity systems account for so much energy use, typically approximately 20% to 30% of the electricity consumption in the building [6]. Thus, lighting Energies 2018, 11, 3169; doi:10.3390/en11113169 www.mdpi.com/journal/energies
Transcript
energies
Article
Harmonics and Reduction of Energy Consumption inLighting Systems by Using LED Lamps
Natthanon Phannil, Chaiyan Jettanasen and Atthapol Ngaopitakkul *
Faculty of Engineering, King Mongkut’s Institute of Technology Ladkrabang, Bangkok 10520, Thailand;[email protected] (N.P.); [email protected] (C.J.)* Correspondence: [email protected]; Tel.: +66-(0)2-329-8330
Received: 1 October 2018; Accepted: 12 November 2018; Published: 15 November 2018�����������������
Abstract: This paper proposes the study and analysis of harmonics, energy consumption and powerquality of light emitting diode (LED) lamps equipped in building lighting systems. LED lamps withexternal (LED MR16) and internal (LED light bulb) drivers are investigated using an experimentalsetup to compare the results. The power quality of both LED lamps is studied by using a powerquality meter to measure the generated harmonic currents from various case studies. The case studyis divided into four major cases: one LED lamp is turned on with one driver, two LED lamps areturned on using the two drivers, eight LED lamps are turned on with one driver, and eight LEDlamps are turned on with the eight drivers. As harmonics are related to total power factor (PF),which affects the energy savings of the building, hence, a filtering circuit to reduce harmonic currenthas been designed and implemented to improve power quality and/or power factor of the system.The different cases of harmonic filter insertion at the input of an LED lamp’s driver are discussed andthen compared with a lighting standard to show the effectiveness of the passive filtering techniqueused in the studied system. In addition, the obtained result can be applied to both newly built andretrofitted buildings that aim to use LED technology to increase energy efficiency and decrease energycosts, and could be a helpful guide for end-users and manufacturers in addressing and developingLED issues.
Keywords: energy consumption; harmonic; light emitting diode; lighting system; power quality
1. Introduction
The world is facing significant energy challenges due to the rapid increase in energy demandstemming from the constantly growing world economy and population. With the rapid increase inenergy consumption rates, limited fossil fuel resources and associated environmental issue, manycountries are pushing energy policies with the objective of supporting renewable energy and increasingenergy efficiency in every sector, in particular in urban buildings [1,2]. According to data from EnergyPolicy & Planning Office (EPPO) of the Ministry of Energy [3], Thailand’s total energy consumptionin 2014 has been steadily increasing at a rate of 2.6% over the previous year. Considering the shareof electricity consumption by sector in Thailand, based on historical energy data and statisticalreview [3–5], the growth of energy consumption in the business and residential sectors considerablysurpassed economic growth. With this energy trend, the near future power generation capacity maynot be able to keep up with electricity demand. It is worldwide accepted that energy conservation andenergy efficiency improvement are essential issues to address the aforementioned challenges.
One of the methodologies to improve energy situation is increasing energy conservation andenergy efficiency in building. The efficient use of lighting in buildings is another effective methodfor improving energy efficiency since lighting electricity systems account for so much energy use,typically approximately 20% to 30% of the electricity consumption in the building [6]. Thus, lighting
is an important concern for building owners, and therefore to the entire economy. In general,the residential use of fluorescent lighting is varied, depending on many factors, such as the priceof energy, financial and environmental concerns of the local people, and light output acceptability.In Thailand, Electricity Generating Authority of Thailand (EGAT) successfully persuaded consumersand/or users to use various kinds of high-efficiency lamps to achieve the energy efficiency of lightingsystem. The light emitting diode (LED) is the most popular energy-efficient source of lighting thatused in many application areas. The LED lamps have recently come into the lighting market as anenergy efficient alternative compared to traditional light sources such as incandescent and fluorescentbulbs. In recent years, along with the upward economic development trend of the emerging economy,the LED lighting market in Thailand has become a significant one that is drawing global attention.Nonetheless, the present energy savings will ultimately depend on the commitment of both industryand government.
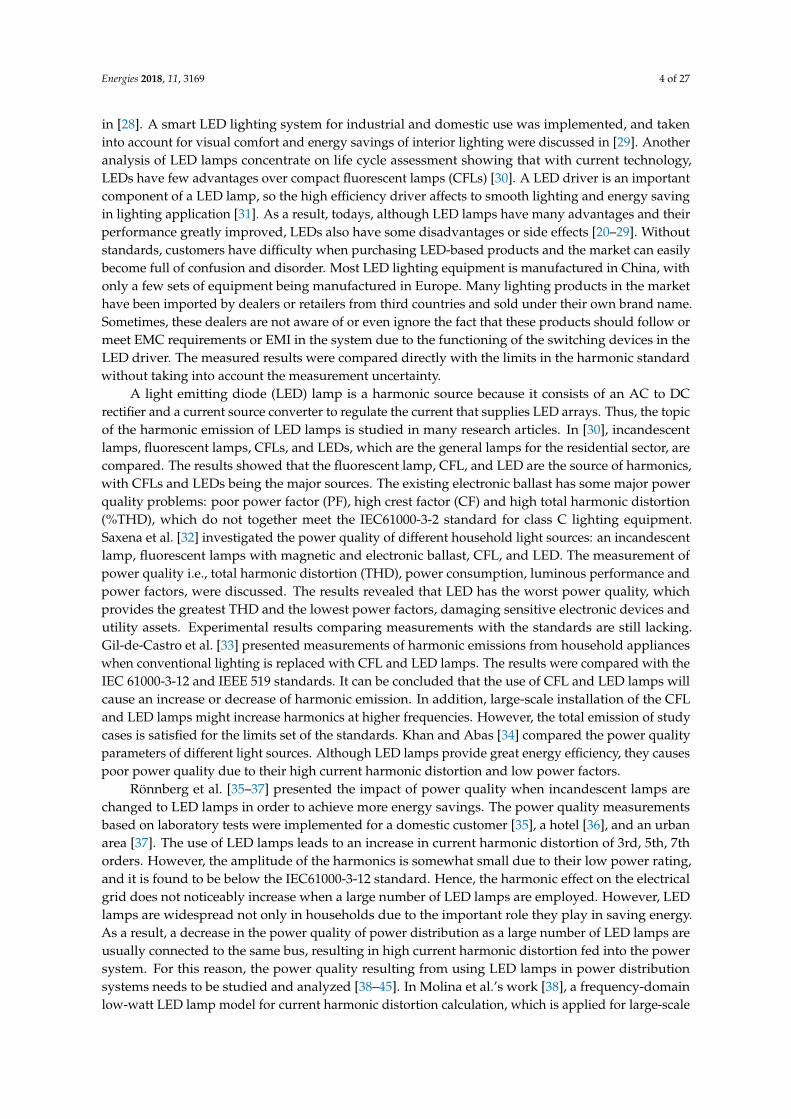
However, power quality issue caused by increasing power electronic equipment such as LEDlamps must be also taken into consideration. Since the LED lamp has a driver, which is a switchingdevice that can generate harmonics and electromagnetic interference (EMI), so it is important tocontrol the volume and noise reduction to avoid negative impacts on the building’s electrical system.In business, many dealers are not always aware of or even ignore the fact that these products shouldfulfil electromagnetic compatibility (EMC) requirements or electromagnetic interference (EMI) in thesystem due to the functioning of the switching devices of the LED driver. The measured resultswere compared directly with the limits in the harmonic standard without taking into account themeasurement uncertainty. By considering the EMC for the lighting system, generally, the standardfor lighting equipment is International Electrotechnical Commission (IEC) 61000-3-2:2018 which isthe standard for harmonic current emissions limits (equipment with a rated input current ≤16 A).The considered IEC 61000-3-2:2018 standard is the update version; it concerns for example lightingequipment with a rated power ≤25 W taken into account for new type of lighting equipment,the modification of the requirements applied to the dimmers when operating non-incandescentlamps, and a clarification for lighting equipment including a control module with an active inputpower ≤2 W, and etc. [7]. For the lighting equipment, IEC 61000-3-2:2018 classifies lighting in class Cand class D permitted value has been using for lighting equipment with rated power less than 25 W.Limit of harmonic current of lighting equipment for class C and D is described in Table 1.
Table 1. Limit of harmonic current of lighting equipment (class C and D equipment) [8].
Harmonics Order (n)
Class C Class D
Maximum Permissible HarmonicCurrent Expressed as a Percentage
of the Input Current at theFundamental Frequency (%)
Despite some advantages of LED lamps, many power quality issues resulting from the switchingdevices inside LED drivers must be taken into consideration, so this paper proposes an analysis ofpower quality from LED lamps in terms of generated harmonics in the lighting system. LED lamps withboth external drivers (LED MR16 type) and internal drivers (LED light bulb type) that are commerciallyavailable in Thailand have been used and an experimental setup has been built. Section 2 presentsthe experimental setup used in this research and measures different parameters of power quality
Energies 2018, 11, 3169 3 of 27
in terms of generated harmonic current from LED lamps in various case studies. The methodologyin paper consists of building an experimental setup for LED lamps. Power quality meters and anoscilloscope have been used to obtain electrical parameters, the harmonic current in each order, voltageand current waveforms. Harmonic filter design is then carried out to overcome the harmonic problem.Section 3 proposes a filtering circuit to reduce harmonic current and improve total harmonic distortion(THD). The obtained harmonic currents before and after adding the filtering circuit are compared tothe standard value set by the International Electrotechnical Commission (IEC). Conclusions and thediscussion appear in Section 4. The obtained results from this research can be applied to buildings thatare considering the replacement of conventional luminaires by LED luminaires, or newer buildingsthat are taking energy savings into account.
2. Literature Review
Research and studies from Thailand and various other countries in the field of energy efficiencytechnology and measurement implemented to reduce energy consumption have been reviewed [9–25].To achieve their targets, energy consumption and various related factors such as climate must beconsidered and discussed to evaluate energy usage and energy saving potential [9–11]. A methodologyfor estimating building energy consumption and energy cost was presented by Gruber et al. [6].The impact of climate change on energy demand and electric consumption in urban heat islandshave been discussed in research by Santamouris et al. [10]. The results indicated that the increase ofambient temperature can increase electric demand by 0.5–8.5% per degree of temperature. Parkpoomand Harrison’s research [11] has evaluated the effect of temperature rising on electricity demand inThailand. Their research forecasted that electrical peak demand will be increased 1.5–3.1% in 2020.In [12], an assessment of energy-saving solutions in high-rise office building in The Netherlands waspresented. The results indicated that high-performance envelope design could contribute to energysavings of up to 42%. A new scheme for real time home power management (RTHPM) has beenproposed by Hanife [13]. The proposed system produced a real-time solution for smart homes to avoidthe high peak demand problem and save energy costs. Study on smart home energy managementhave been presented by many researchers with different kinds of control strategies to reduce energyconsumption and energy cost while increasing comfort in the household [14–16]. In [19], a studyby Sun et al. proposed an energy management system in buildings that integrated heating, cooling,shading and ventilation. The results showed that the proposed strategy could effectively reduceenergy consumption in buildings. For energy usage in the lighting system in residential sector,Popoola et al.’s research has presented a methodology for estimating lighting usage patterns withconsiderations of natural light and occupancy using the Adaptive Neuro-Fuzzy Inference Systemmodel [22]. Another study estimating energy use in lighting systems was presented in Parise et al.’sresearch [23]. The suggested procedure has taken lighting control and behavior of the occupantsinto consideration. From the literature discussed above, it can be seen that researchers from variouscountries are constantly studying and developing newer methodologies and technologies that can beimplemented in the buildings to increase energy efficiency and reduce energy consumption.
In fact, researchers have continually investigated LED for energy efficiency improvement andenergy conservation in developing countries [26–35]. In [26,27], energy saving calculations were donefor LED technology alone. Solid-state lighting, especially LEDs, is one of the promising and quicklydeveloping lighting technologies for replacing old technologies. Even though the LED’s developmentleads to increase lighting consumption, energy savings are still important when considering thesituation of using current technology. The results showed the potential of using LEDs by reducinghousehold lighting energy use and corresponding CO2 emissions in Finland. The energy savingsestimations in this paper, however, were based on the current level of household lighting energyuse. In [28,29], the study has focused on the change of the lighting set, especially LEDs, at home.The proposed LED lighting system used multi-sensors and wireless communication technology forcontrolling an LED luminaire in accordance with the user’s state and the surroundings were presented
Energies 2018, 11, 3169 4 of 27
in [28]. A smart LED lighting system for industrial and domestic use was implemented, and takeninto account for visual comfort and energy savings of interior lighting were discussed in [29]. Anotheranalysis of LED lamps concentrate on life cycle assessment showing that with current technology,LEDs have few advantages over compact fluorescent lamps (CFLs) [30]. A LED driver is an importantcomponent of a LED lamp, so the high efficiency driver affects to smooth lighting and energy savingin lighting application [31]. As a result, todays, although LED lamps have many advantages and theirperformance greatly improved, LEDs also have some disadvantages or side effects [20–29]. Withoutstandards, customers have difficulty when purchasing LED-based products and the market can easilybecome full of confusion and disorder. Most LED lighting equipment is manufactured in China, withonly a few sets of equipment being manufactured in Europe. Many lighting products in the markethave been imported by dealers or retailers from third countries and sold under their own brand name.Sometimes, these dealers are not aware of or even ignore the fact that these products should follow ormeet EMC requirements or EMI in the system due to the functioning of the switching devices in theLED driver. The measured results were compared directly with the limits in the harmonic standardwithout taking into account the measurement uncertainty.
A light emitting diode (LED) lamp is a harmonic source because it consists of an AC to DCrectifier and a current source converter to regulate the current that supplies LED arrays. Thus, the topicof the harmonic emission of LED lamps is studied in many research articles. In [30], incandescentlamps, fluorescent lamps, CFLs, and LEDs, which are the general lamps for the residential sector, arecompared. The results showed that the fluorescent lamp, CFL, and LED are the source of harmonics,with CFLs and LEDs being the major sources. The existing electronic ballast has some major powerquality problems: poor power factor (PF), high crest factor (CF) and high total harmonic distortion(%THD), which do not together meet the IEC61000-3-2 standard for class C lighting equipment.Saxena et al. [32] investigated the power quality of different household light sources: an incandescentlamp, fluorescent lamps with magnetic and electronic ballast, CFL, and LED. The measurement ofpower quality i.e., total harmonic distortion (THD), power consumption, luminous performance andpower factors, were discussed. The results revealed that LED has the worst power quality, whichprovides the greatest THD and the lowest power factors, damaging sensitive electronic devices andutility assets. Experimental results comparing measurements with the standards are still lacking.Gil-de-Castro et al. [33] presented measurements of harmonic emissions from household applianceswhen conventional lighting is replaced with CFL and LED lamps. The results were compared with theIEC 61000-3-12 and IEEE 519 standards. It can be concluded that the use of CFL and LED lamps willcause an increase or decrease of harmonic emission. In addition, large-scale installation of the CFLand LED lamps might increase harmonics at higher frequencies. However, the total emission of studycases is satisfied for the limits set of the standards. Khan and Abas [34] compared the power qualityparameters of different light sources. Although LED lamps provide great energy efficiency, they causespoor power quality due to their high current harmonic distortion and low power factors.
Rönnberg et al. [35–37] presented the impact of power quality when incandescent lamps arechanged to LED lamps in order to achieve more energy savings. The power quality measurementsbased on laboratory tests were implemented for a domestic customer [35], a hotel [36], and an urbanarea [37]. The use of LED lamps leads to an increase in current harmonic distortion of 3rd, 5th, 7thorders. However, the amplitude of the harmonics is somewhat small due to their low power rating,and it is found to be below the IEC61000-3-12 standard. Hence, the harmonic effect on the electricalgrid does not noticeably increase when a large number of LED lamps are employed. However, LEDlamps are widespread not only in households due to the important role they play in saving energy.As a result, a decrease in the power quality of power distribution as a large number of LED lamps areusually connected to the same bus, resulting in high current harmonic distortion fed into the powersystem. For this reason, the power quality resulting from using LED lamps in power distributionsystems needs to be studied and analyzed [38–45]. In Molina et al.’s work [38], a frequency-domainlow-watt LED lamp model for current harmonic distortion calculation, which is applied for large-scale
Energies 2018, 11, 3169 5 of 27
harmonic penetration, is discussed. Blanco and Parra [39] analyzed the voltage and current harmonicdistortion of distribution systems when supplying energy to LED lamps.
Verma et al. [41] investigated the effect of harmonic generated from LED’s driver. Various LEDbrands were selected and compared. Additionally, the combination of different LED brands aimed toreduce the harmonic distortion is proposed. The results show that each brand of LED lamp gives agreat variety of harmonic distortion values compared to the standard IEC 61000-3-2 class C, and thecombination method can reduce the harmonic emission. Gil-de-Castro et al. [43] studied the powerquality results of 24 different LED lamps in terms of harmonics and flicker. The LED lamps weremeasured and compared based on the harmonic current spectrum and light intensity variations at thesame voltage magnitude. The results revealed that the harmonic emission of the LED lamps dependsconsiderably on technology, i.e., power electronics, used within the LED lamps. Thus, the active powerand the prices of LED lamps have no connection with the harmonic distortion they produce. Dolaraand Leva [44] conducted measurements of power quality in indoor lighting systems using severaltypes of LED and CFL lamps. The results showed that the use of drivers and ballasts in LED andCFL lamps, respectively, caused harmonic generation. Different lamp manufacturers use many drivertechnologies, leading to various current harmonic distortion values generated from the lamps. Manyresearches which have studied the harmonic emissions of LED lamps and drivers show that LEDlamps can generate a lot of harmonic emissions. The IEC 61000-3-2 class C is used to compare with theharmonic emission of LED lamps, but some studies use lower 25-watt LED lamps which are not consistentwith the IEC 61000-3-2 class C. Therefore, this paper employs the IEC 61000-3-2 class C and D to considerthe harmonic emission. Additionally, many studies use different brands of LED lamps, but all of them usethe E-27 lamp socket and internal LED driver. In this research, internal and external drivers are studiedusing two brands of LED lamps with each driver and varying the number of lamps and drivers.
There are numerous traditional and innovative techniques [45–52] that can be used to reduceor suppress harmonics unintentionally produced in any electrical/electronic system. Harmonicsgenerated by lighting equipment and reduction methods have been presented in Chiradeja et al.’sresearch [5]. The study used fluorescent lamps with both magnetic and electronic ballasts to evaluatethe harmonic issues in each type of luminaire. A study by Karim and et al. [45] proposed a low passfilter which could be used for LED harmonic attenuation. The experiment used an 18 W LED lamp withthe external driver as the harmonic source. The harmonic emission is compared with the IEC 61000-3-2class C and the total harmonic distortion (THDI) was 176.6% and 25.3% without and with the low passfilter, respectively. Shi’s research [46] presented a method to mitigate this harmonic distortion. The gridsystem is divided into three positions for placing the harmonic filter, including installing a three-phasefilter at the substation, installing a single-phase filter at the secondary side of the transformer andinstalling a single-phase filter at the house. The set of combined single-tuned passive filters is employedto reduce the 3rd, 5th, 7th characteristic harmonics in a residence. It can reduce the harmonic voltageby 16–34% and the harmonic current by around 30%. Harmonic attenuation can be achieved by usingdifferent techniques. One of the most popular ways is the use of a passive low-pass filter which ispresented in this research. This method is capable of reducing the harmonic emission from the lightingsystem in a satisfactory, effective, inexpensive, and easy to use way, so it is suitable for use in harmonicattenuation of indoor lighting systems where the user does not need to have extensive knowledge ofelectrical systems. In this research, the attenuation performance of the low-pass filter, which affectsinternal and external drivers, is compared.
3. Experimental Setup and Harmonic Results
In this section, an experimental setup with two types of LED lamp has been employed to evaluatetheir impact on power quality in terms of generated harmonics. LED lamps with an external driver(LED MR16 type) and with an internal driver (LED light bulb type) presently available on the marketin Thailand were investigated. The objective was to discover the effect of the number of drivers andtype of drivers on harmonic generation.
Energies 2018, 11, 3169 6 of 27
3.1. The LED Lamp with External Driver
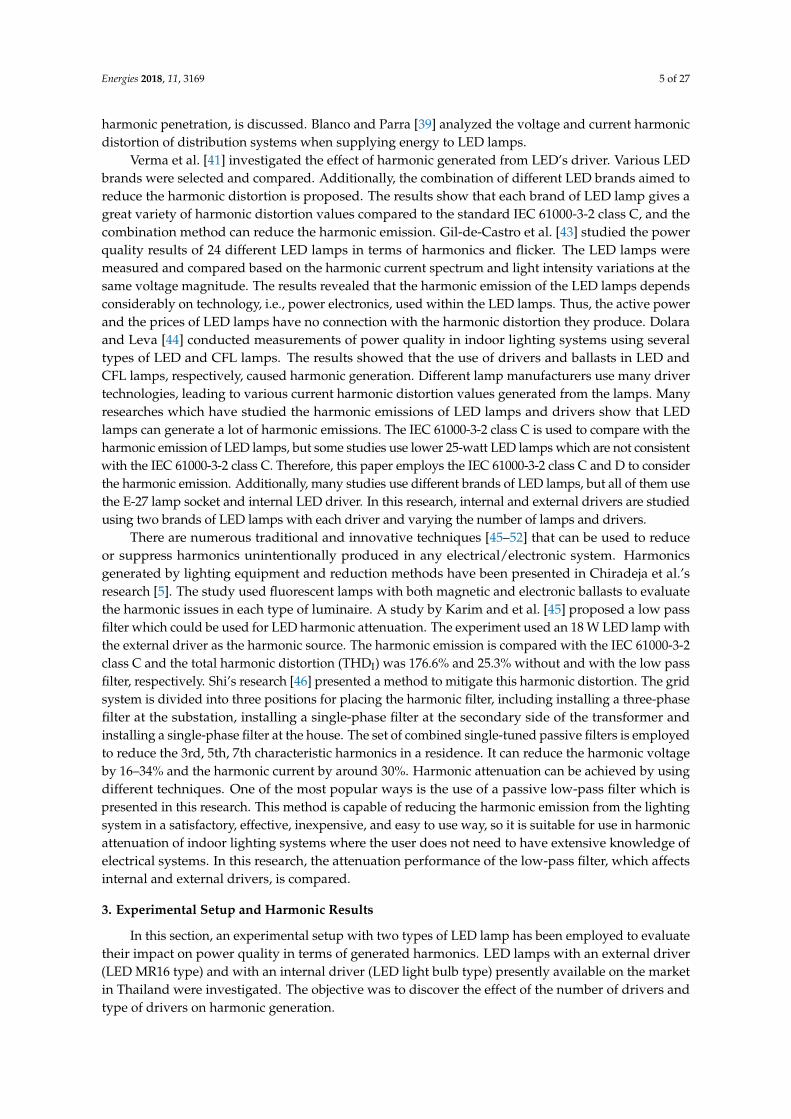
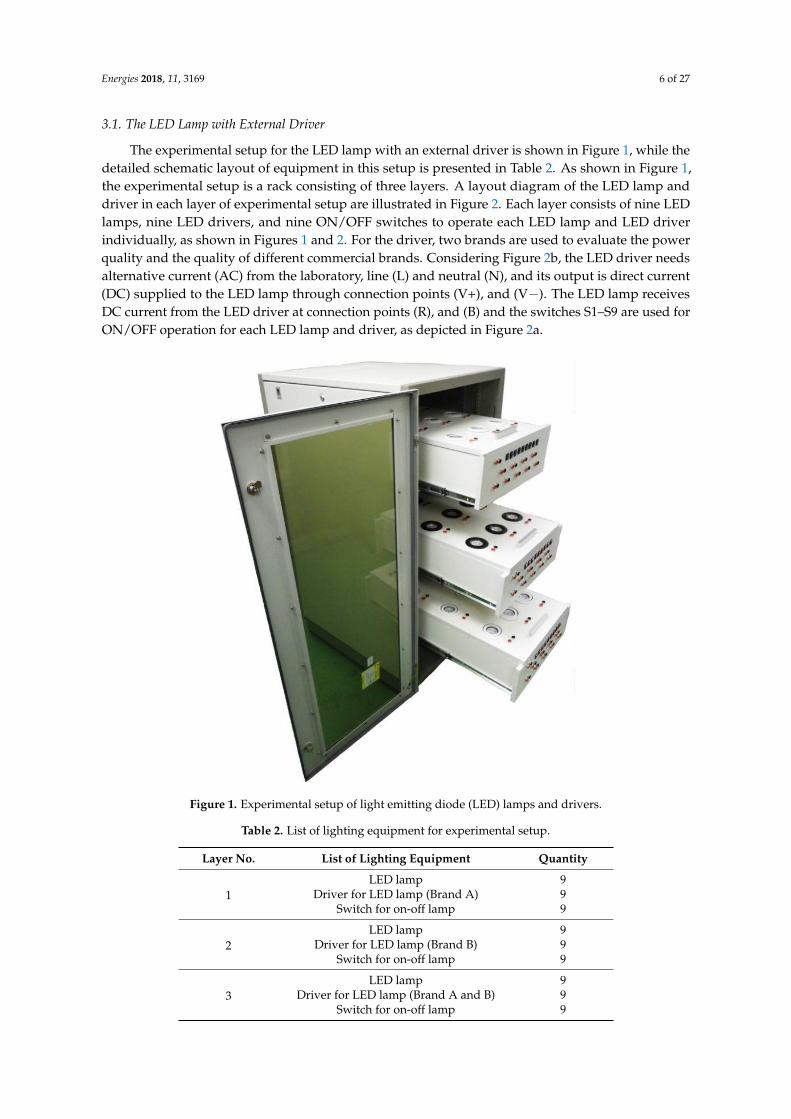
The experimental setup for the LED lamp with an external driver is shown in Figure 1, while thedetailed schematic layout of equipment in this setup is presented in Table 2. As shown in Figure 1,the experimental setup is a rack consisting of three layers. A layout diagram of the LED lamp anddriver in each layer of experimental setup are illustrated in Figure 2. Each layer consists of nine LEDlamps, nine LED drivers, and nine ON/OFF switches to operate each LED lamp and LED driverindividually, as shown in Figures 1 and 2. For the driver, two brands are used to evaluate the powerquality and the quality of different commercial brands. Considering Figure 2b, the LED driver needsalternative current (AC) from the laboratory, line (L) and neutral (N), and its output is direct current(DC) supplied to the LED lamp through connection points (V+), and (V−). The LED lamp receivesDC current from the LED driver at connection points (R), and (B) and the switches S1–S9 are used forON/OFF operation for each LED lamp and driver, as depicted in Figure 2a.
Energies 2018, 11, x 6 of 28
3.1. The LED Lamp with External Driver
The experimental setup for the LED lamp with an external driver is shown in Figure 1, while the detailed schematic layout of equipment in this setup is presented in Table 2. As shown in Figure 1, the experimental setup is a rack consisting of three layers. A layout diagram of the LED lamp and driver in each layer of experimental setup are illustrated in Figure 2. Each layer consists of nine LED lamps, nine LED drivers, and nine ON/OFF switches to operate each LED lamp and LED driver individually, as shown in Figures 1 and 2. For the driver, two brands are used to evaluate the power quality and the quality of different commercial brands. Considering Figure 2b, the LED driver needs alternative current (AC) from the laboratory, line (L) and neutral (N), and its output is direct current (DC) supplied to the LED lamp through connection points (V+), and (V−). The LED lamp receives DC current from the LED driver at connection points (R), and (B) and the switches S1–S9 are used for ON/OFF operation for each LED lamp and driver, as depicted in Figure 2a.
Figure 1. Experimental setup of light emitting diode (LED) lamps and drivers.
Table 2. List of lighting equipment for experimental setup.
Layer No. List of Lighting Equipment Quantity
1 LED lamp 9
Driver for LED lamp (Brand A) 9 Switch for on-off lamp 9
2 LED lamp 9
Driver for LED lamp (Brand B) 9 Switch for on-off lamp 9
3 LED lamp 9
Driver for LED lamp (Brand A and B) 9 Switch for on-off lamp 9
Figure 1. Experimental setup of light emitting diode (LED) lamps and drivers.
Table 2. List of lighting equipment for experimental setup.
Layer No. List of Lighting Equipment Quantity
1LED lamp 9
Driver for LED lamp (Brand A) 9Switch for on-off lamp 9
2LED lamp 9
Driver for LED lamp (Brand B) 9Switch for on-off lamp 9
3LED lamp 9
Driver for LED lamp (Brand A and B) 9Switch for on-off lamp 9
Energies 2018, 11, 3169 7 of 27
Energies 2018, 11, x 7 of 28
L1
R B
L4
R B
L7
R B
L2
R B
L5
R B
L8
R B
L3
R B
L6
R B
L9
R B
S1 S2 S3 S4 S5 S6 S7 S8 S9
V+V-
D9
L NV+V-
D6
L NV+V-
D3
L N
V+V-
D2
L N V+V-
D5
L N V+V-
D8
L N
V+V-
D7
L NV+V-
D1
L N V+V-
D4
L N
S1 S2 S3 S4 S5 S6 S7 S8 S9
(a) (b)
Figure 2. Schematic diagram layout of equipment in experimental setup. (a) Layout of the LED lamp of each layer; (b) Layout of LED Driver in each layer.
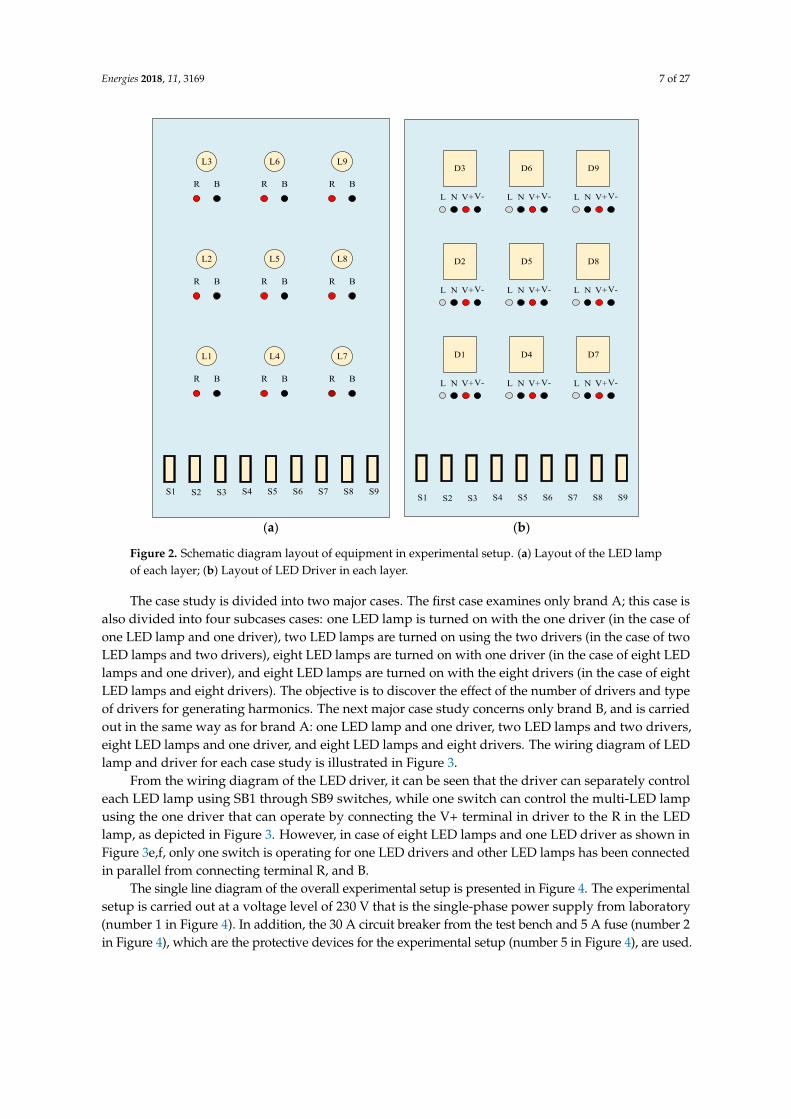
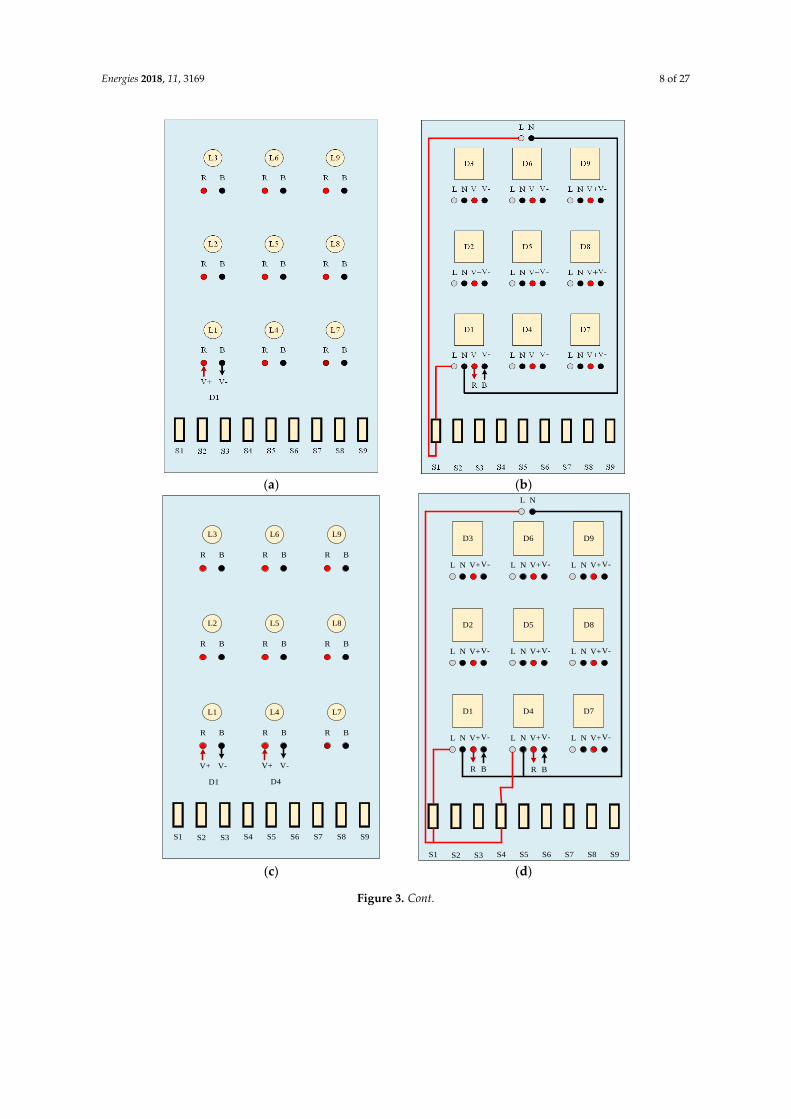
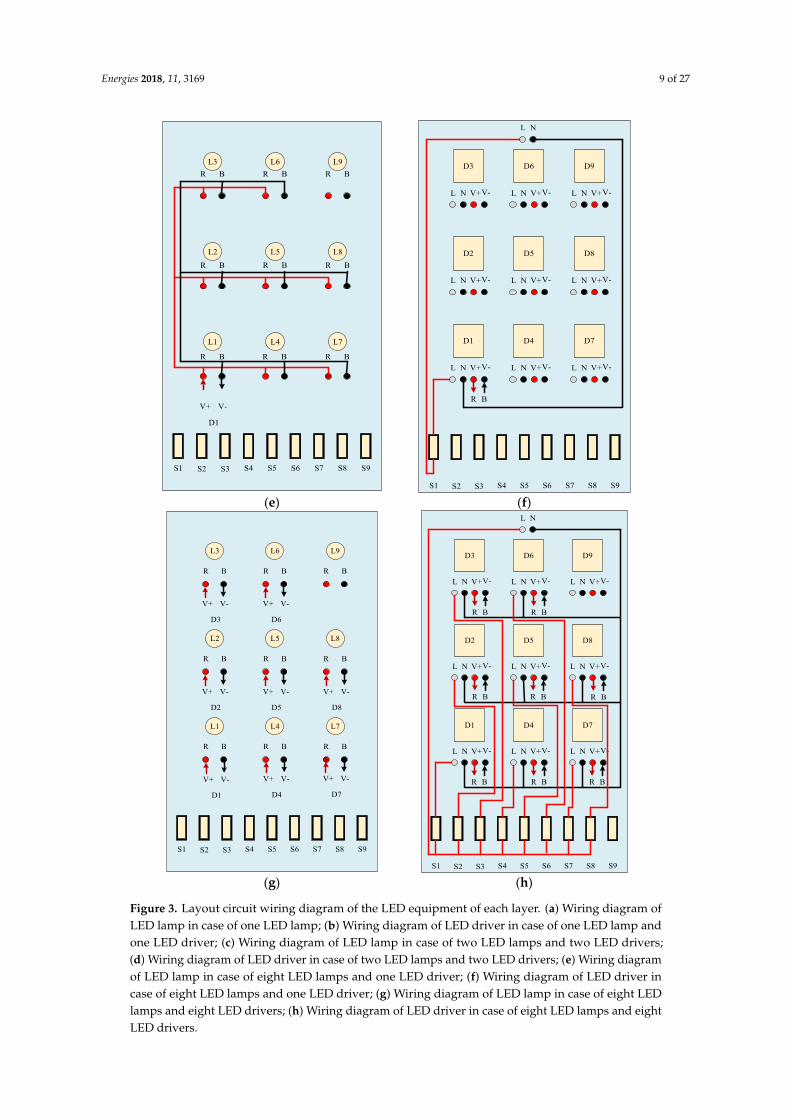
The case study is divided into two major cases. The first case examines only brand A; this case is also divided into four subcases cases: one LED lamp is turned on with the one driver (in the case of one LED lamp and one driver), two LED lamps are turned on using the two drivers (in the case of two LED lamps and two drivers), eight LED lamps are turned on with one driver (in the case of eight LED lamps and one driver), and eight LED lamps are turned on with the eight drivers (in the case of eight LED lamps and eight drivers). The objective is to discover the effect of the number of drivers and type of drivers for generating harmonics. The next major case study concerns only brand B, and is carried out in the same way as for brand A: one LED lamp and one driver, two LED lamps and two drivers, eight LED lamps and one driver, and eight LED lamps and eight drivers. The wiring diagram of LED lamp and driver for each case study is illustrated in Figure 3.
From the wiring diagram of the LED driver, it can be seen that the driver can separately control each LED lamp using SB1 through SB9 switches, while one switch can control the multi-LED lamp using the one driver that can operate by connecting the V+ terminal in driver to the R in the LED lamp, as depicted in Figure 3. However, in case of eight LED lamps and one LED driver as shown in Figure 3e,f, only one switch is operating for one LED drivers and other LED lamps has been connected in parallel from connecting terminal R, and B.
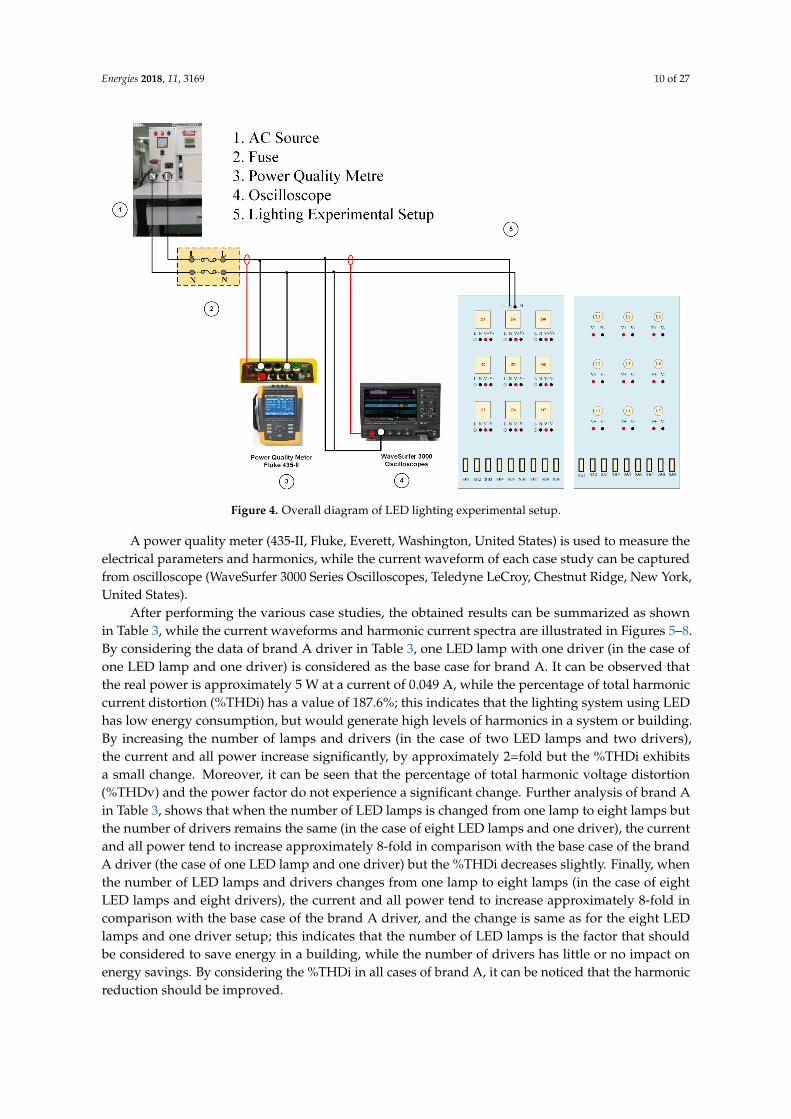
The single line diagram of the overall experimental setup is presented in Figure 4. The experimental setup is carried out at a voltage level of 230 V that is the single-phase power supply from laboratory (number 1 in Figure 4). In addition, the 30 A circuit breaker from the test bench and 5 A fuse (number 2 in Figure 4), which are the protective devices for the experimental setup (number 5 in Figure 4), are used.
Figure 2. Schematic diagram layout of equipment in experimental setup. (a) Layout of the LED lampof each layer; (b) Layout of LED Driver in each layer.
The case study is divided into two major cases. The first case examines only brand A; this case isalso divided into four subcases cases: one LED lamp is turned on with the one driver (in the case ofone LED lamp and one driver), two LED lamps are turned on using the two drivers (in the case of twoLED lamps and two drivers), eight LED lamps are turned on with one driver (in the case of eight LEDlamps and one driver), and eight LED lamps are turned on with the eight drivers (in the case of eightLED lamps and eight drivers). The objective is to discover the effect of the number of drivers and typeof drivers for generating harmonics. The next major case study concerns only brand B, and is carriedout in the same way as for brand A: one LED lamp and one driver, two LED lamps and two drivers,eight LED lamps and one driver, and eight LED lamps and eight drivers. The wiring diagram of LEDlamp and driver for each case study is illustrated in Figure 3.
From the wiring diagram of the LED driver, it can be seen that the driver can separately controleach LED lamp using SB1 through SB9 switches, while one switch can control the multi-LED lampusing the one driver that can operate by connecting the V+ terminal in driver to the R in the LEDlamp, as depicted in Figure 3. However, in case of eight LED lamps and one LED driver as shown inFigure 3e,f, only one switch is operating for one LED drivers and other LED lamps has been connectedin parallel from connecting terminal R, and B.
The single line diagram of the overall experimental setup is presented in Figure 4. The experimentalsetup is carried out at a voltage level of 230 V that is the single-phase power supply from laboratory(number 1 in Figure 4). In addition, the 30 A circuit breaker from the test bench and 5 A fuse (number 2in Figure 4), which are the protective devices for the experimental setup (number 5 in Figure 4), are used.
Energies 2018, 11, 3169 8 of 27
Energies 2018, 11, x 8 of 28
(a) (b)
L1
R B
L4
R B
L7
R B
L2
R B
L5
R B
L8
R B
L3
R B
L6
R B
L9
R B
V-
S1 S2 S3 S4 S5 S6 S7 S8 S9
V+
D1
V-V+
D4
V+V-
D9
L NV+V-
D6
L NV+V-
D3
L N
V+V-
D2
L N V+V-
D5
L N V+V-
D8
L N
V+V-
D7
L NV+V-
D1
L N V+V-
D4
L N
S1 S2 S3 S4 S5 S6 S7 S8 S9
L N
BR BR
(c) (d)
Figure 3. Cont.
Energies 2018, 11, 3169 9 of 27
Energies 2018, 11, x 9 of 28
L1
R B
L4
R B
L7
R B
L2R B
L5R B
L8R B
L3R B
L6R B
L9R B
V-
S1 S2 S3 S4 S5 S6 S7 S8 S9
V+
D1
V+V-
D9
L NV+V-
D6
L NV+V-
D3
L N
V+V-
D2
L N V+V-
D5
L N V+V-
D8
L N
V+V-
D7
L NV+V-
D1
L N V+V-
D4
L N
S1 S2 S3 S4 S5 S6 S7 S8 S9
L N
BR
(e) (f)
L1
R B
L4
R B
L7
R B
L2
R B
L5
R B
L8
R B
L3
R B
L6
R B
L9
R B
S1 S2 S3 S4 S5 S6 S7 S8 S9
V-V+
D1
V-V+
D4
V-V+
D7
V-V+
D8
V-V+
D5
V-V+
D2
V-V+
D3
V-V+
D6
V+V-
D9
L NV+V-
D6
L NV+V-
D3
L N
V+V-
D2
L N V+V-
D5
L N V+V-
D8
L N
V+V-
D7
L NV+V-
D1
L N V+V-
D4
L N
S1 S2 S3 S4 S5 S6 S7 S8 S9
L N
BR BR BR
BRBRBR
BR BR
(g) (h)
Figure 3. Layout circuit wiring diagram of the LED equipment of each layer. (a) Wiring diagram of LED lamp in case of one LED lamp; (b) Wiring diagram of LED driver in case of one LED lamp and one LED driver; (c) Wiring diagram of LED lamp in case of two LED lamps and two LED drivers; (d) Wiring diagram of LED driver in case of two LED lamps and two LED drivers; (e) Wiring diagram of LED lamp in case of eight LED lamps and one LED driver; (f) Wiring diagram of LED driver in case of eight LED lamps and one LED driver; (g) Wiring diagram of LED lamp in case of eight LED lamps and eight LED drivers; (h) Wiring diagram of LED driver in case of eight LED lamps and eight LED drivers.
Figure 3. Layout circuit wiring diagram of the LED equipment of each layer. (a) Wiring diagram ofLED lamp in case of one LED lamp; (b) Wiring diagram of LED driver in case of one LED lamp andone LED driver; (c) Wiring diagram of LED lamp in case of two LED lamps and two LED drivers;(d) Wiring diagram of LED driver in case of two LED lamps and two LED drivers; (e) Wiring diagramof LED lamp in case of eight LED lamps and one LED driver; (f) Wiring diagram of LED driver incase of eight LED lamps and one LED driver; (g) Wiring diagram of LED lamp in case of eight LEDlamps and eight LED drivers; (h) Wiring diagram of LED driver in case of eight LED lamps and eightLED drivers.
Energies 2018, 11, 3169 10 of 27
Energies 2018, 11, x 10 of 28
A power quality meter (435-II, Fluke, Everett, Washington, United States) is used to measure the electrical parameters and harmonics, while the current waveform of each case study can be captured from oscilloscope (WaveSurfer 3000 Series Oscilloscopes, Teledyne LeCroy, Chestnut Ridge, New York, United States).
Figure 4. Overall diagram of LED lighting experimental setup.
After performing the various case studies, the obtained results can be summarized as shown in Table 3, while the current waveforms and harmonic current spectra are illustrated in Figures 5–8. By considering the data of brand A driver in Table 3, one LED lamp with one driver (in the case of one LED lamp and one driver) is considered as the base case for brand A. It can be observed that the real power is approximately 5 W at a current of 0.049 A, while the percentage of total harmonic current distortion (%THDi) has a value of 187.6%; this indicates that the lighting system using LED has low energy consumption, but would generate high levels of harmonics in a system or building. By increasing the number of lamps and drivers (in the case of two LED lamps and two drivers), the current and all power increase significantly, by approximately 2=fold but the %THDi exhibits a small change. Moreover, it can be seen that the percentage of total harmonic voltage distortion (%THDv) and the power factor do not experience a significant change. Further analysis of brand A in Table 3, shows that when the number of LED lamps is changed from one lamp to eight lamps but the number of drivers remains the same (in the case of eight LED lamps and one driver), the current and all power tend to increase approximately 8-fold in comparison with the base case of the brand A driver (the case of one LED lamp and one driver) but the %THDi decreases slightly. Finally, when the number of LED lamps and drivers changes from one lamp to eight lamps (in the case of eight LED lamps and eight drivers), the current and all power tend to increase approximately 8-fold in comparison with the base case of the brand A driver, and the change is same as for the eight LED lamps and one driver setup; this indicates that the number of LED lamps is the factor that should be considered to save energy in a building, while the number of drivers has little or no impact on energy savings. By considering the %THDi in all cases of brand A, it can be noticed that the harmonic reduction should be improved.
Figure 4. Overall diagram of LED lighting experimental setup.
A power quality meter (435-II, Fluke, Everett, Washington, United States) is used to measure theelectrical parameters and harmonics, while the current waveform of each case study can be capturedfrom oscilloscope (WaveSurfer 3000 Series Oscilloscopes, Teledyne LeCroy, Chestnut Ridge, New York,United States).
After performing the various case studies, the obtained results can be summarized as shownin Table 3, while the current waveforms and harmonic current spectra are illustrated in Figures 5–8.By considering the data of brand A driver in Table 3, one LED lamp with one driver (in the case ofone LED lamp and one driver) is considered as the base case for brand A. It can be observed thatthe real power is approximately 5 W at a current of 0.049 A, while the percentage of total harmoniccurrent distortion (%THDi) has a value of 187.6%; this indicates that the lighting system using LEDhas low energy consumption, but would generate high levels of harmonics in a system or building.By increasing the number of lamps and drivers (in the case of two LED lamps and two drivers),the current and all power increase significantly, by approximately 2=fold but the %THDi exhibitsa small change. Moreover, it can be seen that the percentage of total harmonic voltage distortion(%THDv) and the power factor do not experience a significant change. Further analysis of brand Ain Table 3, shows that when the number of LED lamps is changed from one lamp to eight lamps butthe number of drivers remains the same (in the case of eight LED lamps and one driver), the currentand all power tend to increase approximately 8-fold in comparison with the base case of the brandA driver (the case of one LED lamp and one driver) but the %THDi decreases slightly. Finally, whenthe number of LED lamps and drivers changes from one lamp to eight lamps (in the case of eightLED lamps and eight drivers), the current and all power tend to increase approximately 8-fold incomparison with the base case of the brand A driver, and the change is same as for the eight LEDlamps and one driver setup; this indicates that the number of LED lamps is the factor that shouldbe considered to save energy in a building, while the number of drivers has little or no impact onenergy savings. By considering the %THDi in all cases of brand A, it can be noticed that the harmonicreduction should be improved.
Energies 2018, 11, 3169 11 of 27
Table 3. Summary results from experimental setup for each driver brand.
After carrying out the various driver cases with brand B, one LED lamp with one driver is alsoconsidered as the base case for brand B, as shown in Table 3. By considering the base case of one driverwith brand B in Table 3, it can be observed that the real power is approximately 6 W at a current of0.068 A, while the %THDi has a value of 99.5%; this indicates that there is a slight mismatch betweenthe energy consumption and power quality in the LED lighting system. Moreover, the power factor ofbrand B is less than that of the base case of brand A. Based on a further analysis of all case studies ofdrivers with brand B, it can be seen that the all parameters exhibit the same behavior as the driverwith brand A for each case study, but the all parameters of the brand B driver have a higher value thanthose of brand A, except for the power factor and %THDi.
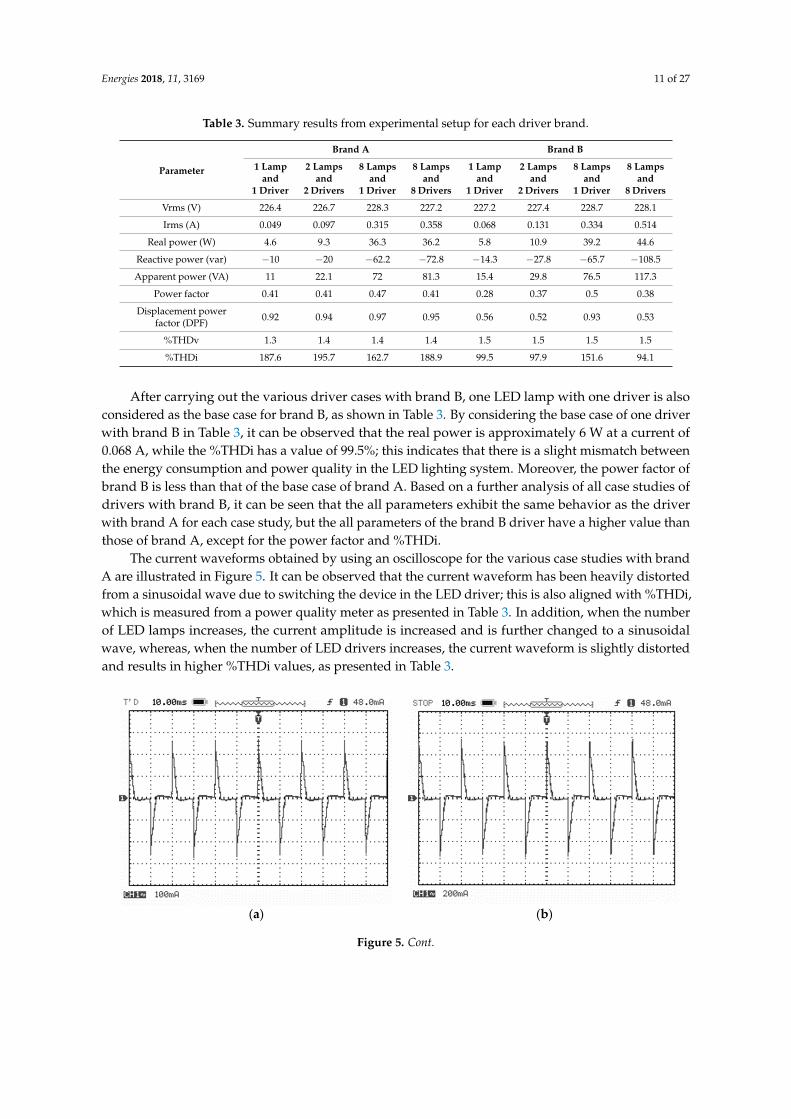
The current waveforms obtained by using an oscilloscope for the various case studies with brandA are illustrated in Figure 5. It can be observed that the current waveform has been heavily distortedfrom a sinusoidal wave due to switching the device in the LED driver; this is also aligned with %THDi,which is measured from a power quality meter as presented in Table 3. In addition, when the numberof LED lamps increases, the current amplitude is increased and is further changed to a sinusoidalwave, whereas, when the number of LED drivers increases, the current waveform is slightly distortedand results in higher %THDi values, as presented in Table 3.
Energies 2018, 11, x 11 of 28
Table 3. Summary results from experimental setup for each driver brand.
After carrying out the various driver cases with brand B, one LED lamp with one driver is also considered as the base case for brand B, as shown in Table 3. By considering the base case of one driver with brand B in Table 3, it can be observed that the real power is approximately 6 W at a current of 0.068 A, while the %THDi has a value of 99.5%; this indicates that there is a slight mismatch between the energy consumption and power quality in the LED lighting system. Moreover, the power factor of brand B is less than that of the base case of brand A. Based on a further analysis of all case studies of drivers with brand B, it can be seen that the all parameters exhibit the same behavior as the driver with brand A for each case study, but the all parameters of the brand B driver have a higher value than those of brand A, except for the power factor and %THDi.
The current waveforms obtained by using an oscilloscope for the various case studies with brand A are illustrated in Figure 5. It can be observed that the current waveform has been heavily distorted from a sinusoidal wave due to switching the device in the LED driver; this is also aligned with %THDi, which is measured from a power quality meter as presented in Table 3. In addition, when the number of LED lamps increases, the current amplitude is increased and is further changed to a sinusoidal wave, whereas, when the number of LED drivers increases, the current waveform is slightly distorted and results in higher %THDi values, as presented in Table 3.
(a) (b)
Figure 5. Cont.
Energies 2018, 11, 3169 12 of 27
Energies 2018, 11, x 12 of 28
(c) (d)
Figure 5. Experimental waveform for case of LED lamp and driver with brand A. (a) Current waveform in the case of one lamp with one driver; (b) Current waveform in the case of two lamps with two drivers; (c) Current waveform in the case of eight lamps with one driver; (d) Current waveform in the case of eight lamps with eight drivers.
(a) (b)
(c) (d)
Figure 6. Experimental waveform for case of LED lamp and driver with brand B. (a) Current waveform in the case of one lamp with one driver; (b) Current waveform in the case of two lamps with two drivers; (c) Current waveform in the case of eight lamps with one driver; (d) Current waveform in the case of eight lamps with eight drivers.
Figure 5. Experimental waveform for case of LED lamp and driver with brand A. (a) Current waveformin the case of one lamp with one driver; (b) Current waveform in the case of two lamps with twodrivers; (c) Current waveform in the case of eight lamps with one driver; (d) Current waveform in thecase of eight lamps with eight drivers.
Energies 2018, 11, x 12 of 28
(c) (d)
Figure 5. Experimental waveform for case of LED lamp and driver with brand A. (a) Current waveform in the case of one lamp with one driver; (b) Current waveform in the case of two lamps with two drivers; (c) Current waveform in the case of eight lamps with one driver; (d) Current waveform in the case of eight lamps with eight drivers.
(a) (b)
(c) (d)
Figure 6. Experimental waveform for case of LED lamp and driver with brand B. (a) Current waveform in the case of one lamp with one driver; (b) Current waveform in the case of two lamps with two drivers; (c) Current waveform in the case of eight lamps with one driver; (d) Current waveform in the case of eight lamps with eight drivers.
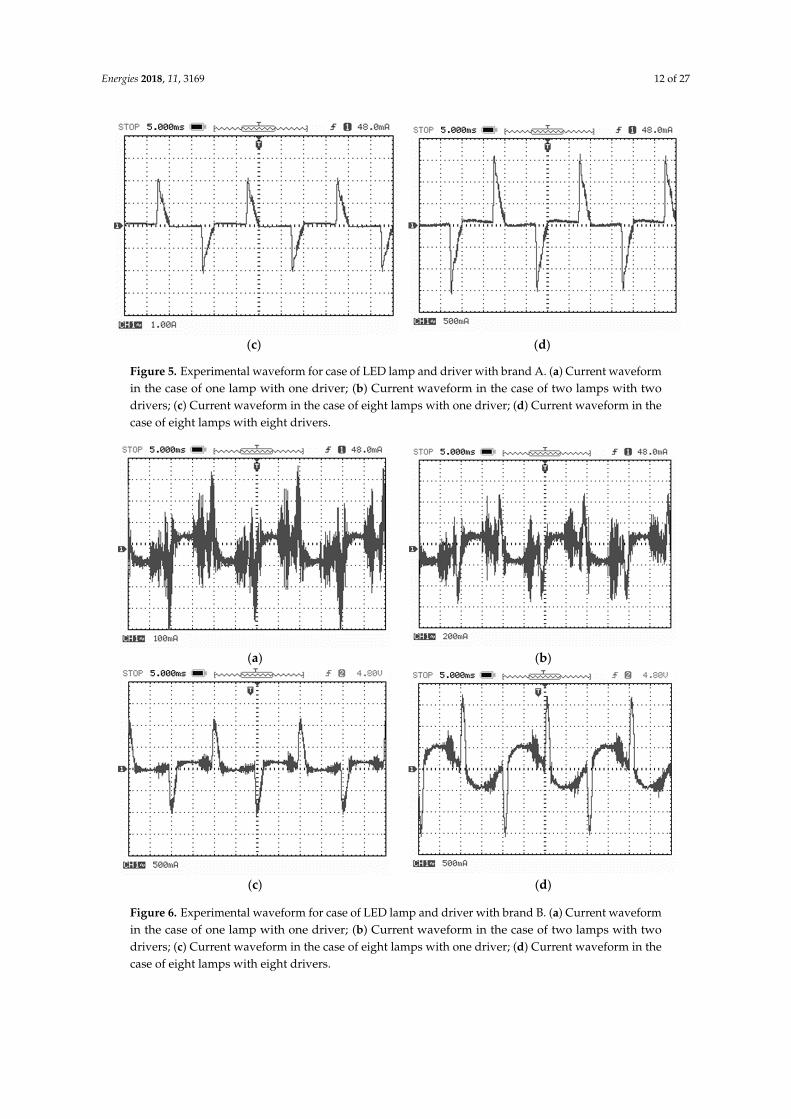
Figure 6. Experimental waveform for case of LED lamp and driver with brand B. (a) Current waveformin the case of one lamp with one driver; (b) Current waveform in the case of two lamps with twodrivers; (c) Current waveform in the case of eight lamps with one driver; (d) Current waveform in thecase of eight lamps with eight drivers.
Energies 2018, 11, 3169 13 of 27
Energies 2018, 11, x 13 of 28
(a)
(b)
(c)
Figure 7. Cont.
Energies 2018, 11, 3169 14 of 27
Energies 2018, 11, x 14 of 28
(d)
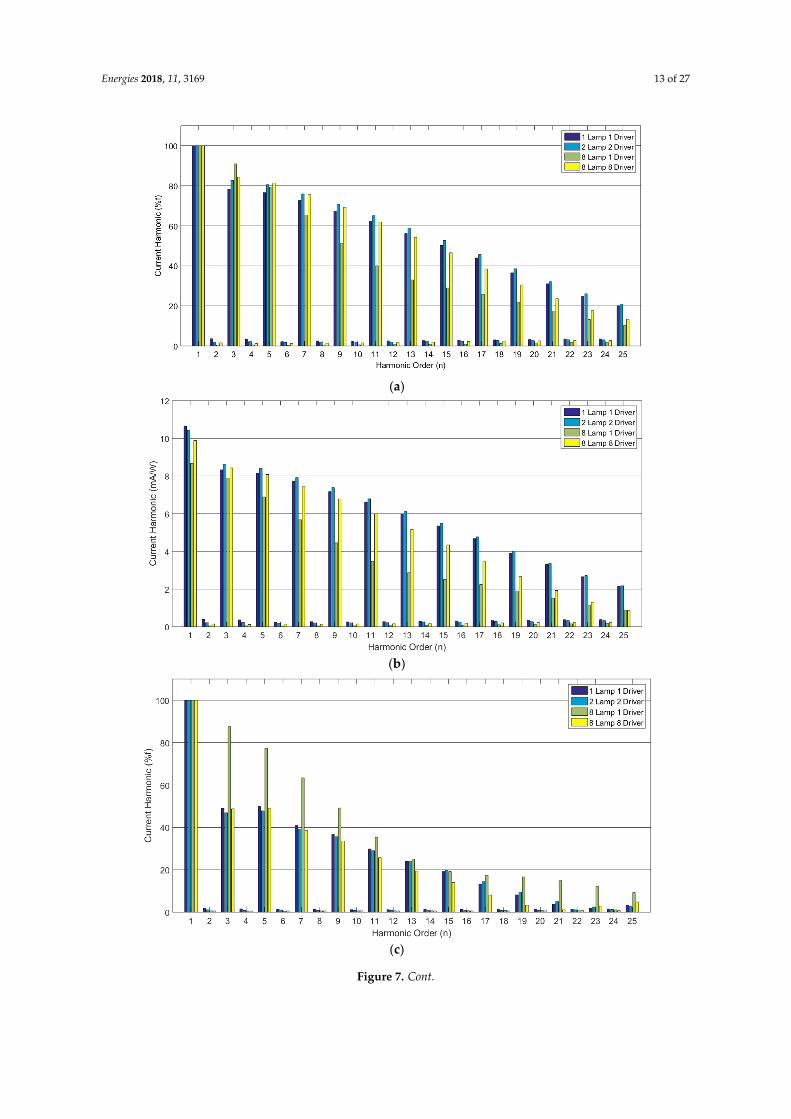
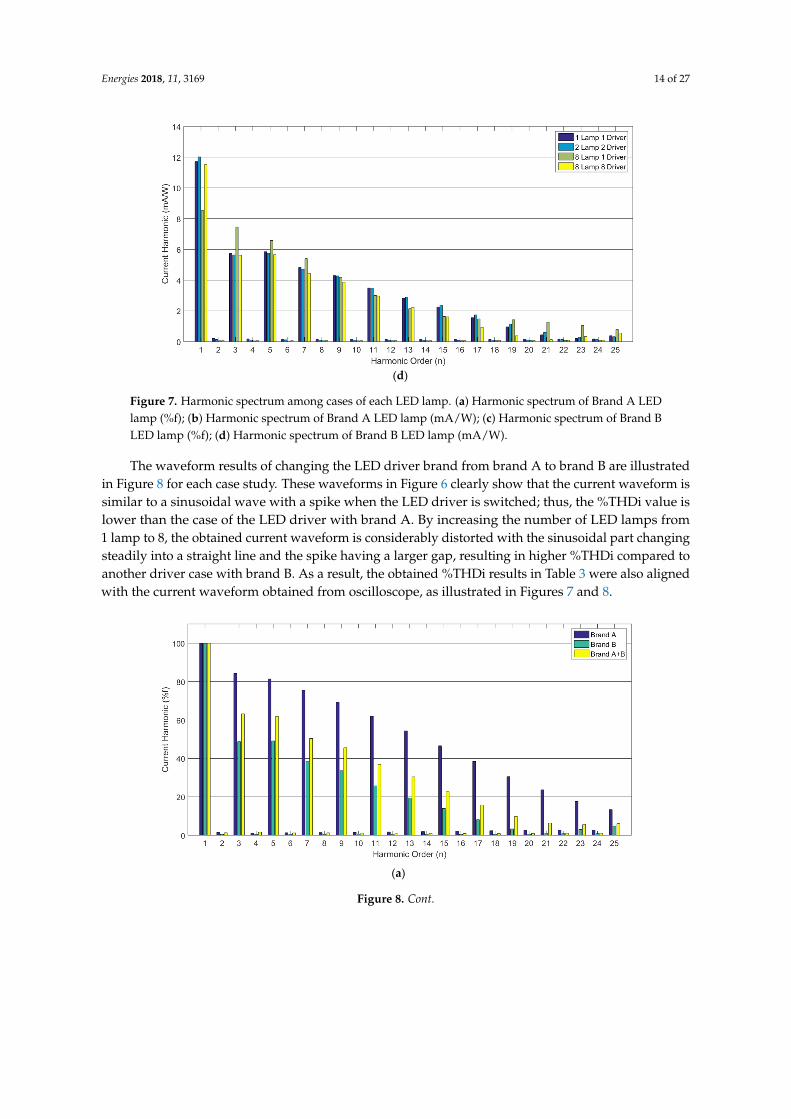
Figure 7. Harmonic spectrum among cases of each LED lamp. (a) Harmonic spectrum of Brand A LED lamp (%f); (b) Harmonic spectrum of Brand A LED lamp (mA/W); (c) Harmonic spectrum of Brand B LED lamp (%f); (d) Harmonic spectrum of Brand B LED lamp (mA/W).
The waveform results of changing the LED driver brand from brand A to brand B are illustrated in Figure 8 for each case study. These waveforms in Figure 6 clearly show that the current waveform is similar to a sinusoidal wave with a spike when the LED driver is switched; thus, the %THDi value is lower than the case of the LED driver with brand A. By increasing the number of LED lamps from 1 lamp to 8, the obtained current waveform is considerably distorted with the sinusoidal part changing steadily into a straight line and the spike having a larger gap, resulting in higher %THDi compared to another driver case with brand B. As a result, the obtained %THDi results in Table 3 were also aligned with the current waveform obtained from oscilloscope, as illustrated in Figures 7 and 8.
(a)
Figure 7. Harmonic spectrum among cases of each LED lamp. (a) Harmonic spectrum of Brand A LEDlamp (%f); (b) Harmonic spectrum of Brand A LED lamp (mA/W); (c) Harmonic spectrum of Brand BLED lamp (%f); (d) Harmonic spectrum of Brand B LED lamp (mA/W).
The waveform results of changing the LED driver brand from brand A to brand B are illustratedin Figure 8 for each case study. These waveforms in Figure 6 clearly show that the current waveform issimilar to a sinusoidal wave with a spike when the LED driver is switched; thus, the %THDi value islower than the case of the LED driver with brand A. By increasing the number of LED lamps from1 lamp to 8, the obtained current waveform is considerably distorted with the sinusoidal part changingsteadily into a straight line and the spike having a larger gap, resulting in higher %THDi compared toanother driver case with brand B. As a result, the obtained %THDi results in Table 3 were also alignedwith the current waveform obtained from oscilloscope, as illustrated in Figures 7 and 8.
Energies 2018, 11, x 14 of 28
(d)
Figure 7. Harmonic spectrum among cases of each LED lamp. (a) Harmonic spectrum of Brand A LED lamp (%f); (b) Harmonic spectrum of Brand A LED lamp (mA/W); (c) Harmonic spectrum of Brand B LED lamp (%f); (d) Harmonic spectrum of Brand B LED lamp (mA/W).
The waveform results of changing the LED driver brand from brand A to brand B are illustrated in Figure 8 for each case study. These waveforms in Figure 6 clearly show that the current waveform is similar to a sinusoidal wave with a spike when the LED driver is switched; thus, the %THDi value is lower than the case of the LED driver with brand A. By increasing the number of LED lamps from 1 lamp to 8, the obtained current waveform is considerably distorted with the sinusoidal part changing steadily into a straight line and the spike having a larger gap, resulting in higher %THDi compared to another driver case with brand B. As a result, the obtained %THDi results in Table 3 were also aligned with the current waveform obtained from oscilloscope, as illustrated in Figures 7 and 8.
(a)
Figure 8. Cont.
Energies 2018, 11, 3169 15 of 27Energies 2018, 11, x 15 of 28
(b)
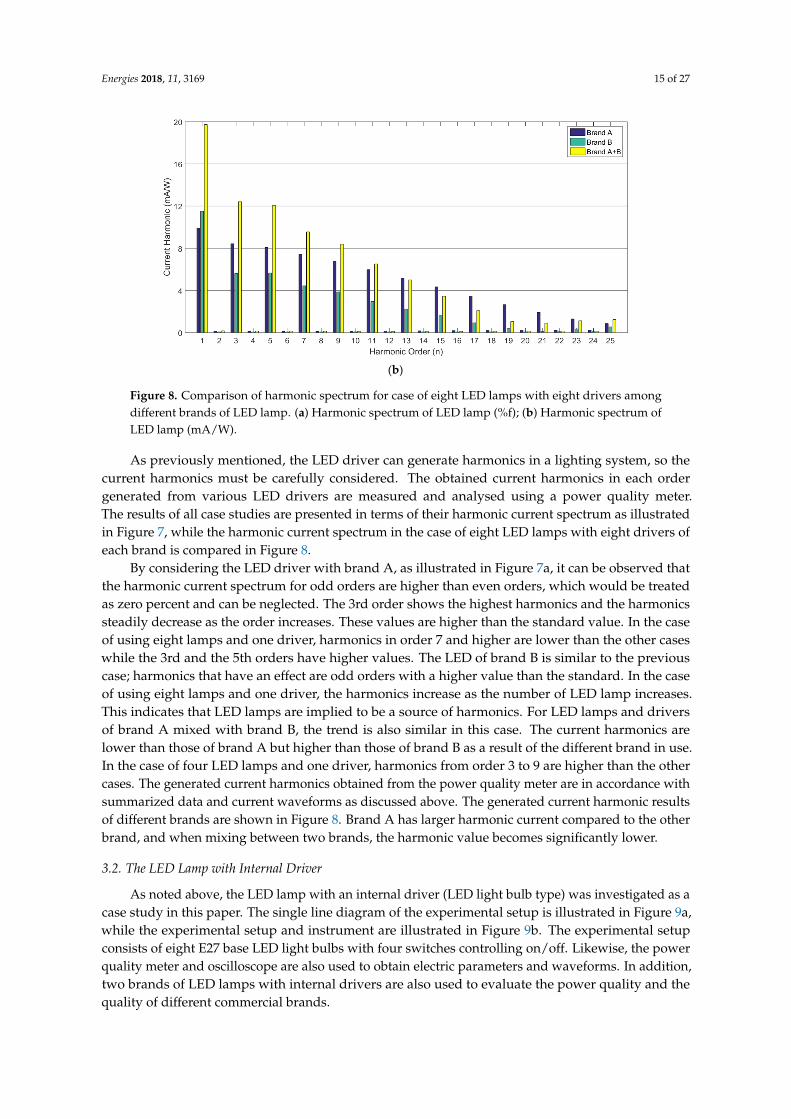
Figure 8. Comparison of harmonic spectrum for case of eight LED lamps with eight drivers among different brands of LED lamp. (a) Harmonic spectrum of LED lamp (%f); (b) Harmonic spectrum of LED lamp (mA/W).
As previously mentioned, the LED driver can generate harmonics in a lighting system, so the current harmonics must be carefully considered. The obtained current harmonics in each order generated from various LED drivers are measured and analysed using a power quality meter. The results of all case studies are presented in terms of their harmonic current spectrum as illustrated in Figure 7, while the harmonic current spectrum in the case of eight LED lamps with eight drivers of each brand is compared in Figure 8.
By considering the LED driver with brand A, as illustrated in Figure 7a, it can be observed that the harmonic current spectrum for odd orders are higher than even orders, which would be treated as zero percent and can be neglected. The 3rd order shows the highest harmonics and the harmonics steadily decrease as the order increases. These values are higher than the standard value. In the case of using eight lamps and one driver, harmonics in order 7 and higher are lower than the other cases while the 3rd and the 5th orders have higher values. The LED of brand B is similar to the previous case; harmonics that have an effect are odd orders with a higher value than the standard. In the case of using eight lamps and one driver, the harmonics increase as the number of LED lamp increases. This indicates that LED lamps are implied to be a source of harmonics. For LED lamps and drivers of brand A mixed with brand B, the trend is also similar in this case. The current harmonics are lower than those of brand A but higher than those of brand B as a result of the different brand in use. In the case of four LED lamps and one driver, harmonics from order 3 to 9 are higher than the other cases. The generated current harmonics obtained from the power quality meter are in accordance with summarized data and current waveforms as discussed above. The generated current harmonic results of different brands are shown in Figure 8. Brand A has larger harmonic current compared to the other brand, and when mixing between two brands, the harmonic value becomes significantly lower.
3.2. The LED Lamp with Internal Driver
As noted above, the LED lamp with an internal driver (LED light bulb type) was investigated as a case study in this paper. The single line diagram of the experimental setup is illustrated in Figure 9a, while the experimental setup and instrument are illustrated in Figure 9b. The experimental setup consists of eight E27 base LED light bulbs with four switches controlling on/off. Likewise, the power quality meter and oscilloscope are also used to obtain electric parameters and waveforms. In addition, two brands of LED lamps with internal drivers are also used to evaluate the power quality and the quality of different commercial brands.
Figure 8. Comparison of harmonic spectrum for case of eight LED lamps with eight drivers amongdifferent brands of LED lamp. (a) Harmonic spectrum of LED lamp (%f); (b) Harmonic spectrum ofLED lamp (mA/W).
As previously mentioned, the LED driver can generate harmonics in a lighting system, so thecurrent harmonics must be carefully considered. The obtained current harmonics in each ordergenerated from various LED drivers are measured and analysed using a power quality meter.The results of all case studies are presented in terms of their harmonic current spectrum as illustratedin Figure 7, while the harmonic current spectrum in the case of eight LED lamps with eight drivers ofeach brand is compared in Figure 8.
By considering the LED driver with brand A, as illustrated in Figure 7a, it can be observed thatthe harmonic current spectrum for odd orders are higher than even orders, which would be treatedas zero percent and can be neglected. The 3rd order shows the highest harmonics and the harmonicssteadily decrease as the order increases. These values are higher than the standard value. In the caseof using eight lamps and one driver, harmonics in order 7 and higher are lower than the other caseswhile the 3rd and the 5th orders have higher values. The LED of brand B is similar to the previouscase; harmonics that have an effect are odd orders with a higher value than the standard. In the caseof using eight lamps and one driver, the harmonics increase as the number of LED lamp increases.This indicates that LED lamps are implied to be a source of harmonics. For LED lamps and driversof brand A mixed with brand B, the trend is also similar in this case. The current harmonics arelower than those of brand A but higher than those of brand B as a result of the different brand in use.In the case of four LED lamps and one driver, harmonics from order 3 to 9 are higher than the othercases. The generated current harmonics obtained from the power quality meter are in accordance withsummarized data and current waveforms as discussed above. The generated current harmonic resultsof different brands are shown in Figure 8. Brand A has larger harmonic current compared to the otherbrand, and when mixing between two brands, the harmonic value becomes significantly lower.
3.2. The LED Lamp with Internal Driver
As noted above, the LED lamp with an internal driver (LED light bulb type) was investigated as acase study in this paper. The single line diagram of the experimental setup is illustrated in Figure 9a,while the experimental setup and instrument are illustrated in Figure 9b. The experimental setupconsists of eight E27 base LED light bulbs with four switches controlling on/off. Likewise, the powerquality meter and oscilloscope are also used to obtain electric parameters and waveforms. In addition,two brands of LED lamps with internal drivers are also used to evaluate the power quality and thequality of different commercial brands.
Energies 2018, 11, 3169 16 of 27
Energies 2018, 11, x 16 of 28
The experimental setup of the two major case studies was carried out in detail as follows: one case study using only brand C, and a second using only brand D. By considering the first major case study, the experimental setup with only brand C is also divided into four case studies: one LED lamp, two LED lamps, four LED lamps, and eight LED lamps. The same set up is used for the brand D case study.
(a)
(b)
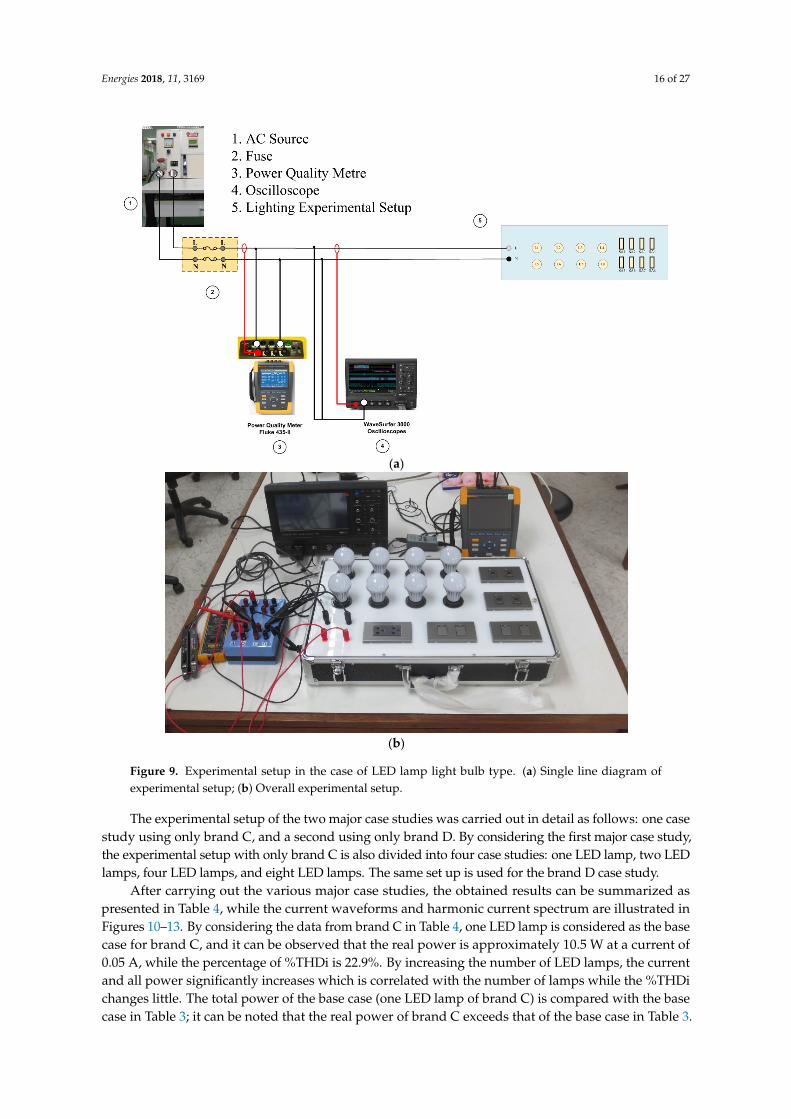
Figure 9. Experimental setup in the case of LED lamp light bulb type. (a) Single line diagram of experimental setup; (b) Overall experimental setup.
After carrying out the various major case studies, the obtained results can be summarized as presented in Table 4, while the current waveforms and harmonic current spectrum are illustrated in Figures 10–13. By considering the data from brand C in Table 4, one LED lamp is considered as the base case for brand C, and it can be observed that the real power is approximately 10.5 W at a current of 0.05 A, while the percentage of %THDi is 22.9%. By increasing the number of LED lamps, the current and all power significantly increases which is correlated with the number of lamps while the %THDi changes little. The total power of the base case (one LED lamp of brand C) is compared with the base case in Table 3; it can be noted that the real power of brand C exceeds that of the base case
Figure 9. Experimental setup in the case of LED lamp light bulb type. (a) Single line diagram ofexperimental setup; (b) Overall experimental setup.
The experimental setup of the two major case studies was carried out in detail as follows: one casestudy using only brand C, and a second using only brand D. By considering the first major case study,the experimental setup with only brand C is also divided into four case studies: one LED lamp, two LEDlamps, four LED lamps, and eight LED lamps. The same set up is used for the brand D case study.
After carrying out the various major case studies, the obtained results can be summarized aspresented in Table 4, while the current waveforms and harmonic current spectrum are illustrated inFigures 10–13. By considering the data from brand C in Table 4, one LED lamp is considered as the basecase for brand C, and it can be observed that the real power is approximately 10.5 W at a current of0.05 A, while the percentage of %THDi is 22.9%. By increasing the number of LED lamps, the currentand all power significantly increases which is correlated with the number of lamps while the %THDichanges little. The total power of the base case (one LED lamp of brand C) is compared with the basecase in Table 3; it can be noted that the real power of brand C exceeds that of the base case in Table 3.
Energies 2018, 11, 3169 17 of 27
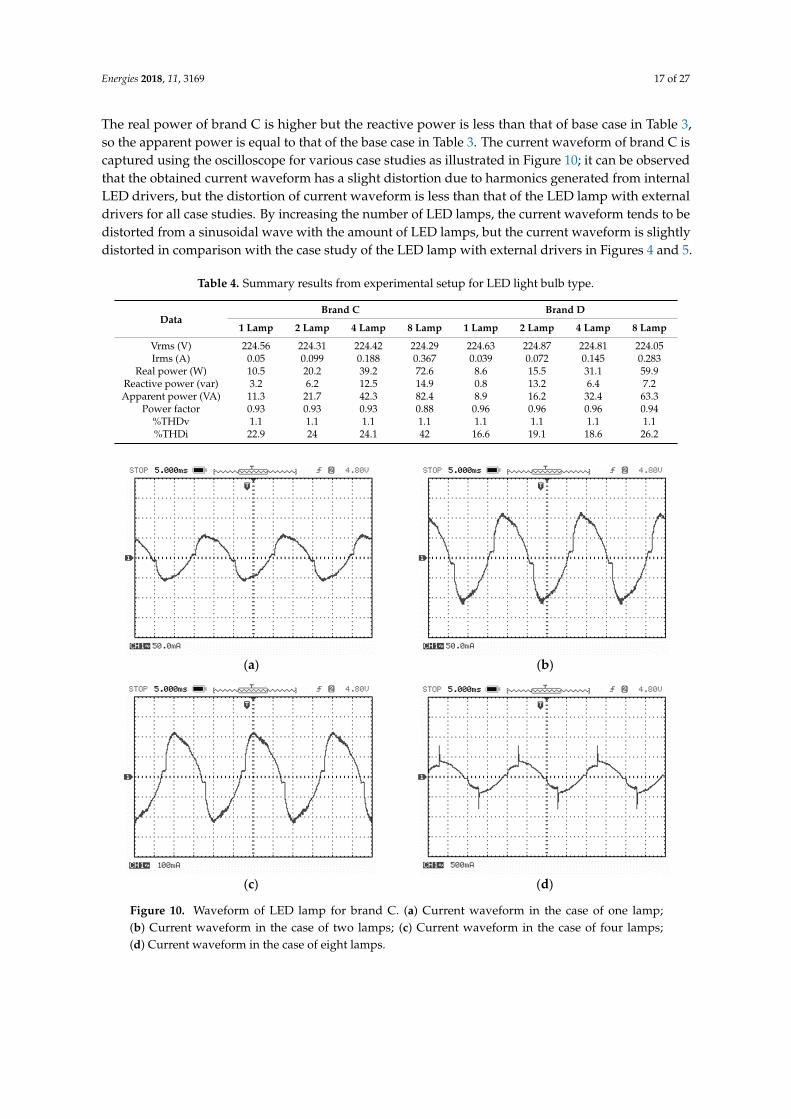
The real power of brand C is higher but the reactive power is less than that of base case in Table 3,so the apparent power is equal to that of the base case in Table 3. The current waveform of brand C iscaptured using the oscilloscope for various case studies as illustrated in Figure 10; it can be observedthat the obtained current waveform has a slight distortion due to harmonics generated from internalLED drivers, but the distortion of current waveform is less than that of the LED lamp with externaldrivers for all case studies. By increasing the number of LED lamps, the current waveform tends to bedistorted from a sinusoidal wave with the amount of LED lamps, but the current waveform is slightlydistorted in comparison with the case study of the LED lamp with external drivers in Figures 4 and 5.
Table 4. Summary results from experimental setup for LED light bulb type.
in Table 3. The real power of brand C is higher but the reactive power is less than that of base case in Table 3, so the apparent power is equal to that of the base case in Table 3. The current waveform of brand C is captured using the oscilloscope for various case studies as illustrated in Figure 10; it can be observed that the obtained current waveform has a slight distortion due to harmonics generated from internal LED drivers, but the distortion of current waveform is less than that of the LED lamp with external drivers for all case studies. By increasing the number of LED lamps, the current waveform tends to be distorted from a sinusoidal wave with the amount of LED lamps, but the current waveform is slightly distorted in comparison with the case study of the LED lamp with external drivers in Figures 4 and 5.
Table 4. Summary results from experimental setup for LED light bulb type.
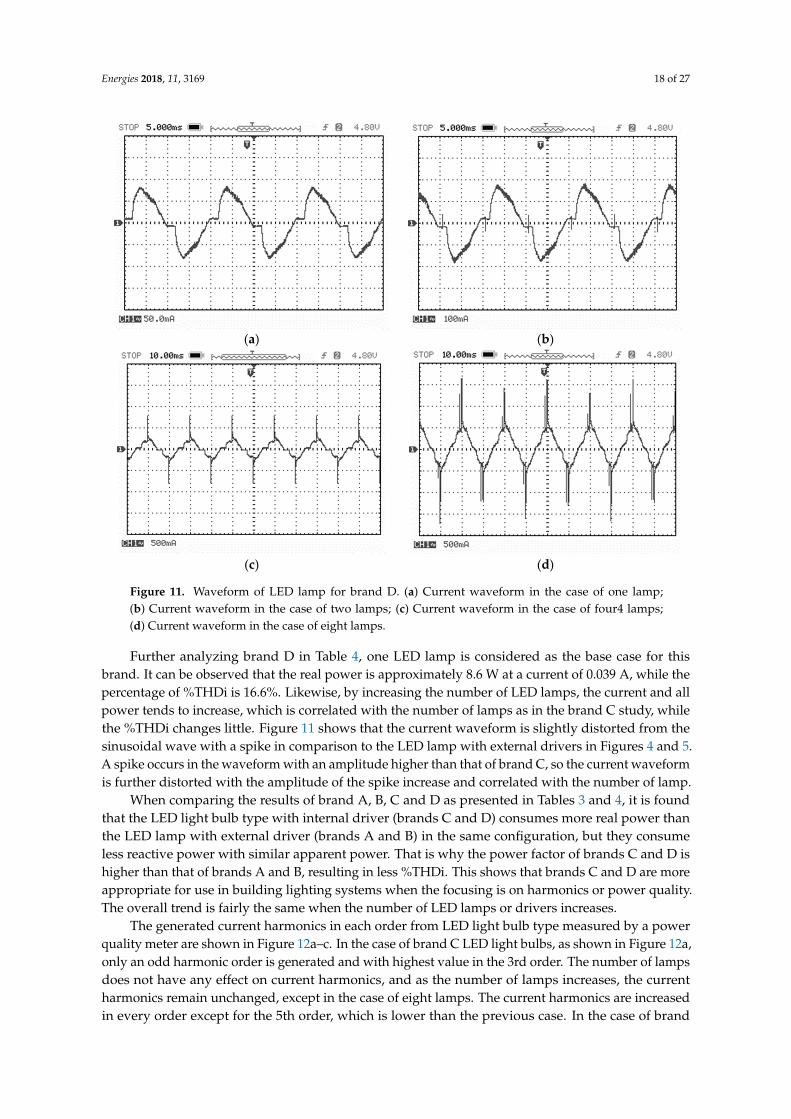
Further analyzing brand D in Table 4, one LED lamp is considered as the base case for this brand. It can be observed that the real power is approximately 8.6 W at a current of 0.039 A, while the percentage of %THDi is 16.6%. Likewise, by increasing the number of LED lamps, the current and all power tends to increase, which is correlated with the number of lamps as in the brand C study, while the %THDi changes little. Figure 11 shows that the current waveform is slightly distorted from the sinusoidal wave with a spike in comparison to the LED lamp with external drivers in Figures 4 and 5. A spike occurs in the waveform with an amplitude higher than that of brand C, so the current waveform is further distorted with the amplitude of the spike increase and correlated with the number of lamp.
(a) (b)
Energies 2018, 11, x 18 of 28
(c) (d)
Figure 10. Waveform of LED lamp for brand C. (a) Current waveform in the case of one lamp; (b) Current waveform in the case of two lamps; (c) Current waveform in the case of four lamps; (d) Current waveform in the case of eight lamps.
(a) (b)
(c) (d)
Figure 11. Waveform of LED lamp for brand D. (a) Current waveform in the case of one lamp; (b) Current waveform in the case of two lamps; (c) Current waveform in the case of four4 lamps; (d) Current waveform in the case of eight lamps.
When comparing the results of brand A, B, C and D as presented in Tables 3 and 4, it is found that the LED light bulb type with internal driver (brands C and D) consumes more real power than the LED lamp with external driver (brands A and B) in the same configuration, but they consume less reactive power with similar apparent power. That is why the power factor of brands C and D is higher than that of brands A and B, resulting in less %THDi. This shows that brands C and D are more appropriate for use in building lighting systems when the focusing is on harmonics or power quality. The overall trend is fairly the same when the number of LED lamps or drivers increases.
Figure 10. Waveform of LED lamp for brand C. (a) Current waveform in the case of one lamp;(b) Current waveform in the case of two lamps; (c) Current waveform in the case of four lamps;(d) Current waveform in the case of eight lamps.
Energies 2018, 11, 3169 18 of 27
Energies 2018, 11, x 18 of 28
(c) (d)
Figure 10. Waveform of LED lamp for brand C. (a) Current waveform in the case of one lamp; (b) Current waveform in the case of two lamps; (c) Current waveform in the case of four lamps; (d) Current waveform in the case of eight lamps.
(a) (b)
(c) (d)
Figure 11. Waveform of LED lamp for brand D. (a) Current waveform in the case of one lamp; (b) Current waveform in the case of two lamps; (c) Current waveform in the case of four4 lamps; (d) Current waveform in the case of eight lamps.
When comparing the results of brand A, B, C and D as presented in Tables 3 and 4, it is found that the LED light bulb type with internal driver (brands C and D) consumes more real power than the LED lamp with external driver (brands A and B) in the same configuration, but they consume less reactive power with similar apparent power. That is why the power factor of brands C and D is higher than that of brands A and B, resulting in less %THDi. This shows that brands C and D are more appropriate for use in building lighting systems when the focusing is on harmonics or power quality. The overall trend is fairly the same when the number of LED lamps or drivers increases.
Figure 11. Waveform of LED lamp for brand D. (a) Current waveform in the case of one lamp;(b) Current waveform in the case of two lamps; (c) Current waveform in the case of four4 lamps;(d) Current waveform in the case of eight lamps.
Further analyzing brand D in Table 4, one LED lamp is considered as the base case for thisbrand. It can be observed that the real power is approximately 8.6 W at a current of 0.039 A, while thepercentage of %THDi is 16.6%. Likewise, by increasing the number of LED lamps, the current and allpower tends to increase, which is correlated with the number of lamps as in the brand C study, whilethe %THDi changes little. Figure 11 shows that the current waveform is slightly distorted from thesinusoidal wave with a spike in comparison to the LED lamp with external drivers in Figures 4 and 5.A spike occurs in the waveform with an amplitude higher than that of brand C, so the current waveformis further distorted with the amplitude of the spike increase and correlated with the number of lamp.
When comparing the results of brand A, B, C and D as presented in Tables 3 and 4, it is foundthat the LED light bulb type with internal driver (brands C and D) consumes more real power thanthe LED lamp with external driver (brands A and B) in the same configuration, but they consumeless reactive power with similar apparent power. That is why the power factor of brands C and D ishigher than that of brands A and B, resulting in less %THDi. This shows that brands C and D are moreappropriate for use in building lighting systems when the focusing is on harmonics or power quality.The overall trend is fairly the same when the number of LED lamps or drivers increases.
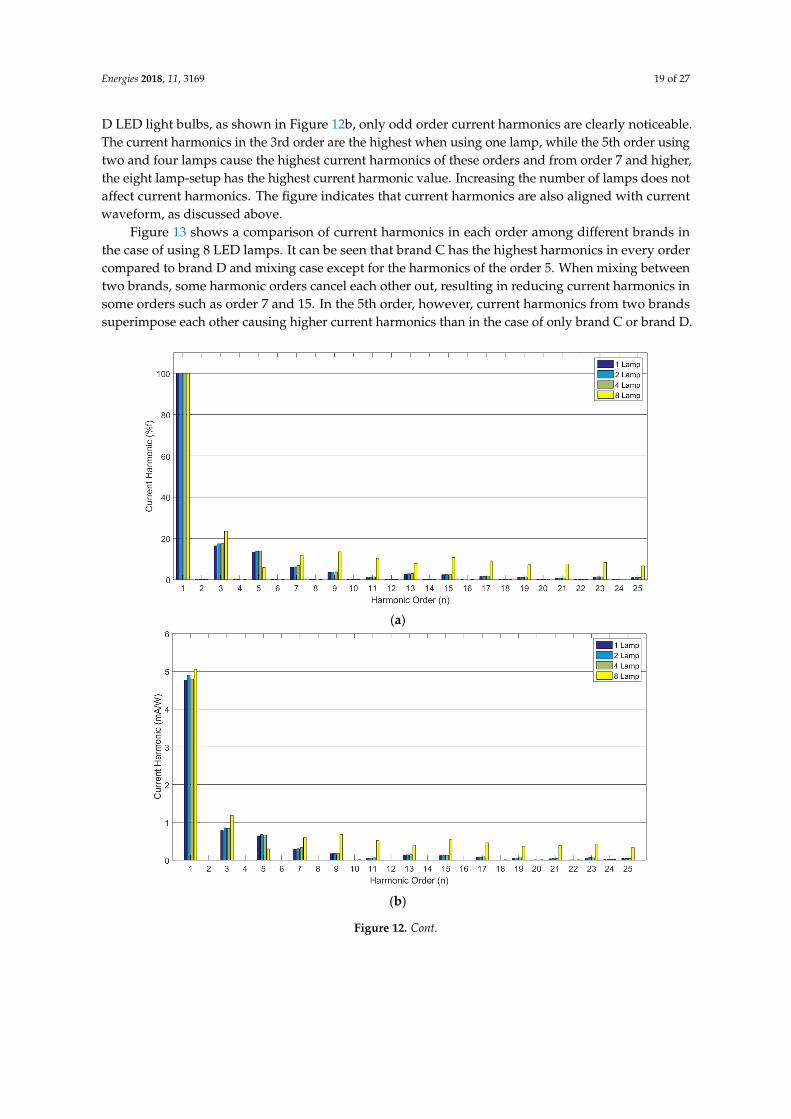
The generated current harmonics in each order from LED light bulb type measured by a powerquality meter are shown in Figure 12a–c. In the case of brand C LED light bulbs, as shown in Figure 12a,only an odd harmonic order is generated and with highest value in the 3rd order. The number of lampsdoes not have any effect on current harmonics, and as the number of lamps increases, the currentharmonics remain unchanged, except in the case of eight lamps. The current harmonics are increasedin every order except for the 5th order, which is lower than the previous case. In the case of brand
Energies 2018, 11, 3169 19 of 27
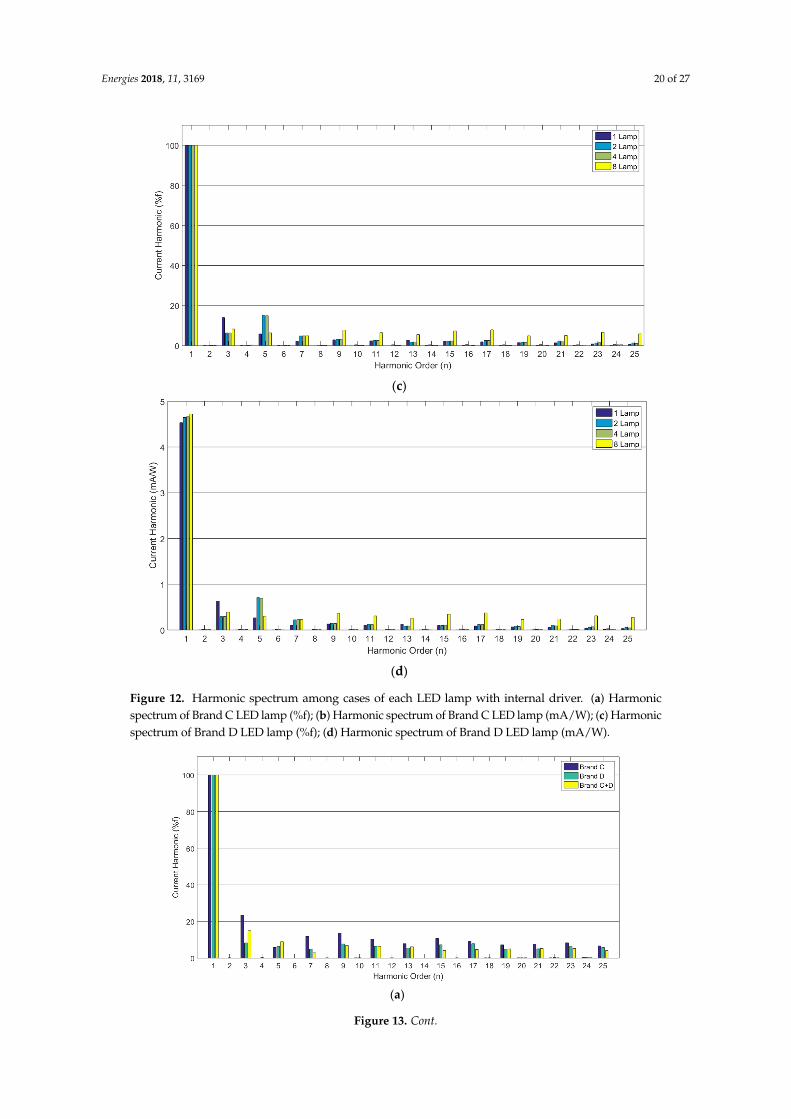
D LED light bulbs, as shown in Figure 12b, only odd order current harmonics are clearly noticeable.The current harmonics in the 3rd order are the highest when using one lamp, while the 5th order usingtwo and four lamps cause the highest current harmonics of these orders and from order 7 and higher,the eight lamp-setup has the highest current harmonic value. Increasing the number of lamps does notaffect current harmonics. The figure indicates that current harmonics are also aligned with currentwaveform, as discussed above.
Figure 13 shows a comparison of current harmonics in each order among different brands inthe case of using 8 LED lamps. It can be seen that brand C has the highest harmonics in every ordercompared to brand D and mixing case except for the harmonics of the order 5. When mixing betweentwo brands, some harmonic orders cancel each other out, resulting in reducing current harmonics insome orders such as order 7 and 15. In the 5th order, however, current harmonics from two brandssuperimpose each other causing higher current harmonics than in the case of only brand C or brand D.
Energies 2018, 11, x 19 of 28
The generated current harmonics in each order from LED light bulb type measured by a power quality meter are shown in Figure 12a–c. In the case of brand C LED light bulbs, as shown in Figure 12a, only an odd harmonic order is generated and with highest value in the 3rd order. The number of lamps does not have any effect on current harmonics, and as the number of lamps increases, the current harmonics remain unchanged, except in the case of eight lamps. The current harmonics are increased in every order except for the 5th order, which is lower than the previous case. In the case of brand D LED light bulbs, as shown in Figure 12b, only odd order current harmonics are clearly noticeable. The current harmonics in the 3rd order are the highest when using one lamp, while the 5th order using two and four lamps cause the highest current harmonics of these orders and from order 7 and higher, the eight lamp-setup has the highest current harmonic value. Increasing the number of lamps does not affect current harmonics. The figure indicates that current harmonics are also aligned with current waveform, as discussed above.
Figure 13 shows a comparison of current harmonics in each order among different brands in the case of using 8 LED lamps. It can be seen that brand C has the highest harmonics in every order compared to brand D and mixing case except for the harmonics of the order 5. When mixing between two brands, some harmonic orders cancel each other out, resulting in reducing current harmonics in some orders such as order 7 and 15. In the 5th order, however, current harmonics from two brands superimpose each other causing higher current harmonics than in the case of only brand C or brand D.
(a)
(b)
Figure 12. Cont.
Energies 2018, 11, 3169 20 of 27
Energies 2018, 11, x 20 of 28
(c)
(d)
Figure 12. Harmonic spectrum among cases of each LED lamp with internal driver. (a) Harmonic spectrum of Brand C LED lamp (%f); (b) Harmonic spectrum of Brand C LED lamp (mA/W); (c) Harmonic spectrum of Brand D LED lamp (%f); (d) Harmonic spectrum of Brand D LED lamp (mA/W).
(a)
Figure 12. Harmonic spectrum among cases of each LED lamp with internal driver. (a) Harmonicspectrum of Brand C LED lamp (%f); (b) Harmonic spectrum of Brand C LED lamp (mA/W); (c) Harmonicspectrum of Brand D LED lamp (%f); (d) Harmonic spectrum of Brand D LED lamp (mA/W).
Energies 2018, 11, x 20 of 28
(c)
(d)
Figure 12. Harmonic spectrum among cases of each LED lamp with internal driver. (a) Harmonic spectrum of Brand C LED lamp (%f); (b) Harmonic spectrum of Brand C LED lamp (mA/W); (c) Harmonic spectrum of Brand D LED lamp (%f); (d) Harmonic spectrum of Brand D LED lamp (mA/W).
(a)
Figure 13. Cont.
Energies 2018, 11, 3169 21 of 27Energies 2018, 11, x 21 of 28
(b)
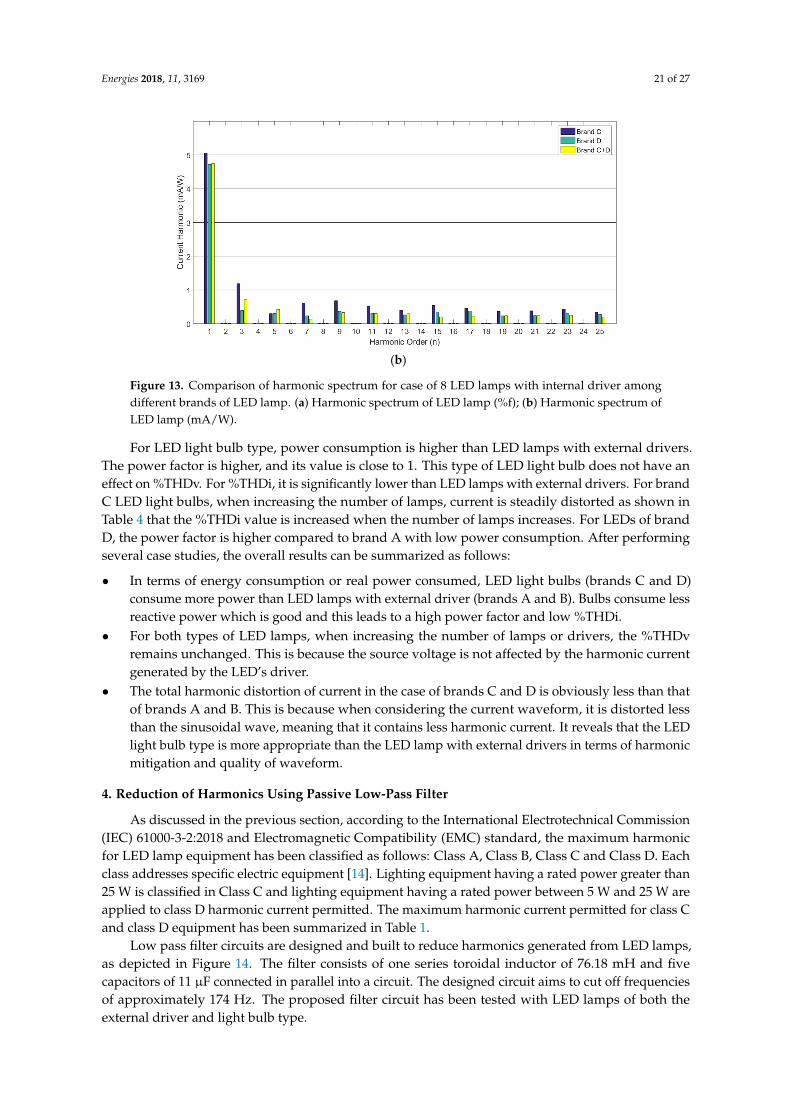
Figure 13. Comparison of harmonic spectrum for case of 8 LED lamps with internal driver among different brands of LED lamp. (a) Harmonic spectrum of LED lamp (%f); (b) Harmonic spectrum of LED lamp (mA/W).
For LED light bulb type, power consumption is higher than LED lamps with external drivers. The power factor is higher, and its value is close to 1. This type of LED light bulb does not have an effect on %THDv. For %THDi, it is significantly lower than LED lamps with external drivers. For brand C LED light bulbs, when increasing the number of lamps, current is steadily distorted as shown in Table 4 that the %THDi value is increased when the number of lamps increases. For LEDs of brand D, the power factor is higher compared to brand A with low power consumption. After performing several case studies, the overall results can be summarized as follows:
• In terms of energy consumption or real power consumed, LED light bulbs (brands C and D) consume more power than LED lamps with external driver (brands A and B). Bulbs consume less reactive power which is good and this leads to a high power factor and low %THDi.
• For both types of LED lamps, when increasing the number of lamps or drivers, the %THDv remains unchanged. This is because the source voltage is not affected by the harmonic current generated by the LED’s driver.
• The total harmonic distortion of current in the case of brands C and D is obviously less than that of brands A and B. This is because when considering the current waveform, it is distorted less than the sinusoidal wave, meaning that it contains less harmonic current. It reveals that the LED light bulb type is more appropriate than the LED lamp with external drivers in terms of harmonic mitigation and quality of waveform.
4. Reduction of Harmonics Using Passive Low-Pass Filter
As discussed in the previous section, according to the International Electrotechnical Commission (IEC) 61000-3-2:2018 and Electromagnetic Compatibility (EMC) standard, the maximum harmonic for LED lamp equipment has been classified as follows: Class A, Class B, Class C and Class D. Each class addresses specific electric equipment [14]. Lighting equipment having a rated power greater than 25 W is classified in Class C and lighting equipment having a rated power between 5 W and 25 W are applied to class D harmonic current permitted. The maximum harmonic current permitted for class C and class D equipment has been summarized in Table 1.
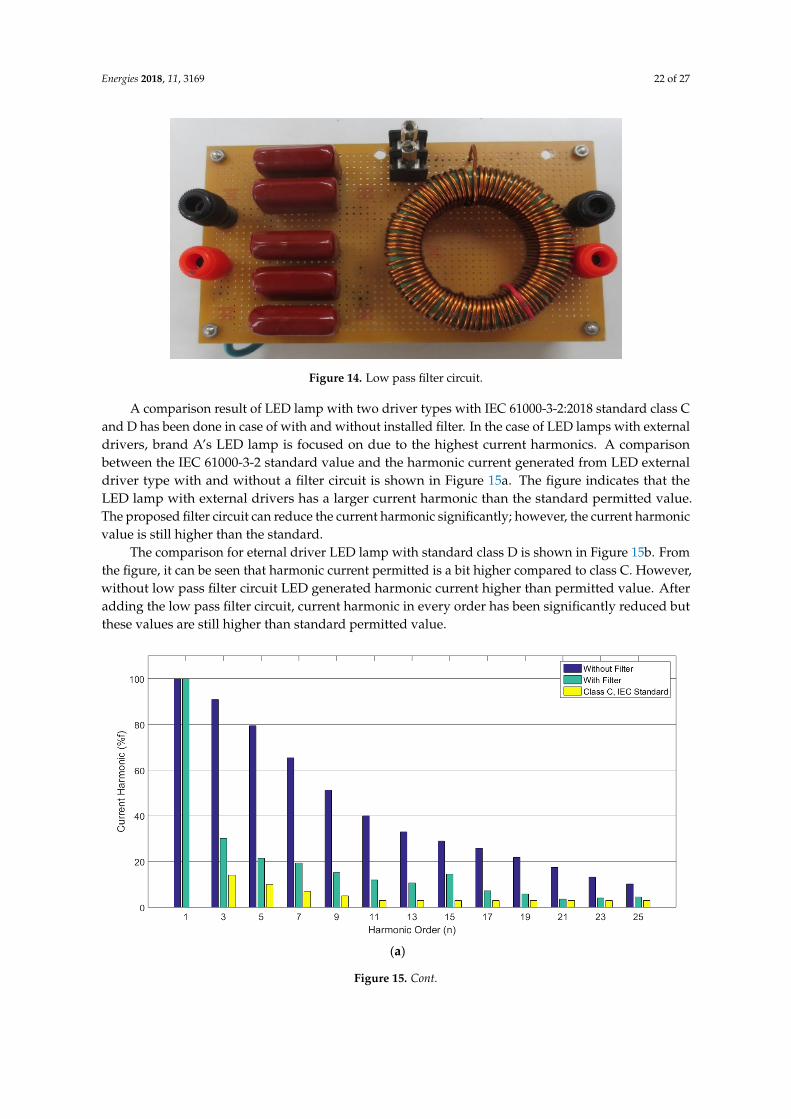
Low pass filter circuits are designed and built to reduce harmonics generated from LED lamps, as depicted in Figure 14. The filter consists of one series toroidal inductor of 76.18 mH and five capacitors of 11 μF connected in parallel into a circuit. The designed circuit aims to cut off frequencies of approximately 174 Hz. The proposed filter circuit has been tested with LED lamps of both the external driver and light bulb type.
Figure 13. Comparison of harmonic spectrum for case of 8 LED lamps with internal driver amongdifferent brands of LED lamp. (a) Harmonic spectrum of LED lamp (%f); (b) Harmonic spectrum ofLED lamp (mA/W).
For LED light bulb type, power consumption is higher than LED lamps with external drivers.The power factor is higher, and its value is close to 1. This type of LED light bulb does not have aneffect on %THDv. For %THDi, it is significantly lower than LED lamps with external drivers. For brandC LED light bulbs, when increasing the number of lamps, current is steadily distorted as shown inTable 4 that the %THDi value is increased when the number of lamps increases. For LEDs of brandD, the power factor is higher compared to brand A with low power consumption. After performingseveral case studies, the overall results can be summarized as follows:
• In terms of energy consumption or real power consumed, LED light bulbs (brands C and D)consume more power than LED lamps with external driver (brands A and B). Bulbs consume lessreactive power which is good and this leads to a high power factor and low %THDi.
• For both types of LED lamps, when increasing the number of lamps or drivers, the %THDvremains unchanged. This is because the source voltage is not affected by the harmonic currentgenerated by the LED’s driver.
• The total harmonic distortion of current in the case of brands C and D is obviously less than thatof brands A and B. This is because when considering the current waveform, it is distorted lessthan the sinusoidal wave, meaning that it contains less harmonic current. It reveals that the LEDlight bulb type is more appropriate than the LED lamp with external drivers in terms of harmonicmitigation and quality of waveform.
4. Reduction of Harmonics Using Passive Low-Pass Filter
As discussed in the previous section, according to the International Electrotechnical Commission(IEC) 61000-3-2:2018 and Electromagnetic Compatibility (EMC) standard, the maximum harmonicfor LED lamp equipment has been classified as follows: Class A, Class B, Class C and Class D. Eachclass addresses specific electric equipment [14]. Lighting equipment having a rated power greater than25 W is classified in Class C and lighting equipment having a rated power between 5 W and 25 W areapplied to class D harmonic current permitted. The maximum harmonic current permitted for class Cand class D equipment has been summarized in Table 1.
Low pass filter circuits are designed and built to reduce harmonics generated from LED lamps,as depicted in Figure 14. The filter consists of one series toroidal inductor of 76.18 mH and fivecapacitors of 11 µF connected in parallel into a circuit. The designed circuit aims to cut off frequenciesof approximately 174 Hz. The proposed filter circuit has been tested with LED lamps of both theexternal driver and light bulb type.
Energies 2018, 11, 3169 22 of 27
Energies 2018, 11, x 22 of 28
Figure 14. Low pass filter circuit.
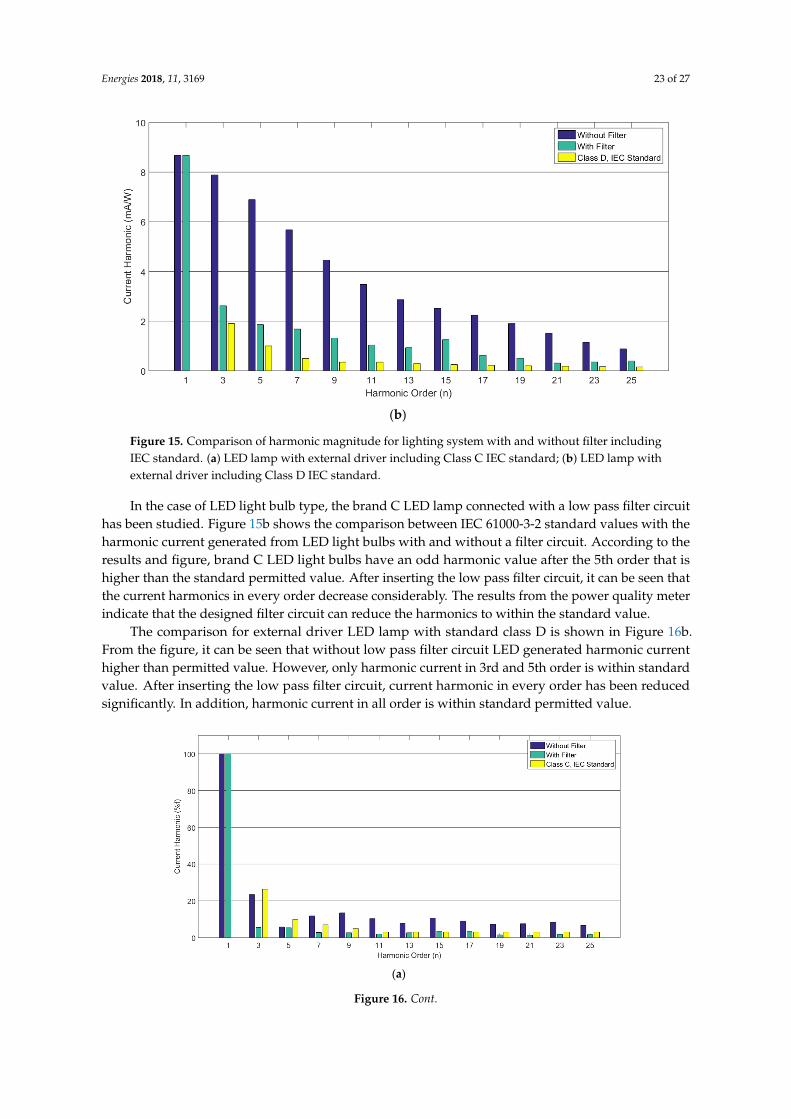
A comparison result of LED lamp with two driver types with IEC 61000-3-2:2018 standard class C and D has been done in case of with and without installed filter. In the case of LED lamps with external drivers, brand A’s LED lamp is focused on due to the highest current harmonics. A comparison between the IEC 61000-3-2 standard value and the harmonic current generated from LED external driver type with and without a filter circuit is shown in Figure 15a. The figure indicates that the LED lamp with external drivers has a larger current harmonic than the standard permitted value. The proposed filter circuit can reduce the current harmonic significantly; however, the current harmonic value is still higher than the standard.
The comparison for eternal driver LED lamp with standard class D is shown in Figure 15b. From the figure, it can be seen that harmonic current permitted is a bit higher compared to class C. However, without low pass filter circuit LED generated harmonic current higher than permitted value. After adding the low pass filter circuit, current harmonic in every order has been significantly reduced but these values are still higher than standard permitted value.
(a)
Figure 14. Low pass filter circuit.
A comparison result of LED lamp with two driver types with IEC 61000-3-2:2018 standard class Cand D has been done in case of with and without installed filter. In the case of LED lamps with externaldrivers, brand A’s LED lamp is focused on due to the highest current harmonics. A comparisonbetween the IEC 61000-3-2 standard value and the harmonic current generated from LED externaldriver type with and without a filter circuit is shown in Figure 15a. The figure indicates that theLED lamp with external drivers has a larger current harmonic than the standard permitted value.The proposed filter circuit can reduce the current harmonic significantly; however, the current harmonicvalue is still higher than the standard.
The comparison for eternal driver LED lamp with standard class D is shown in Figure 15b. Fromthe figure, it can be seen that harmonic current permitted is a bit higher compared to class C. However,without low pass filter circuit LED generated harmonic current higher than permitted value. Afteradding the low pass filter circuit, current harmonic in every order has been significantly reduced butthese values are still higher than standard permitted value.
Energies 2018, 11, x 22 of 28
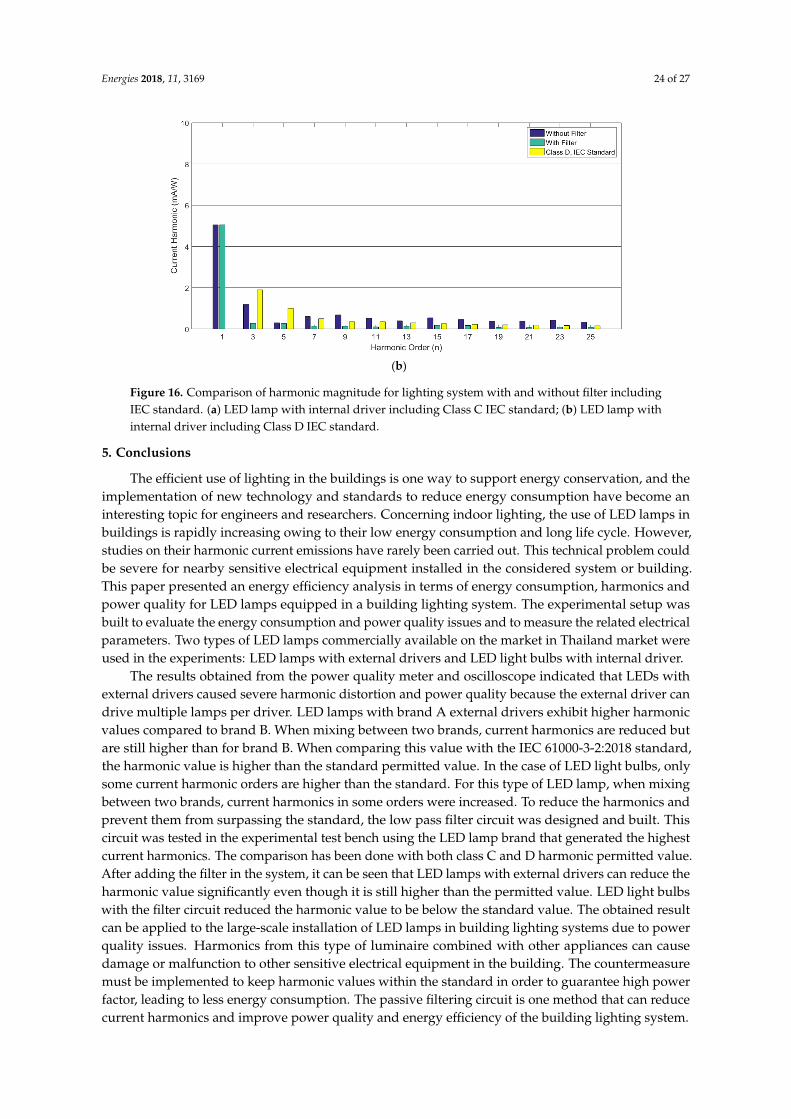
Figure 14. Low pass filter circuit.
A comparison result of LED lamp with two driver types with IEC 61000-3-2:2018 standard class C and D has been done in case of with and without installed filter. In the case of LED lamps with external drivers, brand A’s LED lamp is focused on due to the highest current harmonics. A comparison between the IEC 61000-3-2 standard value and the harmonic current generated from LED external driver type with and without a filter circuit is shown in Figure 15a. The figure indicates that the LED lamp with external drivers has a larger current harmonic than the standard permitted value. The proposed filter circuit can reduce the current harmonic significantly; however, the current harmonic value is still higher than the standard.
The comparison for eternal driver LED lamp with standard class D is shown in Figure 15b. From the figure, it can be seen that harmonic current permitted is a bit higher compared to class C. However, without low pass filter circuit LED generated harmonic current higher than permitted value. After adding the low pass filter circuit, current harmonic in every order has been significantly reduced but these values are still higher than standard permitted value.
(a)
Figure 15. Cont.
Energies 2018, 11, 3169 23 of 27Energies 2018, 11, x 23 of 28
(b)
Figure 15. Comparison of harmonic magnitude for lighting system with and without filter including IEC standard. (a) LED lamp with external driver including Class C IEC standard; (b) LED lamp with external driver including Class D IEC standard.
In the case of LED light bulb type, the brand C LED lamp connected with a low pass filter circuit has been studied. Figure 15b shows the comparison between IEC 61000-3-2 standard values with the harmonic current generated from LED light bulbs with and without a filter circuit. According to the results and figure, brand C LED light bulbs have an odd harmonic value after the 5th order that is higher than the standard permitted value. After inserting the low pass filter circuit, it can be seen that the current harmonics in every order decrease considerably. The results from the power quality meter indicate that the designed filter circuit can reduce the harmonics to within the standard value.
The comparison for external driver LED lamp with standard class D is shown in Figure 16b. From the figure, it can be seen that without low pass filter circuit LED generated harmonic current higher than permitted value. However, only harmonic current in 3rd and 5th order is within standard value. After inserting the low pass filter circuit, current harmonic in every order has been reduced significantly. In addition, harmonic current in all order is within standard permitted value.
(a)
Figure 15. Comparison of harmonic magnitude for lighting system with and without filter includingIEC standard. (a) LED lamp with external driver including Class C IEC standard; (b) LED lamp withexternal driver including Class D IEC standard.
In the case of LED light bulb type, the brand C LED lamp connected with a low pass filter circuithas been studied. Figure 15b shows the comparison between IEC 61000-3-2 standard values with theharmonic current generated from LED light bulbs with and without a filter circuit. According to theresults and figure, brand C LED light bulbs have an odd harmonic value after the 5th order that ishigher than the standard permitted value. After inserting the low pass filter circuit, it can be seen thatthe current harmonics in every order decrease considerably. The results from the power quality meterindicate that the designed filter circuit can reduce the harmonics to within the standard value.
The comparison for external driver LED lamp with standard class D is shown in Figure 16b.From the figure, it can be seen that without low pass filter circuit LED generated harmonic currenthigher than permitted value. However, only harmonic current in 3rd and 5th order is within standardvalue. After inserting the low pass filter circuit, current harmonic in every order has been reducedsignificantly. In addition, harmonic current in all order is within standard permitted value.
Energies 2018, 11, x 23 of 28
(b)
Figure 15. Comparison of harmonic magnitude for lighting system with and without filter including IEC standard. (a) LED lamp with external driver including Class C IEC standard; (b) LED lamp with external driver including Class D IEC standard.
In the case of LED light bulb type, the brand C LED lamp connected with a low pass filter circuit has been studied. Figure 15b shows the comparison between IEC 61000-3-2 standard values with the harmonic current generated from LED light bulbs with and without a filter circuit. According to the results and figure, brand C LED light bulbs have an odd harmonic value after the 5th order that is higher than the standard permitted value. After inserting the low pass filter circuit, it can be seen that the current harmonics in every order decrease considerably. The results from the power quality meter indicate that the designed filter circuit can reduce the harmonics to within the standard value.
The comparison for external driver LED lamp with standard class D is shown in Figure 16b. From the figure, it can be seen that without low pass filter circuit LED generated harmonic current higher than permitted value. However, only harmonic current in 3rd and 5th order is within standard value. After inserting the low pass filter circuit, current harmonic in every order has been reduced significantly. In addition, harmonic current in all order is within standard permitted value.
(a)
Figure 16. Cont.
Energies 2018, 11, 3169 24 of 27
Energies 2018, 11, x 24 of 28
(b)
Figure 16. Comparison of harmonic magnitude for lighting system with and without filter including IEC standard. (a) LED lamp with internal driver including Class C IEC standard; (b) LED lamp with internal driver including Class D IEC standard.
5. Conclusions
The efficient use of lighting in the buildings is one way to support energy conservation, and the implementation of new technology and standards to reduce energy consumption have become an interesting topic for engineers and researchers. Concerning indoor lighting, the use of LED lamps in buildings is rapidly increasing owing to their low energy consumption and long life cycle. However, studies on their harmonic current emissions have rarely been carried out. This technical problem could be severe for nearby sensitive electrical equipment installed in the considered system or building. This paper presented an energy efficiency analysis in terms of energy consumption, harmonics and power quality for LED lamps equipped in a building lighting system. The experimental setup was built to evaluate the energy consumption and power quality issues and to measure the related electrical parameters. Two types of LED lamps commercially available on the market in Thailand market were used in the experiments: LED lamps with external drivers and LED light bulbs with internal driver.
The results obtained from the power quality meter and oscilloscope indicated that LEDs with external drivers caused severe harmonic distortion and power quality because the external driver can drive multiple lamps per driver. LED lamps with brand A external drivers exhibit higher harmonic values compared to brand B. When mixing between two brands, current harmonics are reduced but are still higher than for brand B. When comparing this value with the IEC 61000-3-2:2018 standard, the harmonic value is higher than the standard permitted value. In the case of LED light bulbs, only some current harmonic orders are higher than the standard. For this type of LED lamp, when mixing between two brands, current harmonics in some orders were increased. To reduce the harmonics and prevent them from surpassing the standard, the low pass filter circuit was designed and built. This circuit was tested in the experimental test bench using the LED lamp brand that generated the highest current harmonics. The comparison has been done with both class C and D harmonic permitted value. After adding the filter in the system, it can be seen that LED lamps with external drivers can reduce the harmonic value significantly even though it is still higher than the permitted value. LED light bulbs with the filter circuit reduced the harmonic value to be below the standard value. The obtained result can be applied to the large-scale installation of LED lamps in building lighting systems due to power quality issues. Harmonics from this type of luminaire combined with other appliances can cause damage or malfunction to other sensitive electrical equipment in the building. The countermeasure must be implemented to keep harmonic values within the standard in order to guarantee high power factor, leading to less energy consumption. The passive filtering circuit is one
Figure 16. Comparison of harmonic magnitude for lighting system with and without filter includingIEC standard. (a) LED lamp with internal driver including Class C IEC standard; (b) LED lamp withinternal driver including Class D IEC standard.
5. Conclusions
The efficient use of lighting in the buildings is one way to support energy conservation, and theimplementation of new technology and standards to reduce energy consumption have become aninteresting topic for engineers and researchers. Concerning indoor lighting, the use of LED lamps inbuildings is rapidly increasing owing to their low energy consumption and long life cycle. However,studies on their harmonic current emissions have rarely been carried out. This technical problem couldbe severe for nearby sensitive electrical equipment installed in the considered system or building.This paper presented an energy efficiency analysis in terms of energy consumption, harmonics andpower quality for LED lamps equipped in a building lighting system. The experimental setup wasbuilt to evaluate the energy consumption and power quality issues and to measure the related electricalparameters. Two types of LED lamps commercially available on the market in Thailand market wereused in the experiments: LED lamps with external drivers and LED light bulbs with internal driver.
The results obtained from the power quality meter and oscilloscope indicated that LEDs withexternal drivers caused severe harmonic distortion and power quality because the external driver candrive multiple lamps per driver. LED lamps with brand A external drivers exhibit higher harmonicvalues compared to brand B. When mixing between two brands, current harmonics are reduced butare still higher than for brand B. When comparing this value with the IEC 61000-3-2:2018 standard,the harmonic value is higher than the standard permitted value. In the case of LED light bulbs, onlysome current harmonic orders are higher than the standard. For this type of LED lamp, when mixingbetween two brands, current harmonics in some orders were increased. To reduce the harmonics andprevent them from surpassing the standard, the low pass filter circuit was designed and built. Thiscircuit was tested in the experimental test bench using the LED lamp brand that generated the highestcurrent harmonics. The comparison has been done with both class C and D harmonic permitted value.After adding the filter in the system, it can be seen that LED lamps with external drivers can reduce theharmonic value significantly even though it is still higher than the permitted value. LED light bulbswith the filter circuit reduced the harmonic value to be below the standard value. The obtained resultcan be applied to the large-scale installation of LED lamps in building lighting systems due to powerquality issues. Harmonics from this type of luminaire combined with other appliances can causedamage or malfunction to other sensitive electrical equipment in the building. The countermeasuremust be implemented to keep harmonic values within the standard in order to guarantee high powerfactor, leading to less energy consumption. The passive filtering circuit is one method that can reducecurrent harmonics and improve power quality and energy efficiency of the building lighting system.
Funding: The work presented in this paper is part of a research project (No. 2558A11802136) sponsored by theKing Mongkut’s Institute of Technology Ladkrabang Research Fund. The author would like to thank them for thefinancial support.
Acknowledgments: The work presented in this paper is part of a research project sponsored (No. 2558A11802136)by the National Research Council of Thailand and the King Mongkut’s Institute of Technology LadkrabangResearch Fund. The authors would like to thank them for their financial support.
Conflicts of Interest: The authors declare no conflict of interest.
References
1. Geller, H.; Harrington, P.; Rosenfeld, A.H.; Tanishima, S.; Unander, F. Polices for increasing energy efficiency:Thirty years of experience in OECD countries. Energy Policy 2006, 34, 556–573. [CrossRef]
2. Huang, B.; Mauerhofer, V.; Geng, Y. Analysis of existing building energy saving policies in Japan and China.J. Clean. Prod. 2016, 112, 1510–1518. [CrossRef]
3. Energy Policy and Planning Office (EPPO), Ministry of Energy. Energy Statistics of Thailand 2014. Availableonline: http://www.eppo.go.th/images/Infromation_service/EppoAnnualReport/EPPOAnnualReport2014.pdf (accessed on 24 April 2016).
4. Energy Policy and Planning Office (EPPO), Ministry of Energy. Thailand 20-year Energy EfficiencyDevelopment Plan (EEDP). Available online: http://www.eppo.go.th/images/POLICY/ENG/EEDP_Eng.pdf (accessed on 24 April 2016).
5. Chiradeja, P.; Ngaopitakkul, A.; Jettanasen, C. Energy savings analysis and harmonics reduction for theelectronic ballast of T5 fluorescent lamp in a building’s lighting system. Energy Build. 2015, 97, 107–117.[CrossRef]
6. Gruber, J.K.; Prodanovic, M.; Alonso, R. Estimation and Analysis of Building Energy Demand and SupplyCosts. Energy Procedia 2015, 83, 216–225. [CrossRef]
7. Abidin, M.N.Z. IEC 61000-3-2 Harmonics Standards Overview Schaffner; EMC Inc.: Edsion, NJ, USA, 2006;Available online: https://www.emcfastpass.com/wp-content/uploads/2017/04/Class_definitions.pdf(accessed on 1 November 2018).
8. International Electrotechnical Commission (IEC). IEC 61000-3-2:2018. Electromagnetic Compatibility(EMC)—Part 3-2: Limits—Limits for Harmonic Current Emissions (Equipment Input Current ≤16 A perPhase). Available online: https://webstore.iec.ch/publication/62553 (accessed on 1 November 2018).
9. Ezhilarasan, G.; Srinivasan, V.; Vijayalakshmi, M. An isolated two stage converter for LED lighting systemsworking with renewable energy. In Proceedings of the 2013 International Conference on Energy EfficientTechnologies for Sustainability, Nagercoil, India, 10–12 April 2013; pp. 802–807.
10. Santamouris, M.; Cartalis, C.; Synnefa, A.; Kolokotsa, D. On the impact of urban heat island and globalwarming on the power demand and electricity consumption of buildings–A review. Energy Build. 2015, 98,119–1241. [CrossRef]
11. Parkpoom, S.; Harrison, G.P. Analyzing the Impact of Climate Change on Future Electricity Demand inThailand. IEEE Trans. Power Syst. 2008, 23, 1441–1448. [CrossRef]
12. Raji, B.; Tenpierik, M.J.; Dobbelsteen, A.V.D. An assessment of energy-saving solutions for the envelopedesign of high-rise buildings in temperate climates: A case study in The Netherlands. Energy Build. 2016,124, 210–221. [CrossRef]
13. Özkan, H.A. A new real time home power management system. Energy Build. 2015, 97, 56–64. [CrossRef]14. Anvari-Moghaddam, A.; Monsef, H.; Kian, A.R. Optimal Smart Home Energy Management Considering
Energy Saving and a Comfortable Lifestyle. IEEE Trans. Smart Grid 2015, 6, 324–332. [CrossRef]15. Manic, M.; Wijayasekara, D.; Amarasinghe, K.; Andina, J.J.R. Building Energy Management Systems:
The Age of Intelligent and Adaptive Buildings. IEEE Ind. Electron. Mag. 2016, 10, 25–39. [CrossRef]16. Zhou, B.; Li, B.; Chan, K.W.; Cao, Y.; Kuang, Y.; Liu, X.; Wang, X. Smart home energy management systems:
Concept, configurations, and scheduling strategies. Renew. Sustain. Energy Rev. 2016, 61, 30–40. [CrossRef]
17. Al Dakheel, J.; Tabet Aoul, K.; Hassan, A. Enhancing Green Building Rating of a School under the HotClimate of UAE; Renewable Energy Application and System Integration. Energies 2018, 11, 2465. [CrossRef]
18. Gagliano, A.; Nocera, F.; Detommaso, M.; Patania, F. Design solutions for reducing the energy needs ofresidential buildings. In Proceedings of the IREC2015 The Sixth International Renewable Energy Congress,Sousse, Tunisia, 24–26 March 2015; pp. 1–6.
19. Sun, B.; Luh, P.B.; Jia, Q.S.; Jiang, Z.; Wang, F.; Song, C. Building Energy Management: Integrated Control ofActive and Passive Heating, Cooling, Lighting, Shading, and Ventilation Systems. IEEE Trans. Autom. Sci. Eng.2013, 10, 588–602. [CrossRef]
20. Kaminska, A.; Ozadowicz, A. Lighting Control Including Daylight and Energy Efficiency ImprovementsAnalysis. Energies 2018, 11, 2166. [CrossRef]
21. Sesana, M.M.; Grecchi, M.; Salvalai, G.; Rasica, C. Methodology of energy efficient building refurbishment:Application on two university campus-building case studies in Italy with engineering students. J. Build. Eng.2016, 6, 54–64. [CrossRef]
22. Popoola, O.; Munda, J.; Mpanda, A. Residential lighting load profile modelling. Energy Build. 2015, 90, 29–40.[CrossRef]
23. Parise, G.; Martirano, L.; Parise, L. A Procedure to Estimate the Energy Requirements for Lighting. IEEE Trans.Ind. Appl. 2016, 52, 34–41. [CrossRef]
24. Tetri, E.; Sarvaranta, A.; Syri, S. Potential of new lighting technologies in reducing household lighting energyuse and CO2 emissions in Finland. Energy Effic. 2014, 7, 559–570. [CrossRef]
25. Bladh, M. Energy efficient lighting meets real home life. Energy Effic. 2011, 4, 235–245. [CrossRef]26. Tan, Y.K.; Huynh, T.P.; Wang, Z. Smart Personal Sensor Network Control for Energy Saving in DC Grid
Powered LED Lighting System. IEEE Trans. Smart Grid 2013, 4, 669–676. [CrossRef]27. Pandharipande, A.; Caicedo, D. Adaptive Illumination Rendering in LED Lighting Systems. IEEE Trans.
Syst. Man Cybern. Syst. 2013, 43, 1052–1062. [CrossRef]28. Byun, J.; Hong, I.; Lee, B.; Park, S. Intelligent household LED lighting system considering energy efficiency
and user satisfaction. IEEE Trans. Consum. Electron. 2013, 59, 70–76. [CrossRef]29. Garcia, E.J.P.; Chen, A.; Santiago, I.; Outeiriño, F.J.B.; Arias, J.M.F.; Munoz, A.M. Stochastic model for
lighting’s electricity consumption in the residential sector. Impact of energy saving actions. Energy Build.2015, 89, 245–259. [CrossRef]
30. Lien, T.K.; Sangwan, K.S.; Bhakar, V.; Naik, S.; Andrat, S.N. Life Cycle Assessment of Incandescent,Fluorescent, Compact Fluorescent and Light Emitting Diode Lamps in an Indian Scenario. Procedia CIRP2014, 15, 467–472. [CrossRef]
31. Cheng, C.A.; Chang, E.C.; Tseng, C.H.; Chung, T.Y. A Single-Stage LED Tube Lamp Driver with Power-FactorCorrections and Soft Switching for Energy-Saving Indoor Lighting Applications. Appl. Sci. 2017, 7, 115. [CrossRef]
32. Saxena, R.; Nikum, K. Comparative study of different residential illumination appliances based on powerquality. In Proceedings of the IEEE 5th India International Conference on Power Electronics (IICPE 2012),Delhi, India, 6–8 December 2012; pp. 1–5.
33. Castro, A.G.D.; Rönnberg, S.K.; Bollen, M.H.J.; Muñoz, A.M. Study on harmonic emission of domesticequipment combined with different types of lighting. Int. J. Electr. Power Energy Syst. 2014, 55, 116–127.[CrossRef]
34. Khan, N.; Abas, N. Comparative study of energy saving light sources. Renew. Sustain. Energy Rev. 2011, 15,296–309. [CrossRef]
35. Rönnberg, S.K.; Bollen, M.H.J.; Wahlberg, M. Harmonic emission before and after changing to LED andCFL—Part I: Laboratory measurements for a domestic customer. In Proceedings of the 14th IEEE InternationalConference on Harmonics and Quality of Power (ICHQP 2010), Bergamo, Italy, 26–29 September 2010; pp. 1–7.
36. Rönnberg, S.K.; Wahlberg, M.; Bollen, M.H.J. Harmonic emission before and after changing to LED andCFL—Part II: Field measurements for a hotel. In Proceedings of the 14th IEEE International Conference onHarmonics and Quality of Power (ICHQP 2010), Bergamo, Italy, 26–29 September 2010; pp. 1–6.
37. Rönnberg, S.K.; Wahlberg, M.; Bollen, M.H.J. Harmonic emission before and after changing to LEDlamps—Field measurements for an urban area. In Proceedings of the 15th IEEE International Conference onHarmonics and Quality of Power, Hong Kong, China, 17–20 June 2012; pp. 552–557.
38. Molina, J.; Mesas, J.J.; Mesbahi, N.; Sainz, L. LED lamp modelling for harmonic studies in distributionsystems. IET Gener. Transm. Distrib. 2017, 11, 1063–1071. [CrossRef]
39. Blanco, A.M.; Parra, E.E. Effects of high penetration of CFLs and LEDs on the distribution networks.In Proceedings of the 14th IEEE International Conference on Harmonics and Quality of Power (ICHQP 2010),Bergamo, Italy, 26–29 September 2010; pp. 1–5.
40. Busatto, T.; Abid, F.; Larsson, A.; Bollen, M.H.J.; Singh, G. Interaction between grid-connected PV systemsand LED lamps: Directions for further research on harmonics and supraharmonics. In Proceedings of the17th IEEE International Conference on Harmonics and Quality of Power (ICHQP), Belo Horizonte, Brazil,16–19 October 2016; pp. 193–197.
41. Verma, P.; Patel, N.; Nair, N.C. LED electronics, harmonic issues and augmenting Standards. In Proceedingsof the 2017 IEEE International Conference on Consumer Electronics (ICCE), Las Vegas, NV, USA, 8–10 January2017; pp. 190–191.
42. Uddin, S.; Shareef, H.; Mohamed, A.; Hannan, M.A. An analysis of harmonics from dimmable LED lamps.In Proceedings of the 2012 IEEE International Power Engineering and Optimization Conference Melaka,Melaka, Malaysia, 6–7 June 2012; pp. 182–186.
43. Gil-de-Castro, A.; Rönnberg, S.K.; Bollen, M.H.J. Light intensity variation (flicker) and harmonic emissionrelated to LED lamps. Electr. Power Syst. Res. 2017, 146, 107–114. [CrossRef]
44. Dolara, A.; Leva, S. Power Quality and Harmonic Analysis of End User Devices. Energies 2012, 5, 5453–5466.[CrossRef]
45. Karim, F.A.; Ramdhani, M.; Kurniawan, E. Low pass filter installation for reducing harmonic currentemissions from LED lamps based on EMC standard. In Proceedings of the 2016 International Conferenceon Control, Electronics, Renewable Energy and Communications (ICCEREC), Bandung, Indonesia,13–15 September 2016; pp. 132–135.
46. Shi, Q.; Liang, H.; Hou, T.; Bai, L.; Xu, W.; Li, F. Passive filter installation for harmonic mitigation in residentialdistribution systems. In Proceedings of the 2017 IEEE Power & Energy Society General Meeting, Chicago, IL,USA, 16–20 July 2017; pp. 1–5.
47. Pellegrino, A.; Verso, V.R.; Blaso, L.; Acquaviva, A.; Patti, E.; Osello, A. Lighting Control and Monitoringfor Energy Efficiency: A Case Study Focused on the Interoperability of Building Management Systems.IEEE Trans. Ind. Appl. 2016, 52, 2627–2637. [CrossRef]
48. Sundareswaran, K.; Kumar, K.A.; Venkateswaran, P.R.; Sahu, D. A real-time implementation of solarphotovoltaic powered LED interior lighting systems. In Proceedings of the 2015 IEEE Power, Communicationand Information Technology Conference (PCITC), Bhubaneswar, India, 15–17 October 2015; pp. 263–267.
49. Yu, X.; Su, Y. Daylight availability assessment and its potential energy saving estimation—A literature review.Renew. Sustain. Energy Rev. 2015, 52, 494–503. [CrossRef]
50. Parise, G.; Martirano, L.; Ponio, S.D. Energy Performance of Interior Lighting Systems. IEEE Trans. Ind. Appl.2013, 49, 2793–2801. [CrossRef]
51. Parise, G.; Martirano, L. Daylight Impact on Energy Performance of Internal Lighting. IEEE Trans. Ind. Appl.2013, 49, 242–249. [CrossRef]
52. Boscarino, G.; Moallem, M. Daylighting Control and Simulation for LED-Based Energy-Efficient LightingSystems. IEEE Trans. Ind. Inform. 2016, 12, 301–309. [CrossRef]