4
National Aeronautics and Space Administration www.nasa.gov LIGHTS at NIGHT
National Aeronautics and Space Administration
www.nasa.gov
LIGHTS at NIGHT
National Aeronautics and Space Administration
www.nasa.gov
LIGHTS at NIGHT
National Aeronautics and Space Administration
www.nasa.gov
LIGHTS at NIGHTPUZZLE
Who Left the Lights On?Where Do Humans Live?
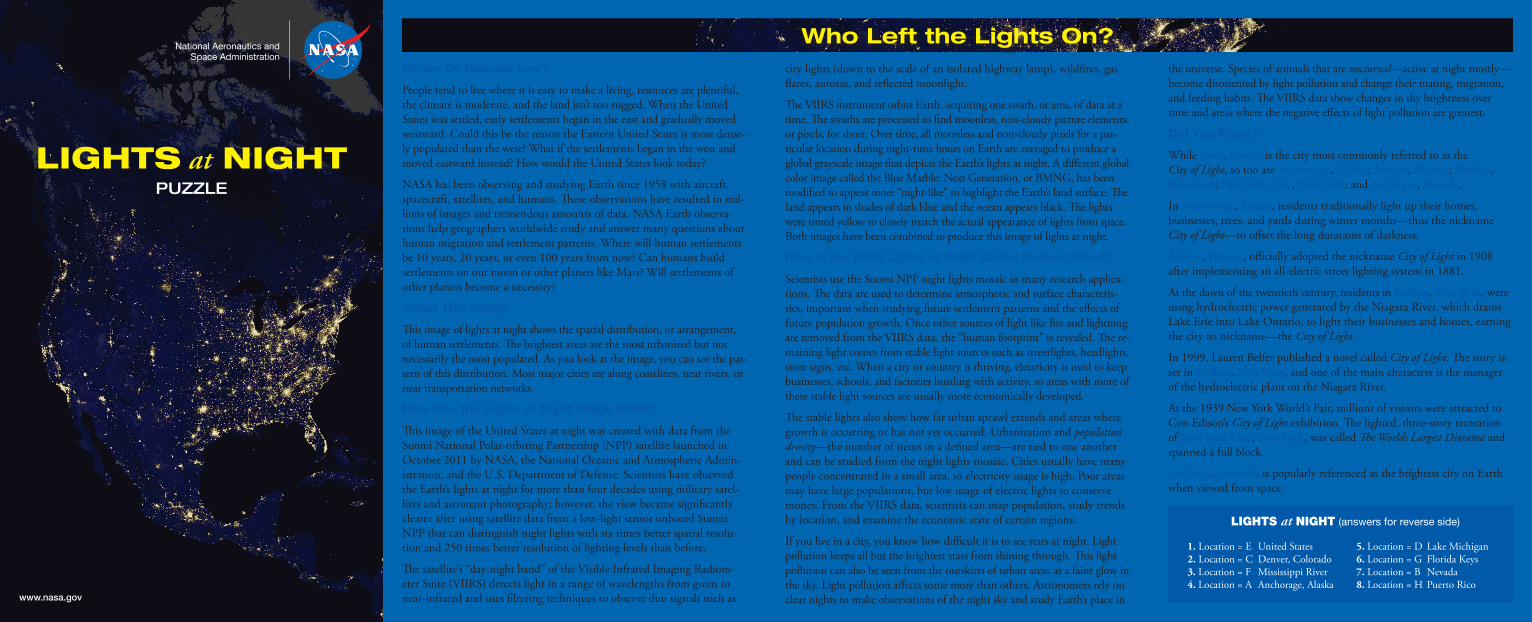
People tend to live where it is easy to make a living, resources are plentiful, the climate is moderate, and the land isn’t too rugged. When the United States was settled, early settlements began in the east and gradually moved westward. Could this be the reason the Eastern United States is more dense-ly populated than the west? What if the settlements began in the west and moved eastward instead? How would the United States look today?
NASA has been observing and studying Earth since 1958 with aircraft, spacecraft, satellites, and humans. These observations have resulted in mil-lions of images and tremendous amounts of data. NASA Earth observa-tions help geographers worldwide study and answer many questions about human migration and settlement patterns. Where will human settlements be 10 years, 20 years, or even 100 years from now? Can humans build settlements on our moon or other planets like Mars? Will settlements of other planets become a necessity?
About This Image
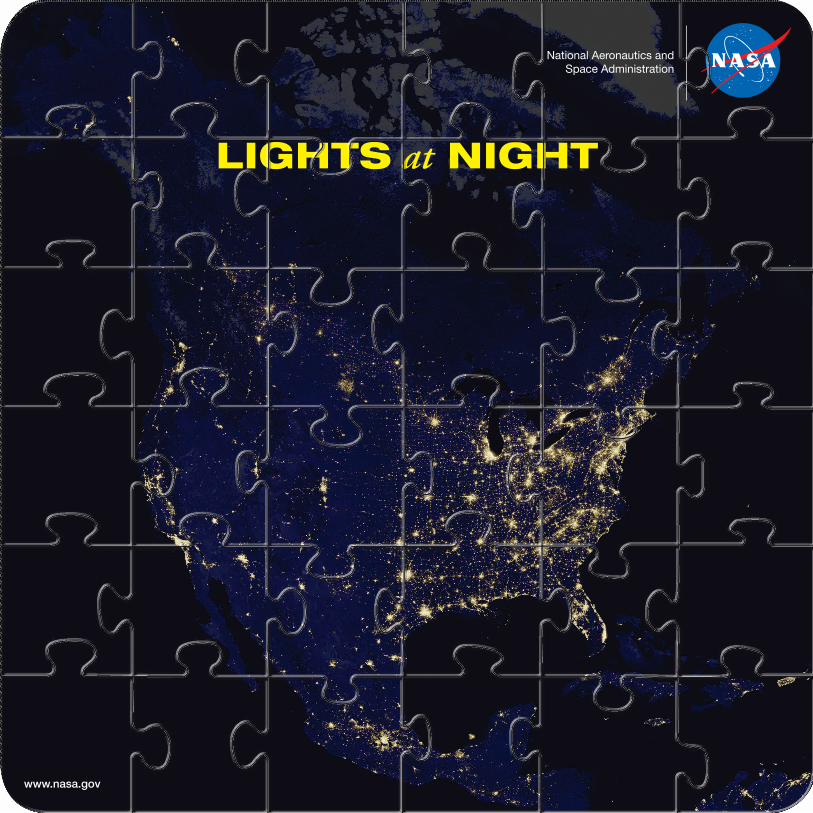
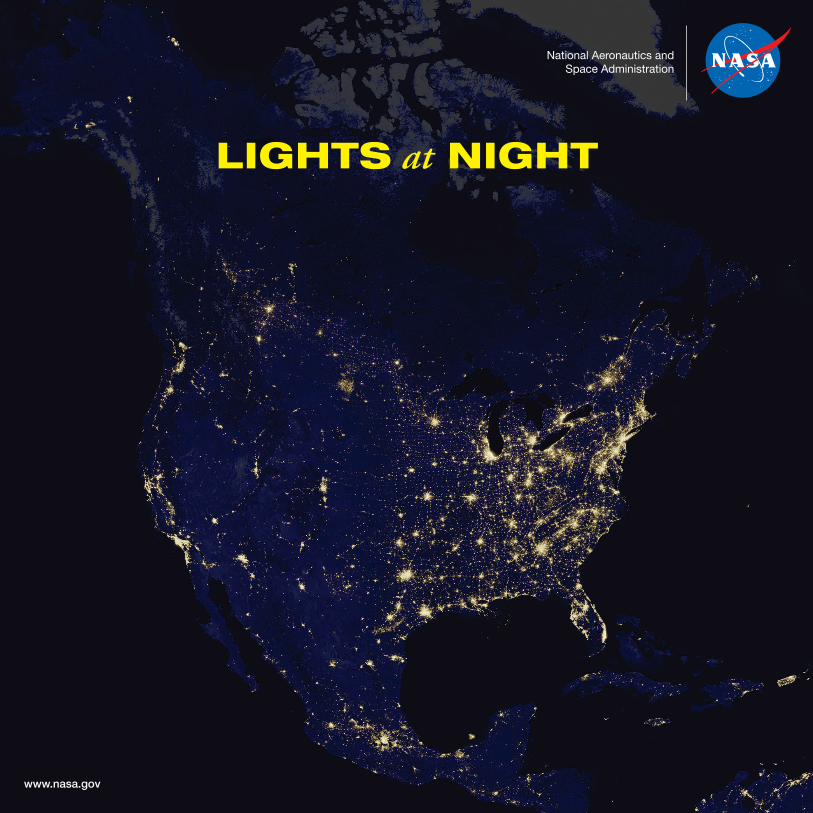
This image of lights at night shows the spatial distribution, or arrangement, of human settlements. The brightest areas are the most urbanized but not necessarily the most populated. As you look at the image, you can see the pat-tern of this distribution. Most major cities are along coastlines, near rivers, or near transportation networks.
How Was the Lights at Night Image Made?
This image of the United States at night was created with data from the Suomi National Polar-orbiting Partnership (NPP) satellite launched in October 2011 by NASA, the National Oceanic and Atmospheric Admin-istration, and the U.S. Department of Defense. Scientists have observed the Earth’s lights at night for more than four decades using military satel-lites and astronaut photography; however, the view became significantly clearer after using satellite data from a low-light sensor onboard Suomi NPP that can distinguish night lights with six times better spatial resolu-tion and 250 times better resolution of lighting levels than before.
The satellite’s “day-night band” of the Visible Infrared Imaging Radiom-eter Suite (VIIRS) detects light in a range of wavelengths from green to near-infrared and uses filtering techniques to observe dim signals such as
city lights (down to the scale of an isolated highway lamp), wildfires, gas flares, auroras, and reflected moonlight.
The VIIRS instrument orbits Earth, acquiring one swath, or area, of data at a time. The swaths are processed to find moonless, non-cloudy picture elements, or pixels, for short. Over time, all moonless and non-cloudy pixels for a par-ticular location during night-time hours on Earth are averaged to produce a global grayscale image that depicts the Earth’s lights at night. A different global color image called the Blue Marble: Next Generation, or BMNG, has been modified to appear more “night-like” to highlight the Earth’s land surface. The land appears in shades of dark blue and the ocean appears black. The lights were tinted yellow to closely match the actual appearance of lights from space. Both images have been combined to produce this image of lights at night.
How is the VIIRS Lights at Night Global Dataset Used?
Scientists use the Suomi NPP night lights mosaic in many research applica-tions. The data are used to determine atmospheric and surface characteris-tics, important when studying future settlement patterns and the effects of future population growth. Once other sources of light like fire and lightning are removed from the VIIRS data, the “human footprint” is revealed. The re-maining light comes from stable light sources such as streetlights, headlights, store signs, etc. When a city or country is thriving, electricity is used to keep businesses, schools, and factories bustling with activity, so areas with more of these stable light sources are usually more economically developed.
The stable lights also show how far urban sprawl extends and areas where growth is occurring or has not yet occurred. Urbanization and population density—the number of items in a defined area—are tied to one another and can be studied from the night lights mosaic. Cities usually have many people concentrated in a small area, so electricity usage is high. Poor areas may have large populations, but low usage of electric lights to conserve money. From the VIIRS data, scientists can map population, study trends by location, and examine the economic state of certain regions.
If you live in a city, you know how difficult it is to see stars at night. Light pollution keeps all but the brightest stars from shining through. This light pollution can also be seen from the outskirts of urban areas as a faint glow in the sky. Light pollution affects some more than others. Astronomers rely on clear nights to make observations of the night sky and study Earth’s place in
the universe. Species of animals that are nocturnal—active at night mostly—become disoriented by light pollution and change their mating, migration, and feeding habits. The VIIRS data show changes in sky brightness over time and areas where the negative effects of light pollution are greatest.
Did You Know?
While Paris, France is the city most commonly referred to as the City of Light, so too are Anchorage, Alaska; Aurora, Illinois; Buffalo, New York; New York City, New York; and Las Vegas, Nevada.
In Anchorage, Alaska, residents traditionally light up their homes, businesses, trees, and yards during winter months—thus the nickname City of Light—to offset the long durations of darkness.
Aurora, Illinois, officially adopted the nickname City of Light in 1908 after implementing an all-electric street lighting system in 1881.
At the dawn of the twentieth century, residents in Buffalo, New York, were using hydroelectric power generated by the Niagara River, which drains Lake Erie into Lake Ontario, to light their businesses and homes, earning the city its nickname—the City of Light.
In 1999, Lauren Belfer published a novel called City of Light. The story is set in Buffalo, New York, and one of the main characters is the manager of the hydroelectric plant on the Niagara River.
At the 1939 New York World’s Fair, millions of visitors were attracted to Con Edison’s City of Light exhibition. The lighted, three-story recreation of New York City, New York, was called The Worlds Largest Diorama and spanned a full block.
Las Vegas, Nevada, is popularly referenced as the brightest city on Earth when viewed from space.
LIGHTS at NIGHT (answers for reverse side)
1. Location = E United States 5. Location = D Lake Michigan 2. Location = C Denver, Colorado 6. Location = G Florida Keys 3. Location = F Mississippi River 7. Location = B Nevada 4. Location = A Anchorage, Alaska 8. Location = H Puerto Rico

3. Dim lights from thousands of oil platforms, or oil rigs, dot the waters just south of the ________ ________ Delta. Location on map = ____.
6. The ________ ________ appear as a string of lights trailing southwestward towards the Gulf of Mexico from the tip of this southern state. Location on map = ____.
2. Small clusters of city lights are strung together along interstates and highways oriented east-west that appear as thin, bright threads east of ______, ________ and surrounding cities. Location on map = ____.
5. City lights—especially near the Windy City—outline the shores of _______ ________ , the only Great Lake that fully exists within U.S. borders. Location on map = ____.
Read each question and fill in the blanks and the corresponding letter of its location on the Lights at Night map. (Answers on reverse side.)
1. One of the brightest areas of the globe is the northeast coast of the _______ ________. In this view, three major cities and the nation’s capital can easily be identified. Location on map = ____.
4. In this northern state’s largest city, ________ , ________ , the longest summer days contain 19 hours, 21 minutes of daylight. Location on map = ____.
7. It is mostly dark across the desert and semiarid regions of northern ________. In contrast, a large cluster of city lights glows at the state’s southern point. Location on map = ____.
8. ______ ____ is the smallest of the Greater Antilles islands, and is the third most densely populated U.S. territory/state. When viewed from space, the island glows brightly against the dark ocean. Location on map = ____.
A
H
G
BC
D E
F
Image Credits
Data NASA and the National Ocean-ic and Atmospheric Administra-tion (NOAA) Suomi NPP VIIRS data and the Moderate Resolu-tion Imaging Spectroradiometer (MODIS) BMNG
Data processing NOAA National Geophysical Data Center
Image composite NASA Earth Observatory
For more information, visit: earthobservatory.nasa.gov/Features/NightLights
LIGHTS at NIGHT
NP-2013-2-010-GSFC


