Page 1
Limits to the detection of early warningsignals of population collapse
Carl Boettiger & Alan Hastings
UC [email protected]
August 10, 2011
Carl Boettiger & Alan Hastings, UC Davis [email protected] Early Warning Signs 1/77
Page 2
Tipping points: Sudden dramatic changes or regimeshifts. . .
Carl Boettiger & Alan Hastings, UC Davis [email protected] Early Warning Signs 2/77
Page 3
Some catastrophic transitions have already happened
Carl Boettiger & Alan Hastings, UC Davis [email protected] Early Warning Signs 3/77
Page 4
Some catastrophic transitions have already happened
Carl Boettiger & Alan Hastings, UC Davis [email protected] Early Warning Signs 4/77
Page 5
But, what if we could predict such sudden collapse?
Carl Boettiger & Alan Hastings, UC Davis [email protected] Early Warning Signs 5/77
Page 6
But, what if we could predict such sudden collapse?
Carl Boettiger & Alan Hastings, UC Davis [email protected] Early Warning Signs 5/77
Page 7
Can we?
Carl Boettiger & Alan Hastings, UC Davis [email protected] Early Warning Signs 6/77
Page 8
A simple theory built on the mechanism of bifurcations
Scheffer et al. 2009
Carl Boettiger & Alan Hastings, UC Davis [email protected] Early Warning Signs 7/77
Page 9
Early warning indicators
e.g. Variance: Carpenter & Brock 2006;or Autocorrelation: Dakos et al. 2008; etc.
Carl Boettiger & Alan Hastings, UC Davis [email protected] Early Warning Signs 8/77
Page 10
Let’s give it a try. . .
Carl Boettiger & Alan Hastings, UC Davis [email protected] Early Warning Signs 9/77
Page 11
Carl Boettiger & Alan Hastings, UC Davis [email protected] Early Warning Signs 10/77
Page 12
Carl Boettiger & Alan Hastings, UC Davis [email protected] Early Warning Signs 11/77
Page 13
Carl Boettiger & Alan Hastings, UC Davis [email protected] Early Warning Signs 12/77
Page 14
Carl Boettiger & Alan Hastings, UC Davis [email protected] Early Warning Signs 13/77
Page 15
Carl Boettiger & Alan Hastings, UC Davis [email protected] Early Warning Signs 14/77
Page 16
Carl Boettiger & Alan Hastings, UC Davis [email protected] Early Warning Signs 15/77
Page 17
Carl Boettiger & Alan Hastings, UC Davis [email protected] Early Warning Signs 16/77
Page 18
Carl Boettiger & Alan Hastings, UC Davis [email protected] Early Warning Signs 17/77
Page 19
Carl Boettiger & Alan Hastings, UC Davis [email protected] Early Warning Signs 18/77
Page 20
Carl Boettiger & Alan Hastings, UC Davis [email protected] Early Warning Signs 19/77
Page 21
Prediction Debrief. . .
So what’s an increase?Do we have enough data to tell?Which indicators to trust most?
Carl Boettiger & Alan Hastings, UC Davis [email protected] Early Warning Signs 20/77
Page 22
Prediction Debrief. . .
So what’s an increase?
Do we have enough data to tell?Which indicators to trust most?
Carl Boettiger & Alan Hastings, UC Davis [email protected] Early Warning Signs 20/77
Page 23
Prediction Debrief. . .
So what’s an increase?Do we have enough data to tell?
Which indicators to trust most?
Carl Boettiger & Alan Hastings, UC Davis [email protected] Early Warning Signs 20/77
Page 24
Prediction Debrief. . .
So what’s an increase?Do we have enough data to tell?Which indicators to trust most?
Carl Boettiger & Alan Hastings, UC Davis [email protected] Early Warning Signs 20/77
Page 25
Empirical examples of early warning
Have relied on comparison to a control system:
Drake & Griffen 2010
Carpenter et al. 2011
Carl Boettiger & Alan Hastings, UC Davis [email protected] Early Warning Signs 21/77
Page 26
We don’t have a control system. . .
Carl Boettiger & Alan Hastings, UC Davis [email protected] Early Warning Signs 22/77
Page 27
All we have is a squiggle
Carl Boettiger & Alan Hastings, UC Davis [email protected] Early Warning Signs 23/77
Page 28
All we have is a squiggle
Making predictions from squiggles is hard
Carl Boettiger & Alan Hastings, UC Davis [email protected] Early Warning Signs 24/77
Page 29
A pattern isn’t enough
Carl Boettiger & Alan Hastings, UC Davis [email protected] Early Warning Signs 25/77
Page 30
We need a framework
Carl Boettiger & Alan Hastings, UC Davis [email protected] Early Warning Signs 26/77
Page 31
A framework for predicting catastropheA pattern
Wissel 1984, Carpenter & Brock 2006, Dakos et al. 2008, Guttal et al. 2008, Scheffer et al. 2009, Dakos etal. 2009, Brock & Carpenter 2010, Drake & Griffen 2010, Carpenter et al. 2011, Carpenter & Brock 2011 . . .Carl Boettiger & Alan Hastings, UC Davis [email protected] Early Warning Signs 27/77
Page 32
A framework for predicting catastropheA pattern
A statistic
Dakos et al. 2008, Dakos et al. 2009,
Carl Boettiger & Alan Hastings, UC Davis [email protected] Early Warning Signs 28/77
Page 33
A framework for predicting catastropheA pattern
A statistic
Not approaching transition
Dakos et al. 2008
Carl Boettiger & Alan Hastings, UC Davis [email protected] Early Warning Signs 29/77
Page 34
A framework for predicting catastropheA pattern
A statistic
Not approaching transition
Approaching transition
Carl Boettiger & Alan Hastings, UC Davis [email protected] Early Warning Signs 30/77
Page 35
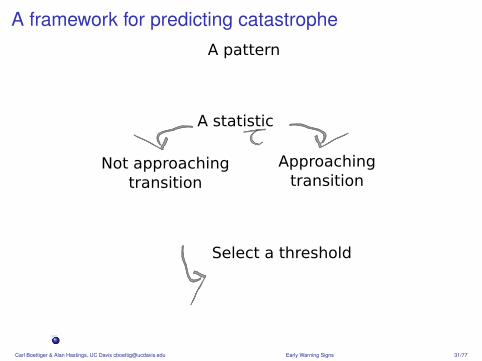
A framework for predicting catastropheA pattern
A statistic
Not approaching transition
Approaching transition
Select a threshold
Carl Boettiger & Alan Hastings, UC Davis [email protected] Early Warning Signs 31/77
Page 36
What’s an increase?
τ ∈ [−1,1] quantifies the trend.
Carl Boettiger & Alan Hastings, UC Davis [email protected] Early Warning Signs 32/77
Page 37
What’s an increase?
τ ∈ [−1,1] quantifies the trend.
Carl Boettiger & Alan Hastings, UC Davis [email protected] Early Warning Signs 32/77
Page 38
Unfortunately. . .
Both patterns come from a stable process!
Carl Boettiger & Alan Hastings, UC Davis [email protected] Early Warning Signs 33/77
Page 39
Typical? False alarm!
How often do we see false alarms?
Carl Boettiger & Alan Hastings, UC Davis [email protected] Early Warning Signs 34/77
Page 40
Typical? False alarm!
How often do we see false alarms?
Carl Boettiger & Alan Hastings, UC Davis [email protected] Early Warning Signs 34/77
Page 41
Often. τ can take any value in a stable system
(We introduce a method to estimate this distribution on givendata, ∼ Dakos et al. 2008)
Carl Boettiger & Alan Hastings, UC Davis [email protected] Early Warning Signs 35/77
Page 42
Another way to be wrong
Warning Signal? Failed Detection?
Carl Boettiger & Alan Hastings, UC Davis [email protected] Early Warning Signs 36/77
Page 43
Another way to be wrong
Warning Signal? Failed Detection?
Carl Boettiger & Alan Hastings, UC Davis [email protected] Early Warning Signs 36/77
Page 44
τ can take any value in a collapsing system
(Using a novel, general stochastic model to estimate)
Carl Boettiger & Alan Hastings, UC Davis [email protected] Early Warning Signs 37/77
Page 45
Carl Boettiger & Alan Hastings, UC Davis [email protected] Early Warning Signs 38/77
Page 46
How much data is necessary?
Carl Boettiger & Alan Hastings, UC Davis [email protected] Early Warning Signs 39/77
Page 47
Beyond the Squiggles
general models by likelihood: stable and criticalsimulated replicates for null and test casesUse model likelihood as an indicator (Cox 1962)
Carl Boettiger & Alan Hastings, UC Davis [email protected] Early Warning Signs 40/77
Page 48
Beyond the Squiggles
general models by likelihood: stable and critical
simulated replicates for null and test casesUse model likelihood as an indicator (Cox 1962)
Carl Boettiger & Alan Hastings, UC Davis [email protected] Early Warning Signs 40/77
Page 49
Beyond the Squiggles
general models by likelihood: stable and criticalsimulated replicates for null and test cases
Use model likelihood as an indicator (Cox 1962)
Carl Boettiger & Alan Hastings, UC Davis [email protected] Early Warning Signs 40/77
Page 50
Beyond the Squiggles
general models by likelihood: stable and criticalsimulated replicates for null and test casesUse model likelihood as an indicator (Cox 1962)
Carl Boettiger & Alan Hastings, UC Davis [email protected] Early Warning Signs 40/77
Page 51
So how are we doing?
Carl Boettiger & Alan Hastings, UC Davis [email protected] Early Warning Signs 41/77
Page 52
False Alarm?
Carl Boettiger & Alan Hastings, UC Davis [email protected] Early Warning Signs 42/77
Page 53
Failed Detection?
Carl Boettiger & Alan Hastings, UC Davis [email protected] Early Warning Signs 43/77
Page 54
Do we have enough data to tell?
Carl Boettiger & Alan Hastings, UC Davis [email protected] Early Warning Signs 44/77
Page 55
How about Type I/II error?
Carl Boettiger & Alan Hastings, UC Davis [email protected] Early Warning Signs 45/77
Page 56
Formally, identical.
Carl Boettiger & Alan Hastings, UC Davis [email protected] Early Warning Signs 46/77
Page 57
Linguistically, a disaster.
Carl Boettiger & Alan Hastings, UC Davis [email protected] Early Warning Signs 47/77
Page 58
Instead: focus on trade-off
Carl Boettiger & Alan Hastings, UC Davis [email protected] Early Warning Signs 48/77
Page 59
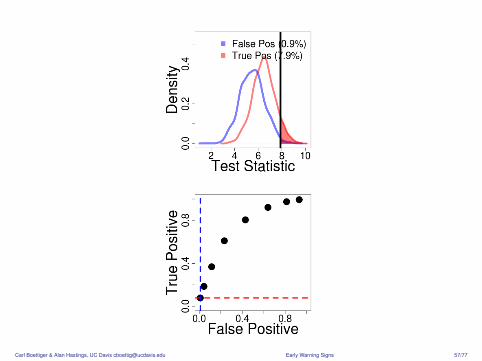
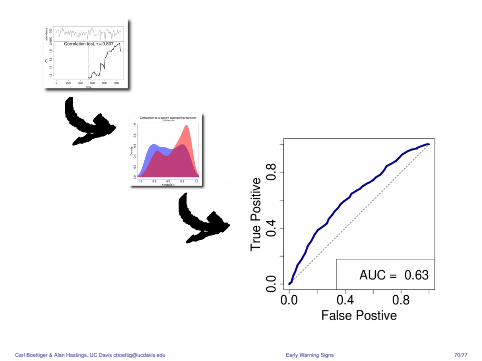
Receiver-operator characteristics (ROCs):
Visualize the trade-off betweenfalse alarms and failed detection
Carl Boettiger & Alan Hastings, UC Davis [email protected] Early Warning Signs 49/77
Page 60
Carl Boettiger & Alan Hastings, UC Davis [email protected] Early Warning Signs 50/77
Page 61
Carl Boettiger & Alan Hastings, UC Davis [email protected] Early Warning Signs 51/77
Page 62
Carl Boettiger & Alan Hastings, UC Davis [email protected] Early Warning Signs 52/77
Page 63
Carl Boettiger & Alan Hastings, UC Davis [email protected] Early Warning Signs 53/77
Page 64
Carl Boettiger & Alan Hastings, UC Davis [email protected] Early Warning Signs 54/77
Page 65
Carl Boettiger & Alan Hastings, UC Davis [email protected] Early Warning Signs 55/77
Page 66
Carl Boettiger & Alan Hastings, UC Davis [email protected] Early Warning Signs 56/77
Page 67
Carl Boettiger & Alan Hastings, UC Davis [email protected] Early Warning Signs 57/77
Page 68
Carl Boettiger & Alan Hastings, UC Davis [email protected] Early Warning Signs 58/77
Page 69
Carl Boettiger & Alan Hastings, UC Davis [email protected] Early Warning Signs 59/77
Page 70
Carl Boettiger & Alan Hastings, UC Davis [email protected] Early Warning Signs 60/77
Page 71
Carl Boettiger & Alan Hastings, UC Davis [email protected] Early Warning Signs 61/77
Page 72
Carl Boettiger & Alan Hastings, UC Davis [email protected] Early Warning Signs 62/77
Page 73
Carl Boettiger & Alan Hastings, UC Davis [email protected] Early Warning Signs 63/77
Page 74
Carl Boettiger & Alan Hastings, UC Davis [email protected] Early Warning Signs 64/77
Page 75
Carl Boettiger & Alan Hastings, UC Davis [email protected] Early Warning Signs 65/77
Page 76
Carl Boettiger & Alan Hastings, UC Davis [email protected] Early Warning Signs 66/77
Page 77
Carl Boettiger & Alan Hastings, UC Davis [email protected] Early Warning Signs 67/77
Page 78
Carl Boettiger & Alan Hastings, UC Davis [email protected] Early Warning Signs 68/77
Page 79
Carl Boettiger & Alan Hastings, UC Davis [email protected] Early Warning Signs 69/77
Page 80
Carl Boettiger & Alan Hastings, UC Davis [email protected] Early Warning Signs 70/77
Page 81
Carl Boettiger & Alan Hastings, UC Davis [email protected] Early Warning Signs 71/77
Page 82
650
750
(a) Stable
Da
ta
450
600
(b) Deteriorating
10
20
30
(c) Daphnia
-40
4
(d) Glaciation III
800
1400 τ = -0.7
(p = 1e-05)
Va
r
150
02500 τ = 0.22
(p = 0.18)
30
50
70
τ = 0.72(p = 0.0059)
24
6
τ = 0.93(p = <2e-16)
-0.2
00.0
0 τ = 0.7(p = 1.6e-06)
Au
toco
r
0.5
00.6
5
τ = -0.15(p = 0.35)
0.0
0.3
τ = 0(p = 1)
0.6
00.7
0
τ = 0.64(p = 3.6e-13)
-0.2
0.2
τ = 0.72(p = 5.6e-06)
Ske
w
-0.8
-0.2
0.4
τ = -0.15(p = 0.35)
0.0
0.4
0.8
τ = 0.61(p = 0.025)
0.8
1.2
1.6 τ = -0.54
(p = 9.2e-10)
0 400 800
1.2
1.8
τ = -0.67(p = 2.3e-05)
CV
0 400 800
34
56 τ = 0.31
(p = 0.049)
160 200 240
1.0
2.5
4.0
τ = 0.72(p = 0.0059)
0 10000 25000
-50
010
00
τ = 0.11(p = 0.21)
Time
Carl Boettiger & Alan Hastings, UC Davis [email protected] Early Warning Signs 72/77
Page 83
Carl Boettiger & Alan Hastings, UC Davis [email protected] Early Warning Signs 73/77
Page 84
0.0 0.2 0.4 0.6 0.8 1.0
0.0
0.2
0.4
0.6
0.8
1.0
(a) Simulation
False Positive
Tru
e P
osi
tive
Likelihood, 0.85Variance, 0.8Autocorr, 0.51Skew, 0.5CV, 0.81
0.0 0.2 0.4 0.6 0.8 1.0
0.0
0.2
0.4
0.6
0.8
1.0
(b) Daphnia
False Positive
Tru
e P
osi
tive
Likelihood, 0.87Variance, 0.59Autocorr, 0.56Skew, 0.56CV, 0.65
0.0 0.2 0.4 0.6 0.8 1.0
0.0
0.2
0.4
0.6
0.8
1.0
(c) Glaciation III
False Positive
Tru
e P
osi
tive
Likelihood, 1Variance, 0.46Autocorr, 0.4Skew, 0.48CV, 0.49
Carl Boettiger & Alan Hastings, UC Davis [email protected] Early Warning Signs 74/77
Page 85
Carl Boettiger & Alan Hastings, UC Davis [email protected] Early Warning Signs 75/77
Page 86
Conclusions
Estimate false alarms & failed detectionsIdentify which indicators are bestExplore the influence of more data on these rates.
Carl Boettiger & Alan Hastings, UC Davis [email protected] Early Warning Signs 76/77
Page 87
Acknowledgements
Vasilis DakosSebastian SchreiberMarissa BaskettMarcel HolyoakCenter for Population BiologyDoE Computational ScienceGraduate Fellowship
Visit code development site
& try it out
Carl Boettiger & Alan Hastings, UC Davis [email protected] Early Warning Signs 77/77