LIMNOLOGICAL PROPERTIES OF A ROCKY MOUNTAIN HEADWATER RESERVOIR Michael D. Marcus February 1989 Journal Article WWRC - 8 9 - 08 In Water Resources Bulletin Volume 25, No. 1 February 1989 Michael D. Marcus Western Aquatics, Inc. Laramie, Wyoming
Transcript
LIMNOLOGICAL PROPERTIES OF A ROCKY MOUNTAIN HEADWATER RESERVOIR
Michael D. Marcus
February 1989 Journal Article
WWRC - 8 9 - 08
In
Water Resources Bulletin
Volume 25, No. 1
February 1989
Michael D. Marcus Western Aquatics, Inc.
Laramie, Wyoming
VOL. 26, NO. 1 WATER RESOURCES B U T I N
AMERICAN WATER RESOURCES ASSOCIATION FEBRUARY 1989
LIMNOLOGICAL PROPERTIES OF' A ROCKY MOUNTAIN HEADWATER RESERVOIR1
Michael D. Marcus2
ABSTRACT: Hyalite Reservoir, bntana, was studied to determine properties of this small, montane, headwater, deep-release reser- voir relative to reservoirs at lower elevations. While retention times for waters were as brief as 12 d, the mean residency of 40 d from mid-March to mid-December was within the range reported for other reservoirs. No significant through-reservoir gradients for suspended sediments wem observed, contrasting to observations for most reservoirs. Thermal stratification, evident during the first part of the summer, was disrupted in August by cool, dense tribu- tary inflows and strong wind-induced mixing. Dissolved oxygen concentrations paralleled temperature patterns in the reservoir; lowest average values for both occurred in waters sampled nearest the outlet. Total phosphorus averaged greater than twice the total nitrogen concentrations; greatest average concentrations for both were found in the near-bottom waters nearest the outlet. Enrichment of nitrogen concentrations in outflow over inflow waters is hypothesized to occur through nitrogen fiiation by Aphanizomenon flos-aquae. Despite the relatively high quality of waters from tributary inflows, an algal bloom, chlorophyll u concen- trations, and primary productivity estimates suggested that the reservoir was mesotrophic. Circulation of waters within the reser- voir was primarily influenced by wind-induced mixing, thermal gradients, and currents produced by the deep-water outlet. (KEY TERMS: montane headwater reservoir; nutrient enrichment; longitudinal flow patterns; trophic status.)
INTRODUCTION
Headwater reservoirs are being developed increas- ingly in mountainous regions of western North America to regulate seasonal stream flows and water supplies that are necessary to meet expanding water demands for agriculture, energy development and domestic needs, and to preserve fish and wildlife habi- tats. While main stem and plains reservoirs have received extensive study in western North America (e.g., Pennak, 1949; Wright, 1961; Soltero, et al., 1973; Martin and Ameson, 1978; Rada and Wright, 1979; Gloss, et al., 1980; Whalen, et al., 1982), and charac- teristics and stream effects of reservoirs are generally well known (e.g., Baxter, 19771 1985), limnological properties of small, headwater reservoirs in the Rocky
Mountains have received re.&ively little study and are poorly understood.
Due to high elevations and high runoff rates, small montane and alpine headwater reservoirs can have limited solar warming; relatively high-quality low- conductivity waters; and low residency times for water during some periods. Because of these fea- tures, unanswered questions remain on whether char- acteristics found in larger, low-elevation reservoirs also exist in smaller, high-elevation reservoirs. Do they develop density stratifications and flows? Are the chemical compositions of resident waters altered during passage through these reservoirs? What levels of productivities exist in these systems? Such ques- tions are particularly of interest during the ice-free growing season when the greatest influences in bio- logical resources and on human recreation may occur.
These questions were addressed in a study of Hyalite Reservoir, which is a montane impoundment located in south central Montana, approximately 40 km north of Yellowstone National Park. This study was conducted concurrently with studies of effects by this reservoir's discharges on downstream periphyton (Marcus, et al., 1978; Marcus, 19801, and with studies of selected chemical and bacterial effects associated with land uses downstream from the reservoir (Schillinger and Stuart, 1978). Two technical reports contain the original data discussed in this article (Marcus, et al., 1978; Schillinger and Stuart, 1978).
With its spillway lying a t an elevation of 2040 m, Hyalite Reservoir stores a maximum of 9.9 km3 of water for irrigation and municipal supplies behind a 400-m long, 34-m high earth and gravel dam, which was completed in 1950 (Montana State Engineer's Office, 1953). The steep-sloped watershed above the reservoir drains approximately 71 km2, dominated by volcanic-igneous rocks (Chadwick, 1969). Inflows from the reservoir's two major tributaries (the East and West Forks of Hyalite Creek) enter the elongate
]Paper No. 88017 of the WU&F Resources Bulletin. Discussions are open until October 1, 1989. (A contribution from the Wyoming
h s i d e n t , Western Aquatics, Inc., 203 Grand Avenue, P.O. Box 646, Laramie, Wyoming 82070. Water Research Center and the Department of Zoology and Physiology, The University of Wyoming, Laramie, Wyoming 82071.)
15 WATER RESOURCES BULLETIN
oval-shaped reservoir from the southeast and flow northwest to the deep-water outlet, located 23 m below the spillway. The reservoir has a maximum depth of 27 m, length of 2.2 km, width of 530 m, area of 84.2 ha, and shoreline development of 1.57 km.
MATERIALS AND METHODS
The three reservoir sampling sites, sampled on six biweekly dates from July through September 1976, were equally spaced near mid-channel down the length of Hyalite Reservoir: one down-reservoir, near the dam (Site HR1); one mid-reservoir (Site HR2); and one up-reservoir, in the area receiving the princi- pal tributary inflows (Site HR3). Together, the first two sites are discussed as "the deep-water sites." Weekly samples for water chemistry were collected from June 7 to November 3, 1976, from influent and effluent streams.
To calculate hydraulic retention times from mid- March t o early December 1976, reservoir volumes were divided by discharge rates using biweekly data from the Montana Department of Natural Resources (MDNR). Data on discharge rates to the reservoir from tributaries were also provided by MDNR, plus other data summarized in Schillinger and Stuart (1978).
On each sampling date a t each reservoir site, a Yellow-Springs Instruments Model 54 meter and long lead probe were used to determine in situ vertical pro- files for temperature and dissolved oxygen (DO) at 1- m intervals for the first 15 m, or until a depth 0.5-m above the bottom was reached. For depths below 15 m to 0.5-m above the bottom, a 4-L PVC Van Dom water bottle was used to collect water samples from depths necessary to define vertical gradients; mea- sured depths often varied by site and date. Temperatures and DO were measured by immersing the probe into the water bottle. To assure accuracy, the calibration of the probe was checked using an azide-modified Winkler oxygen titration (American Public Health Association, 1971).
During each visit to the reservoir sites, euphotic zones were determined using a Beckman EV-6 light meter with a selenium photocell. Computation of mean extinction coefficients through the euphotic zones followed Hutchinson (1957).
Conductivities and pH were measured on site in samples collected at the surface, middle, and bottom of the euphotic zone; at 0.5-m above the bottom; and a t selected intermediate depths necessary to define vertical gradients. The Lab-Line Lectro Mho-meter readings were standardized to 25°C and the Sargent
Model PBL pH meter was calibrated using standard buffer solutions.
For each sampling date at each deep-water site, composite euphotic-zone water samples were mixed on-board in a large Nalgene carboy, using equal vol- ume subsamples collected from the surface, middle, and bottom of the euphotic zone. Because the eupho- tic zone always extended to the bottom a t the shallow- er up-reservoir site (HR3), composite samples for this site included waters collected from the surface and middle of the water column and fiom 0.5-m above the bottom. No evidence of contamination with bottom sediments was apparent in any near-bottom sample from any site.
After mixing, each composite sample was divided for laboratory analyses of water chemistry, plant pig- ments, and phytoplankton. Additionally, separate samples for chemical analyses were collected 0.5-m above the bottom a t each deep-water site and from below the surface at each stream site. Sample storage and analysis for the 15 chemical parameters mea- sured followed standard procedures (Table l), with analytical results checked against known standards.
From each composite sample, a l-L subsample for pigment analysis was filtered on board through a Millipore 0.45-pm pore-size glass filter. Rolled filters were inserted into screw-capped centrifuge tubes, wrapped in foil, and returned to the laboratory on ice. To aid pigment extraction, each filter was ground in 90 percent acetone using a tissue grinder, and result- ing solutions held at <O°C for 1 to 4 days (Strickland and Parson, 1972; Weber, 1973). Pigment concentra- tions in the cleared extracts were analyzed using both a Beckman Model DU-2 spectrophotometer and a Turner fluorometer, factory-fitted for' chlorophyll-a determinations. The spectrophotometer was calibrat- ed to provide readings in agreement with U.S. EPA standard pigment solutions. Because results from both analyses were highly correlated (r > 0.99), only results fiom spectrophotometric analyses are reported here. Calculation of volumetric pigment concentra- tions (mg-m-3) followed Strickland and Parsons (1972).
Phytoplankton in 500-mL subsamples from each composite was preserved and concentrated to 5 mL by sedimentation (Weber, 1973). Algal cells in subsam- ples from these concentrates were enumerated at 400X using a Palmer-Maloney counting cell. Formulae for standard geometric solids were used to compute average taxonomic volumes, with calcula- tions extrapolated to cell densities for the euphotic zone.
Primary productivities for each deep-water site on each sampling date were estimated using the equa- tion of Ryther and Yentch (1957) as modified for the
WATER RESOURCES BULLETIN 16
Limnological Properties of a Rocky Mountain Headwater Reservoir
TABLE 1. Methods Followed for the Analysis of the 15 Chemical Parameters Included in the Investigation of Hyalite Reservoir.
Turbidity Total Alkalinity Total Hardness Calcium Sodium Magnesium Potassium chloride Sulfate Ammonia-Nitrogen Nitrite- and Nitrate-Nitrogen Nitrite-Nitrogen Nitrate-Nitrogen Orthophosphate-Phosphorus Total Phosphate-Phosphorus
Nephelometric method (U.S. EPA, 1974) Potentiometric method using 0.05 N strong acid to p H 4.5 (APHA, 1971) EDTA titrimetric method (AF'HA, 1971) EDTA titrimetric method (APHA, 1971) Atomic absorption spectroecopy at 698 nm on an Industrial Labs Model 151 Indirect EDTA titrimetric method (APHA, 1971) Atomic absorption spectroscopy at 768 nm on an Industrial Labs Model 151 Colorimetric method (ASTM, 1975) Turbidimetric method (A, 1971) Phenohypochlorite method (Strickland and Parsons, 1972) Cadmium reduction method (Strickland and Parsons, 1972) Nitriver method (Hach Chemical Co., 1973) By difference from the two above methods Colorimetric ascorbic acid reduction method on fdtrate (ASTM, 1975) Persulfate digestion on unfiltered water (U.S. EPA, 1974)
effect of water temperature on photosynthesis (Martin, 1967; J. C. Wright, Biology Department, Montana State University, Bozeman, Montana, per- sonal communication). Estimates for mean total daily surface radiation were based on projections of Kimble (1928). This chlorophyll method, when compared to light-dark bottle techniques, has closely estimated primary productivities in other Montana reservoirs (e.g., Martin, 1967; Rada, 1974).
Means and variances for each variable sampled at each site were calculated using all collected data from (1) the euphotic zone composite samples at the three sites and (2) the near-bottom samples at the deep- water sites. A one-way analysis of variance was used to evaluate statistical differences among sites for each parameter measured in the three composite samples. Student's t-tests were used to determine statistical differences between pairs of means for parameters measured at the deep-water sites.
Two methods were used to compute partial input- output budgets for four nitrogen and phosphorus com- pounds in Hyalite Reservoir, using the results from the weekly samples collected from the influent and effluent systems, analyzed using methods shown in Table 1 (Schillinger and Stuart, 1978). First, for each of the four chemical variables, concentration data from each individual sampling was extrapolated over the interval between the times extending halfivay to both the prior and the subsequent samplings. These concentrations were then multiplied by the flow rates during the appropriate intervals, and all results aver- aged to provide mean daily mass flows (kgd-l) for each compound. Second, i t is important to estimate uncertainty in chemical input-output budgets (cf., LaBaugh and Winter, 1984; LaBaugh, 1985). Therefore, to roughly estimate error in each budget computed for the reservoir, means and standard devi- ations (SD) were computed for each of the four vari- ables over the entire study. Then, each value was
17
multiplied by average daily flows recorded a t each inflow and outflow location over the study period to estimate mean (+1 SD) daily mass flows.
RESULTS AND DISCUSSION
Water Storage
Runoff from snowmelt and June rains was the major source of the water to the reservoir, with water reaching the level of the spillway on July 1. While precipitation for June t o September was 2.5 cm greater than the previous 10-year average, only one- half of the normally expected rainfall actually occurred in August. This caused relatively high late- summer discharge rates. Water levels were nearly l l - m below the spillway in mid-November. Previously, the maximum reported drawdown had been 8 m (Wells, 1976).
Retention times for reservoir waters averaged about 70 to 80 d from mid-March to mid-May. In early June they decreased to 12 d. Subsequently, they gradually increased to 44 d by mid-October and were maintained between 38 to 42 d until mid-December 1976. Through the entire period from mid-March to mid-December, storage times averaged 40 d. These results and those from McAfee (1980) indicate that, while retention times in Rocky Mountain headwater reservoirs can be brief during some periods, average water exchange rates for these systems can be similar to those for larger, lower elevation reservoirs (cf., Hrbacek and Straskaba, 1966; Rada, 1974; Whalen, et al., 1982).
WATER RESOURCES BULLETIN
Marcus
Light Penetration and TZlrbidity
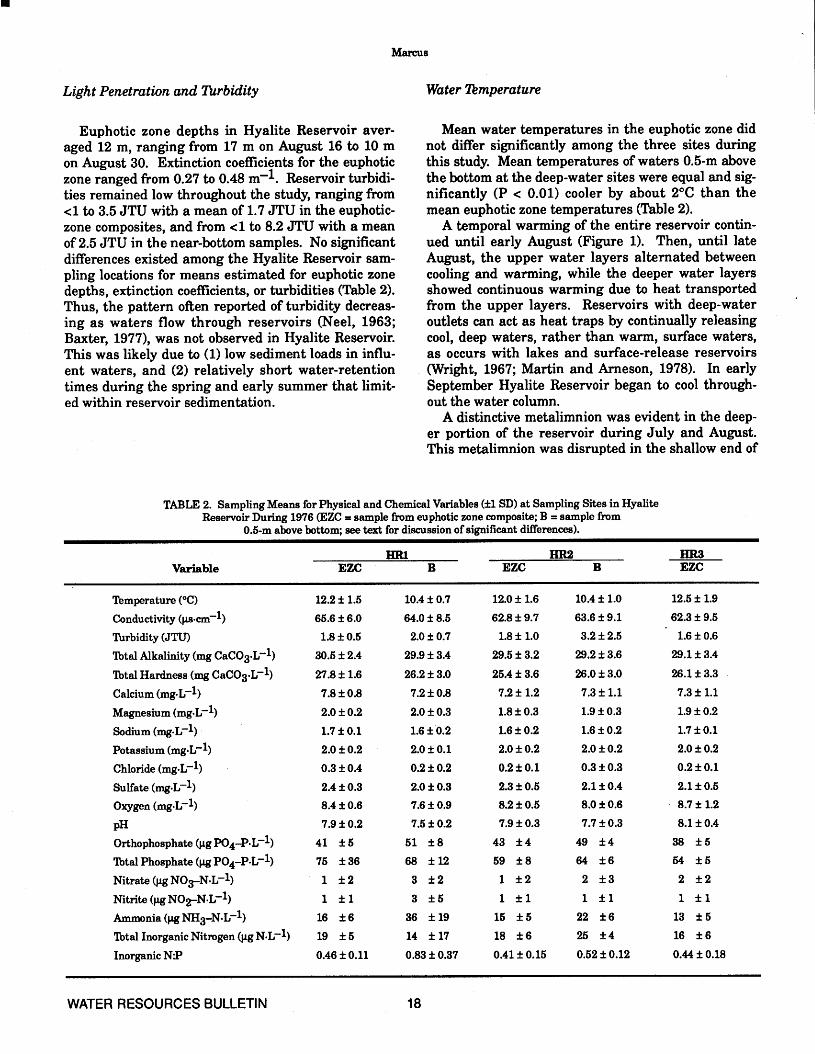
Euphotic zone depths in Hyalite Reservoir aver- aged 12 m, ranging from 17 m on August 16 to 10 m on August 30. Extinction coefficients for the euphotic zone ranged from 0.27 to 0.48 m-l. Reservoir turbidi- ties remained low throughout the study, ranging from <1 to 3.5 JTU with a mean of 1.7 JTU in the euphotic- zone composites, and from <1 to 8.2 JTU with a mean of 2.5 JTU in the near-bottom samples. No significant differences existed among the Hyalite Reservoir Sam- pling locations for means estimated for euphotic zone depths, extinction coefficients, or turbidities (Table 2). Thus, the pattern oRen reported of turbidity decreas- ing as waters flow through reservoirs (Neel, 1963; Baxter, 1977), was not observed in Hyalite Reservoir. This was likely due to (1) low sediment loads in influ- ent waters, and (2) relatively short water-retention times during the spring and early summer that limit- ed within reservoir sedimentation.
Water lkmperature
Mean water temperatures in the euphotic zone did not differ significantly among the three sites during this study. Mean temperatures of waters 0.5-m above the bottom at the deep-water sites were equal and sig- nificantly (P < 0.01) cooler by about 2OC than the mean euphotic zone temperatures (Table 2).
A temporal warming of the entire reservoir contin- ued until early August (Figure 1). Then, until late August, the upper water layers alternated between cooling and warming, while the deeper water layers showed continuous warming due to heat transported from the upper layers. Reservoirs with deep-water outlets can act as heat traps by continually releasing cool, deep waters, rather than warm, surface waters, as occurs with lakes and surface-release reservoirs (Wright, 1967; Martin and Arneson, 1978). In early September Hyalite Reservoir began to cool through- out the water column.
A distinctive metalimnion was evident in the deep- er portion of the reservoir during July and August. This metalimnion was disrupted in the shallow end of
TABLE 2. Sampling Means for Physical and Chemical Variables ( f l SD) at Sampling Sites in Hyalite Reservoir During 1976 (EZC = sample from euphotic zone composite; B = sample from
0.6-m above bottom; see text for discussion of significant differences). ~-
HRl HR2 HR3 Variable EU] B EZC B EZC
Temperature ("C)
Conductivity (pcm-l) Turbidity (JTU) Total Alkalinity (mg CaC03.L-1)
Total Hardness (mg CaC03-L-1)
Calcium (mg.L-1)
Magnesium (mgL-l)
Sodium (mg-~-l)
Potassium (mg-~-l) Chloride (mg-L-l)
sulfate (wL-~) Oxygen (mg-~-l)
PH Orthophosphate (pg p04-P.L-1) Total Phosphate (pg PO4-P-L-l)
Limnological Properties of a Rocky Mountain Headwater Reservoir
the reservoir due to the inflow of cooler water from the East and West Forks of Hyalite Creek. During the mid-August sampling a strong wind pushed warmer, surface-water layers down reservoir toward the dam. Cooler, deeper waters, which were nearer the dam, were displaced up reservoir. This process, reflected in the V-shaped 13°C isotherm on August 16, disrupted the metalimnion, which was not evident again during this study.
Conductivity and Salinity
Isoclines for longitudinal conductivity in Hyalite Reservoir suggest a continual movement of water through the reservoir (Figure 2). During the first three sampling periods, conductivities in tributary inflows were relatively low and waters with the high- est conductivities were being discharged. Then, dur- ing the strong down-reservoir winds in mid-August, waters with higher conductivities were pushed toward the dam. Subsequently, reservoir waters tended to have similar conductivities. In late September, tributary inflows had slightly higher con- duc tivitie s.
.
I I
HR I HR2 HR3 SITES
HRI HR2 HR3
SITES
Figure 1. Longitudinal Isotherms ("C) Through Hyalite Reservoir on Each Sampling Date (note declining
surface levels accompanying drawdown).
With autumnal cooling, reservoir temperatures dif- fered by about 3°C in mid-September. On Septem- ber 21, cool, dense 9°C water from the East and West Forks appeared to flow under the warmer reservoir waters, past the middle of the reservoir, and extended toward the outlet. Thus, thermal patterns in the Hyalite Reservoir were not dissimilar to those report- ed for larger, low-elevation reservoirs (Wright, 1967; Baxter, 1977).
19
ro 0
10
20
HR I HR2 H R3 SITES
HR I HR2 HR3 s I TES
Figure 2. Longitudinal Conductivity Isoclines (pS.~xn-~) Through Hyalite Reservoir on Each Sampling Date
Average reservoir conductivities progressively increased slightly from about 55 to 75 @cm'-l during this study. In general for temperate zone streams and reservoirs, conductivities are lowest in the spring and early summer when surface-water runoffs are
WATER RESOURCES BULLETIN
Marcus
greatest, and highest in the later fall and winter when proportional contributions by groundwaters, which typically have higher conductivities, are great- est (Miller and Rabe, 1969; Whalen, et al., 1982). While the relative importance of direct contributions by groundwaters to Hyalite Reservoir are unknown, they are likely to be relatively insignificant because within reservoir conductivities approximated levels determined for inflow tributaries (Schillinger and Stuart, 1978).
Average concentrations measured during this study for total alkalinity, total hardness, and related ionic species generally were not significantly different either among the euphotic zone composites o r between the deep-water samples (Table 2). However, the average concentration of sulfate in the near-bot- tom waters a t the site nearest the dam was signifi- cantly (P < 0.05) less than found in the euphotic zone composites a t this site.
On average, major cations in the reservoir occurred in the ratio 58:15:13:14 (Ca:Mg:Na:K), and major anions were present in the ratio 92:7:1 (HC03+C03: S04:Cl). Calcium bicarbonate waters are common in Montana reservoirs (e.g., Rada and Wright, 1979; Whalen, et al., 1982). The predominance of these two ions suggest that rock dominated factors, as opposed to evaporation or atmospheric precipitation, primarily influence water salinity (Wetzel, 1975). The relatively low concentrations of ions in Hyalite Reservoir reflect the generally low solubilities for minerals in volcanic- igneous rocks (Chadwick, 1969; Dillon and Kirchner, 1975).
Dissolved Oxygen
Dissolved oxygen concentrations in Hyalite Reservoir during this study roughly paralleled pat- terns observed for water temperature (cf., Figures 1 and 3). During July the water was of nearly uniform oxygen content. In early August the flow of cool, oxygen-enriched water from the East and West Forks had a major influence on waters in the shallow half of the reservoir. The strong down-reservoir wind in mid- August produced very similar patterns for both dis- solved oxygen and conductivities (cf., Figures 2 and 3). Beginning at this time and continuing through most of the study, the lowest reservoir oxygen concentrations occurred in the near-bottom waters nearest the dam. In fact, average measured oxygen concentrations in the near-bottom waters at Site HR1 was significantly (P < 0.05) lower than determined for the euphotic zone mean at this site (Table 2). Oxygen
depressions in other reservoirs have been reported to result primarily from decomposition of organic materials settling fiom the euphotic zone (Wright, 1967).
A
E Y
Hk I Hk2 Hk3
SITES Hkl HRS
SITES
Figure 3. Longitudinal Oxygen Isoclines (mg 02.~11) Through Hyalib Reservoir on Each Sampling Date
Reservoir pH measurements ranged from 7.2 to 8.5. Mean pH (based on [H+l) for the near-bottom samples from the deep-water sites were significantly (P c 0.05) more acid than found in the euphotic zone at the respective sites (Table 2). Such differences are typically due to (1) decomposition of organic materials and solubilization of acids, including carbonates, in the bottom waters; and (2) photosynthetic uptake of carbon dioxide reducing concentrations of carbonic acid in the euphotic zone (Wetzel, 1975).
WATER RESOURCES BULLETIN 20
Limnological Properties of a Rocky Mountain Headwater Reservoir
Phosphorus and Nitrogen
Measured concentrations of orthophosphate (as phosphorus) in the euphotic zone during this study ranged between 36 and 45 p PO4-P0L-l) and
water. Average concentrations of total phosphate in the euphotic zone fluctuated between 54 and 91 pg P04-P.L-1, whereas concentrations in the deep- water measurements ranged from 54 t o 78 pg P04-PoL-1. No significant differences by site or depth were found for average concentrations of either, with the exception that means for orthophosphate in the near-bottom samples from both deep-water sites were significantly greater than means for samples from their respective overlaying euphotic zones (HR1: P < 0.01; HR2: P < 0.05; Table 2).
Nitrate-nitrogen and nitrite-nitrogen concentra- tions averaged less than 3 pg N-L-l in the euphotic zone and less than 6 pg N-L-l in the near-bottom waters. Average ammonia-nitrogen concentration for the near-bottom waters (29 pg NH3-N-L-l) was near- ly twice the average concentrations determined for the euphotic zone samples (15 pg NH3N.L-l). Because ammonia dominated the total inorganic nitrogen during this study, total inorganic nitrogen concentrations generally followed ammonia concen- trations with the measured concentrations ranging from 8 to 65 pg N-L-l. The various nitrogen forms tended to increase with nearness to the deep-water outlet, but due to large temporal variations, only total nitrogen levels in the near-bottom water at Site HR'1 were found significantly greater (P c 0.05) than in euphotic zone samples from this site (Table 2).
On a temporal basis, P or N concentrations showed no consistent patterns of change in the euphotic zone samples. For the near-bottom samples at Site HR1, however, concentrations of orthophosphate, total phosphate, ammonia, and total inorganic nitrogen displayed slight trends of increase that peaked in the August 30 samples.
Ratios of dissolved inorganic concentrations for total nitrogen versus total phosphorus in individual samples ranged from 0.23 to 1.1. Average total N:P for the near-bottom samples from Site HR1 was sig- nificantly greater than found for the site's euphotic zone composite samples (P < 0.05; Table 2).
Based on N:P, primary productivity in Hyalite Reservoir is severely limited by low nitrogen concen- trations. The environmental N:P optimal for algal growth is about seven, based on average masses of for these nutrients in algal photoplasm (Stumm and Morgan, 1970); higher ratios suggest phosphorus limi- tations and lower ratios suggest nitrogen limitations. Additional evidence for nitrogen limitations in
between 42 and 58 pg PO4-POL- f in the near bottom
21
Hyalite Reservoir come from algal bioassays conduct- ed on Hyalite Creek waters, which showed nitrogen limitation downstream from the reservoir (Schillinger and Stuart, 1978). Nitrogen limitation is common in many lakes and reservoirs in the Missouri River drainage on the northern Rocky Mountains (J. C. Wright, personal communication, as reviewed in Marcus, et al., 1978).
Nutrient Budgets
Previous studies on larger, lower elevation reser- voirs often report nutrient levels in outflow waters to be elevated over inflow concentrations (e.g., Wright, 1967; Hynes, 1970; Rada and Wright, 1979). However, other data indicate that reservoirs may act as nutrient sinks (Soltero, et al., 1973; Whalen, et al., 1982).
Partial input-output budgets for four nitrogen and phosphorus compounds in Hyalite Reservoir comput- ed using two procedures are shown in Table 3. Despite the large error common with such budgets (cf., LaBaugh and Winter, 1984), particularly evident for the nitrogen variables in Hyalite Reservoir, there was good general agreement between both approach- es. These budgets indicated that between June 7 and November 3 about 31-34 percent more phosphorus and 37-45 percent more nitrogen were discharged from Hyalite Reservoir than can be accounted for by tributary inflows. Also, recall that significantly greater concentrations of orthophosphate and total inorganic nitrogen were found in the near-bottom water at the site nearest the dam (Table 2). This sug- gests that, even though nitrogen was limiting algal growth in Hyalite Reservoir, waters were nutrient enriched during residency.
Causes of the nitrogen and phosphorus enrichment of waters in Hyalite Reservoir can only be hypothe- sized at this time. Certainly, some of the differences in the partial inflow-outflow budgets may be account- ed by the facts tha t the budget covers only five months, and that some contributions from the early spring runoff are not included. But, because there were greater than five exchanges of reservoir waters between June 1 and September 30,1976, and because during th i s period average concentrations for orthophosphate and total inorganic nitrogen were sig- nificantly greater in the water nearest the outlet, some enrichment within the reservoir had to occur.
Two basic mechanisms have been proposed t o explain elevated nutrients in reservoir outflows. First, nitrogen fixation by blue-green algae is seen frequently as the most direct cause of a t least a por- tion of the elevated nitrogen concentrations in reser- voir discharges (Hynes, 1970; Rada and Wright,
-
WATER RESOURCES BULLETIN
TABLE 3. Average Intlow-Outflow Budgets (kgmd-l) During June 7 to November 3,1976, for Ammonia and Nitrate Nitrogen (NH3-N and NOS-N) and Ortho- and Total Phosphate Phosphorus (OpO4-P and "04-P) in Hyalite
Reservoir Based on (1) Individual Chemical Measures and Corresponding Interval Flows and (2) Means (fl SD) for Chemical Measures and 'Ibtal Flows During the Study.
m3-N NOrN OPO4-P m 4 - P
'Ibtal Input
Net Change Percent Change
Total output
Total Input
Net Chanp Percent Change
Total output
Budget Based on Individual Measuree and Interval Flowe
1979). Second, while lakes and reservoirs with sur- face outlets allow nutrients to settle from the surface t o deeper waters and t o the sediments, removing nutrients from surface outflows, reservoirs with deep- water outlets continually discharged settling nutri- ents, elevating outflow over inflow concentrations (Wright, 1967; Martin and Arneson, 1978).
A combination of mechanisms likely accounted for phosphorus and nitrogen enrichment in Hyalite Reservoir. Some unknown concentrations of these nutrients could have entered with groundwater influxes; although contributions of nitrogen from this source must be small due to (1) low nitrogen concen- trations in the geology of the watershed, and (2) the likelihood that direct groundwater contributions were relatively unimportant (see discussion of conductivity data). Also, some enrichment could have resulted from nutrients released from sediments exposed to the atmosphere during drawdown, a process that accelerates decomposition of organic materials (Rada and Wright, 1979). And, some of the increase of both N and P could have resulted from decomposition and mineralization (1) of organic particles settling from the euphotic zone and (2) of organic and inorganic sediments.
Nitrogen fixed by Aphanizomenon flow-aquae was suggested as the principal cause of nitrogen enrich- ment in outflows from Canyon Ferry Reservoir, Montana (Rada, 1974; Rada and Wright, 1979). As noted in the next section, substantial blooms of this species occurred in Hyalite Reservoir. Therefore, nitrogen fixed by this species and subsequently min- eralized could have been the principal source of nitro- gen enriching effluents from Hyalite Reservoir.
WATER RESOURCES BULLETIN
Chlorophyll and Phytoplankton Dominance
During this study, average concentrations of chloro- phyll a in the euphotic zone samples displayed general trends of temporal increase (1 to 8 rngL-l). This trend was interrupted by the strong down- reservoir winds in mid-August. Subsequently, the temporal trend of chlorophyll increase continued and a spatial trend also developed with greater chloro- phyll concentrations nearer the dam. On Septem- ber 27, 1976, chlorophyll a concentrations in the sam- ples from the site nearest the dam (18.5 m g m d ) was almost six-times greater than concentrations mea- sured in samples from the two respectiye up-reservoir sites (3.2 and 2.3 mgm4). However, because of high variances due to temporal variations, average concen- trations were not significantly different among euphotic zone composite samples.
The temporal increase of chlorophyll concentra- tions accompanied a bloom of Aphanizomenon ftos- aquae. Between August 16 and September 27, at Site HR1 the densit of this species increased from 0.1 to over 5 mm3-L-r. Growth of this species at the other sites was less dramatic and population densities decreased after September 13. Dense blooms by this species in Hyalite Reservoir were similarly reported during 1974 and 1975 (Wells, 1976).
Aphanizomenon blooms are often associated with problems in eutrophic lakes. Their dense blooms in this reservoir apparently relates primarily to the abil- ity of this species to compensate for low environmen- tal nitrogen by fixing molecular nitrogen (Stewart, 1973). Previous studies also suggest that low carbon dioxide tensions can also contribute to the succession
22
Limnological Properties of a Rocky Mountain Headwater Reservoir
of blue-green bacteria t o dominance in the phyto- plankton (King, 1970). While evidence of low carbon dioxide tensions in Hyalite Reservoir is only circum- s tan ti a1 (low alkalinities and high photosynthesis rates), it may have also contributed to causing the bloom in Hyalite Reservoir.
Carlson (1977) suggested that TSIChl is the most reli- able measure; and when T S I T ~ greatly exceeds TSIChl during the summer, phosphorus is not the principal limiting nutrient (as noted above for Hyalite Reservoir). Based on the TsIchl, this reservoir could be considered mesotrophic, agreeing with the classifi- cation obtained using Rodhe's index.
Primary Productivity and lhphic Status Hydrodynamics
Limnetic primary productivity estimated during the growing season in Hyalite Reservoir averaged 187 mg Cm-2-d-1, with levels at Site HR2 always less than found at Site HR1. Maximum estimated produc- tivity at Site HR1 (518 mg C.m-20d-1) occurred on September 21, and at Site HR2 (298 mg C*m-z-d-l) on September 13 (Figure 4).
I I I
JULY AU 0 SEW 1976
Figure 4. Temporal Eetimates of himary Productivity at the Two Deep-Water Sampling Sites in
Hyalite Reservoir During 1976.
Rodhe (1969) proposed that mean photoplankton productivities in oligotrophic lakes range from 30 to 110 mg C.m-2-d-1 during the growing season and in naturally eutrophic lakes range from 300 to 1,000 mg C-m-2-d-1. Based on the mean growing season pro- ductivity estimated for 1976, Hyalite Reservoir ranks on Rodhe's scale between oligotrophic and natural eutrophic, i.e., mesotrophic.
Carlson (1977) proposed a numerical trophic state index (TSI) calculated from secchi disk, chlorophyll a, or total phosphorus measurements, with TSI values ranging from 0 to 100. The latter two measures were applied to the data from Hyalite Reservoir. Here, the TSI based on chlorophyll (TSIChl) equaled 46 and the total phosphorus based index (TSITP) equaled 64.
Nee1 (1963) observed that tributary inflows may pass through reservoirs as underflows, overflows, interflows, or en masse as discrete bodies of slowly moving water following prior inflows. Specific flow patterns depend on the relative thermal or chemical densities of reservoir and influent waters, and circula- tion patterns caused by inflow-, outflow-, and wind- generated currents (Baxter, 1977).
During most of the study of Hyalite Reservoir, tem- perature, conductivity, and oxygen isoclines indicate that tributary inflows tended to mix with reservoir waters primarily in the shallow end of the reservoir. Isotherms and conductivity isoclines suggest the pres- ence of interflows on August 2 and 30; a possible over- flow on September 13; and the presence of strong underflow on September 21 extending past the middle of the reservoir, at Site HR3 on this date a 3°C differ- ence occurred in the l-m between the surface and the bottom (cf., Figures 1,2, and 3).
Miller and Rabe (1969) observed that both physical and chemical patterns in reservoirs can be strongly influenced by widely fluctuating water levels caused by drawdown. Various plots shown in Figures 1, 2, and 3 suggest masses of water being drawn toward the outlet and isolated cells of water 5- to 10-m above the outlet. These cells were possibly entrained by eddy currents caused by the vortex to the outlet.
.
CONCLUSIONS
While this study was relatively brief (biweekly samplings for within reservoir dynamics from July to September, weekly samplings for inflow-outflow chemistries from June t o November, and biweekly da ta for outflow hydrologies from March to December), i t yielded clear evidence that smaller, high-elevation headwater reservoirs can include many of the same characteristics reported for larger, low-elevation systems. First, annual hydraulic reten- tion times in these reservoirs can average within the range reported for larger, low-elevation reservoirs; however, retention times during spring and early
23 WATER RESOURCES BULLETIN
Marcus
summer can be brief in headwater systems. Thus, over the annual cycle, montane, headwater reservoirs can show considerable fluctuations in water retention times. But not all montane, headwater reservoirs necessarily display short retention times (McAfee, 1980).
Those headwater watersheds predominated by igneous or metamorphic geologies, i.e., those having relatively high resistances to weathering, can have relatively low dissolved concentrations for most min- erals and nutrients. Seasonal changes in salinity in these headwater systems may primarily result from changes in the relative contributions from surface runoff and groundwater, rather than from evapocon- centration, as oRen reported for lower elevation sys- tems.
Spatial trends for temperature, oxygen, phospho- rus and nitrogen, commonly associated with low ele- vation reservoirs having deep-water outlets (Wright, 1967), also can occur in montane, headwater reser- voirs. That is, thermal stratification can develop and deep-water masses can act as heat sinks. Apparently, oxidation processes can decrease pH and oxygen con- centrations in the near-bottom waters. Also, outflow waters can show nutrient elevations over inflow waters due to mineralization and leaching of nutri- ents from (1) sediments, (2) newly exposed shorelines, and/or (3) particles settled from the trophogenic zone.
Despite the generally high natural quality of waters in montane reservoirs, biological productivity is not necessarily limited by low nutrient concentra- tions. In those systems where volcanic rocks in the watershed provide adequate supplies of phosphorus, this study suggests that nitrogen fixation by blue- green bacteria can result in relatively high algal pro- ductivities and contribute t o elevated nitrogen concentrations in the outflow waters.
Due to the relatively small size and rapid hydraulic turnover rates during portions of the year, internal circulation patterns in small, headwater reservoirs can be influenced by inflow and outflow currents, characteristic of large reservoirs, and temperature and wind caused currents, characteristic of natural lakes (Baxter, 1977). Overall, internal flow patterns observed in Hyalite Reservoir appeared to be primari- ly influenced by wind mixing and high discharge rates; thermal influences were largely confined to the shallow portion of the reservoir.
WATER RESOURCES BULLETIN
ACKNOWLEDGMENTS
I thank personnel at the Departments of Miocrobiology and Biology, Montana State University, for technical support during sample collection and analysis; and at the Department of Zoology and Physiology, The University of Wyoming, for support during data analysis and report preparation. I particularly thank J. Schillinger, K. hgan, S. a rbak , and M. Niquist for excellent sam- pling and analytical assistance, and J. C. Wright, R. W. Brocksen, H. L. Bergman, and M. Parker for valuable technical advice. This work was supported by the United States Department of Interior, Office of Water Research and Technology Grant 14-34-0001-6207, Wyoming Water Research Center Grant 5-38669, and Western Aquatics, Inc.
LITERATURE CITED
American Public Health Association (APHA), 1971. Standard Methods for the Examinations of Water and Waste Water, 13th Edition. American Public Health Association, Washington, D.C.
American Society for Testing and Material (ASTM), 1975. Annual Book of ASTM Standards, Water, Part 31. American Society for Testing and Materials, Philadelphia, Pennsylvania.
Baxter, R. M., 1977. Environmental Effects of Dams and Impoundments. Annu. Rev. Ecol. Syst. 8:255-283.
Baxter, R. M., 1985. Environmental Effects of Reservoirs. In: Microbial Processes in Reservoirs, D. Gunnison (Editor). Junk Publishers, Boston, Massachusetts, pp. 1-26.
Carlson, R. E., 1977. A Trophic State Index for Lakes. Limnol. Oceanogr. 22:361-369.
Chadwick, R. A., 1969. The Northern Gallatin Range, Montana: Northwestern Part of the Absaroka-Gallatin Volcanic Field. Contrib. Geol. 8:150-166.
Dillon, D. J. and W. B. Kirchner, 1975. The Effects of Geology and Land Use on the Export of Phosphorus from Watersheds. Water
Gloss, S. P., L. H. Mayer, and D. E. Kidd, 1980. Advective Control of Nutrient Dynamics in the Epilimnion of a Large Reservoir.
Hach Chemical Company, 1973. Hach Water Analysis Handbook. Hach Chemical Co., Ames, Iowa.
Hrbacek, J. and M. Straskraba, 1966. Horizontal and Vertical Distribution of Temperature, Oxygen, pH and Water Movement in Slapy Reservoir (1958-1960). Hydrobiol. Stud. 1:7-40.
Hutchinson, G. E., 1957. A Treatise on Limnology, Volume 1: Geography, Physics, and Chemistry. John Wiley, Inc., New York, New York.
Hynes, H. B. N., 1970. The Ecology of Running Water. University of Toronto, Toronto, Ontario.
Kimball, H. H., 1928. Amount of Solar Radiation that Reaches the Surface of the Earth on the Land and on the Sea and the Methods by Which it was Measured. Mon. Weather Rev. 66:393- 398.
King, D. L., 1970. The Role of Carbon in Eutrophication. J. Water Pollut. Control Fed. 42:2035-2051.
LaBaugh, J. W., 1985. Uncertainty in Phosphorus Retention, Williams Fork Reservoir, Colorado. Water Resour. Res. 2k1684- 1692.
LaBaugh, J. W. and T. C. Winter, 1984. The Impact of Uncertainty in Hydrological Measurement on Phosphorus Budgets and Empirical Models for Two Colorado Reservoirs. Limnol. Oceanogr. 29:322-339.
Marcus, M. D., 1980. Periphytic Community Response to Chronic Nutrient Enrichment by a Reservoir Discharge. Ecology 61:387- 399.
Res. 9~135-148.
Lim01. 0 ~ e a n 0 ~ . 25~219-228.
24
Limnological Properties of a Rocky Mountain Headwater Reservoir
Marcus, M. D., J. E. Schillinger, and D. G. Stuart , 1978.
Responses of Lotic Periphyton to Deep Water Reservoir Discharges, Grazing and Logging. Report 92, Montana University Joint Water Resources Research Center, Bozeman, Montana.
Martin, D. B., 1967. Limnological Studies on Hebgen Lake, Montana. Ph.D. Thesis, Montana State University, Bozeman, Montana.
Martin, D. B. and R. D. Ameeon, 1978. Comparative Limnology of a Deep-Discharge Reservoir and a Surface-Discharge Lake on the Madison River, Montana. Fmshwater Biol. 8:33-42.
McAfee, M. E., 1980. Effects of Water Drawdown on the Fauna in Small Cold Water Reservoirs. Water Resour. Bull. 16(4):690- 696.
Miller, G. W. and F. W. Rabe, 1969. A Limnological Comparison of ‘ h o Small Idaho Reservoirs. Hydrobiol. 32:523-646.
Neel, J. K., 1963. Impact of Reservoirs. In: Limnology in North America, D. G. Frey (Editor). University of Wisconsin ~ B S , Madison, Wisconsin, pp. 676-693.
Pennak, R. W., 1949. Annual Limnological Cycles in Some Colorado Reservoir Lakes. Ecol. Monogr. 19243-266.
Rada, R. G., 1974. An Investigation Into the Trophic Status of Canyon Ferry Reservoir, Montana. Ph.D. Thesis, Montana State University, Bozeman, Montana.
Rada, R. G. and J. C. Wright, 1979. Factors Affecting Nitmgen and Phosphorus Levels in Canyon Ferry Reservoir, Montana, and Its Emuent Waters. Northwest Sci. 63:213-220.
Rodhe, W., 1969. Crystallization of Eutrophication Concepts in Northern Europe. In: Eutrophication Causes, Consequences, Conectivee. National Academy of Sciences, Washington, D.C., pp. 50-64.
Ryther, J. H. and C. S. Yentch, 1967. The Estimation of Phytoplankton Production in the Ocean from Chlorophyll and Light Data. Limnol. Oceanogr. 3:281-286.
Schillinger, J. E. and D. G. Stuart, 1978. Quantification of Non- Point Water Pollution from Four Land Use Activities: Logging, Cattle Grazing, Mining, and Subdivisions. Report 93, Montana University Joint Water Resources Research Center, Bozeman, Montana.
Soltero, R. A., J. C. Wright, and A. A. Horpestad, 1973. Effects of Impoundment on the Water Quality of the Bighorn River. Water
Stewart, W. D. P., 1973. Nitrogen Fixation. In: The Biology of Blue-Green Algae, N. G. Carr and B. A. Whitton (Editors). Blackwell Publishers, London, England, pp., 260-278.
Strickland, J. D. H. and T. R. Parsons, 1972. A Practical Handbook of Seawater Analysis. Bull. Fish. Res. Can. 167,311 pp.
Stumm, W. and J. J. Morgan, 1970. Aquatic Chemistry, an Introduction Emphasizing Chemical Equilibria in Natural Waters. Wiley-Interscience, New York, New York.
United States Envimnmental Protection Agency (U.S. EPA), 1974. Methods for Chemical Analysis of Waters and Wastes. National Environmental Research Center, U.S. EPA, Cincinnati, Ohio.
Weber, C. I. (Editor), 1973. Biological Field and Laboratory Methods for Measuring the Quality of Surface Waters and Effluents. EPA-67014-73-001, U.S. EPA, Cincinnati, Ohio.
Wells, J. D., 1976. The Fishery of Hyalite Reservoir During 1974 and 1975. M.S. Thesis, Montana State University, Bozeman, Montana.
Wetzel, R. G., 1976. Limnology. W. B. Sanders Company, Philadelphia, Pennsylvania.
Whalen, S. C., S. A. b a t h , R. W. Gregory, and J. C. Wright, 1982. Physiochemical Limnology of the Tongue River Reservoir, Montana. Hydmbiol. 89: 161-176.
Wright, J. C., 1961. The Limnology of Canyon Ferry Reservoir: IV. The Estimation of Primary Production from Physical Limnological Data. Limuol. Oceanogr. 6:330-337.
Wright, J. C., 1967. Effects of Impoundment on productivity, Water Chemistry, and Heat Budgets of Rivers. In: Resemir Fishery
Symposium. American Fisheries Society, Bethesda, Maryland, Limnological Studies in Montana: Hyalite Reservoir and pp. 188-199.