The application of the CHEMTAX program to pigmentdata from phytoplankton samples has been shown to be auseful tool in marine environments for several purposes,including medium-large scale analysis of phytoplankton classdistribution in the open ocean (Schlüter et al. 2000; Wrightand Van der Enden 2000; Vidussi et al. 2000; Higgins andMackey 2000; Gibb et al. 2001; Latasa et al. 2005) and zoo-plankton feeding studies (Irigoien et al. 2000; Guisande et al.2002). However, the application of CHEMTAX in freshwater
environments has received little attention (Buchaca et al.2004; Fietz and Nicklisch 2004; Descy et al. 2005; Schlüter etal. 2006).
A critical point when using the CHEMTAX program infreshwater environments is the lack of suitable matrices of pig-ment ratios that could be used in a wide range of environ-ments. Schlüter et al. (2006) demonstrated that, under con-trolled conditions, different temperature and light treatmentshad a relatively insignificant impact on the absolute values forthe diagnostic pigment/Chl a ratios in 20 freshwater phyto-plankton species, with the exception of a considerable varia-tion in the zeaxanthin/Chl a and alloxanthin/Chl a ratios forcyanobacteria and cryptophytes. This may indicate thatCHEMTAX could also be applicable to freshwater phytoplank-ton. However, it has not been tested whether or not pig-ment/Chl a ratios are also constant in the field under differentenvironmental conditions.
The problem of testing different pigment ratios in distinctenvironments is that it is necessary to corroborate the validity
Testing of the CHEMTAX program in contrasting Neotropicallakes, lagoons, and swampsCástor Guisande1*, Aldo Barreiro1, Alberto Acuña1, Lili J. Marciales2, Esnedy Hernández3, Angélica M. Torres2,Nelson Aranguren4, Willian López4, Santiago R. Duque2, Lina J. Gallo3, Néstor Aguirre3, Marta Mogollón5, JaimePalacio3, and Guillermo Rueda-Delgado6
1Facultad de Ciencias, Universidad de Vigo, Campus Lagoas-Marcosende, 36310-Vigo, Spain2Instituto Amazónico de Investigaciones-IMANI, Universidad Nacional de Colombia, 215, Leticia, Colombia3Grupo de Investigación en Gestión y Modelación Ambiental – GAIA, Universidad de Antioquia, Medellín, Colombia4Unidad de Ecología en Sistemas Acuáticos-UDESA, Universidad Pedagógica y Tecnológica de Colombia, Carretera Central delNorte, Tunja, Boyacá, Colombia5Universidad de Córdoba, Programa de Biología, Facultad de Ciencias Básicas e Ingenierías, Carrera 6 N 76_ 103 Montería,Córdoba, Colombia6Laboratorio de Limnología, Universidad Jorge Tadeo Lozano, Carrera 4 No 22-61. Modulo 5 Piso 8, Bogotá, Colombia
AbstractThe problem using the CHEMTAX program in freshwater environments is that the few matrices of pigment
ratios available have not been tested in a wide range of environments. Sixteen Amazonian, Andean, andCaribbean lakes, lagoons, and swamps were sampled over a year. The aim was to determine if it was possible toobtain a reliable matrix of input pigment ratios that may be used in freshwater habitats with different envi-ronmental conditions. There were no clear differences among regions for most of the ratios of marker pigmentsto Chlorophyll a (Chl a) in most of the phytoplankton groups. Only the zeaxanthin/Chl a ratio showed clearvariations among areas. The estimates for the mean relative contribution of each phytoplankton group calcu-lated for the pigment ratios obtained in each separate habitat and season were very similar to the estimates cal-culated using the average pigment ratio obtained for all habitats and seasons. Our study suggests that the matrixof the average pigment ratio obtained in this study can be used to estimate phytoplankton class abundanceswith the CHEMTAX program in freshwater habitats with different limnological conditions.
AcknowledgmentsThis study was supported by AECI project A/3326/05, XUNTA de
Galicia, Universidad de Vigo, Universidad Nacional de Colombia,Universidad Pedagógica y Tecnológica de Colombia and a FPU(University Staff Training) grant to A. Barreiro.
of the prediction of the CHEMTAX program by estimatingphytoplankton class abundances under the microscope. Therecent advances in the application of CHEMTAX, whichgreatly improve the fitting of the input pigment ratio matrixto the actual ratios (Latasa 2007), could overcome this prob-lem. The study of Latasa with synthetic sets of samplesshowed that after 6-10 runs, when using the output matrix asa new input matrix in successive runs of CHEMTAX, in mostcases, the estimated ratios significantly matched the true ones,with the exception of haptophytes.
In our study, the phytoplankton pigments and physico-chemical characteristics were analyzed of samples taken overthe year in 16 Neotropical lakes, lagoons, and swamps,accounting for considerable environmental variation. Theaims were to compare the limnological characteristics, pig-ment profiles, and phytoplankton groups among areas, and todetermine whether it was possible to obtain a reliable matrixof input pigment ratios, which may be used in freshwaterhabitats with different environmental conditions.
Materials and proceduresField sampling—The location of the lakes, lagoons, and
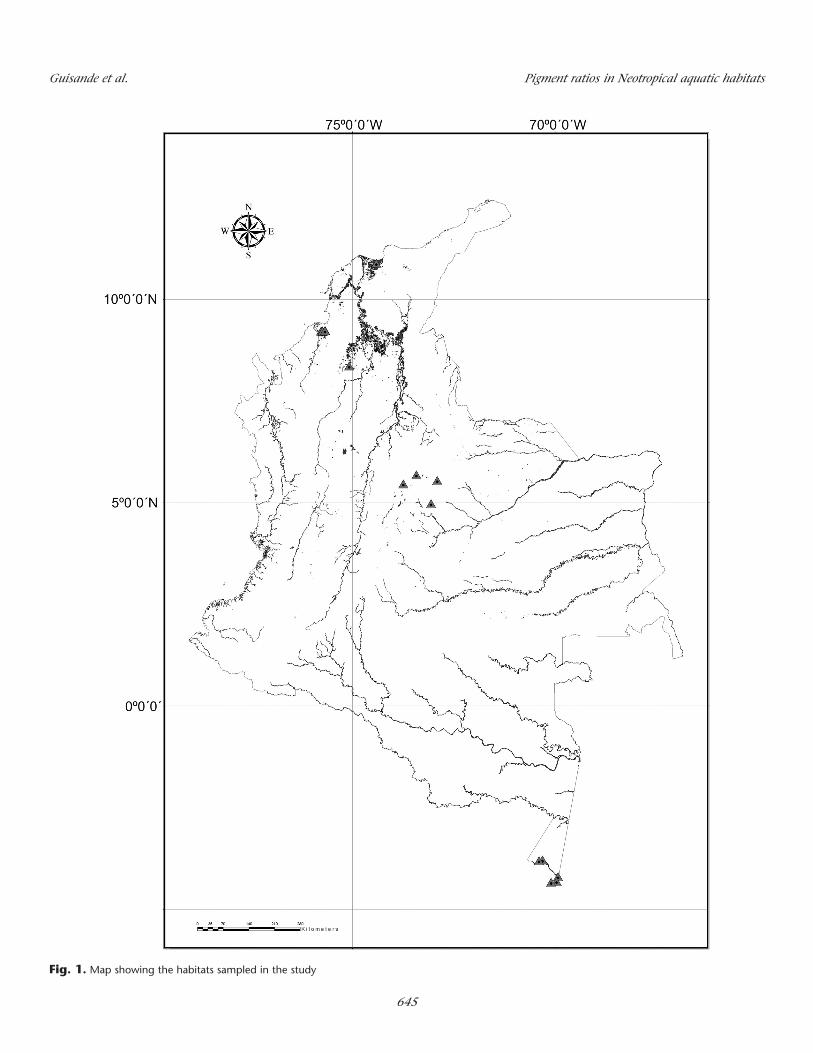
swamps sampled in this study is shown in Fig. 1. Several sam-pling stations were used for each lake, with samples taken 1-4times over the year. This sampling design, which covers a highspatial variation and a small temporal variation, made it pos-sible to obtain phytoplankton communities under a widerange of environmental conditions.
In each sampling station, samples were taken at the surface,at the depth of Secchi disk and at the depth of three times Sec-chi disk with a 2.5 L Van Dorn bottle. For the quantificationof pigments, two replicates of 25-100 mL, depending on phy-toplankton biomass, were filtered on the boat through 13 mmWhatman GF/C filters (around 1.2 μm pore size) and thenstored in dark ultracentrifuge plastic tubes. The samples werestored at –20°C within 4 h of collection. A total of 558 samplesof pigment were analyzed.
At the three depths mentioned above, pH, conductivity,temperature, nitrate (NO–
3), silicate (SiO–2), and phosphate
(SiO–2) were analyzed. Filtered water (0.45 μm) was used for
analyzing nutrients with an autoanalyzer BRAN + LUEBBEAAIII (Norderstedt, Germany).
Pigment analysis by high-performance liquid chromatography(HPLC)—Filters with pigment samples were lyophilized insideeppendorff tubes in a Telstar lioalfa–6 device. Pigment extrac-tion was undertaken by adding 2 mL of 95% methanol to thelyophilized material, and then, the sample was homogenizedusing a pipette tip adapted to fit the shape of the vial. Markerpigments were analyzed following Zapata et al. (2000). Pig-ment profiles were analyzed by HPLC using a Waters AllianceSystem 2696, a 996 Waters photodiode array detector, and aWaters Symmetry C8 column (150 × 4.6 mm, 3.5 μm particlesize, 100 Å pore size). The results were processed withEmpower software (®2002 Waters Corp.).
CHEMTAX runs—The CHEMTAX program works with aninitial matrix of marker pigment/Chl a ratios, containing allvalues specific for each phytoplankton group (F matrix). Thereis also a sample matrix with the ratios of the same pigmentsmeasured in field samples (F). From these two matrices, theprogram calculates the proportion of each phytoplanktongroup (in terms of Chl a) present in the samples. The programalso changes the initial values of F in a more coherent estimateaccording to the ratios of the samples.
Sample matrices containing ratios of marker pigment/Chl awere created for each habitat and each season separately.Inside each lake, samples of all depths (when several depthswere sampled) were analyzed together when running theCHEMTAX program, which was set with all the defaultoptions (Mackey et al. 1996). The initial matrix of marker pig-ment/Chl a ratios for each phytoplankton group was the samein all the cases analyzed (Table 1). The values of this matrix arethe average value of each ratio considering all the matricesfrom Schlüter et al. (2006), which is the most complete set ofvalues reported in the literature for the application of CHEM-TAX to freshwater environments. The phytoplankton groupsincluded in the matrix were previously known from both themicroscopic counts (data not shown) and the marker pig-ments present in the samples. The xantophytes are notincluded in Schlüter et al. (2006) matrices, therefore pigmentcontent was taken from the following web pagehttp://www.jochemnet.de/fiu/bot4404/BOT4404_21.html (F. J.Jochem, Florida International University). However, as theratios for this group were unknown, they were set as an aver-age of the ratios for all other groups. The output matrix of pig-ment ratios from each run was used as input in the next run,as suggested by Latasa (2007), who showed that after 6-10runs, most of the ratios of matrices agreed significantly withthe true ratios. Following this procedure, to be more confidentabout the reliability of the matrices employed to yield thefinal solution, we performed 6 runs of CHEMTAX.
Statistical analyses—A discriminant analysis (a multivariatevariable statistical method) was applied to the data. Discrimi-nant analysis is a pattern-recognition method that helps toseparate 2 or more groups from data provided for several vari-ables (Guisande et al. 2006). Discriminant analysis has beensuccessfully used in the identification of phytoplanktongroups using pigment markets (Guisande et al. 2002).
AssessmentLimnological characteristics—Fig. 2 shows that there were
important differences in the limnological characteristicsamong areas, corroborating that the study covered a widerange of environmental conditions.
Phosphate concentrations were usually low and did notshow important differences among areas, with the exceptionof the relatively low concentrations observed in the swamps ofthe Sinú basin. Nitrate concentrations were below or around 1μM, which can be considered moderately low, although the
Guisande et al. Pigment ratios in Neotropical aquatic habitats
644
Guisande et al. Pigment ratios in Neotropical aquatic habitats
645
Fig. 1. Map showing the habitats sampled in the study
Ayapel swamp showed higher values. Silicate was high in mostareas, with the exception of the Andean aquatic habitats andthe Zacambú and Javarí lakes in the Amazon.
Conductivity was high in the Caribbean swamps (the Mag-dalena basin), particularly in Pajarales and Isla San Antonio,but with the variations within an area showing differentdegrees of interaction with marine and freshwater systems. Atthe lower end were lake Guatavita and the lagoon Iguaque,which had the lowest conductivity values.
The pH values tended to be acidic in most of the systems,but the Magdalena basin showed more alkaline values, possi-bly due to a greater marine influence. Temperatures were quitesimilar in all lakes, but lower in Andean systems, due to thehigher altitude.
The Secchi disk was similar among areas, with the excep-tion of Tota Lake and Iguaque in the Andes, with higher trans-parency than in other habitats (Fig. 2).
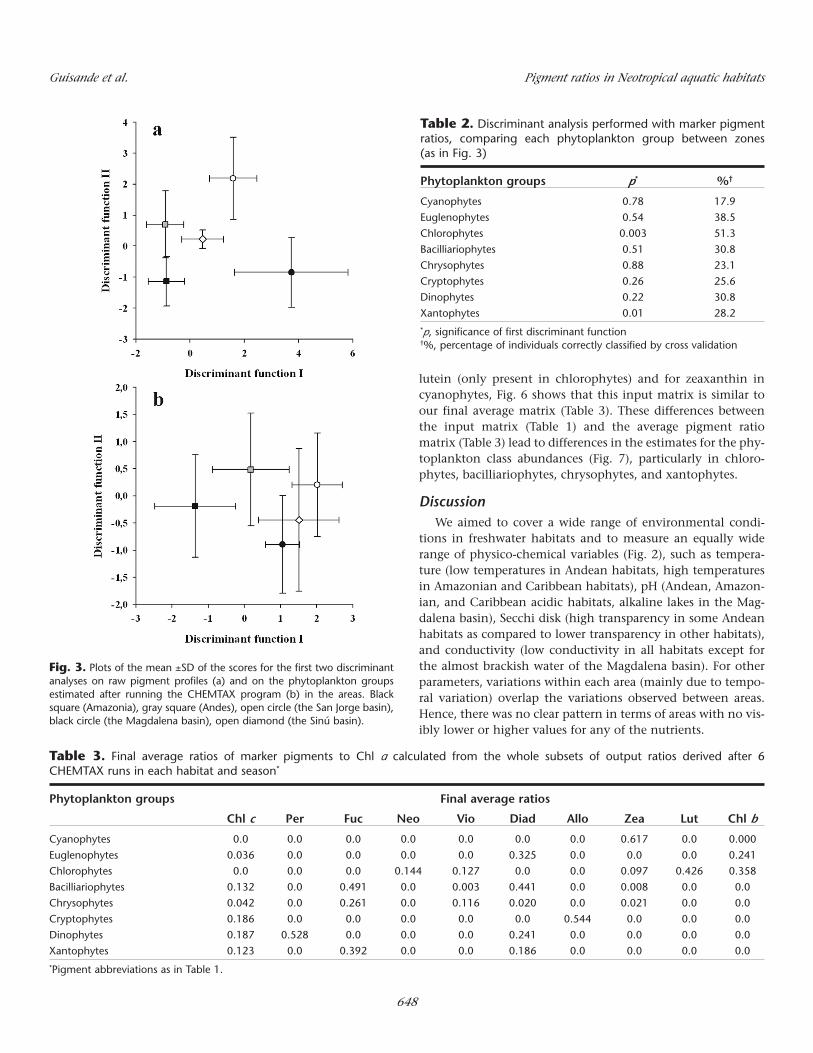
Pigment profiles—There were significant differences in pig-ment profiles among areas (Fig. 3a). A discriminant analysisperformed on the raw data (pigment profiles, pigment to Chla ratios), considering the different geographical areas as differ-ent groups, showed that all discriminant functions were sig-nificant (<0.001), and the percentage of cases correctly classi-fied by cross-validation was 80.8%. The first discriminantfunction seems to separate the phytoplankton communities ofAmazonia and the Andes on one side and the Caribbean onthe other (with the Magdalena basin in the most extreme posi-tion in this latter group). However, a discriminant analysisperformed on the phytoplankton groups estimated after run-ning CHEMTAX, considering also the different geographicalareas as different groups, showed that all discriminant func-tions were significant (<0.001), but the percentage of casescorrectly classified by cross-validation was lower than with theraw data, only 62.7%.
Pigment ratios—A discriminant analysis was performed foreach phytoplankton group comparing the ratios of markerpigments between lakes (average ratios considering all depthsfor the different seasons were used as replicates within eachlake). Table 2 shows the results of this discriminant analysis.
The first discriminant function was only significant forchlorophytes and xantophytes. In the case of chlorophytes,the first discriminant function was significant due to the pig-ment lutein and in xantophytes due to the pigment fucoxan-thin. The percentage of cases correctly classified by cross-vali-dation was always low, even in chlorophytes and xantophytes(Table 2). Therefore, these results show no clear differencesamong regions in the ratios of marker pigments to Chl a formost of the phytoplankton groups, because it was not possibleto discriminate areas according to their pigment ratios for anyof the phytoplankton groups.
Generating an average pigment ratio matrix—Considering theinterest of obtaining an input ratio matrix that can be used infreshwater habitats with a broad range of environmental con-ditions, we calculated an average matrix with the values of theoutput matrices (after the 6 runs) from all lakes during all theseasons sampled. Table 3 shows this average output matrix,which was used as input matrix in the CHEMTAX programwith the whole set of samples (all habitats and all seasons).Zeaxanthin and alloxanthin were the pigments that show ahigher variation (Fig. 4), whereas for the rest of the main pig-ments the variation was low.
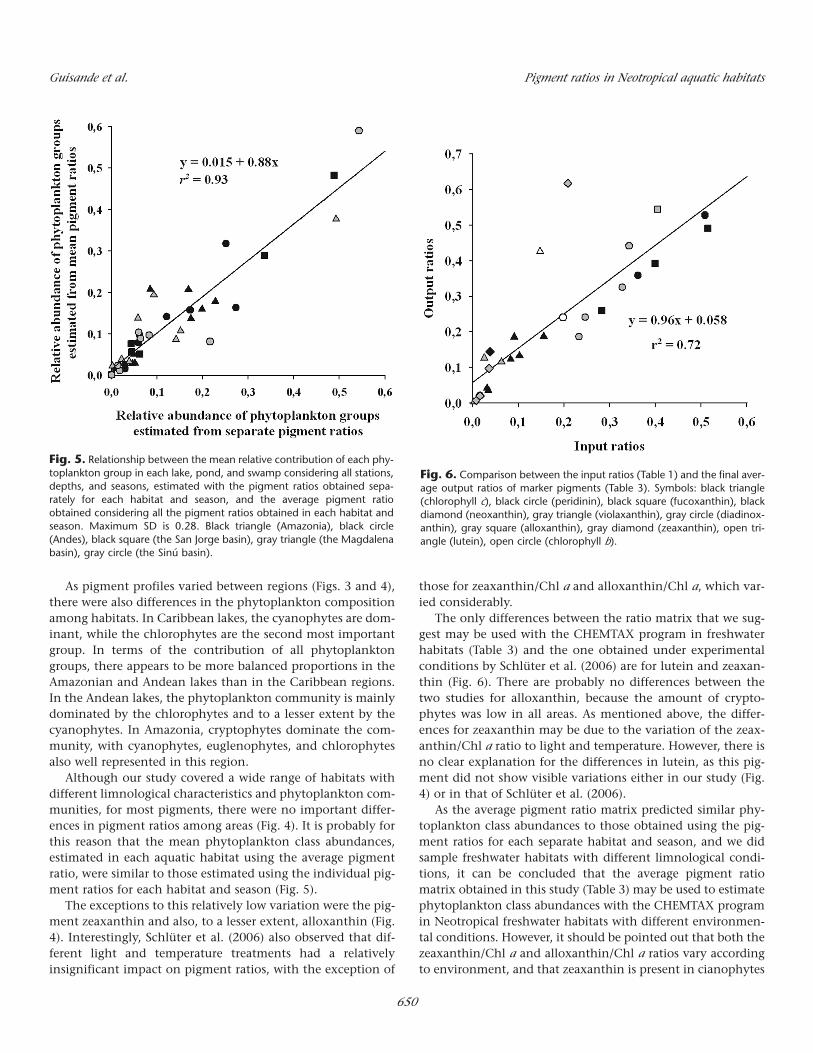
Fig. 5 shows that the estimates of the mean relative contri-butions of each phytoplankton group in each habitat weresimilar when they were calculated with the pigment ratiosobtained in each habitat and season separately than when theestimates were calculated with the average pigment ratioobtained considering all habitats and seasons. As each phyto-plankton group pair was not independent of the others, abootstrap method was used to evaluate the statistical signifi-cance of this relationship (Davison and Hinkley 1997). Regres-sion was recalculated 1,000 times using random series inwhich only 50% of the abundance data were used to calculatethe correlation. In all cases, the slope of the regression wasboth positive and significantly different from zero.
The pigment ratio used in our study as input matrix (Table1) is, as mentioned in material and methods, generally thematrix obtained under experimental conditions by Schlüter etal. (2006). Although there are some differences, particularly for
Guisande et al. Pigment ratios in Neotropical aquatic habitats
646
Table 1. Initial input matrix of marker pigment/Chlorophyll a ratios belonging to each phytoplankton group
Phytoplankton groups Marker pigment/Chl a ratio*
Chl c Per Fuc Neo Vio Diad Allo Zea Lut Chl bCyanophytes 0.0 0.0 0.0 0.0 0.0 0.0 0.0 0.208 0.0 0.0
Xantophytes 0.082 0.0 0.399 0.0 0.0 0.233 0.0 0.0 0.0 0.0*Chl c (chlorophyll c1 + c2), Per (peridinin), Fuc (fucoxanthin), Neo (neoxanthin), Vio (violoxanthin), Diad (didinoxanthin), Allo (alloxanthin), Zea (zeax-anthin), Lut (lutein), Chl b (chlorophyll b)
Guisande et al. Pigment ratios in Neotropical aquatic habitats
647
Fig. 2. Limnological parameters measured in the study. Lake abbreviations: C (Correo), T (Tarapoto), Y (Yahuarcaca), Z (Zacambú), J (Javarí), F(Fúquene), G (Guatavita), Ig (Iguaque), T (Tota), Sa (San Antonio), P (Pajarales), I (Isla Salamanca), M (Momil), Ss (San Sebastián), P (Purísima), and A(Ayapel).
lutein (only present in chlorophytes) and for zeaxanthin incyanophytes, Fig. 6 shows that this input matrix is similar toour final average matrix (Table 3). These differences betweenthe input matrix (Table 1) and the average pigment ratiomatrix (Table 3) lead to differences in the estimates for the phy-toplankton class abundances (Fig. 7), particularly in chloro-phytes, bacilliariophytes, chrysophytes, and xantophytes.
DiscussionWe aimed to cover a wide range of environmental condi-
tions in freshwater habitats and to measure an equally widerange of physico-chemical variables (Fig. 2), such as tempera-ture (low temperatures in Andean habitats, high temperaturesin Amazonian and Caribbean habitats), pH (Andean, Amazon-ian, and Caribbean acidic habitats, alkaline lakes in the Mag-dalena basin), Secchi disk (high transparency in some Andeanhabitats as compared to lower transparency in other habitats),and conductivity (low conductivity in all habitats except forthe almost brackish water of the Magdalena basin). For otherparameters, variations within each area (mainly due to tempo-ral variation) overlap the variations observed between areas.Hence, there was no clear pattern in terms of areas with no vis-ibly lower or higher values for any of the nutrients.
Guisande et al. Pigment ratios in Neotropical aquatic habitats
648
Table 2. Discriminant analysis performed with marker pigmentratios, comparing each phytoplankton group between zones (as in Fig. 3)
Phytoplankton groups p* %†
Cyanophytes 0.78 17.9
Euglenophytes 0.54 38.5
Chlorophytes 0.003 51.3
Bacilliariophytes 0.51 30.8
Chrysophytes 0.88 23.1
Cryptophytes 0.26 25.6
Dinophytes 0.22 30.8
Xantophytes 0.01 28.2*p, significance of first discriminant function†%, percentage of individuals correctly classified by cross validation
Table 3. Final average ratios of marker pigments to Chl a calculated from the whole subsets of output ratios derived after 6 CHEMTAX runs in each habitat and season*
Xantophytes 0.123 0.0 0.392 0.0 0.0 0.186 0.0 0.0 0.0 0.0*Pigment abbreviations as in Table 1.
Fig. 3. Plots of the mean ±SD of the scores for the first two discriminantanalyses on raw pigment profiles (a) and on the phytoplankton groupsestimated after running the CHEMTAX program (b) in the areas. Blacksquare (Amazonia), gray square (Andes), open circle (the San Jorge basin),black circle (the Magdalena basin), open diamond (the Sinú basin).
Guisande et al. Pigment ratios in Neotropical aquatic habitats
649
Fig. 4. Pigment ratios of the different phytoplankton groups considering all habitats, depths, and seasons. Pigment abbreviations as in Table 1.
As pigment profiles varied between regions (Figs. 3 and 4),there were also differences in the phytoplankton compositionamong habitats. In Caribbean lakes, the cyanophytes are dom-inant, while the chlorophytes are the second most importantgroup. In terms of the contribution of all phytoplanktongroups, there appears to be more balanced proportions in theAmazonian and Andean lakes than in the Caribbean regions.In the Andean lakes, the phytoplankton community is mainlydominated by the chlorophytes and to a lesser extent by thecyanophytes. In Amazonia, cryptophytes dominate the com-munity, with cyanophytes, euglenophytes, and chlorophytesalso well represented in this region.
Although our study covered a wide range of habitats withdifferent limnological characteristics and phytoplankton com-munities, for most pigments, there were no important differ-ences in pigment ratios among areas (Fig. 4). It is probably forthis reason that the mean phytoplankton class abundances,estimated in each aquatic habitat using the average pigmentratio, were similar to those estimated using the individual pig-ment ratios for each habitat and season (Fig. 5).
The exceptions to this relatively low variation were the pig-ment zeaxanthin and also, to a lesser extent, alloxanthin (Fig.4). Interestingly, Schlüter et al. (2006) also observed that dif-ferent light and temperature treatments had a relativelyinsignificant impact on pigment ratios, with the exception of
those for zeaxanthin/Chl a and alloxanthin/Chl a, which var-ied considerably.
The only differences between the ratio matrix that we sug-gest may be used with the CHEMTAX program in freshwaterhabitats (Table 3) and the one obtained under experimentalconditions by Schlüter et al. (2006) are for lutein and zeaxan-thin (Fig. 6). There are probably no differences between thetwo studies for alloxanthin, because the amount of crypto-phytes was low in all areas. As mentioned above, the differ-ences for zeaxanthin may be due to the variation of the zeax-anthin/Chl a ratio to light and temperature. However, there isno clear explanation for the differences in lutein, as this pig-ment did not show visible variations either in our study (Fig.4) or in that of Schlüter et al. (2006).
As the average pigment ratio matrix predicted similar phy-toplankton class abundances to those obtained using the pig-ment ratios for each separate habitat and season, and we didsample freshwater habitats with different limnological condi-tions, it can be concluded that the average pigment ratiomatrix obtained in this study (Table 3) may be used to estimatephytoplankton class abundances with the CHEMTAX programin Neotropical freshwater habitats with different environmen-tal conditions. However, it should be pointed out that both thezeaxanthin/Chl a and alloxanthin/Chl a ratios vary accordingto environment, and that zeaxanthin is present in cianophytes
Guisande et al. Pigment ratios in Neotropical aquatic habitats
650
Fig. 5. Relationship between the mean relative contribution of each phy-toplankton group in each lake, pond, and swamp considering all stations,depths, and seasons, estimated with the pigment ratios obtained sepa-rately for each habitat and season, and the average pigment ratioobtained considering all the pigment ratios obtained in each habitat andseason. Maximum SD is 0.28. Black triangle (Amazonia), black circle(Andes), black square (the San Jorge basin), gray triangle (the Magdalenabasin), gray circle (the Sinú basin).
Fig. 6. Comparison between the input ratios (Table 1) and the final aver-age output ratios of marker pigments (Table 3). Symbols: black triangle(chlorophyll c), black circle (peridinin), black square (fucoxanthin), blackdiamond (neoxanthin), gray triangle (violaxanthin), gray circle (diadinox-anthin), gray square (alloxanthin), gray diamond (zeaxanthin), open tri-angle (lutein), open circle (chlorophyll b).
Guisande et al. Pigment ratios in Neotropical aquatic habitats
651
Fig. 7. Comparison between the phytoplankton class abundances predicted by CHEMTAX using the initial input pigment ratio employed in this work(Table 1) and the average output pigment ratio matrix generated (Table 3).
and alloxanthin is present in cryptophytes. Therefore, it is pos-sible that there would be more errors when estimating thesetwo phytoplankton groups using the CHEMTAX program thanthere would be for other phytoplankton groups.
ReferencesBuchaca, T., M. Felip, and J. Catalan. 2004. A comparison of
HPLC pigment analysis and biovolume estimates of phyto-plankton groups in an oligotrophic lake. J. Plankton Res.27(1):91-101.
Davison, A. C., and D.V. Hinkley. 1997. Bootstrap methodsand their applications. Cambridge Univ. Press.
Descy, J.-P., and others. 2005. Phytoplankton pigments andcommunity composition in Lake Tanganika. FreshwaterBiol. 50:668-684.
Fietz, S., and A. Nicklisch. 2004. An HPLC analysis of the sum-mer phytoplankton assemblage in lake Baikal. FreshwaterBiol. 49:332-345.
Gibb, S. W., D.G. Cummings, X. Irigoien, R. G. Barlow, R.Fauziand, and C. Mantoura. 2001. Phytoplankton pigmenttaxonomy of the northeastern Atlantic. Deep-Sea Res. II48:795-823.
Guisande, C., I. Maneiro, I. Riveiro, A. Barreiro, and Y. Pazos.2002. Estimation of copepod trophic niche in the fieldusing amino acids and marker pigments. Mar. Ecol. Progr.Ser. 239:147-156.
———, A. Barreiro, I. Maneiro, I. Riveiro, A. Vergara, and A.Vaamonde. 2006. Tratamiento de datos. Díaz de Santos.
Higgins, H. W., and D. J. Mackey. 2000. Algal class abun-dances, estimated from chlorophyll and carotenoid pig-ments, in the western Equatorial Pacific under El Niño andnon-El Niño conditions. Deep-Sea Res. I 47:1461-1483.
Irigoien, X., R. N. Head, R. P. Harris, D. Cummings, and D.Harbour. 2000. Feeding selectivity and egg production ofCalanus helgolandicus in the English Channel. Limnol.Oceanogr. 45:44-54.
Latasa, M., X. A. G. Morán, R. Schare, and M. Estrada. 2005.
Estimating the carbon flux through main phytoplanktongroups in the Mediterranean. Limnol. Oceanogr.50(5):1447-1458.
———. 2007. Improving estimations of phytoplankton classabundances using CHEMTAX. Mar. Ecol. Progr. Ser. 329:13-21.
Mackey, M. D., D. J. Mackey, H. W. Higgins, and S. W. Wright.1996. CHEMTAX - a program for estimating class abundancesfrom chemical markers: application to HPLC measurementsof phytoplankton. Mar. Ecol. Progr. Ser. 144:265-283.
Schlüter, L., F. MØhlemberg, H. Havskum, and S. Larsen. 2000.The use of phytoplankton pigments for identifying andquantifying phytoplankton groups in coastal areas: testingthe influence of light and nutrients on pigment/chloro-phyll a ratios. Mar. Ecol. Progr. Ser. 192:49-63.
———, T. L. Lauridsen, G. Krogh, and T. Jørgensen. 2006.Identification and quantification of phytoplankton groupsin lakes using new pigment ratios – a comparison betweenpigment analysis by HPLC and microscopy. FreshwaterBiol. 51:1474-1485.
Vidussi, F., J. Marty, and J. Chiavérini. 2000. Phytoplanktonvariations during the transition from spring bloom to olig-otrophy in the northwestern Mediterranean Sea. Deep-SeaRes. I. 47:423-445.
Wright, S. W., and R. Van der Enden. 2000. Phytoplanktoncommunity structure and stocks in the East Antartic mar-ginal ice zone (BROKE survey, January-March 1996) deter-mined by CHEMTAX analysis of HPLC pigment signatures.Deep-Sea Res. II 47:2363-2400.
Zapata, M., F. Rodríguez, and J. L. Garrido 2000. Separation ofchlorophylls and carotenoids from marine phytoplankton.A new HPLC method using a reversed phase C8 column andpyridine-containing mobile phases. Mar. Ecol. Progr. Ser.195:29-45.
Submitted 31 January 2008Revised 13 September 2008
Accepted 15 November 2008
Guisande et al. Pigment ratios in Neotropical aquatic habitats


![RESEARCHARTICLE HigherFrequencyofNKandCD4 T-Cellsin ...bibliotecadigital.udea.edu.co/bitstream/10495/... · aslipopolysaccharides (LPS),from intestinal lumentosystemic circulation[3].Asaresult,](https://static.documents.pub/doc/80x56/5e2ab1d36b477e57ef2baee8/researcharticle-higherfrequencyofnkandcd4-t-cellsin-aslipopolysaccharides-lpsfrom.jpg)

![Nacionalismo, multiculturalismo y etnogénesis (las ... · AdVersuS, VII, 18, agosto 2010: 6-48 ISSN:1669-7588 ARTÍCULOS [Full paper] Nacionalismo, multiculturalismo y etnogénesis](https://static.documents.pub/doc/80x56/5bd8559e09d3f2e32f8c00dc/nacionalismo-multiculturalismo-y-etnogenesis-las-adversus-vii-18-agosto.jpg)


