Dissolved gases are powerful tracers for physical and bio-geochemical processes in aquatic systems. N2, O2, and Ar aretypically the three most abundant dissolved gases in theocean, and deviations from their saturation concentrations
can be used to assess influencing biological and physicalprocesses. O2 has long been used to assess primary productionand estimate carbon export in marine environments (e.g.,Gaarder and Gran 1927; Quay et al. 2010). Numerous studieshave examined the ratio of this nonconservative species toinert Ar to delineate the effects of biological from physicalprocesses such as bubble injection and temperature changes(Emerson et al. 1999; Hamme and Emerson 2004). In low oxy-gen environments, N2 is produced by microbially mediated N-loss processes (denitrification and anammox), and these rela-tively small biogenic additions are detected by high precisionmeasurement of N2/Ar (e.g., Kana et al. 1998; Devol et al.2006; Chang et al. 2010, 2012). The isotopic compositions ofthese dissolved gases, provide further insight into biogeo-chemical processes and their partitioning. Use of the δ18O ofdissolved O2 (δ18O2) to assess production and respiration in theocean goes back to Kroopnick and Craig (1976). Studies todate have used this parameter to partition the contributions ofwater column and benthic respiration, mixing, and gasexchange (Bender and Grande 1987; Quay et al. 1993; Quay et
A continuous flow isotope ratio mass spectrometry method forhigh precision determination of dissolved gas ratios and isotopiccompositionChawalit N. Charoenpong,1,2,3* Laura A. Bristow,1,4 and Mark A. Altabet11School for Marine Science and Technology, University of Massachusetts Dartmouth, New Bedford, MA, USA2Marine Chemistry and Geochemistry Department, Woods Hole Oceanographic Institution, Woods Hole, MA, USA3Earth, Atmospheric and Planetary Sciences Department, Massachusetts Institute of Technology, Cambridge, MA, USA4Nordic Center for Earth Evolution, Institute of Biology, University of Southern Denmark, Campusvej 55, 5230 Odense, Denmark
AbstractDissolved gas ratios and isotopic compositions provide essential information about the biological and phys-
ical mechanisms influencing N2, O2, and Ar in aquatic systems. Current methods available are either limited byoverall cost, labor-intensive sample collection and analysis, or insufficient precision. Here, we present a newhighly accurate and robust method for sample collection and subsequent simultaneous measurement of the dis-solved gas ratios (N2/Ar and O2/Ar) and isotopic compositions (δ15N2 and δ18O2) in seawater. The relatively sim-ple sampling procedure using low cost materials enables collection of hundreds to more than a thousand dis-crete samples on a single research cruise. Samples can be preserved and stored at room temperature and main-tain their integrity for many months. Laboratory analysis employs an on-line extraction system coupled to amulti-collector isotope ratio mass spectrometer (IRMS). A continuous flow of He carrier gas completely degassesthe sample, and passes through the preparation and purification system before entering the IRMS for analysis.The use of this continuous He carrier permits short analysis times (less than 8 min per sample) as comparedwith current high-precision methods. In addition to reference gases, calibration is achieved using air-equili-brated water standards of known temperature and salinity. Assessment of reference gas injections, air equili-brated standards, as well as samples collected in the field shows the accuracy and precision of this new methodto be equal to or better than current standard techniques.
AcknowledgmentWe thank the BATS team for measuring physical parameters and dis-
solved oxygen on the cruise as well as Elizabeth Lee for her help duringthe sampling. Support on board was offered by the officers and crew ofthe R/V Atlantic Explorer. Also, we are indebted to Pia H. Moisander(PHM) who led the cruise at BATS and was the PI of the project thatfunded the field sampling. Ralph Keeling supplied us with the atmos-pheric air reference. Finally, we thank Jennifer Larkum, Santhiska Pather,and Annie Bourbonnais for their assistance in the lab. CNC was fundedby Thailand’s Ministry of Science and Technology Fellowship andUniversity of Massachusetts Dartmouth research/teaching assistantship,and this work was funded by NSF OCE-0623199 to MAA, NSF OCE-0851092 to MAA, and NSF OCE-1130495 to PHM and MAA. We grate-fully acknowledge Michael DeGrandpre and two anonymous reviewersfor their constructive reviews of the manuscript.
al. 2010). The δ15N of dissolved N2 (δ15N2) has been used as apotent tracer for denitrification (e.g., Fuchsman et al. 2008).
Amongst many methods to measure dissolved gases in theocean, the determination of their ratios by mass spectrometryhas become standard as a powerful technique (Emerson et al.1999). Several analytical approaches are commonly used atpresent; membrane inlet mass spectrometry (MIMS) (e.g.,Tortell 2005; Kana et al. 1994) and equilibrator inlet massspectrometry (EIMS) (e.g., Cassar et al. 2009), both use quadru-pole mass spectrometers as detectors and are capable of high-frequency, at-sea measurements. High throughput of samplesat relatively low cost allows for resolution of fine-scale tempo-ral and spatial variations but the MIMS and EIMS approachesare compromised by relatively lower precisions: ±19‰, and±7‰ for O2/Ar and N2/Ar, respectively (Tortell 2005). They aresimilarly unsuitable for natural abundance isotope mea-surements. By contrast, isotope ratio mass spectrometry(IRMS) can achieve very high precisions of 0.4‰ and 0.6‰for O2/Ar and N2/Ar ratios (Emerson et al. 1991) on discretesamples in the laboratory. The latter technique can also pro-vide the isotopic composition of the dissolved O2 and N2 athigh precision (0.04‰ for δ18O2 and 0.03‰ for δ15N2: Emer-son et al. 1991). Though the method described in Emerson etal. (1991) achieves very high precision and accuracy, it isunsuitable for real-time data sampling and its wide use for dis-crete samples has been limited by the expense of a difficultand time-consuming field sampling procedure and relativelow analytical throughput in the laboratory.
Our major goals in developing a new approach for dis-solved gas analysis was to dramatically lower costs andincrease analytical throughput while maintaining or exceed-ing the precision and accuracy of the best current techniquesfor simultaneous N2/Ar, O2/Ar, δ15N2, and δ18O2 determination.Accordingly, we have developed a method that uses off-the-shelf sampling materials and on-line extraction procedures forhigh analytical throughput in the laboratory. Therefore, ourbenchmark for precision and accuracy is the method describedin Emerson et al. (1991) and Quay et al. (1993)—furtherreferred to as the “EQ benchmark” method.
Our analytical strategy centers around use of a multicollec-tor isotope ratio mass spectrometer (MC-IRMS) to achieve thehighest precision and most rapid analysis. Our instrument(GV IsoPrime) is fitted with collectors for the coincidentacquisition of masses 28 (14N14N), 29 (15N14N), 32 (16O16O), 33(17O16O), 34 (18O16O), and 40 (40Ar) allowing for all the speciesof interest to be determined simultaneously. Whereas ourapproach is similar to the EQ benchmark in this respect, wediffer in the use of a continuous He carrier to fully extract dis-solved gases and transport them through an on-line prepara-tion system to the mass spectrometer inlet. Both artificial gasmixtures and air-equilibrated water of known temperaturesand salinities are used as calibration standards.
We have explored a number of sampling schemes and avariety of materials. In all cases, the intent was to allow for
rapid filling and sealing of sample bottles without headspaceand return to the laboratory without leakage or bubble forma-tion. As the sample analysis method involves gas extraction ofthe whole water sample, lack of headspace, and bubbles is crit-ical given the relatively low solubility of the gases of interest.Described below are the sampling materials and methodsdeemed optimal after numerous comparisons including testsdesigned to mimic the experience of samples collectedremotely and returned to the laboratory for analysis. Samplelifetime of many months in the laboratory is also a practicalrequirement that we have evaluated.
Materials and proceduresSampling materials
Sixty milliliters borosilicate glass serum bottles (Wheaton,product #223746) are used along with 20 mm butyl rubberstoppers (Microliter Analytical, product # 20-20025) and Alring seals (Microliter Analytical, product # 20-0000AS). Thisbottle volume was found convenient for both sampling as wellas providing more than sufficient material for analysis. Thestoppers specified allow for sample expansion and pressuriza-tion with moderate warming and were sufficiently gas imper-meable to permit storage for many months (see below). Thesematerials are relatively inexpensive (c.a. $2/sample) especiallycompared with the custom built flasks used for the EQ bench-mark method. In addition, these glass bottles can be easilycleaned and reused. We found that multiple rinses with deion-ized water and combustion (450°C for several hours) are suffi-cient for cleaning these bottles. The latter removes anyorganic matter which could cause bubbles to stick to the innerwall during sampling. A glass bead (Fisherbrand, product# 10-310-1) is placed in the 60-mL combusted bottle before com-bustion or sampling to promote mixing of preservative aftersealing.Optimized sample collection procedures
Sequential illustrations of the procedure are shown inFig. 1. Our dissolved gas samples are collected as soon as pos-sible after the water sample comes up to the surface before anyother types of sampling except for other gaseous parameterssuch as Winkler oxygen. The serum bottle is placed in a plas-tic filling container, and water is gravity fed from a Niskin bot-tle or similar sampling device through natural rubber latex(Fisherbrand, product# 14-178-2C) or silicone (Fisherbrand,product# 14-176-332E) tubing. After the tubing is connectedto the Niskin outflow, the water sample is allowed to flowslowly through, controlled by manual pinching. Before sam-ple collection commences, the first 20 mL water (or more ifneeded) is discarded while the tubing is lightly tabbingthroughout its length, dislodging any bubbles out of the tub-ing along with the discarded water. The tubing is then placedat the base of the serum bottle and the bottle is filled slowly,ensuring it is free of any bubbles. During the first few secondsof filling, the tubing should be moved up and down to pre-vent any bubbles attaching to the outside wall. After which,
Charoenpong et al. Gas and isotope ratio analysis by CF-IRMS
324
the end of the tube should be kept still at the bottom of thebottle to avoid splashing, which may result in bubble forma-tion and/or oxygenation (especially for samples from a lowoxygen setting). The water is allowed to overflow until thebottle is completely submerged. The plastic filling containershould therefore be sufficiently large to permit water to coverthe serum bottle’s mouth as well as have sufficient room formanipulation of materials. The filling tube is then withdrawnmaking sure to slow the flow to a full stop as it clears themouth of the serum bottle. While still submerged, 100 μL sat-urated HgCl2 solution is added to the bottom of the serumbottle using a syringe with a 15-cm-long 18-gauge pointlessneedle. The butyl rubber stopper is inserted, making sure nosmall bubbles are sticking to its interior surface. The serumbottle is subsequently removed from the filling container, andcarefully checked for bubbles. If no bubble is found, the bot-tle is immediately aluminum ring sealed, and then gentlyshaken to mix the preservative. The bottle needs to be dis-carded if even the smallest bubble is observed.
Samples are stored at room temperature until analysis. Wehave found that for typical ocean samples, warming to roomtemperature causes sufficient pressurization to prevent bubbleformation even during air transport. These materials can tol-erate warming from 4°C to 25°C though there is considerablebulging of the stopper. Nevertheless more extreme heating orcooling of samples should be avoided if possible. Before analy-sis, bottles are again checked for bubbles. Bubble formationcan either be attributed to cavitation caused by contraction insample volume or air seepage due to improper sealing (for thislatter case, the samples should be discarded). One of the mostcommon cavitation scenarios is when the sample water oncollection is warmer than the temperature of storage. As cavi-
tation bubbles are created from the contraction of liquid, oncethese void spaces are reabsorbed back to the liquid phase thegas composition in the sample is not altered. This can beaccomplished by gently warming the bottles to c.a. 30°C to35°C in a water bath before analysis.Sample preparation system
A schematic of the preparation system is shown in Fig. 2. Atthe heart of this system lies the custom-made gas extractor,comprised of a 15-cm long glass tube fitted with gas-tight bot-tom and top. A continuous He flow (at 90 mL/min) passesthrough a fine frit (Ace Glass, product# 7176-103) at the baseof the extractor and exits through a 1/16-inch OD stainlesssteel tubing (RESTEK, product# 21510) at the top. Identical tub-ing is used throughout the rest of the setup, unless noted oth-erwise. Meanwhile, the water sample from the serum-cappedbottle is simultaneously pumped into and out of the extractorusing a valveless metering pump (Fluid Metering, product#QG400) at approximately 10 mL/min, whereas He gas is beingconcurrently introduced at 5 psi to prevent vacuum formationwithin the serum bottle. This metering pump model wasselected because of its ability to maintain constant low flowand unique design involving only one moving part, whichunder our processing conditions eliminates the production ofbubbles by cavitation. To avoid water from getting carried fur-ther downstream of the gas extractor in the He carrier, thewater level in the gas extractor is carefully controlled by posi-tioning the exit tube for the sample halfway between the baseand top of the extractor setup (Fig. 2). In the extractor, thewater sample is stripped of its dissolved gas content, which iscarried further downstream by the He carrier gas into the gaspurification part of the system. For frothy samples (such asthose with high dissolved organic matter content), the foam
Charoenpong et al. Gas and isotope ratio analysis by CF-IRMS
325
Fig. 1. Sampling protocol. (A) Bubble-free sample water from the Niskin bottle is fed into the bottom of the serum bottle. Water is allowed to overflowinto the filling container until the bottle is completely submerged. (B) While totally submerged under water, HgCl2 is added to the bottom of the bottlethrough a long blunt needle connected to a syringe. (C) The butyl stopper is fitted. (D) The bottle is turned upside down and gently tapped to checkfor bubbles. (E) Aluminum crimp is sealed over the stopper.
created through bubbling inside the gas extractor could intro-duce some water into the system downstream. To avoid thisproblem, intermittent flushing with deionized water betweensamples is recommended to reduce frothiness developedwithin the gas extractor. Quantitative gas extraction was a keyrequirement in the development of this technique. Our speci-fied sample water and extraction He gas flows were chosen tomeet this requirement as well as meet the needs for sufficientIRMS signal intensity for precise analysis, short systemresponse times, and modest sample water consumption. Quan-
titative extraction was verified by changing sample water flowby ± 30% and observing both a linear relationship betweenflow rate and IRMS signal intensity for masses 28, 32, and 40 aswell as invariant gas and isotopic ratios.
Gas flow after the extraction step goes through a Nafiondrier (Perma Pure, product# MD-110-48S-2) to remove H2O andthen through a chemical trap filled with magnesium perchlo-rate and CarbosorbTM granules to remove any remaining H2Oand CO2, respectively. Under software control the flow can beselected to undergo “with oxygen” or “no oxygen” mode
Charoenpong et al. Gas and isotope ratio analysis by CF-IRMS
326
Fig. 2. Schematic diagram of the gas extraction and preparation system. PC: Pressure Controller, FC: Flow Controller, and V: Vent. The dotted boxesand lines show alternative routes for the gas flow, which is controlled by the switching of the Valco valves. The first set controls whether the sample gaswill be passed through the reduction column to remove O2 whereas the second set controls the sample gas bypass. Detail of the gas extractor is shownin the inset.
through the six-port Valco valve (detail on mode switching isoutlined in the subsequent section; see “Sample analytical pro-cedure”). The former mode is used for measurements of O2/Arand δ18O2 whereas the latter for N2/Ar and δ15N2. Removal of O2
is essential for highly accurate measurements of both N2/Arand δ15N2 due to interferences produced by variations in O2/N2
(see “Correction for varying O2/N2”). This is achieved through
passing the sample gas over hot (450°C) CuO/Cu granules toconvert any hydrocarbons or CO to CO2 and to remove O2.During this process, nitrogen oxides (including NO and N2O)are also reduced to N2. NO is usually found at pmol/kg con-centrations (e.g., Ward and Zafiriou 1988) whereas N2O isfound in the nmol/kg range (e.g., Bange et al. 2001; Walter etal. 2006) in the open ocean. On the other hand, N2 has an equi-librium concentration of 501 μmol/kg at t = 10°C and S = 35(Hamme and Emerson 2004). Because both are NO and N2Opresent at very low concentrations as compared with N2, thecontribution of N2 produced from the reduction these twonitrogen oxides to the total N2 gas passing through the reduc-tion column is negligible and can be easily removed by addinga liquid N2 trap upstream of the furnace. In addition, this sub-system includes a chemical trap filled with magnesium per-chlorate and Carbosorb granules followed by a liquid nitrogentrap to remove any remaining H2O or CO2 produced. The “withoxygen” mode simply bypasses the shunt going into the reduc-tion column.
Regardless of O2 mode, an isopropanol trap (–50°C; NeslabCryoCool 60 immersion cooler) is used to remove any remain-ing trace contaminants before entering the 4-port Valco valve,which enables a sample by-pass mode during reference gasanalysis. When the by-pass is off, sample gas flow is directedinto the sample open split and in turn into the IRMS for analy-sis. When the by-pass is on, sample flow is instead vented to
atmosphere and a make-up He flow enters the sample opensplit, and in turn, the MC-IRMS. For reference gas introduc-tion, a custom built open-split system that permits mixing ofgases is used with 2 stationary and 4 movable fused quartzcapillaries. One of the stationary capillaries is for the He car-rier and is positioned upstream to all others and the other isthe outflow carrying the gas to the MC-IRMS. Movable capil-laries are used for reference gas introduction. Their small inter-nal diameter (50 μm) restricts flow sufficiently to achieve anappropriate range in IRMS signal intensity that is manuallyadjusted using Porter regulators to vary head pressure. We usethe reference gases: 1) Air, 2) O2, 3) N2 + Ar + O2, and 4) N2 +Ar supplied from compressed gas tanks (Fig. 2). The latter twoare artificial mixtures at near the ratios found in seawater.Through software control controlling 24V DC solenoids,which in turn, drive air pistons, each capillary can be insertedupstream of the outflow capillary allowing the gas to be car-ried into the outflow tube to the MC-IRMS. The He flow intothe two open splits, 50 to 90 mL/min, is much greater thanthe flow into the MC-IRMS. Manually adjusting the flow ofeach reference gas also easily creates a desired gas mixture,when two or more reference gas capillaries are inserted allow-ing efficient calibration for the influence of variable O2/N2.References and standards
Two reference gases are used in our method: N2+Ar+O2 forthe “with O2 mode” and N2+Ar for the “no O2 mode.” They aremade up by a local commercial gas supplier such that their gasratios are within the typical ranges found in seawater. Both aretested for reproducibility by repeated injections at the begin-ning of each day (typical precisions are shown in Table 1). Forair-equilibrated water standards, 1-L glass bottles filled withfiltered seawater (using Whatman GF/F glass fiber filter with0.7 μm nominal pore size) are kept at specified temperature by
Charoenpong et al. Gas and isotope ratio analysis by CF-IRMS
327
Table 1. Comparison of precisions reported in this study and those reported in the benchmark method (Emerson et al. 1991).
N2/Ar (‰) O2/N2 (‰) O2/Ar (‰) δ15N2 (‰) δ18O2 (‰)
SD of standard gas replicatesThis study:Ref gas: N2 + Ar + O2 (n = 105) 0.22 0.23 0.28 0.02 0.04Ref gas: N2 + Ar (n = 100) 0.08 — — 0.02 —
Emerson et al. (1991) 0.2 0.3 0.3 0.02 0.03
SD of water standardsThis study:Air-equilibrated SW stds (n = 43) 0.23 0.51 0.53 0.02 0.09
Average difference of pairs, same sampleThis study:BATS (Aug 12) (n = 24) 0.59 1.03 1.04 0.02 0.22
Emerson et al. (1991) 0.6 0.8 0.4 0.03 0.04
Note: For the two working reference gases and air-equilibrated seawater standards used in this study, numbers reported are the means of standard devi-ations of repeated measurements from a single analysis day. For the BATS samples, the values reported are the means of difference of pairs (randomlyselected from the triplicate samples) from each depth. All numbers reported here are in ‰. For N2/Ar, O2/N2, and O2/Ar, the ratio SD or difference isconverted to ‰ by dividing it by its average value and then multiplying the result by 1000‰.
high precision water baths (± 0.1°C). They are constantlystirred with an overhead mixer for at least 12 hours before useto allow full equilibration. In addition, salinity is checkedimmediately before analysis as it can affect the gas solubilities.Before sample analysis, typically two standards at a high andlow temperature are tested and closeness to expected values aswell as their reproducibility are used to assess system perform-ance (precisions shown in Table 1). Usually, there are smalloffsets from expected values, which are used to correct sampleresults. Water standards are also run periodically throughout aday-long analytical run to assess stability (allowing a drift cor-rection to be applied if necessary) and account for the day-to-day variations causing the abovementioned offsets.
Sample analytical procedureThe analysis of a single sample takes less than 8 minutes
and consumes approximately 50 mL water sample. At thebeginning of each run, a long needle connected to the pumpintake is inserted to near the bottom of the serum bottle alongwith a short pressurization needle connected to the autosam-pler unit (GC PAL by LEAP Technology). An automated soft-ware procedure is used to control the flow of sample and ref-erence gas into the system. In a typical run (see Fig. 3), thebaseline is measured during the first 30 s after which theN2+Ar+O2 reference gas is injected followed by the gas mixtureof N2+Ar and O2 at a low signal intensity while the sample by-pass is on. During this interval with the by-pass on, sample
Charoenpong et al. Gas and isotope ratio analysis by CF-IRMS
328
Fig. 3. Typical chromatogram (A) showing sequence of reference gas (Ref) and sample gas (Sam) injections. Peak 1 (Ref): N2 + Ar + O2, Peak 2 (Ref):N2 + Ar and low O2 mix, Peak 3 (Sam): without O2 removal, Peak 4 (Ref): N2 + Ar, Peak 5 (Sam): with O2 removal, Peak 6 (Ref): N2 + Ar. Each mass(assigned with a different color) has its own scale. Shown in the chromatogram above is the scale for the major mass, 28, in nanoamp (nA). (B) 28N2/
40Arand (C) 29N2/
28N2 ratios are plotted throughout the analysis.
water is pumped into the gas extractor to stabilize at constantsample signal intensities before analysis and continues till theend of the sample analysis. The sample by-pass is then turnedoff to allow the sample gas to enter the IRMS. Then, the by-pass is turned back on allowing the sample gas flow to bedirected to the O2 removal furnace while the first N2+Ar refer-ence gas pulse is introduced. After turning the sample by-pass,the oxygen free sample gas peak follows. Finally, the sampleby-pass is turned on again and the second N2+Ar reference gaspeak is injected. All injections of the reference gases and sam-ple gases are controlled by the software-programmed valves,and their sequence and timing has been designed to producewell separated, flat-top peaks as seen in a typical chro-matogram (Fig. 3). All reference gases are injected for 45 swhile the sample gases are injected for 70 s. The longer timerequired for the sample peaks was found necessary for suffi-cient data integration and optimal precision. Individual chro-matograms are checked for the flatness of the peak’s top andstability of gas ratios to ensure the accuracy of measurements.
The gas ratios and isotopic compositions of the sample gasare calculated by the IonVantage software, which we programto report observed gas ratios (R) and delta values of the sam-ple against the reference gas (standard):
(1)
Reported values for gas ratios, though, are either absoluteratios, ‰ deviation from expected equilibrated value, orexcess N2 or O2 concentration relative to the equilibrium con-centration. Reported isotope values are in the delta notationrelative to the atmospheric air standard (AIR). This AIR pri-mary standard was provided and certified by Ralph Keeling(Scripps Institution of Oceanography, pers. comm.) permittingthe absolute N2/Ar and O2/Ar values and δ15N2 and δ18O2 val-ues of our day-to-day standards (namely N2+Ar+O2, N2+Ar, andpure O2) relative to atmosphere to be determined.
In the “with O2 mode,” O2/Ar ratios are reported, and δ 18O2
values are calculated using the N2+Ar+O2 (peak 1) as a stan-dard. Alternatively, N2+Ar and low O2 mix (peak 2) can be usedwhen samples of known low O2 concentrations are analyzed.Theoretically, the O2 content in this reference gas mix can beadjusted to suit different samples, thus minimizing the inter-ference effect produced by varying sample O2/N2 (see the nextsection). In the “no O2 mode,” N2/Ar ratios are reported andδ15N2 values are calculated from using the N2+Ar (peaks 4 and6) as standards. Earlier on in our development, we used onlyone standard peak for this part of the analysis. However, wefound that improved reproducibility of δ15N2 could beachieved by having two references of N2-Ar bracketing thesample gas. The averaging effect reduces drift in the isotopicvalues of the standard gas, resulting in better precision. Thestandard deviations for δ15N2 for the same seawater samplesdecreased from 0.034‰ (n = 15, 1 reference injection) to0.013‰ (n = 14, 2 reference injections).
Correction for varying O2/N2
Variations in sample O2 content are well known to influ-ence observed gas and isotopic ratios as a result of ion-ioninteractions and trace formation of isobaric interferences inthe IRMS ion source (e.g., Emerson et al. 1999; Bender et al.1994). These effects are particular to each instrument and itsion source settings. The easiest solution for accurate mea-surement of N2/Ar and δ15N2 is O2 removal as discussed above.For δ18O2 determination, to achieve accurate results, a calibra-tion and subsequent correction for the influence of changingO2/N2 must be made (Emerson et al. 1999; Quay et al. 1993).
Prior studies needed to laboriously pre-mix O2 and N2 in aseries of flasks (Emerson et al. 1999). Here we use our customreference gas system, in which the N2+Ar reference gas and anO2 reference gas can be introduced together. The O2 content isquickly changed by altering the pressure on the O2 capillarythrough a pressure control valve. This mixture is typically ana-lyzed against the N2+O2+Ar reference and in practice calibra-tions for N2/Ar and δ15N2 are also obtained. This approach isalso taken for accurate calibration of reference gases againstthe AIR standard.
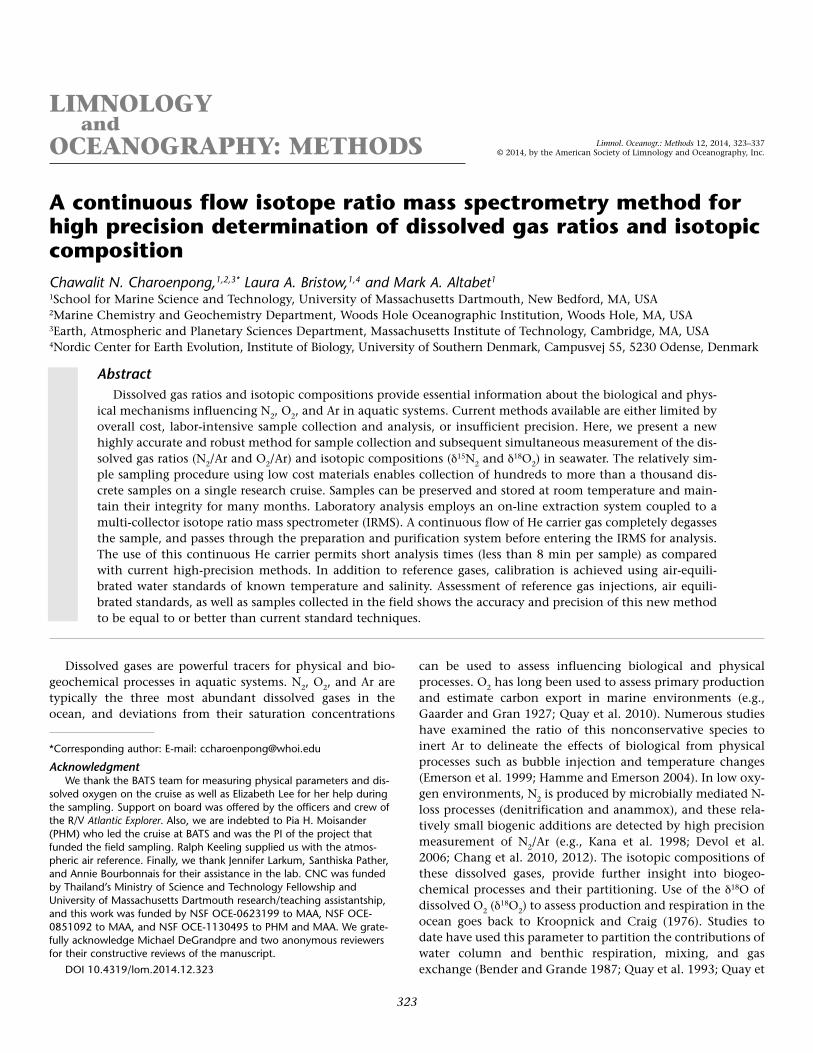
We demonstrate here that such interference on δ15N2 andδ18O2 occurs in a linear fashion and can be easily corrected for.To assess the effect of O2-N2 interaction in the ion source, theN2+Ar reference gas with varying amounts of pure O2 is intro-duced in alternation with the N2+Ar+O2 reference gas. At thestart of this experiment, the N2 and O2 of the former gas mix-ture is adjusted to the same level as the latter. Subsequently,the O2 is reduced stepwise to 10 different O2 concentrationsuntil around 8-10% of its original level.
As shown in Fig. 4, strong relationships with varying sam-ple O2/N2 ratios are observed for both δ15N2 and δ18O2. Weobserve a linear increase in the δ15N2 values (Fig. 4A) withincreasing O2/N2 ratios in the sample gas mixture allowing astraightforward correction to be applied to account for thisvariation. However as our routine δ15N2 measurements for thesamples utilize the O2 removal scheme, these measurementsare redundant. For δ18O2, values increase as O2/N2 ratiosincrease or as N2/O2 ratios decrease (Fig. 4B). We assessed theeffect of O2-N2 interaction by running this test every othermonth or every time the working reference gas tank isreplaced. The slope of each plot in Fig. 4A and 4B are used asa correction factor to account for the effect of O2-N2 interac-tion. Throughout the 13 tests run over the period of 28months, we found that the correction factors are relatively sta-ble despite the reference gas tank replacements. The correc-tion factors for δ15N2 and δ18O2 are 4.21 ± 0.02 and –8.19 ±0.06, respectively (Fig. 4).
The influence of O2-N2 interaction has also been reportedon the gas ratio signals (Emerson et al. 1999). Here, we test theeffect of O2 on the observed N2/Ar ratios by introduction ofN2+Ar (as reference) and a mixture of N2+Ar and varying pureO2 (referred to as sample). Similar to the previous section, theamount of N2 gas from both reference and sample is matched
δ = −⎛
⎝⎜
⎞
⎠⎟×
R
R1 1000sample
standard
Charoenpong et al. Gas and isotope ratio analysis by CF-IRMS
329
before the start of the test. Different amounts of O2 are used(same level as described above) and the ‰ deviation inobserved N2/Ar relative to expected N2/Ar are plotted (Fig. 4C).Our results show that the N2/Ar ratios increase (deviating fromthe expected ratios) until the pivoting point where O2/N2 =0.05 then the measured ratios start to drop steadily. While theoverall range is ~2 ‰, there is clear influence of O2/N2 on themeasured N2/Ar ratios. While corrections can readily be made,in practice we use “no O2” mode for the N2/Ar ratio because ofthe lack of interference, and the variations in the measuredN2/Ar ratios from “with O2” mode is generally greater thanfrom those from “no O2” mode. Where an O2 removal systemis not readily available, we recommend a careful calibrationcovering a large range of O2/N2 ratios to be expected fromactual samples. Alternatively, using working standard gas withsimilar O2/N2 ratio to the samples can also help to remove theeffect from this interference in the ion source.Standardization and data treatment
Mass signal intensities are integrated for the flat top por-tions of the reference and sample peaks, respectively, withbaseline intensity subtracted. Gas and isotope ratios are calcu-lated using the ‘δ’ notation in ‰ units relative to the 2 work-ing reference gases (wrg) as described above (Eq. 1). These aretermed the raw δ-values. Each reference gas has been separatelycalibrated using the MC-IRMS against an AIR standard. In thisregard, the true δ-values of the wrg (Eq. 2) are determined byalternating injections of the wrg with the AIR standard.
(2)
In principle, the raw δ-values of the samples can be used tocalculate the “true” δ-values of the sample by using the fol-lowing equation:
(3)
However, in some cases (i.e., measurements from “with O2”mode including the O2/Ar and δ18O2), correction for varyingO2/N2 must be made while day-to-day variations are alsoaccounted for using the air-equilibrated seawater standards.Detailed data processing protocol is described below.
δ =⎛
⎝⎜
⎞
⎠⎟−
⎡
⎣⎢
⎤
⎦⎥×( )
R
R� � 1 � 1000true wrg
wrg
AIR
δ δ δδ δ
= + +×⎛
⎝⎜
⎞
⎠⎟( ) ( ) ( )
( ) ( )� � �� �
1000true sam raw sam true wrgraw sample true wrg
Charoenpong et al. Gas and isotope ratio analysis by CF-IRMS
330
Fig. 4. Measurements of δ15N2 and δ18O2 with sample O2/N2 ratios rela-
tive to the reference, for the δ15N2 plot (A), the corresponding value onthis x-axis is 1 at 100% O2 (i.e., samples have the same O2 concentrationsas the reference), and becomes smaller as O2 level decreases. For δ
18O2
plot (B), however, the corresponding value on the x-axis becomes largeras the O2 levels decrease. Both (A) and (B) are taken from 13 tests run over28 months (indicated by different symbols). (C) The change in the N2/Arratio as a function of O2/N2. The expected ratios of N2/Ar are taken fromthe reference gas with no O2 (N2 + Ar) whereas the observed sample ratiosare from the gas mixture of N2 + Ar and pure O2 (at varying amount) from2 tests run over 3 months. Lines are derived from a least squares lin-ear/polynomial fit to the data points. The slopes (±SE) for (A) δ15N2 and(B) δ18O2 are 4.21 ± 0.02 and –8.19 ± 0.06, respectively. Note: Horizon-tal axes differ in each panel.
For the calculation of excess N2 (i.e., observed N2 concen-tration above that expected at a specific temperature andsalinity), we first take the raw delta N2/Ar value of the sample(“no O2” mode) versus the N2-Ar working reference gas (fromEq. 1) and convert it to the observed sample ratio (Obs N2/Ar).
(4)
From the observed sample ratio, a ‰ deviation (PMD) withrespect to the expected ratio is calculated. Expected ratios arecalculated assuming equilibration with the atmosphere atobserved in situ temperature and salinity, using solubilitycoefficients from Hamme and Emerson (2004) for Ar and N2:
(5)
To account for day-to-day variation in the extraction pro-cedure, we adjust the PMD using the air-equilibrated seawaterstandards that are run at regular intervals throughout the sam-ple batch. It is assumed that these air-equilibrated SW stan-dards have an N2/Ar ratio equivalent to that derived from sol-ubility coefficients (Hamme and Emerson 2004), and hence,the PMD of those SW standards should be zero. An averagevalue of any observed PMD for the SW standards is used as aSW standard correction factor (SWCF), and this is applied toevery sample during that run. SWCF are regularly observed tofall in the range of –3.3 to –6.3 for the N2/Ar ratio.
(6)
This adjusted PMD (adj.PMD) can then be used to deter-mine the excess N2 concentration in μmol/kg.
(7)
It should be noted that for studies assessing contributionsfrom biogenic N2, values are further corrected to subtract outthe influence of background excess N2, for example usingwaters outside oxygen deficient regions (Devol et al. 2006;Chang et al. 2010, 2012).
O2/Ar is processed in an identical manner to provideexcess O2 values using solubility coefficients from García andGordon (1992), and in turn, sample O2 concentrations. O2/Arratios are taken from the “with O2” mode using the N2-Ar-O2
as the working reference gas. For both excess N2 and O2, thisformulation assumes that Ar concentrations are at equilib-rium values. Deviations from this have been observed in theocean due to physical effects, such as bubble injection andsubduction of a water mass without complete air-sea gasexchange in water mass formation regions (Emerson et al.1995; Hamme and Emerson 2002). However, these devia-tions are only of the order of 2% (Hamme and Emerson2002) and would produce corresponding errors in excessconcentration.
As for δ15N2, we first obtain the δ15N2 of sample versus N2-Arwrg from the “no O2” mode [δ15N2raw(sam)], which we then useto determine δ15N2 sample vs AIR [δ15N2true(sam)]. We again usethe SW standards to correct for day-to-day variation in anidentical manner to the gas ratios (N2/Ar and O2/Ar).
(8)
Isotope anomalies are calculated by subtracting theobserved δ values from those expected at equilibration withatmosphere at in situ temperature and salinity based on Klotsand Benson (1963) for δ15N2 and from Benson et al. (1979) forδ18O2.
(9)
The δ18O2 can be obtained in the same way as for δ15N2
except that an additional correction factor is required for δ18O2
to take into account interference in the ion source (see above).This is done based on the ion source correction factor(ion_source_CF) determined over varying O2/N2 (Fig. 4B). Thefollowing equation is substituted for Eq. 3, but then an iden-tical procedure to δ15N2 is followed to complete the data cor-rection.
(10)
The ion source correction factor (ion_source_CF) shown inEq. 10 is derived from the linear relationship between observedδ18O2 values over varying O2/N2 ratios (shown in Fig. 4B).
AssessmentReference gas standards
The two wrg standards are tested daily for analytical repro-ducibility before any sample analyses as part of our qualitycontrol procedures. Nine injections of the reference gas to theIRMS are made, and the reported gas ratios or isotopic com-position are assessed for their standard deviations. The preci-sions of standard gas replicates were better than 0.3‰ for gasratios and 0.04‰ for isotope ratios (Table 1). These values aredirectly comparable with those for standard gas replicates bythe EQ benchmark method (Table 1).Air-equilibrated seawater
To assess precision and accuracy of our dissolved gas extrac-tion and purification procedures, a series of air-equilibratedseawater standards were analyzed and compared to theoreticalvalues over a range of temperatures. One-liter glass flasks con-taining seawater were placed in high precision water baths (asstated above) set at specified temperatures (t = 5°C, 10°C,15°C, 20°C, 25°C, or 30°C) and gently stirred overnight toallow full equilibration with air. For each analytical run, thewater standards at 15°C were used as an anchoring tempera-
δ δ= −PMD Observed value Expected value� � � �
δ δ δ
δ δ
= + +
+×⎛
⎝⎜
⎞
⎠⎟
( ) ( ) ( )
( ) ( )
O O ion O�
� �
1000
true sam raw sam source true wrg
raw sample true wrg
18 18 18
CF
δ δ= +( )Adjusted N N SWCF� � � true sam15
215
2 �
δ= +⎛
⎝⎜
⎞
⎠⎟×
( )( )Obs N Ar
N ArN Ar� / � �
� /
10001 � /raw sam
true wrg22
2
= −⎛
⎝⎜
⎞
⎠⎟ ×
Obs N Ar
Equil N ArPMD �
� / �
� /1 � � 10002
2
= +Adjusted PMD PMD SWCF� �
[ ]= ×Excess Nadj PMD
Equil N� �.
1000� � �2 2
Charoenpong et al. Gas and isotope ratio analysis by CF-IRMS
331
ture to account for any day-to-day drift in system response.Similar to the application of a SWCF described above for sam-ple analysis in the previous section, a minor correction factorwas derived from the difference between the expected ratioand the mean of raw observed ratios only for the 15°C waterstandard. This SWCF was applied to every analysis made forthe other water standards throughout the day. The salinity ofeach standard was also carefully checked as small changesmight have occurred due to evaporation, and adjustmentswere made as needed to account for this small variation insalinity.
Plotting the adjusted observed ratios for N2/Ar and O2/Aragainst the temperature at which the standards were equili-brated (Fig. 5A and 5C) shows that the observed data points
are located very close to the line of expected equilibrium val-ues (on average 0.02% difference for both ratios). To furtherillustrate how well these data compare, we determine the PMDfrom the expected ratios (Fig. 5B and 5D), which more clearlydemonstrates how close the data points are to the expectedvalues (i.e., located along the 0‰ line). There is no systematicbias and the PMD ranges between 0.14‰ and 0.57‰ forN2/Ar ratios and between 0.32‰ and 0.68‰ for O2/Ar ratios.The mean ‰ standard deviations calculated from these mea-surements were 0.23‰ and 0.53‰ for N2/Ar and O2/Ar,respectively, which is close to the precision of standard gasreplicates (Table 1).
The plots of isotopic compositions as a function of temper-ature and their deviations from the expected values are shown
Charoenpong et al. Gas and isotope ratio analysis by CF-IRMS
332
Fig. 5. The gas ratios of air equilibrated seawater standards. The N2/Ar (A) and O2/N2 (C) ratios as a function of temperature and the ‰ deviation fromthe expected ratios for the N2/Ar (B) and O2/N2 (D) ratios are shown here. The red dotted lines represent the expected ratios (based on equations fromHamme and Emerson [2004] for N2 and Ar and García and Gordon [1992] for O2). Note: Per mil deviation (PMD) is calculated using Eq. 5 (see text).
in Fig. 6. A similar anchoring scheme using 15°C water wascarried out and the PMD plotted. Similar to the gas ratios, ouradjusted observed measurements show consistency with theexpected isotopic values without any systematic bias. ThePMD ranges between 0.01 and 0.04 for δ15N2 and between 0.07and 0.14 for δ18O2. The average values for the standard devia-tions (as shown in Table 1) are 0.02‰ and 0.09‰ for δ15N2
and δ18O2, respectively; again as for the gas ratios, these valuesagree well with those for the standard gas replicates (Table 1).Performance for field-collected samples
Field samples were collected from the Bermuda AtlanticTime-series Study (BATS) station located at 31°40′N 64°10′W.In August 2012, triplicate samples from 24 depths were col-lected from the surface water down to 1000 m following theprotocol outlined above. Concurrently, physical parametersincluding temperature and salinity (using SBE-911plus sensor)
and dissolved oxygen (SBE-43 sensor) were also measured. Thedepth profiles for excess N2 concentration, δ15N2 anomaly, O2
concentration, δ18O2 anomaly are shown in Fig. 7 to illustratethe use of this method in the field. The excess N2 profile (Fig.7A) shows surface water having N2 concentrations close to sat-uration (i.e., the excess N2 being –0.07 μmol/kg). However,excess N2 gets progressively larger until it reaches 3 μmol/kg at150 m. From this depth down to 500 m, the excess N2 does notshow any appreciable changes. Below which, a noticeableincrease in excess N2 is observed with an excess of 7 μmol/kgseen at 1000 m depth. This increase in excess N2 at depth canbe explained by bubble injection when the water mass wasformed at the surface. This process preferentially affects lesssoluble gases, such as N2 compared with its more soluble coun-terparts (e.g., Ar), causing the N2/Ar ratio to be larger than thatexpected from gas solubility alone (Emerson et al. 1991). Thestandard deviations of triplicate samples over the depth rangesampled ranged from 0.002 to 0.78 μmol/kg, with a mean of0.32 μmol/kg. This corresponds to a relative standard devia-tion value of 0.39‰. The average difference between pairedsamples of 0.59‰ agrees well with that observed using the EQbenchmark (0.6‰; Table 1).
The anomalies of δ15N2 (i.e., the deviation from theexpected δ15N2 values at a specified temperature) are plotted inFig. 7B. Slightly enriched δ15N2 values are observed above 30m, whereas all sample below that are isotopically depleted.The average difference between paired samples is 0.02‰(reported in Table 1) with the range from 0.001 to 0.048‰.This level of precision is comparable with that of the EQbenchmark (0.03‰; Table 1). To evaluate the increased preci-sion in δ15N2 measurements provided by the “no O2” mode, wecompared δ15N2 values from the same depth profile betweenthe two oxygen modes (Fig. 8). Noticeably larger standarddeviations are inherent of data from the “with O2” mode whileclearly oxygen removal helps to diminish the spread of thedata. Also, more importantly, the values from the “with O2”mode are overestimated by as much as 1.57 ‰ when com-pared with their “no O2” counterparts (Fig. 8). Note that thedata from the “with O2” mode have been corrected for O2-N2
interactions. However, this correction does not account forany interference at mass 29 (i.e., 15N14N) by the production of13C16O (Bender et al. 1994) potentially caused by the introduc-tion of CO2 or the interaction between any hydrocarbons(CHx) and O2 within the ion source. An additional liquidnitrogen trap to remove CO2 and a VOC trap to remove CHx
might be another solution to this problem. We found thatthese interferences can be easily eliminated by our O2 removalsystem, which simultaneously removes O2, CO2, and CHx fromthe sample gas. Therefore, it appears that not only can weachieve higher precisions for δ15N2 measurements through theuse of an O2 removal subsystem, the overestimation ofreported values can also be avoided. In contrast to a recentapproach (Fuchsman et al. 2008), we posit that O2 removal isrequired for both precise and accurate δ15N2 measurements.
Charoenpong et al. Gas and isotope ratio analysis by CF-IRMS
333
Fig. 6. The PMD of air equilibrated water standards from the expectedvalues (based on equations from Klots and Benson [1963] for δ15N2 andBenson et al. [1979] for δ18O2; dotted lines) for (A) δ
15N2 and (B) δ18O2.
Depth profiles of O2 (Fig. 7C) were used to evaluate the accu-racy of O2 concentrations determined from the IRMS versusthose obtained from the SBE43 sensor (calibrated with Winklertitrations). To assess accuracy, the percentage differencebetween IRMS-derived values and their counterparts were cal-culated. The average % difference between the two methods todetermine O2 concentration was only 2%, thereby providingconfidence in our measurements. As for precision, we observedstandard deviations for triplicate samples ranging from 0.18 to6.19 μmol/kg, with an average of 1.86 μmol/kg.
Lastly, the δ18O2 anomalies (i.e., the deviation from theexpected δ18O2 values at a specified temperature) are plotted inFig. 7D. This depth profile is virtually an inverse of the O2 con-centrations; δ18O2 becomes more enriched as O2 concentrationsdiminish, and vice versa. This is a result of the isotope effect asso-ciated with water column respiration (Kroopnick and Craig1976). Our precisions for the δ18O2 measurements were on aver-age 0.24‰ (standard deviations ranging from 0.028‰ to0.88‰). The average difference between paired samples observedfor these samples was 0.22‰, which is marginally greater thanthe value reported for the EQ benchmark (0.04‰; Table 1).
Charoenpong et al. Gas and isotope ratio analysis by CF-IRMS
334
Fig. 7. Depth profiles of (A) excess N2, (B) δ15N2 anomaly, (C) O2, and (D) δ
18O2 anomaly at BATS (July 2012). The triangles in (C) are data from Win-kler-calibrated SBE-43 sensor. Error bars represent one standard deviation for each set of triplicate samples.
Fig. 8. The comparison of the δ15N2 measurements between the “no O2”and “with O2” modes.
Sample longevityIn practice, many months may pass between sample collec-
tion and laboratory analysis. A test of the stability of HgCl2
preserved samples was carried out in order to determine allow-able storage times for N2 and O2. Filtered seawater in a 20-Lcarboy was bubbled overnight with N2-Ar gas in a temperaturecontrolled room (10°C). About 15 min before sampling, bub-bling was stopped while gentle stirring kept the seawater well-mixed. Water was filled into 60-mL glass bottles, following theprotocol outlined above. Samples for the initial time pointwere analyzed on the same day as collection, with subsequenttime points analyzed afterwards at 1-week, 2-week, 4-week, 10-week, 4-month, and 6-month intervals (Table 2; n = 4 for alltime points, except T0 where n = 5). The excess N2 values insamples stored for up to 6 months (6 mo = 75.01 μM ± 1.06μM) were not significantly different from the T0 samples (T0 =74.45 μM ± 0.87 μM) of the experiment (P > 0.05). In contrast,significant differences were observed for excess O2 values in allthe stored samples, with the difference increasing with time.After six months, the excess O2 value was 35 μM (c.a. 15%)higher than at the initial time point.
These observations suggest that samples are able to bestored for long periods of time (up to 6 months) while not sac-rificing the integrity for N2 concentrations. The O2 results sug-gest some exchange with the atmosphere over time usingthese materials, whether this is only significant under lowoxygen conditions as simulated in this test remains to bedetermined. While it is best to analyze samples as soon as pos-sible, these results suggest that it may be possible to develop acorrection for storage time.
DiscussionOur method’s precisions are comparable with Emerson et
al. (1991) for both gas ratios and isotopic compositions asindicated in Table 1. These levels of precision cannot beachieved by the MIMS measurements, which are worse byapproximately an order of magnitude (7‰ for N2/Ar and19‰ for O2/Ar as reported in Tortell 2005). In addition to hav-ing achieved equally high precisions to the EQ benchmark,
our method also has several distinct advantages. One of whichis the ease of sampling. As discussed earlier, a goal duringmethod development was to produce a simple sample collec-tion procedure that enabled rapid filling of bottles allowingmore samples to be collected without compromising theintegrity. Our off-the-shelf 60-mL serum bottles are consider-ably less expensive and smaller than the evacuated 250-mLglass flasks typically used for sampling for the EQ benchmarkmethod, allowing for more bottles to be brought on boardduring sampling cruises. Additionally, we do not need addi-tional sampling apparatus such as a CO2 tank required for bot-tle flushing as described in the EQ method; such additionalsteps further limit the numbers of samples to be collected oneach cruise. Using our simple sampling protocol with smallersample bottles, we have successfully collected over 1500 sam-ples during a 1-month long cruise, resulting in a much largerdataset of excess N2 and δ15N2 in the eastern equatorial Pacificand the oxygen deficient zone (ODZ) of the Eastern TropicalSouth Pacific (ETSP). Chang et al. (2010) reported gas profilesfrom 2 stations within the ETSP ODZ whereas our currentmethod has allowed more than 40 stations to be sampled. Infact, the sampling procedure described in this study is simpleenough to allow one person to typically finish triplicate sam-pling from one Niskin bottle within 5 minutes. Moreover, ourserum bottles (c.a. $2 each) are much less costly than the bot-tles used in the EQ benchmark method (c.a. $80 each; B.X.Chang, pers. comm.), making it much more affordable with-out any compromise in precision or accuracy. Furthermore,the EQ benchmark approach uses larger and more expensivesampling bottles and a more complicated sampling procedurewhich both greatly constrain the number of samples that canbe collected at sea.
Shorter analysis time is another major advantage of ourmethod. As opposed to the EQ benchmark where long equili-bration at controlled temperature (4 h) is required, we use anon-line whole-water gas extraction where all dissolved gasesare stripped from the water phase by the He carrier gas andtransported into the preparation system. The typical analysistime for our method is under 8 min per one sample, enablingthe average throughput of 50 samples per day. In contrast, theEQ benchmark is typically capable of analyzing c.a. 10 sam-ples per day (B.X. Chang, pers comm). This can be achievedwithout compromising the precision of the reported values.Hence, we are able to achieve much higher sample through-put as compared with the EQ benchmark. However, we canachieve very high precisions comparable to the EQ bench-mark, and we are also able to measure the isotopic composi-tions of the dissolved gases simultaneously, which cannot beachieved with a MIMS.
High precisions for both δ15N2 and δ18O2 achieved throughthe use of this present method allow application of isotopicsignals at natural abundance levels to efficiently trace differ-ent oceanic processes including primary production, respira-tion (through the use of 18O), and denitrification (through
Charoenpong et al. Gas and isotope ratio analysis by CF-IRMS
Values reported are average ± 1 SD of gas concentrations in μmol/kg.Asterisks indicate values that are significantly different from those of theinitial time point with reported P values (from Student t test).
15N). Notably with the enhanced precision for δ15N2 attainedwith bracketing the sample peak with two reference peaks dur-ing the no-O2 mode of the analysis, any changes as small as0.02‰ in the δ15N2 can be determined. We have applied thisto the samples collected from the Peru ODZ collected in 2012,which show unprecedented highly resolved changes in theδ15N2 produced by N-loss processes (manuscript in prep).
Comments and recommendationsAlthough it is highly advisable that the samples collected
be analyzed as soon as possible (at best within 2 weeks of col-lection), we are currently exploring different modifications tolengthen the storage time. While the butyl stoppers remainthe most favorable choice due to ease of sampling, their pre-treatment such as degassing with He (De Brabandere et al.2012) prior to being used for sampling might help to removeany trace gases present in the stopper, which can alter the con-tent of the dissolved gas sample during storage. This might beparticularly useful in the case where a gas of interest is scarce(e.g., low O2 content in the OMZs).
Alternative preservatives for sample preservation are alsobeing explored. In some cases, adding HgCl2 to the serum bot-tle during sampling is not permitted near the rosette or poseshazardous materials issues for subsequent handling and ship-ping. Consequently, the samples have to be “killed” at a latertime requiring piercing the stopper with a needle. This is notan optimal technique as punctures might lead to leakage ofsample or air bubbles might be introduced to the samples. Tocircumvent this problem, we have recently found that HCland formalin can be substituted as a preservative as it does notinterfere with our analytical procedure.
More extensive preservation tests are underway to betterdetermine storage time for the different types of dissolved gassamples (e.g., oxic and anoxic seawater) and for the differenttypes of preservatives (e.g., HCl and formalin). As the testdescribed earlier in this article simulated the condition in anOMZ (high N2 and low O2), samples collected under fully oxicconditions might behave differently during storage. This addi-tional test will pinpoint if O2 has a shorter storage time simi-lar to what we found in the test conducted in this study. Onemeasurement that our method has the potential to evaluate isδ17O2. Precise measurements of the natural abundance of sta-ble oxygen isotopes (16O, 17O, 18O) in dissolved oxygen (tripleoxygen isotopes) can be used to assess gross primary produc-tion (Nicholson et al. 2012; Luz and Barkan 2000; Luz et al.1999). Our method has not yet attained high enough preci-sion to be used for that purpose, but this is one of the poten-tial areas for further development.
ReferencesBange, H. W., S. Rapsomanikis, and M. O. Andreae. 2001.
Nitrous oxide cycling in the Arabian Sea. J. Geophys. Res.Oceans 106(C1):1053-1065.
Bender, M. L., and K. D. Grande. 1987. Production, respira-
tion, and the isotope geochemistry of O2 in the upper watercolumn. Global Biogeochem. Cycl. 1(1):49-59 [doi:10.1029/ GB001i001p00049].
———, P. P. Tans, J. T. Ellis, J. Orchardo, and K. Habfast. 1994.A high-precision isotope ratio mass-spectrometry methodfor measuring the O2:N2 ratio of air. Geochim. Cosmochim.Acta. 58(21):4751-4758 [doi:10. 1016/ 0016-7037(94)90205-4].
Benson, B. B., D. Krause Jr, and M. A. Peterson. 1979. The sol-ubility and isotopic fractionation of gases in dilute aqueoussolution. I. Oxygen. J. Solut. Chem. 8(9):655-690 [doi:10.1007/ BF01033696].
Cassar, N., B. A. Barnett, M. L. Bender, J. Kaiser, R. C. Hamme,and B. Tilbrook. 2009. Continuous high-frequency dis-solved O2/Ar measurements by equilibrator inlet mass spec-trometry. Anal. Chem. 81(5):1855-1864 [doi:10. 1021/ac802300u].
Chang, B. X., A. H. Devol, and S. R. Emerson. 2010. Denitrifi-cation and the nitrogen gas excess in the eastern tropicalSouth Pacific oxygen deficient zone. Deep Sea Res. I57(9):1092-1101 [doi:10. 1016/ j. dsr. 2010. 05. 009].
———, ———, and ———. 2012. Fixed nitrogen loss from theeastern tropical North Pacific and Arabian Sea oxygen defi-cient zones determined from measurements of N2:Ar.Global Biogeochem. Cycl. 26(3) [doi:10. 1029/2011GB004207].
De Brabandere, L., B. Thamdrup, N. P. Revsbech, and R. Foadi.2012. A critical assessment of the occurrence and extend ofoxygen contamination during anaerobic incubations utiliz-ing commercially available vials. J. Microbiol. Methods88(1):147-154 [doi:10. 1016/ j. mimet. 2011. 11. 001].
Devol, A. H., and others. 2006. Denitrification rates and excessnitrogen gas concentrations in the Arabian Sea oxygen defi-cient zone. Deep Sea Res. I 53(9):1533-1547 [doi:10. 1016/ j.dsr. 2006. 07. 005].
Emerson, S., P. Quay, C. Stump, D. Wilbur, and M. Knox. 1991.O2, Ar, N2, and 222Rn in surface waters of the subarcticocean: Net biological O2 production. Global Biogeochem.Cycl. 5(1):49-69 [doi:10. 1029/ 90GB02656].
———, ———, ———, ———, and R. Schudlich. 1995. Chem-ical tracers of productivity and respiration in the subtropi-cal Pacific Ocean. J. Geophys. Res. 100(C8):15873-15887[doi:10. 1029/ 95JC01333].
———, C. Stump, D. Wilbur, and P. Quay. 1999. Accurate mea-surement of O2, N2, and Ar gases in water and the solubil-ity of N2. Mar. Chem. 64(4):337-347 [doi:10. 1016/ S0304-4203(98)00090-5].
Fuchsman, C. A., J. W. Murray, and S. K. Konovalov. 2008.Concentration and natural stable isotope profiles of nitro-gen species in the Black Sea. Mar. Chem. 111(1-2):90-105[doi:10. 1016/ j. marchem. 2008. 04. 009].
Gaarder, T., & Gran, H. H. (1927). Investigations of the pro-duction of plankton in the Oslo Fjord. Conseil permanentinternational pour l'exploration de la mer.
Charoenpong et al. Gas and isotope ratio analysis by CF-IRMS
García, H. E., and L. I. Gordon. 1992. Oxygen solubility in sea-water—Better fitting equations. Limnol. Oceanogr.37(6):1307-1312 [doi:10. 4319/ lo. 1992. 37. 6. 1307].
Hamme, R. C., and S. R. Emerson. 2002. Mechanisms control-ling the global oceanic distribution of the inert gases argon,nitrogen and neon. Geophys. Res. Lett. 29(23):2120[doi:10. 1029/ 2002GL015273].
———, and ———. 2004. The solubility of neon, nitrogen andargon in distilled water and seawater. Deep Sea Res. I51(11):1517-1528 [doi:10. 1016/ j. dsr. 2004. 06. 009].
Luz, B., E. Barkan, M. L. Bender, M. H. Thiemens, and K. A.Boering. 1999. Triple-isotope composition of atmosphericoxygen as a tracer of biosphere productivity. Nature.400(6744):547-550 [doi:10.1038/22987].
——— and ———. 2000. Assessment of oceanic productivitywith the triple-isotope composition of dissolved oxygen.Science. 288(5473):2028-2031 [doi:10.1126/science.288.5473.2028].
Kana, T. M., C. Darkangelo, M. D. Hunt, J. B. Oldham, G. E.Bennett, and J. C. Cornwell. 1994. Membrane inlet massspectrometer for rapid high-precision determination of N2,O2, and Ar in environmental water samples. Anal. Chem.66(23):4166-4170 [doi:10. 1021/ ac00095a009].
———, M. B. Sullivan, J. C. Cornwell, and K. M. Groszkowski.1998. Denitrification in estuarine sediments determined bymembrane inlet mass spectrometry. Limnol. Oceanogr.43(2):334-339 [doi:10. 4319/ lo. 1998. 43. 2. 0334].
Klots, C. E., and B. B. Benson. 1963. Isotope effect in the solu-tion of oxygen and nitrogen in distilled water. J. Chem.Phys. 38(4):890 [doi:10. 1063/ 1. 1733778].
Kroopnick, P., and H. Craig. 1976. Oxygen isotope fractiona-
tion in dissolved oxygen in the deep sea. Earth Planet. Sci.Lett. 32(2):375-388 [doi:10. 1016/ 0012-821X(76)90078-9].
Nicholson, D. P., R. H. R. Stanley, E. Barkan, D. M. Karl, B. Luz,P. D. Quay, and S. C. Doney. 2012. Evaluating triple oxygenisotope estimates of gross primary production at the HawaiiOcean Time‐series and Bermuda Atlantic Time‐series Studysites. J. Geophys. Res. Oceans. 117, C05012 [doi:10.1029/2010JC006856].
Quay, P. D., S. Emerson, D. O. Wilbur, C. Stump, and M. Knox.1993. The δ18O of dissolved O2 in the surface waters of thesubarctic Pacific: a tracer of biological productivity. J. Geo-phys. Res. Oceans 98(C5):8447-8458.
———, C. Peacock, K. Björkman, and D. M. Karl. 2010. Meas-uring primary production rates in the ocean: Enigmaticresults between incubation and non-incubation methods atStation ALOHA. Global Biogeochem. Cycl. 24(3) [doi:10.1029/ 2009GB003665].
Tortell, P. D. 2005. Dissolved gas measurements in oceanicwaters made by membrane inlet mass spectrometry. Lim-nol. Oceanogr. Methods 3:24-37. Limnol. Oceanogr. Meth-ods 3:24-37 [doi:10. 4319/ lom. 2005. 3. 24].
Walter, S., H. W. Bange, U. Breitenbach, and D. W. Wallace.2006. Nitrous oxide in the North Atlantic Ocean. Biogeo-sciences 3(4):607-619 [doi:10. 5194/ bg-3-607-2006].
Ward, B. B., and O. C. Zafiriou. 1988. Nitrification and nitricoxide in the oxygen minimum of the eastern tropical NorthPacific. Deep Sea Res. A. 35(7):1127-1142 [doi:10. 1016/0198-0149(88)90005-2].
Submitted 7 October 2013Revised 28 February 2014
Accepted 11 Apri 2014
Charoenpong et al. Gas and isotope ratio analysis by CF-IRMS