32
Linc Energy Ltd Anthony Watson General Manager - Commercial

Linc Energy Ltd Anthony Watson
General Manager - Commercial

Corporate Presentation ASX Spotlight – Small to Mid Caps Conference
New York
28 February 2013

Linc Internal Reserve Report Summary
Assumptions
• Effective date of 1/1/2012
• Includes Wyoming Powder River Basin reserves only
• 7/1/2011 Ryder Scott report was used as a starting point. Database was quality-checked, production volumes were rolled forward, and curves were refit, if necessary
• Pricing
– Base price deck of $96.19/bbl and $4.12/mcf held flat for the life of the properties
– Price deck determined using SEC methodology of averaging prices on the first day of each month for the previous 12 months
– A negative differential of $0.06/bbl was applied to the base price deck
• Lease Operating Expense
– LOE was increased from the Ryder Scott report to reflect actual operating costs based on trailing 9 month data
– The higher LOE is a result of the previous operator not adequately maintaining the properties during the last months of its ownership, thus requiring Linc to perform additional work in order to get the property back in order. This level of rehabilitation work is not expected continue in 2012
– Average LOE is ~$215,000/month
Oil Gas Equiv. PV-10
Category (Mbbl) (MMcf) (Mboe) % Oil ($M)
PDP 730,296 730,296 100% $11,294
PSI
PNP
PUD
Total 730,296 0 730,296 100% $11,294This presentation contains forward looking statements that are subject to risk factors associated with the US Oil and Gas business. It is believed that the expectations
reflected in these statements are reasonable, but they may be affected by a range of variables and changes in underlying assumptions which could cause actual results or
trends to differ materially, including but not limited to price fluctuations, actual demand, currency fluctuations, geotechnical factors, drilling and production results, gas
commercialisation, reserve estimates, loss of market, industry competition, environmental risks, physical risks, legislative, fiscal and regulatory developments, economic and
financial market conditions in various countries and regions, political risks, project delay or advancement, approvals and cost estimates.
The oil resource estimates for the Alaska Region in the announcement were compiled by Scott J. Wilson of Ryder Scott Company LP who is qualified in accordance with ASX
listing rule 5.11 and who has consented to the form and content in which this statement appears.
The oil resource estimates for the Wyoming Region in this announcement were compiled by James L. Baird of Ryder Scott Company LP who is qualified in accordance with
ASX listing rule 5.11 and who has consented to the form and content in which this statement appears.
The oil resource estimates for the Gulf Coast Region in the announcement were compiled by Robert L. Walker of Haas Petroleum Engineering Services, Inc. who is qualified
in accordance with ASX listing rule 5.11 and who has consented to the form and content in which this statement appears.
The Valuations for the Alaska Region and Wyoming Region were compiled by Wood Mackenzie. Wood Mackenzie does not warrant or represent that the information is
appropriate or sufficient and has not taken into account the purposes for which the information is used and you acknowledge and agree that if you use or reply upon the
information for any purpose then you do so entirely at your own risk.
The Prospective Resources estimates presented in these reports have been prepared in accordance with the Petroleum Resources Management System (PRMS) approved
in March 2007 by the Society of Petroleum Engineers, the World Petroleum Council, the American Association of Petroleum Geologists, and the Society of Petroleum
Evaluation Engineers by DeGolyer and MacNaughton by John W. Wallace (consultant) and Gustavson Associates by Michele Gregg Bishop, each of whom is qualified in
accordance with ASX listing rule 5.11 and has consented to the form and content in which their respective prospective resource estimate appears. Prospective Resources are
those quantities that are estimated, as of a given date, to be potentially recoverable from undiscovered accumulations by application of future development projects.
Application of any geological or economic chance factor does not equate prospective resources to contingent resources or reserves. Pg, the probability of discovering
reservoirs that flow petroleum at a measurable rate, has been applied to the Risked Mean volumes. Low, best, and high estimates in this table are P90, P50, and P10,
respectively. There is no certainty that any portion of the prospective resources estimated herein will be discovered. If discovered, there is no certainty that it will be
commercially viable to produce any portion of the prospective resources evaluated.
The information in this report, where indicated, relating to coal resources is based on information compiled by Troy Turner, who is a member of the Australian Institute of
Mining and Metallurgy who is employed by Xenith Consulting Pty Ltd. Mr Turner has sufficient experience which is relevant to the style of mineralisation and type of deposit
under consideration and to the activity which they are undertaking to qualify as a competent person as defined in the 2004 Edition of the ”Australasian Code for Reporting
Exploration Results, Mineral Resources and Oil Reserves”. Mr Turner consents to the inclusion of the report of the matters based on their information in the form and context
in which it appears.
The information in this announcement relating to coal resources is based on information compiled by Jeremy Busfield, who is a member of the Australian Institute of Mining
and Metallurgy and who is employed by Minecraft Consulting Pty Ltd. Jeremy Busfield has sufficient experience which is relevant to the style of mineralisation and type of
deposit under consideration and to the activity which they are undertaking to qualify as competent persons as defined in the 2004 Edition of the ‘Australian Code for Reporting
Exploration Results, Mineral Resources and Ore Reserves’. Jeremy Busfield consents to the inclusion in the announcement of the matters based on their information in the
form and context in which it appears.
All $ are presented in US$, unless otherwise specified.

Linc Energy Summary
4
World-leader in UCG.
The only company in the world to have produced diesel and jet fuel from UCG syngas.
Target of 6,000 bopd for year end was achieved in 2012.
Targeting 8,000-9,000 bopd by end 2013.
Winter drilling program at Umait, Alaska has commenced
Wyoming EOR project
Major holder of coal resources in QLD, SA, Wyoming and Poland.
Carmichael Royalty – Linc Energy will receive $2 per tonne of coal produced for the first 20 years of production at Adani’s Carmichael Coal Project.
Extensive Arckaringa Basin acreage position in South Australia.
Two independently commissioned technical reports from DeGolyer & MacNaughton and Gustavson Associates confirm the high potential for shale oil of this acreage.
Linc Energy is focused on
conventional and unconventional
oil and gas production
UCG Oil & Gas Coal Shale Oil
Conventional Unconventional

Oil Production exceeded targeted goal of 6,000 BOPD (gross) by 31 Dec 2012, having doubled production in one year. Further production and reserve growth expected in 2013. Umiat Oil Field (2P Reserves of 155 MMBOE) appraisal program has commenced with flow test results expected by Apr-2013. Investment within UCG, shale and coal has now brought these assets to the point of commercialisation. 2013 capex will be focused on oil production on the Gulf Coast and appraisal of the Umiat oil field in Alaska. UCG commercialisation a priority with Exxaro and D.Tek announcements in Q4 2012. Further progress expected on UCG commercialisation activities in 2013. Technical reports for Arckaringa Basin shale assets suggest significant potential. Barclays Bank appointed to advise on strategic options. Adani’s Carmichael project on track to first coal. Linc Energy holds $2 per tonne (indexed to CPI) royalty over the Carmichael coal project. Adani expects to mine 60Mtpa at full production. Non-core coal assets to be divested to ensure focus on core business.
Linc Energy – Key Messages
5

Conventional Oil
6

Reserve and Resource Summary
7
(1) Based on Ryder Scott report effective 1 July 2007. (2) Based on NITEC report dated March 2007. (3) Gulf Coast PV-10 values based on Haas report effective as of 1 August 2012. Alaska and Wyoming PV-10 values based on Ryder Scott reports effective as of 1 July 2012 and 3 June 2012, respectively.
Gulf Coast
Total Proved: 12.7 MMBoe PV-10: $504.5 million Percent Oil: 97% Net Production: 4,531 BOPD
Alaska - Umiat
Total 2P: 154.6 MMBoe 2P PV-10: $1,496 million Percent Oil: 100% OOIP: ~1,000 MMBbls(1)
Wyoming
Total Proved: 0.8 MMBoe PV-10: $12.1 million Percent Oil: 100% Est. Recoverable Oil: 75 MMBbls(2)
Key Statistics by Region
Linc Energy’s reserves represent a well-balanced portfolio of
attractive near-term cash flow opportunities as well as significant longer-term upside potential
7
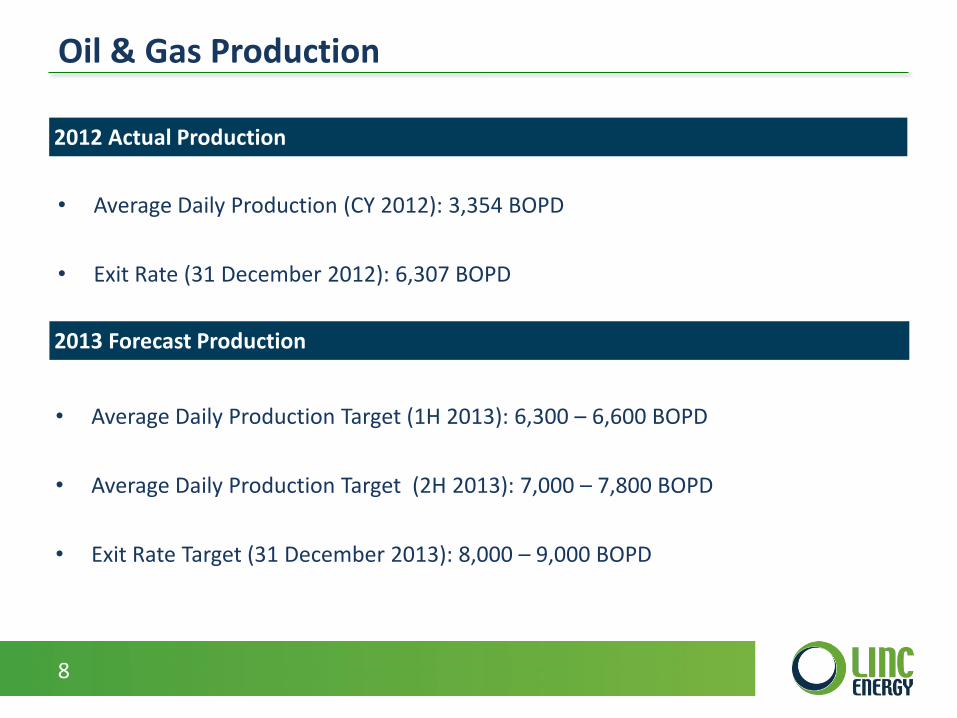
Oil & Gas Production
8
• Average Daily Production (CY 2012): 3,354 BOPD
• Exit Rate (31 December 2012): 6,307 BOPD
2013 Forecast Production
2012 Actual Production
• Average Daily Production Target (1H 2013): 6,300 – 6,600 BOPD
• Average Daily Production Target (2H 2013): 7,000 – 7,800 BOPD
• Exit Rate Target (31 December 2013): 8,000 – 9,000 BOPD

Gulf Coast Overview
Summary Statistics Key Takeaways
Total Proved Reserves: 12.7 MMBoe
Percent Oil: 97%
PV-10: $504.5 million
Fields 14 (13 producing)
Current Production (BOPD): 6,123 gross / 4,531 net
Working Interest: ~100%(1)
Average Net Revenue Interest: 74%
Acreage: 13,390 acres
Producing Wells: 130
• Primary Gulf Coast oil fields are associated with salt domes or salt related structures
• Production from stacked reservoirs primarily in Miocene and Frio sands at depths to 7,500 feet
• Minimal historical drilling below 7,500 feet (geopressure)
• Deeper drilling potential (Yegua, Hackberry, and Wilcox)
• Significant 3-D seismic coverage (reprocessing for subsalt)
9 (1) Linc Energy has an 87.5% working interest in four of its
wells. 9

12.7 MMBoe
1P Reserves by Category 1P PV-10 by Category
$504.5 MM
Note: Reserve data based on Haas report effective as of 1 August 2012.
PDP 30%
PDNP 34%
PUD 36%
PDP 40%
PDNP 31%
PUD 29%
Gulf Coast Asset Summary Gross Daily
Net PV-10 Production % Working % Revenue
Property Acres (Mboe) % Oil % PDP ($M) (boe/d) Interest Interest
Barbers Hill 1,144 7.1 100% 16% $266 4,576 100% 78%
Black Bayou 2,435 0.2 100% 3% 13 251 100% 62%
High Island 901 0.8 73% 32% 30 175 100% 72%
Atkinson Island/Cedar Point 1,425 1.5 92% 52% 67 506 100% 70%
Hoskins Mound 2,500 1.5 100% 10% 70 160 100% 75%
Port Neches 3,810 0.6 99% 54% 27 213 100% 83%
Other 1,175 1.0 99% 50% 33 241 NA NA
Total 13,390 12.7 97% 30% $505 6,122 98% 74%
1P Reserves
10

Umiat Field (Alaska)
11

Summary Statistics Key Takeaways
North Slope (Umiat)
• OOIP: ~1,000 MMbbls (1)
• 2P reserves of 155 MMbbls / $1,496 MM PV-10 (1)
• Located within the National Petroleum Reserve of Alaska
• Potential peak production of ~50,000 gross BOPD (~43,000 net BOPD)
• Potential upside from deeper oil and gas reserves
– Identified deeper potential through reprocessed 3D seismic
Total 2P Reserves: 155 MMBoe
Percent Oil: 100%
PV-10: $1,496 million
Working Interest: 84.5%
Acreage: 19,348
(1) Based on Ryder Scott report effective as of 1 July 2012.
Umiat – Field and Development Overview
12

Key Milestones: Pre-pack 100 mile snow road Establish campsite and in-field ice
pads Mobilise drill rig Install Ambient Air Monitoring
station • Drill, core and test vertical well in
primary interval and deepen to evaluate potential gas reservoir
• Drill and test horizontal well in primary interval
• Drill disposal well • Environmental Impact Statement
underway (EIS submitted)
Expected Timing: • October 2012 – September 2013
Key Milestones: • Drill and test deep resource targets • Perform extended flow test for 1
vertical and 1 horizontal delineation well
• Finalise engineering design • Submit air permit application
Expected Timing: • October 2013 – December 2014
Phase I Phase II Phase III
Reconfirm Reserve and Resource Value
Increased Reserve Value: Transition to Proved Reserves
Estimated Full Production: 50,000 BOPD
Cost: $50MM Net: $35MM(1)
Key Milestones: • Commence procurement and
fabrication • Full EIS review • North Slope Borough master plan
approval • Construction of roads and pipelines • Issuance of air permit • Facility construction • Commence development drilling
(Q2 2017) • TAPS tie-in facilities
Expected Timing: • 2015 – 2017
Cost: $1,300MM Net: $500MM(2)
(1) Net of approximately $15 million rebate from State of Alaska. (2) Includes Alaska tax incentives, rebates and partnering.
Cost: $50MM Net: $35MM(1)
Umiat Field and Development Overview
13

Umiat - Partnering options with the State of Alaska
• We are working with the State of Alaska to utilise existing public/private partnership programs such as the Alaska Industrial Development and Export Authority (AIDEA).
• AIDEA, through its Development Finance Program assists Alaska businesses through its ability to develop, own and operate facilities within the state.
• These projects are industrial in nature and consist of essential infrastructure.
• Eligible projects include ports, roads, manufacturing, power projects, processing and other facilities.
• AIDEA’s role in these economic development activities is a strong example of public/private partnership success.
• Alaska’s Clear and Equitable Shares (ACES) provides cash rebates for exploration and development.
• ACES established in 2007 and has rebated $1.2 billion in last 3 fiscal years to various E&P companies.
• Linc Energy has already received ~$5 million in rebates for activity in the Cook Inlet.
• Linc expects to receive a $15 million rebate before year end for its Umiat winter drilling campaign.
• Significant (~33%) rebates for ultimate Umiat development.
Source: www.AIDEA.org
Exploration and Development - ACES Infrastructure - AIDEA
14

Summary Statistics Key Takeaways
Wyoming Region – Powder River Basin
• Potential for 75 MMBbls of oil using CO2 EOR strategy from Big Muddy and South Glenrock fields
• Field Overview
– Big Muddy Field (Discovered in 1917)
• OOIP of 255.0 MMBbls
• Production of 53.8 MMBbls of oil to date
– South Glenrock (Discovered in 1950)
• OOIP of 170.3 MMBbls
• Production of 17.1 MMBbls of oil to date
– South Cole Creek Field (Discovered in 1948)
• OOIP of 41.3 MMBbls
• Production of 17.1 MMBbls of oil to date
Total Proved Reserves: 801 MBoe
Percent Oil: 100%
PV-10: $12.1 million
Fields: 3 (all producing)
Current Production (BOPD) (1): 208 gross / 150 net
Working Interest: 100%
Average Net Revenue Interest: 72%
Acreage: 29,782
Producing Wells: 30
Salt Creek
Salt Creek Analog – Key Statistics
• Increased production by ~13,000BOPD through CO2 flooding operations
• Recent Linn Energy transaction valued Salt Creek at approximately $150,000 per flowing barrel (2)
(1) As of 7 September 2012. (2) Based on internal management estimates.
Wyoming Field and Development Overview
15

Underground Coal Gasification
UCG to GTL Demonstration Facility in Chinchilla
16

Linc Energy’s UCG Commercialisation
• Linc Energy has invested c. A$200M developing its proprietary UCG technology over the past 9 years. In 2012 it reached the point of commercialisation without the need for additional capital investment.
• Linc Energy’s business model consists of commercialising our world leading position with either all or some of the following: a licensing fee, a royalty fee, a consulting fee and/or a carried equity participation in the project.
• Targeting strategic licence agreements and/or joint venture arrangements in four key focus areas: (a) South Africa, (b) North America, (c) Russia and Eastern Europe, (d) China/Mongolia.
• Agreements announced in Q4 2012 with Exxaro (Sub-Saharan Africa) and DTEK (Ukraine). Further announcements expected in Q2 2013.
• Revenue of approximately A$20 million is anticipated during Q2 2013.
• Linc Energy operates the only UCG to GTL facility in the world.
17

Shale Oil
(Arckaringa Basin, Australia)
18

Shale Oil – Arckaringa Basin
19

Linc Energy’s total acreage position covers c. 16 million contiguous acres, representing c. 80% of the Arckaringa Basin
Three major sedimentary units have been defined as being prospective for unconventional resources: Stuart Range, Boorthanna, Pre-Permian
Position Summary Linc Energy Acreage Position
Linc Energy’s Shale Position
20
Cooper BasinMarla
Olympic Dam
projectLeigh
Creek
PEL 120
Whyalla
Port Augusta
ADELAIDE
Moomba
Port Lincoln
Ceduna
Linc petroleum exploration licence
Linc petroleum exploration licence application
Petroleum exploration licence
Gas pipeline
Gas field
Oil/NGL pipeline
Oil field Kilometres0 80 160
0 50 100Miles
WA
NT
QLD
SA
NSW
VIC
Arckaringa Basin
Oodnadatta
PEL122
PEL117
PEL119 PEL123
PEL124
Coober Pedy
Prominent Hill project
PEL121
PELA
604
PEL118
Unique, large acreage position providing access to the vast majority of the Arckaringa Basin
1. Based on the DeGolyer and MacNaughton report dated 21 January 2013, Mean Estimate) 2. Based on the Gustavson Associates report dated 19 January 2013, Best estimate (P50).
Formation D&M1 Gustavson2
Stuart Range 12.6 bn BOE 13.3 bn bbls
Boorthanna 15.2 bn BOE 12.5 bn bbls
Pre-Permian 71.5 bn BOE 207.1 bn bbls

Arckaringa Basin Resource Potential
Two independently commissioned technical reports from DeGolyer and MacNaughton and Gustavson Associates confirm the highly prospective nature of the Arckaringa Basin
Shallower reservoirs were interpreted to contain black oil and volatile oil with solution gas
Deeper reservoirs were interpreted to contain retrograde gas or wet gas with condensate
Resource assessment was based on the allocation of the area by PEL, and further by each separate formation and further again by depth category below the surface
Pg factor (probability of geologic success) was applied by D&M to provide a risk adjusted estimate of mean resources
21
Prospective resources assigned to an oil generation window within each formation based on thermal maturity
Potential for gas resources in deeper parts of the Arckaringa Basin
No geologic probability of success has been applied to prospective resource estimates – estimates are unrisked
Estimates also provided for conventional resource prospectivity in portions of the deeper parts of the basin
Unrisked
Risked Mean Low Best High Mean
Oil (mmbbl) 14,358 20,915 30,468 21,836 516
Gas (Tcf) 166.8 244.8 386.5 261.9 9.9
Condensate (mmbbl) 16,693 30,578 56,018 34,187 1,263
Solution Gas (Tcf) 9.1 16.8 30.7 18.7 0.5
Total (Mmboe) 60,370 95,081 156,015 102,800 3,510
Interval
Unrisked (mmbbls)
Low Best High
Stuart Range Formation 7,228 13,280 24,873
Boorthanna Formation 5,130 12,472 26,010
Pre-Permian Strata 74,340 207,080 464,334
Total Prospective Resources 86,697 232,832 515,217

Liquids-Weighted Basin Comparison
Technical data compares favorably to prolific US unconventional liquids plays
22
Shale Property Eagle Ford Bakken Arckaringa Basin
Organic-rich Shale
Age Cretaceous Devonian, Mississippian Permian
Lithology Bituminous Shale Sandstone, Carbonate Marine shale, Siltstones
Depth 7,000–14,000 (ft)
2,100–4,300 (m)
8,500–10,500 (ft)
2,600–3,200 (m)
2,000–4,300+ (ft)
600–1,300+ (m)
Thickness 150–300 (ft)
45–90 (m)
10–150 (ft)
3–45 (m)
230–1000+ (ft)
70–300+ (m)
Porosity 6–14 % 3–8 (%) 5–17 (%)
Kerogen Type Type II Type I / II Type I / II
TOC 2–6% 7–22% 4.5–10%
Vitrinite Reflectance (Vro) 0.5–1.4% 0.5–1.0% 0.5–1.35%
Tmax ~833 oF
~445 oC
~800 oF
~425 oC
~825 oF
~440 oC
Estimated Recoverable
Resource(1) ~ 10.8 Billion BOE ~ 5.4 Billion BBL ~ 3.5 Billion BOE(2)
Area (‘000 sq km / million
acres)(1) 19.7 / 4.9 16.9 / 4.2 16.2 / 4.0(2)
Data Source Wall Street Research Linc Energy
1) Eagle Ford and Bakken estimates based on U.S. Energy Information Administration “Annual Energy Outlook 2012”, dated June 2012. Eagle Ford comprises 2.5 billion BBL liquids and 50.2 TCF gas. EIA area estimate for Eagle Ford includes dry gas acreage - liquids rich acreage amounts to 8,300 km2 / 2 million acres.
2) Arckaringa Basin prospective resources net to Linc Energy acreage only, adjusted for probability of geologic success, based on D&M report dated 21 January 2013 (3.5 billion BOE at 51% liquids). Area relates to c. 4 million acres within’ Linc Energy’s Arckaringa Basin acreage containing sweet spots where accumulations of organic rich shale are expected. Total Arckaringa Basin area amounts to ~80,000 km2 (20 million acres

Corporate Assets
23

Carmichael Royalty (Adani)
• Adani Mining Pty Ltd (“Adani”), a subsidiary of India’s Adani Group, acquired the Carmichael Coal tenement from Linc Energy in August 2010 for $500 million in cash and a royalty of $2 per tonne (indexed to CPI) over the first 20 years of production.
• Adani is planning to produce 60Mtpa from the Carmichael mine. • The Adani Group is an Indian based global company with in-excess of AUD5 billion
annual revenue.
• Adani’s current business goals are to deliver by 2020:
⁻ 20 Giga Watts of thermal power generation ⁻ 200Mt of coal resources (mined and managed) ⁻ 200Mt of cargo handling capability ⁻ 20 capesize ships with a 170,000 SWT capacity
• Adani acquired the Carmichael coal mine for captive use.
• Carmichael, one of the largest coal tenements in Australia, is located in Queensland’s Galilee Basin,160 kilometres northwest of Clermont.
24

Carmichael Royalty – Project Update
• The Carmichael coal mine and rail project was declared a significant project by the Queensland Government in November 2010
• Port access options have been secured via:
⁻ Acquisition of Abbot Point Coal Terminal for c. $1.83 billion (near Bowen)
⁻ Awarding of preferred proponent status at Dudgeon Point Coal Terminal (near Mackay)
• Acquisition of Moray Downs cattle property in 2011
• Proposed Adani – QR National rail corridor from Carmichael to Moranbah announced as preferred East-West Galilee rail corridor (June 2012). Adani also conducting studies on a direct route to Abbot Point
• Environmental Impact Statement (EIS) work commenced. Approval expected in mid 2013
25

Carmichael Royalty – Illustrative Production Chart
The royalty is $2 per tonne (indexed to CPI) over the first 20 years of production. If Adani is able to produce its stated goal of 60 Mtpa then Linc Energy receives over $120 M per annum (at full production).
Production Royalty
60 Mtpa c. $120M / yr
50 Mtpa c. $100M / yr
40 Mtpa c. $80 M / yr
30 Mtpa c. $60M / yr
26

Coal – Overview
• Linc Energy has a significant and global coal portfolio including key assets in Queensland, South Australia and USA.
• These include JORC certified coal assets in Teresa (298 Mt-82 Mt Indicated; 216 Mt inferred/ 50 Mt Probable Coal Reserve), Pentland (266 Mt - 176 Mt Indicated; 90Mt Inferred); and Dalby (146 Mt Inferred).
Queensland South Australia
27

Investment
Overview
28

Linc Energy – 2013 Projected Calendar of Events
Gulf Coast O&G
Umiat O&G
Wyoming O&G
UCG Shale
Oil Adani
Royalty Coal
Q1 2013
6,000 – 7,000 bpd
Winter Drilling Program
Exxaro Exploration
and Site Assessment
Technical Reports
Q2 2013
Testing and Announcement
of results
Exxaro Concept
Engineering / Commercial
Project B
JV Process EIS
approval Divestment of Coal Portfolio
Q3 2013
Updated Reserve Report
EIS Submission EOR Exxaro Pre-
FEED JV
Announced
Q4 2013
8,000 – 9,000 bpd
Phase 2 commences
Commercial Project C
Granting of
ML
29

Oil Production exceeded targeted goal of 6,000 BOPD (gross) by 31 Dec 2012, having doubled production in one year. Further production and reserve growth expected in 2013. Umiat Oil Field (2P Reserves of 155 MMBOE) appraisal program has commenced with flow test results expected by Apr-2013. Investment within UCG, shale and coal has now brought these assets to the point of commercialisation. 2013 capex will be focused on oil production on the Gulf Coast and appraisal of the Umiat oil field in Alaska. UCG commercialisation a priority with Exxaro and D.Tek announcements in Q4 2012. Further progress expected on UCG commercialisation activities in 2013. Technical reports for Arckaringa Basin shale assets suggest significant potential. Barclays Bank appointed to advise on strategic options. Adani’s Carmichael project on track to first coal. Linc Energy holds $2 per tonne (indexed to CPI) royalty over the Carmichael coal project. Adani expects to mine 60Mtpa at full production. Non-core coal assets to be divested to ensure focus on core business.
Linc Energy – Key Messages
30


Linc Energy Ltd Anthony Watson
General Manager - Commercial


