61
| Date post: | 07-Aug-2015 |
| Category: |
Science |
| Upload: | nadaandnorhan |
| View: | 116 times |
| Download: | 3 times |


PHYSICO-CHEMICAL CHARACTERISTICS AND DISTRIBUTION OF LINEAR ALKYLBENZENE
SULPHONATES (LASs) SURFACTANTS IN EL-MEX BAY, ALEXANDRIA-EGYPT
THESISPresented to graduate school
Faculty of Science, Alexandria UniversityIn Partial Fulfillment of the Requirements for the Degree
Of
Master ScienceIn
Physical Chemistry

Introduced By
Mohamed Nazeih Mohamed Gamal
Supervised By
Prof. Dr. Abd El-Monum M. AhmedProfessor of Physical Chemistry
Faculty of Science, Alexandria University
Prof. Dr. Mohamed Abd El-Aziz OkbahProfessor of Marine Chemistry
National Institute of Oceanography and Fisheries (NIOF)

Chemistry of LAS
LAS are the most popularly used anionic surfactants.
Lab Synthesis
Positional isomerism (26 isomer).

LAS unimers in solution tend to form aggregates (micelles), which gives its excellent detergency and solubilisation properties.
Chemistry of LAS
Micelle in aqueous solution
Concentration at which micelles start to form is called the critical
micelle concentration (CMC).

Synthesis of LAS
LAS was first commercialized in the early 1960s as a replacement for the poorly biodegradable branched alkylbenzene sulphonates (ABS), which caused persistent foam in WWTP, streams and rivers.
SO3- SO3
-
(a)-LAS (b)-ABS
LAB are synthetic compounds used as precursors for the manufacture of LAS, is derived exclusively from petroleum derivatives: benzene and linear paraffins

Synthesis of LAS
Pe
tro
che
mic
al p
lan
ts
De
terg
ent
pla
nts
Processes Steps in LAB – LAS Production

LAS Usage & Production
• LAS currently represents one-third of active ingredients in detergent and cleaning preparations worldwide.
• Virtually all LAB transformed into LAS.
• In 2003, global LAB capacity was 3 million tons/year.

LAS Usage & Production
Production and Consumption scenario in Europe 2000
SurveyTotalHousehold
ECOSOL400 kton330 kton
>80%
Production and Consumption scenario in Egypt
Egypt has obtained complete funding and started detailed feasibility studies for three projects that form part of its petrochemicals master plan for 15 M tone/y petrochemicals by 2021.
Tenders for detailed study will be sent out in 2003 for an 80,000 tones/y LAB plant and it is expected to increase in 2007 after the start up of ELAB project in Alexandria City which is the greatest LAB production project in Middle East region.
Monitoring Studies
Several monitoring studies on LAS in the environment are available
Surface Water
Ground Water
Seawaters
Sludge (WWTP)
Soils
Sediments

Fate of LAS in Environment
Biodegradation
Bioaccumulation
Precipitation
Adsorption

Biodegradation
Biodegradation is a most important mechanism for the total removal of chemicals from the environment
RDS
Dieaway Test
Analysis
QSAR

Biodegradation
Factors affect on LAS Biodegradation
Origin of bacterial culture Temperature
Structure of LAS
DO
Anaerobic Biodegradation
Few studies
Anaerobic proceeded after a period of aerobic exposure
Long t1/2 and no significant difference as a function of alkyl chain length

Bioaccumulation
Bioaccumulation The net result of the uptake, distribution, and elimination of a substance in an organism due to water-borne exposure
BCF Fish TypeReferences
108-280Bluegill sunfishMaki et al 1980
173-245Fathead minnowKimerle et al
1975
231Zebra fishCoenen 1988
Some Fish BCF Values For C12- LAS
Some Fish BCF Values For C12- LAS Hydrophobicity has been
identified as the driving force for bioconcentration.
The longer the alkyl chain the higher are the hydrophobicity and the bioconcentration factor (BCF).

LAS
Uptake/depurationperiod
BCF
C10-2 168-192 h/96 h6.0
C11-2 168-192 h/96 h31.9
C12-2168-192 h/96 h99.1 – 211.5
C13-2168-192 h/96 h987.2
C11-5168-192 h/96 h6.1 – 9.8
C12-5168-192 h/96 h10.0
C13-5168-192 h/96 h34
C12-6168-192 h/96 h31.9
Whole body BCF values in fathead minnow ( Pimephales promelas )
Bioaccumulation

LAS Precipitation
LAS + Ca2+ Ca (LAS)2
LAS biodegradation, precipitation and adsorption enhance its elimination from water column and consequently decrease of the bioavailability for aquatic organisms, and consequently a toxicity reduction.
Considering the solubility product of the calcium-LAS salts, this effect can be neglect for the lower LAS homologues but can contribute to the removal from the aqueous medium of the longer LAS homologues (C12-C14 LAS) at high water hardness
LAS sorption on sludge and sediment particles can be facilitated in hard water

Area of Study
El-Mex Bay
El-Mex District is an industrial zone west of Alexandria City. As a consequence of growing heavy industries (petrochemicals, pulp metal planting, industrial dyes, textiles) and the uncontrolled disposal of the resulting waste, costal water of El-Mex Bay receives huge amounts of untreated industrial wastes (Fe, Mn, Cu, Zn, Cd, Pb and Ni) as revealed by sediment analysis and water analysis 0
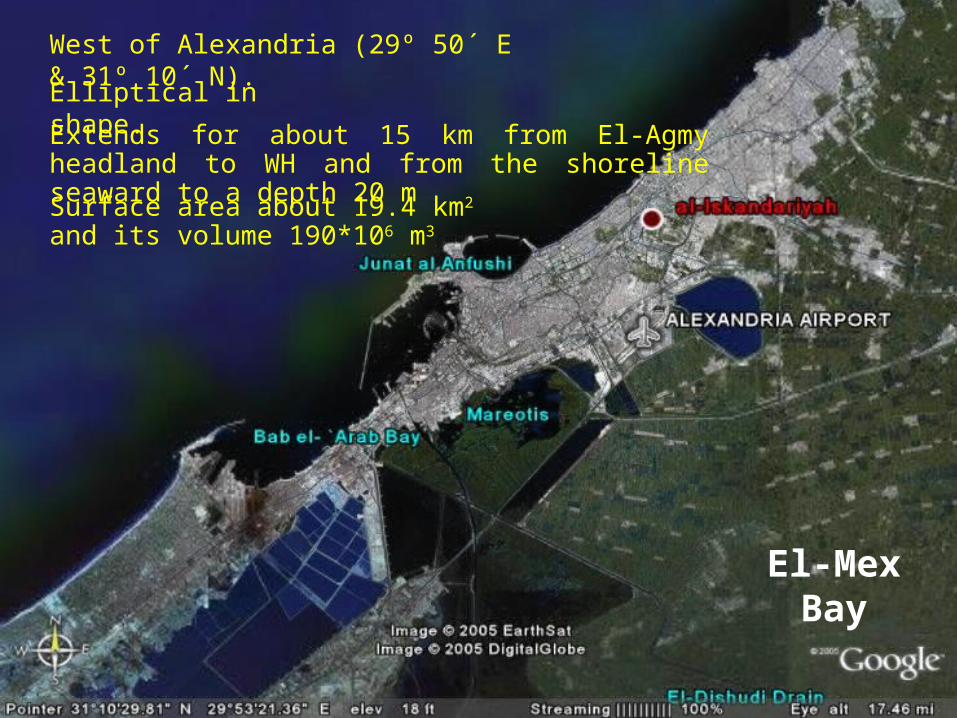
West of Alexandria (29º 50´ E & 31º 10´ N).
Elliptical in shape.
El-Mex Bay
Extends for about 15 km from El-Agmy headland to WH and from the shoreline seaward to a depth 20 m
Surface area about 19.4 km2 and its volume 190*106 m3

Area of Study (El-Mex Bay)
El-Mex Bay represents a good model for the environmental exposure for different types of pollutants
El-Mex Bay receives a heavy load of waste water (2.4 x 10⁹ m3/year).
Directly to the sea from industrial outfalls
Indirectly from Lake Maryout via El-Mex Pumping Station
The industrial area in the southern part of the Alexandria city disposes of its waste water directly into Lake Maryout (2 x 10⁵ m3/d).
Lake Maryout itself is connected to the sea from the west at El-Mex Bay
The eastern part of the bay receives brackish water (90.000 m3/day) from the Nubaria Canal loaded with tanneries wastes through WH outlets
Cement factory & Shipping activities

Area of Study (El-Mex Bay)
Water sampling

Area of Study (El-Mex Bay)
Sediment Sampling
LAS Analysis using RP-HPLC
Sorption Experiments
1/2
1/2

Material and Methods
Hydrographic & Hydrochemical Parameters
Temperature
Hydrogen ion concentration
Dissolved oxygen
Oxidizable organic matter
Salinity
Physical Parameters
Total hardness
Calcium hardness
Alkalinity
Total dissolved solids
Chemical Parameters of sediments
Calcium carbonates
Organic carbon content
Redox potential

Determination of LAS in sea water
The method based on the reaction between linear alkylbenzene sulphonates (LAS), as anionic surfactants, and methylene blue (MB), as cationic dye, to form associated ion-pair (LAS-MB ion pair) in water with 1:1 molar ratio which can be easily extracted to the organic phase (chloroform, CHCl3).
R SO3-
S
N
N(CH3)2(CH3)2N
+
R SO3
S
N
N(CH3)2(CH3)2N
LAS MB
LAS-MB ion pair
CHCl3
Material and Methods

Determination of LAS in sea water
Aqueous Phase (H2O)
LAS (H2O) + MB (H2O) LAS-MB (H2O)
Equilibrium scheme of LAS and MB in water and chloroform (organic) phases.
LAS (CHCl3) + MB (CHCl3) LAS-MB (CHCl3)
Organic Phase (CHCl3)
Material and Methods

Determination of LAS in Sediment Samples
Both HPLC and GC techniques have been used to measure alkylbenzene sulphonates in environmental samples. Both HPLC and GC techniques have been used to measure alkylbenzene sulphonates in environmental samples.
Material and Methods

Flow chart of HPLC determination of LAS
Sediment sample
20% NaOH (w/w)
CH3OH extraction
Evaporation
DilutionCH3OH / H2O (30:70)HCl (pH 4-7)
C18 column1. CH3OH / H2O (30:70)2. CH3OH elution
one discard
Two eluate
RP-HPLC Recorder Integrator
Material and Methods

Distribution of LAS in El-Mex Bay Waters
Results
0.000
0.050
0.100
0.150
0.200
0.250
1 2 3 4 5 6 7 8
station
LA
S (
ppm
)
surface (S)
bottom (B)
Regional variation of LAS (ppm) average values at surface (S) and bottom (B) layers of El-Mex Bay during investigation period of study.
0.24 mg LAS/l(4.17‰)
(1.87 mgO2/l)
0.15 mg LAS/l(4.36‰)
(1.31 mgO2/l)
0.14 mg LAS/l
0.05 mg LAS/l
S=0.07 mg LAS/l
B=0.06 mg LAS/l

Results
0.000
0.020
0.040
0.060
0.080
0.100
0.120
0.140
Apr-
05
May-0
5
Jun-0
5
Jul-
05
Aug
-05
Sep-0
5
Oct-
05
Nov
-05
Dec-0
5
Jan-0
6
Feb-0
6
Mar-
06
season
LA
S (
ppm
)
surface (S)
bottom (B)
Spring season
Summer seasonAutumn season
Winter season
Seasonal variation of LAS (ppm) average values at surface and bottom (B) layers of El-Mex Bay during investigation period of study.
Vertical profile in water column LAS concentration in surface water was higher than the bottom water at all stations and seasons
Distribution of LAS in El-Mex Bay Waters
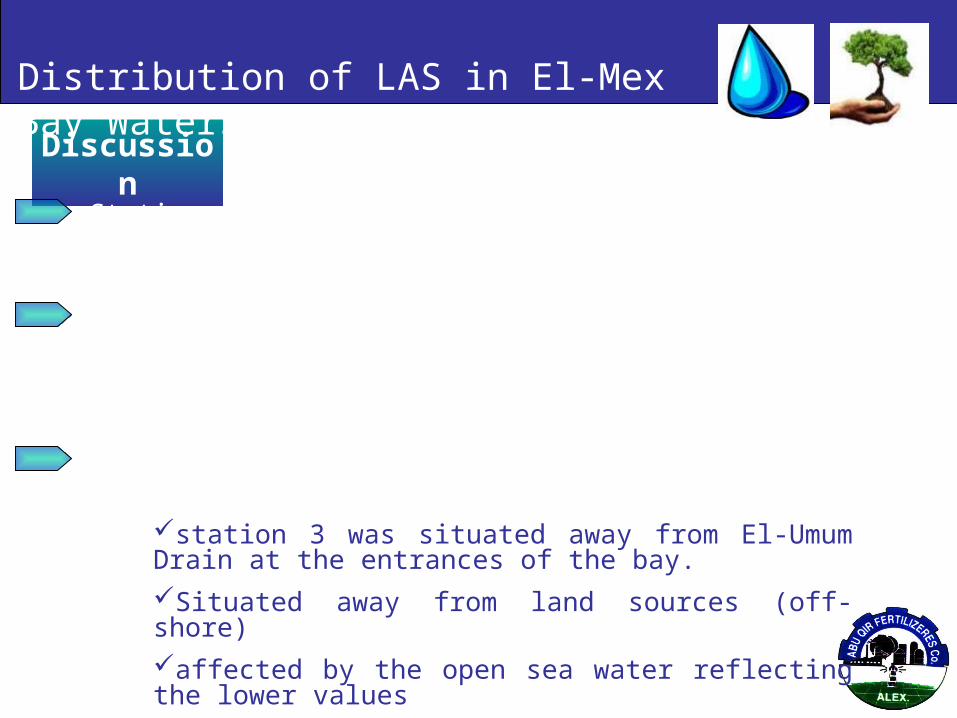
Discussion
Station 1 was selected to check for El-Umum Drain contribution, as water enters the bay
The high LAS content at stations 1 & 2 & 5 is attributed to the presence of these stations located at El-Umum Drain (station 1) and in the vicinity of the drain which discharge its waste water into the coastal area.
Station 3 had the lowest LAS concentration at both surface and bottom water due to
station 3 was situated away from El-Umum Drain at the entrances of the bay.
Situated away from land sources (off-shore)
affected by the open sea water reflecting the lower values
Distribution of LAS in El-Mex Bay Waters

The spread of the wastewater in the bay was investigated by studying the distribution of LAS at surface and bottom layers during investigation period of survey as a function of distance from El-Umum Drain point of discharge, considered as zero characteristics of the brackish compartment (depth; 0.5 m, salinities > 10‰) and marine compartment (depth; 15 m, salinities < 30‰) of the bay.
Discussion
The concentration of surfactants dropped rapidly with distance from the point of discharge. conclusion
The distribution of LAS residues in El-Mex Bay water column is characterized by pronounced maxima at the brackish water-sea water interface.
Distribution of LAS in El-Mex Bay Waters

Discussion
The discharge affects not only the near shore stations but also reached the off-shore stations and stations away from the point of sewage discharge with low concentrations and that detergents are not degraded so fast during transportation as it affects the water off-shore stations.
Conclusion It may point to the possible use of detergents as tracers for pollution in the Mediterranean Sea
It may also performed to gain insight into the question of whether these compounds are present in marine ecosystem.
This stresses the need to introduce better waste water treatment facilities in Alexandria City.
Distribution of LAS in El-Mex Bay Waters
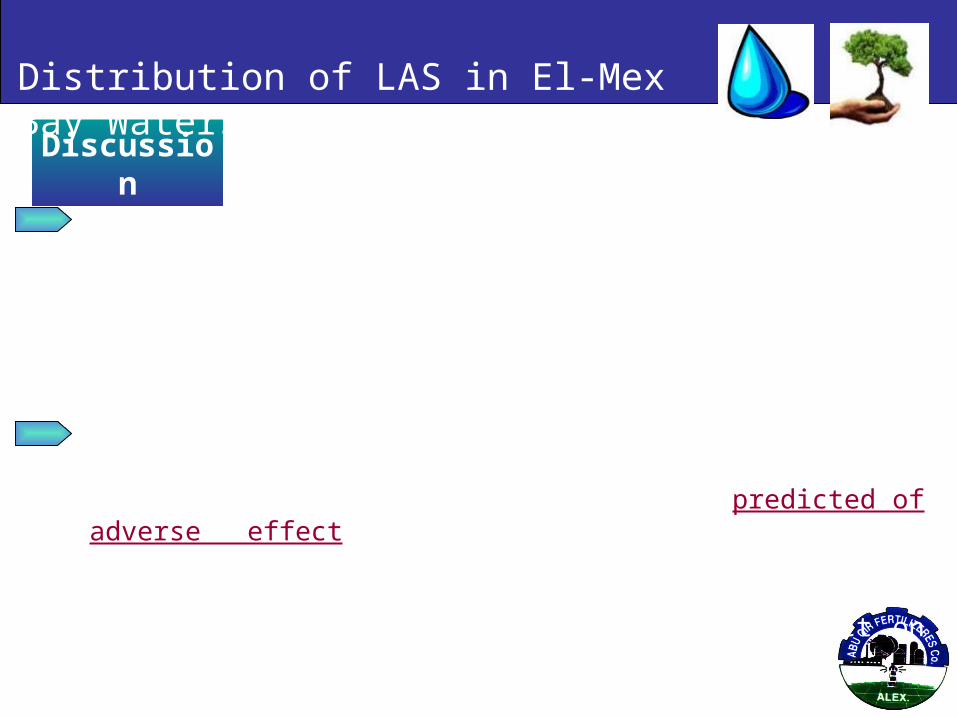
Discussion
The decrease in LAS concentration with the distance from the source of contamination was faster than that predicted based on dilution only. It is anticipated that removal mechanisms from the seawater column include biodegradation, sorption to suspended solids and sediments, and precipitation with divalent cations
It is observed that the summer had the highest concentrations at both surface (0.13 mg LAS/l) and bottom (0.06 mg LAS/l) layers which are predicted of adverse effect due to increasing in water temperature of summer season which lead to more efficient degradation during the summer because, temperature was found to have a decisive effect on the degradation rate.
Distribution of LAS in El-Mex Bay Waters

Discussion
Vertical
Profile
Generally most of the surface water samples, LAS concentrations was higher than in the bottom water at all stations and seasons
That surfactants nature of LAS results in the tendency for it to accumulate first on the surface of the aqueous medium (air-seawater interface) into which it is discharged and accompany the lighter water which floats at the surface
The degradation improves when it occurs at salinity value closest to the initial value of the water sediment (high salinity) where in 38.50-40.50‰ range.
Distribution of LAS in El-Mex Bay Waters

Discussion
Effect of salinity Effect of TH Effect of DO
Extent of mixing of seawater in the bay with
sewage discharge
Extent of mixing of seawater in the bay with
sewage discharge
r = -0.78
Sewage discharge containing LAS
Strong sedimentation & biodegradation
r = -0.67
Strong precipitation of LAS as Ca(LAS)2 when
Ca2+ concentration increases & seems to promote cooperative
sorption at high LAS and Ca2+ concentrations
r = -0.50
High amount of DO lead to increase in
biodegradation rate of LAS that introduced to
a natural system and LAS concentration will
be diminished.
Distribution of LAS in El-Mex Bay Waters

Conclusion
Detergents are not degraded so fast during transportation
Sites where high levels of surfactants were found seem to correlate well with locations where fecal contamination existed
The concentration of LAS dropped rapidly with distance from the point of discharge.
Decrease in LAS concentration with the distance from the source of contamination was faster than that predicted based on dilution only
Vertical profile show that concentration of LAS in surface layers higher than the bottom layers.
Distribution of LAS in El-Mex Bay Waters

StationpHEHH2O
Content%CaCO3 %TOC w/w
SS17.31184.9079.2988.270.90
SS27.56207.9077.4991.661.07
SS37.72197.0072.2795.540.95
SS47.78209.2075.1295.601.16
El-Mex Bay sediment quality parametersEl-Mex Bay sediment quality parameters
Distribution of LAS in Bay Sediments

StationLAS homologues (μg/g)0
C10C11C12C13Total
SS1ND0.4500.0470.0430.540
SS20.0200.3120.0410.0400.413
SS3ND0.3150.0340.0320.381
SS40.0150.3090.0350.0340.393
Spatial distribution of LAS homologues in sediment from El-Mex Bay Spatial distribution of LAS homologues in sediment from El-Mex Bay
LAS homologues usually detected were those of between 10 and 13 carbon atoms, with C11 and C12 being the most abundant.
No major differences in homologue distribution in any station of sediment samples collection.
Distribution of LAS in Bay Sediments

0
10
20
30
40
50
60
70
80
90
C10 C11 C12 C13
Alkyl chain length
% of
total
LAS
StationLAS homologues(%)
C10C11C12C13
SS10.0083.308.707.90
SS24.8079.4010.4010.10
SS30.0082.708.908.30
SS43.8081.709.309.00
Alkyl homologues (%) distribution of LAS in the bay sedimentsAlkyl homologues (%) distribution of LAS in the bay sediments
Key intermediates
Most adsorbed
Persist biodegradation
Distribution of LAS in Bay Sediments

Total LAS Distribution
The maximum LAS concentrations were detected close to El-Umum Drain discharge outlets decrease with the distance from the drain discharge outlets.
0.000
0.100
0.200
0.300
0.400
0.500
0.600
SS1 SS2 SS3 SS4
Distance from point of dischargeLA
S (m
icro
g/g
)
The high LAS concentration at station SS1 coincide with very low amount of DO (0.5-1.9 mg O2/l) so that LAS persists at these regions due to oxygen limitation
DO limitation indicates anaerobic biodegradation conditions, this evidence can be supported by low Eh-values at stations near to El-Umum Drain outlet (<100) refers to slight increase in anaerobic conditions at which LAS decomposition rate will be decreased.
Distribution of LAS in Bay Sediments

Physical mixture of the water column and the existence of wastewater discharged either onto the surface or at depth due to changeable wind velocities in the bay during the different seasons leads to LAS not accumulate at surface water according to its surfactant character and increased its tendency to accumulate at the interfaces of the sediments.
In both samplings (seawater and sediments), it can be observed that the evolution of total LAS concentrations in solids is similar to found in water. An increase is seen in the process of adsorption onto sediments, in line with an increase of LAS in seawater.
y = 504.9x - 118.27
R2 = 0.981
0
20
40
60
80
100
120
140
160
180
0 0.1 0.2 0.3 0.4 0.5 0.6
LAS (micro g/g)
LAS
(micr
o g/
l)
Generally, the degradation rate of LAS is very high in the presence of sediment which means that the period of acclimatization of the bacterial flora was substantially shortened
Distribution of LAS in Bay Sediments

LAS homologues Distribution
The results show a great affinity of LAS for the solid phase, as well as an increase in adsorption in line with increased chain length, this being evidence of a hydrophobic-type interaction.
C11-LAS constitute more than 75% of total LAS in all the samples, reaching 84% at station SS1 (the area
with relatively high %OC).
Organic carbon content is one of the most important parameter which effect on the rate of LAS adsorption
onto marine sediment as described earlier by experimental work in this research.
Distribution of LAS in Bay Sediments

Concentration of LAS at El-Mex Bay sediments
Ad
sorp
tion
Bio
deg
rad
atio
n
Chain length
%OCPhysical mixture
DO conc.
Heavy metal conc.
Chain length
Concentration of LAS in water column
Distance from wastewater point of discharge
Sediment
Distribution of LAS in Bay Sediments

Adsorption Experiments
Sorption
Process of transfer of surfactants molecules from bulk solution phase to the surface/interface.
Influence fate and effect of surfactants when release into aquatic or terrestrial environment.
Is important mechanism for LAS removal from the marine water column which may affected by several factors such as chain length, salinity and TH.
Plays a role in determining the resistance time of a chemical in soils and sediments. In addition may affect the expression of effects of surfactants towards benthic and soil dwelling organisms and plants.
Involves single ions (unimers) rather than micelles

Adsorption Experiments
surfactant onto sediments or soil depends on many factors including:
physicochemical properties of surfactants
sediment or soil nature
environmental parameters
data can be used to estimate the
distribution of the surfactant in environment.
bioavailability of the surfactant,
Few studies
Sorption

Generally Equilibrium and kinetics of ionic surfactants adsorption
The nature of solid surface (hydrophobic or hydrophilic) and the electrical interactions play an important role in the kinetics of adsorption of surfactant at the solid-liquid interface.
ΔGads = ΔGelec + ΔGspec
ΔGelec accounts for the electrical interactions
ΔGspec is a specific adsorption term, which contains all other contributions to the adsorption free energy that are dependent on the 'specific' (non-electrical) nature of the system
Adsorption Experiments

Adsorption Experiments
Kinetic Experiments (Rate experiments)1
The rate of LAS sorption onto El-Mex bay marine sediment was determined by agitation of the LAS seawater-sediment mixture sediment sample, for respectively 0.5, 1, 2, 3, 4, 5, 6 and 7 hours.
kinetic I
0.00
10.00
20.00
30.00
40.00
50.00
60.00
70.00
80.00
90.00
100.00
0 0.5 1 2 3 4 5 6 7
Time (h)
Sorp
tion
perc
ent
Initial concentration (Ci) was 10 ppmAmount of sediments was 0.6 g/l
The sorption of LAS is a fast phenomena and all systems achieved equilibrium within 4 hr of contact time

Adsorption Experiments
These results are in agreement with literature for adsorption of LAS on marine sediments and soils and adsorption of organic substances on activated sludge.
0.0010.0020.0030.0040.0050.0060.00
0 0.5 1 2 3 4 5 6 7 20 24
Time (h)
Degr
adati
on pe
rcent
The amount of LAS degraded during this time of experiments is negligible as indicated by blank experiments of LAS in standard seawater without addition of sediment.
The sorption on the wall of the receptacle is negligible owing to its small value
The equilibrium time determined from rate experiments was applied in isotherm experiments

Adsorption Experiments
2 Isotherm Experiments (Sorption Experiments)
50 ml of LAS solution in seawater ranging in concentration from 1 to 100 ppm were added to 3.0 g (d.w) of sediment in a Teflon-stoppered Pyrex bottles. The suspensions were adjusted to appropriate pH values (3, 8 and 12) with dilute NaOH or HCl solution and subsequently placed on shaker for 5 hours at 25 ºC. Filtration was carried out to obtain a clear solution for the determination of LAS. The amount of sorption was expressed as mg LAS per g of dry sediment.
Salinity of seawater was 36 ‰Temperature 25ºCpH adjusted 3, 8 or 12The sediment was coarse and medium sand as proved by GSA

Adsorption Experiments
0
200
400
600
800
1000
1200
1400
1600
1800
0 10 20 30 40 50 60 70
LAS in solutionA
mou
nt o
f ads
orbe
d LA
S Sample I
Sample II
Sample III
Sample IV
The adsorption of anionics such as LAS appears to be in influenced mainly by hydrophobic mechanisms.
At low concentration
There are no significant sorbate-sorbate interactions at the low concentrations
As concentration increases
active sorption sites on solid surface become less and less available, and more and more hemimicelles form
At higher concentrations
sorption may entail the formation of more structured arrangements these arrangements may be governed mainly by interactions between hydrophobic moieties of surfactant molecules.

Adsorption Experiments
Sorption of LAS on El-Mex Bay marine sediments can be described by using
Freundlich equation
x/m = K Ce1/n
x/m is the amount of LAS adsorbed per unit of adsorbent (µg/g)
Ce is the equilibrium concentration of LAS in solution (mg/l)
K is a Freundlich sorption coefficient (l/kg), related to the bounding energy.
1/n is a power function related to the sorption mechanism & measure the sorption intensity
log x/m = log K + 1/n log Ce

Adsorption Experiments
iso 1
y = 0.6882x + 2.4016
R2 = 0.9173
0.000
0.500
1.000
1.500
2.000
2.500
3.000
3.500
-2.000 -1.500 -1.000 -0.500 0.000 0.500 1.000
log Celo
g m
icro
g/g
Freundlich isotherm
Non-linear relationship between the amount of LAS sorbed and the equilibrium solution concentration

0.000
0.500
1.000
1.500
2.000
2.500
3.000
3.500
-2.500 -2.000 -1.500 -1.000 -0.500 0.000 0.500 1.000 1.500 2.000
log Ce
pH 8.5
pH 3.8
pH 12
Linear (pH 12)
Linear (pH 8.5)
Linear (pH 3.8)
Effect of pH on LAS sorption
Adsorption Experiments

Sample NoTOC (w/w)pHK1/nR2
I0.90
1238.770.6820.962
8.5252.120.6880.917
3.8351.080.6720.964
II0.95
1245.060.6970.971
8.5331.050.710.985
3.8388.420.670.968
III1.07
1254.0510.6440.988
8.5350.830.6610.972
3.8409.070.6310.963
IV1.16
1252.0710.6620.977
8.5367.110.6630.968
3.8387.610.6350.919
Results
Adsorption Experiments
Adsorption Experiments
Discussion
Non-linear relationship
There is interaction between adsorbed molecules and the adsorption is localized in multilayer, thus resistance time of LAS on sediment will be increase (adsorption become easy)
The data was fitted to Freundlich isotherm not Langmuir isotherm
The sorption of LAS on sediment increase as the TOC increase
The narrow range of K-values indicates that the %OC of sediment have a moderate effect on adsorption.
The relatively small value of 1/n (less than 1) indicates sorption intensity is relatively small.

Adsorption Experiments
Discussion
The relatively small K-values indicates the adsorption of LAS was moderate because
This because the negative charge of the sediment minerals (sand & high carbonate contents) which repels the anionic surfactants (LAS).
Adsorption is still localized in monolayer at low equilibrium concentration
Positive correlation found between K-values and REDOX potential

Adsorption Experiments
Discussion
The LAS sorption on sediments was strongly affected by pH and decreased with increasing pH for each sediment sample
Acidic conditions yield a positively charged sites onto which negatively charged LAS homologues can adsorb. Acidic conditions yield a positively charged sites onto which negatively charged LAS homologues can adsorb.
Hydrogen ion enhances adsorption in bilayer, and would confirm the affinity for the anionic surfactant after an initial adsorption in a monolayer.
Hydrogen ion decrease of the electrostatic repulsion ionic head of LAS.
Decrease in pH clearly enhances the sorption of LAS homologues on sludge and seems to promote
cooperative sorption at high surfactant concentrations

Adsorption Experiments
Discussion
A difficulty in comparing K coefficients is that often K is determined as the ratio of adsorbed fraction to the dissolved fraction.
the amount of soil or sediment and the test chemical concentration should be mentioned.the soil/solution ratio applied in the adsorption experiment influences the adsorption coefficient K
This simplified K can be compared with the Freundlich K when 1/n equals 1 or in the linear range of sorption (Stern-Graham equation)
x/m = K*Ce

Adsorption Experiments
Summary
Due to their chemical features, LAS (anionic surfactant) molecules may sorb directly onto solid surfaces or may interact with sorbed surfactant molecules. The sorption mechanism is dependent on the nature of the sorbent and the surfactant concentration.
Under real marine environment where LAS levels are rather low, the LAS sorption ability of a sediment is very weak

MNazeih_WatChem Yahoo.Com

ThanksThanks
Mohammed Nazeih M. GamalChemist

![Green Demulsifier Development - Proserv...III Demulsifier Chemistry History Time period Dosage [ppm] Chemistry 1920 - 1935 500 - 1.000 Naphthenic acids, aromatic and aliphatic sulphonates](https://static.documents.pub/doc/80x56/5e98b35e13d8180128073d18/green-demulsifier-development-proserv-iii-demulsifier-chemistry-history-time.jpg)


