Linear Regression Linear Regression Y Y i i = = 0 0 + + 1 1 x x i i + + i i Marco Lattuada Swiss Federal Institute of Technology - ETH Institut für Chemie und Bioingenieurwissenschaften ETH Hönggerberg/ HCI F135 – Zürich (Switzerland) E-mail: [email protected]http://www.morbidelli-group.ethz.ch/ education/index
Transcript
Linear RegressionLinear RegressionYYii = = 00 + + 11xxii + + ii
Linear RegressionLinear RegressionYYii = = 00 + + 11xxii + + ii
Marco Lattuada
Swiss Federal Institute of Technology - ETHInstitut für Chemie und BioingenieurwissenschaftenETH Hönggerberg/ HCI F135 – Zürich (Switzerland)
Marco Lattuada – Statistical and Numerical Methods for Chemical EngineersSimple Linear Regressions – Page # 2
Regression AnalysisRegression Analysis
• Aim: To know to which extent a certain response (dependent) variable is related to a set of explanatory (independent) variables.
• Example: James David Forbes (Edinburgh 1809-1868)
• Aim: To know to which extent a certain response (dependent) variable is related to a set of explanatory (independent) variables.
• Example: James David Forbes (Edinburgh 1809-1868)
1 2, , , NY f x x x
Response Observations
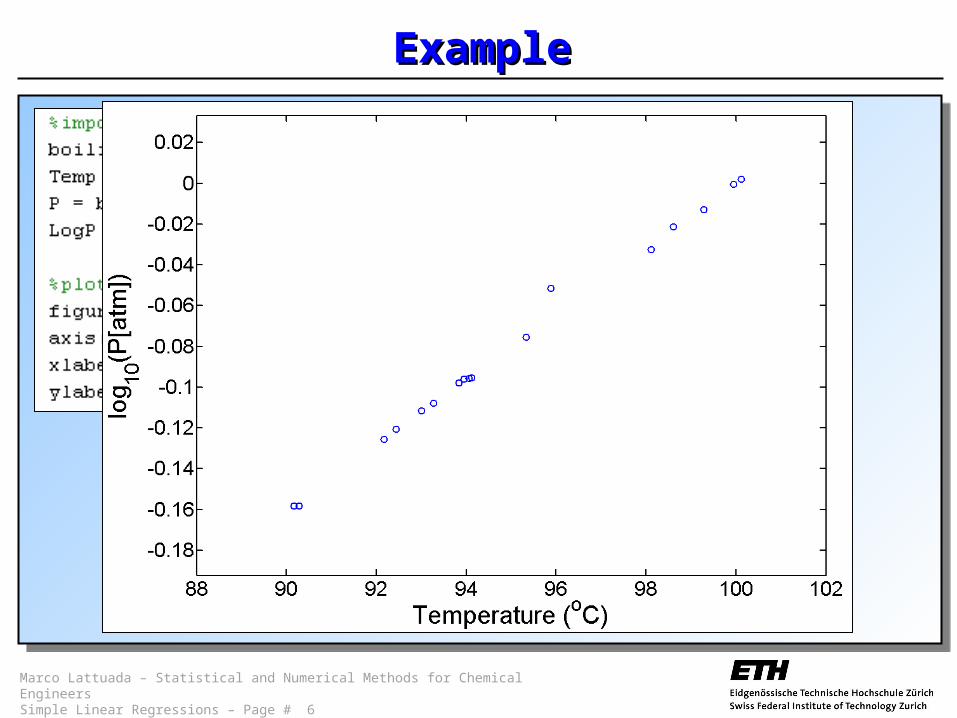
Professor in glaciology. He measured the water boiling points and atmospheric pressures at 17 different locations in the Swiss alps (Jungfrau) and in Scotland with the aim of using the boiling temperature of water to estimate altitude.
0 1 0 1
log
log
b atm
b atm
T P
T P x
Marco Lattuada – Statistical and Numerical Methods for Chemical EngineersSimple Linear Regressions – Page # 3
Regression ModelRegression Model
Input data: vectors x and Y, where:
• xi → i-th observation
• Yi → i-th response, or measurement
Model: Y = 0 + 1x + or Yi = 0 + 1xi + i
Output data:
• → estimated values of 0 and 1
Input data: vectors x and Y, where:
• xi → i-th observation
• Yi → i-th response, or measurement
Model: Y = 0 + 1x + or Yi = 0 + 1xi + i
Output data:
• → estimated values of 0 and 1
Measurement Error
Fundamental assumption: errors are mutually independent and normally distributed with mean zero and variance 2:
0,i N
0 1ˆ ˆ,
Marco Lattuada – Statistical and Numerical Methods for Chemical EngineersSimple Linear Regressions – Page # 4
Residuals Residuals ii
20,i N
0 1 0 1
20 1var var var
i i i i i
i i i i
E Y E x x
Y x
0 1 iE Y x
,i iY
Marco Lattuada – Statistical and Numerical Methods for Chemical EngineersSimple Linear Regressions – Page # 5
Estimation of the ParametersEstimation of the Parameters
Least Square Method:
Minimum of S:
Least Square Method:
Minimum of S:
2
0 1 0 11
,obsN
i ii
S Y x
The objective function (S) expresses a measure of the closeness between the regression line and the observations I want to find the minimum of S
0
1
0
0
S
S
1 2
0 1
ˆ
ˆ ˆ
i i
i
x x Y Y
x x
Y x
Marco Lattuada – Statistical and Numerical Methods for Chemical EngineersSimple Linear Regressions – Page # 6
ExampleExample
Marco Lattuada – Statistical and Numerical Methods for Chemical EngineersSimple Linear Regressions – Page # 7