Page 1
Supplemental Materials, SCT and ADHD 1
The internal and external validity of sluggish cognitive tempo and its relation with DSM-IV ADHD
Supplemental MaterialsTo conserve space in the print version of the journal, these supplemental materials include complete descriptions
of the measures that were described briefly in the main paper. Similarly, four supplemental tables provide a
comprehensive summary of the exploratory factor analyses and multiple regression analyses. Finally, Section 3 includes
full citations for the comprehensive reference list of all 546 studies that are included in the review.
Table of ContentsSection 1. Measures
1.1 Concurrent psychopathology (page 2)
1.2. Measures of functional impairment (pages 3 - 6)
1.3. Measures of neuropsychological functioning (pages 6 - 10)
Section 2. Supplement TablesSupplement Table 1. Exploratory factor analyses of SCT and DSM-IV ADHD symptoms (pages 11 - 13)
Supplement Table 2. Exploratory factor analyses of symptoms of SCT, ADHD, and other disorders (pages 14 - 16)
Supplement Table 3. Multiple regression models predicting measures of functional impairment (pages 17 - 23)
Supplement Table 4: Multiple regression models predicting measures of neuropsychological functioning (pages 24 - 26)
Section 3: Citations in the supplemental materials (pages 27 - 28)
Page 2
Supplemental Materials, SCT and ADHD 2
Section I: Measures
1.1. CONCURRENT MENTAL DISORDERS
Diagnostic Interview
One parent completed the Diagnostic Interview for Children and Adolescents for DSM-IV, a widely-
used structured diagnostic interview with adequate reliability (Reich, Welner, & Herjanic, 1997). Modules for
oppositional defiant disorder (ODD), conduct disorder (CD), major depressive disorder (MDD), and
generalized anxiety disorder (GAD) were used for the current analyses.
Parent and teacher ratings
In addition to the DICA-IV, parents and teachers completed the Achenbach Scale for Empirically
Based Assessment (ASEBA; Achenbach & Rescorla, 2001). The ASEBA is a widely-used psychopathology
screening measure with well-established reliability and validity for the age range included in the current study
(Achenbach & Rescorla, 2001). In addition to broad-band internalizing and externalizing composite scores,
the ASEBA provides narrow-band scores on more specific dimensions of psychopathology. The narrow-band
scales used in the current study were Withdrawn, Anxious/Depressed, Somatic Complaints, Aggressive
Behavior, and Delinquent Behavior.
Because the ASEBA is a clinical measure designed to screen for elevations of psychopathology, the
age-based normative scores in the ASEBA manual convert all Narrow-band raw scores that fall below the
mean of the population to a T score of 50 (for example, raw scores between 0 and 7 for the Aggression scale
in 6-11 year old males). To enable us to utilize the full range of scores on each scale in the current analyses,
raw scores on each Narrow-band scale were regressed onto age, and the standardized residual based on
our overall sample was computed.
Correlations between parent and teacher ratings on these scales were low to moderate (r = .29
- .51), but results were nearly identical for parent and teacher ratings (available from the first author upon
request). Therefore, to simplify presentation and interpretation, a standardized composite measure was
created for each ASEBA scale by computing the mean of the standardized parent and teacher ratings, then
restandardizing the mean score based on the current overall sample. Results for the composite were also
consistent with the pattern on the parent and teacher ratings alone.
Page 3
Supplemental Materials, SCT and ADHD 3
1.2. FUNCTIONAL IMPAIRMENT
Global impairment
Parents completed the non-clinician version of the Child Global Assessment Scale (CGAS;
Setterberg, Bird, & Gould, 1992), a measure of global impairment that asks raters to indicate the single
number between 1 and 100 that best represents the individual’s functioning (inter-rater reliability based on
mother and father ratings, r = .55; test-retest r = .71). To supplement the CGAS, items on the DBRS
asked parents and teachers to rate the extent to which the participant experienced difficulty with the
overall management of daily responsibilities (test-retest r = .61 - .81). Because correlations between the
CGAS and the ratings of daily responsibility were relatively modest (r = .25 - .31), these measures were
analyzed separately.
Academic impairment
Overall academic functioning was assessed by parent and teacher report. In addition, each
participant completed an extensive battery of standardized psychometric measures of academic
achievement to provide a comprehensive appraisal of the academic correlates of ADHD and SCT.
Parent and teacher rating scales. Items from the teacher DBRS were used to assess overall
academic impairment. Ratings of the participant's overall academic performance, understanding of
assignments, and completion of homework and classroom assignments were highly correlated (r = .75
- .85), so a composite academic impairment score was created by restandardizing the mean of these
ratings based on the entire current sample (composite score α = .93). Parents were asked to estimate
their child's current grades in reading, math, language, and social science. Parent ratings of performance
in these four subjects were also highly correlated (r = .65 - .80), so an overall composite score for
academic grades was created by restandardizing the mean of the ratings for the four subjects based on
the current sample (composite score α = .91).
Academic achievement
Participants in the CLDRC complete an extensive battery of measures of academic achievement.
To simplify interpretation for the current study, four composite scores were created based on measures
word reading, reading comprehension, mathematics, and written language.
Page 4
Supplemental Materials, SCT and ADHD 4
Reading achievement. The Peabody Individual Achievement Test (PIAT; Dunn & Markwardt,
1970). Reading Recognition subtest is an untimed measure of single-word reading (test-retest r = .94
- .98), whereas the Test of Word Reading Efficiency (TOWRE; Torgesen, Wagner, & Rashotte, 1999)
requires the participant to read as many single words as possible in 45 seconds (test-retest r = .84 - .97).
Because these two measures are highly correlated in the current sample (r = .72), the mean of the age-
corrected standardized scores was restandardized based on the overall current sample to provide a
composite measure of single word reading.
Reading comprehension. Participants also completed an extensive battery of measures of
reading comprehension. On the Woodcock-Johnson Tests of Achievement, Third Edition (WJ-III)
Passage Comprehension subtest, participants silently read short passages of one or two sentences and
provide a missing word to demonstrate their comprehension (test-retest r = .88 - .95; McGrew &
Woodcock, 2001). The PIAT Comprehension subtest Dunn & Markwardt, 1970 also requires participants
to read silently short one- or two-sentence passages. The participant then turns the page and selects one
of four pictures that best depicts the meaning of the passage without referring back to the text (median
test-retest reliability = .90). In contrast, the Gray Oral Reading Test, Third Edition (GORT-III; Wiederhold
& Bryant, 1993) requires the participant to read aloud longer passages, which are then followed by five
multiple-choice comprehension questions (α > .90). Finally, the Qualitative Reading Inventory, 3rd Edition
(Leslie & Caldwell, ) also includes longer and more complex reading passages. Comprehension is first
assessed by asking the participant to retell the passage, followed by a series of short-answer
comprehension questions. (Inter-rater reliability = .97 for the QRI coding system in our laboratory).
Correlations between the four comprehension measures were medium to large in magnitude in the
current sample (r = .48 - .70). Scores on each individual measure were age-corrected and standardized
based on the current sample, then the mean of the four measures was restandardized to provide a
standardized composite measure of overall reading comprehension (α = .76).
Mathematics achievement. On the PIAT Math subtest a series of problems are presented orally,
and the participant then selects among four potential responses (Dunn & Markwardt, 1970). The majority
of the specific items on the PIAT assess understanding and application of math concepts, and a smaller
percentage of items measure explicit math computation abilities (split-half reliability for the total score
Page 5
Supplemental Materials, SCT and ADHD 5
= .90 - .96). In contrast, all items on the Math subtest of the Wide Range Achievement Test, Revised
(WRAT-R; Jastak & Wilkinson, 1984) involve paper-and-pencil calculations (reliability = .92). Scores on
the PIAT and WRAT-R math subtests are significantly correlated in the current sample (r = .70). A
standardized composite measure of mathematics achievement was created by restandardizing the mean
of the standardized PIAT and WRAT-R scores based on the current sample.
Written language. Handwriting fluency was measured by the Copying subtest from the Group
Diagnostic Reading and Aptitude and Achievement Tests (Monroe & Sherman, 1966). This task requires
the participant to copy a paragraph as quickly as possible without making any mistakes for 90 seconds,
and provides a reliable measure of handwriting ability (test-retest r = .88; Graham, Berninger, Weintraub,
& Schafer, 1998). Stimuli on the WJ-III Writing Fluency subtest include three target words and a simple
line drawing, and the participant is told to use all three words in a complete grammatical sentence that
describes the picture. The primary dependent measure is the number of sentences that are completed
correctly in 7 minutes (median test-retest reliability = .90 in the age range of our sample; McGrew &
Woodcock, 2001). Finally, WJ-III Writing Samples is an untimed test that requires participants to write a
single sentence in response to the tester’s oral directions and a pictorial prompt. Two independent raters
assigned 0 to 2 points to each response based on the scoring key in the WJ-III manual. The two raters’
scores for each item are then averaged and summed across items to create the total raw score
(test-retest reliability = .83 - .87; McGrew & Woodcock, 2001). Correlations between the three writing
measures were moderate to high (r = .45 - .65), and a written language composite score based on these
measures had adequate internal consistency (α = .80).
Social impairment
Multiple measures were administered to assess different dimensions of social functioning. Parent
and teacher ratings on the ASEBA Social Problems scale were used to measure overall social
impairment. To assess more specific aspects of social functioning, parents also completed the Colorado
Learning Difficulties Questionnaire (CLDQ; Willcutt et al., 2011). The CLDQ Social Isolation scale
measures the participant's tendency to become isolated or anxious in new social settings (scale α = .83,
1-year test-retest r = .69). The CLDQ Social Cognition scale assesses understanding of more subtle
aspects of social interactions, such as the ability to predict and understand the feelings and reactions of
Page 6
Supplemental Materials, SCT and ADHD 6
others and to maintain appropriate personal space (α = .87, test-retest r = .72). Finally, teachers
estimated the proportion of children who like, dislike, or ignore the participant using the procedure
described by Dishion (Dishion, 1990). The measures of social functioning were analyzed separately
because we hypothesized that different aspects of social functioning might relate differentially to ADHD
and SCT symptoms.
1.3. NEUROPSYCHOLOGICAL MEASURES
The neuropsychological battery was selected to include constructs that have been shown to be most
strongly associated with ADHD in previous studies. These include different domains of executive functions,
processing speed and response variability. Six neuropsychological composites were extracted from the
overall neuropsychological battery of the CLDRC (e.g., McGrath et al., 2011; Shanahan et al., 2006; Willcutt
et al., 2010; Willcutt, Pennington, Olson, Chhabildas, & Hulslander, 2005).
Response inhibition
The Stop-signal task (e.g., Logan, Schachar, & Tannock, 1997; Schachar, Mota, Logan, Tannock,
& Klim, 2000) is a computerized measure of inhibitory control that was developed based on a dual-
process model of inhibition. On primary task trials, the letters X or O are presented in the center of the
monitor, and the participant responds by pressing the corresponding key on the keyboard. On stop-signal
trials the same visual stimulus appears, but an auditory tone is also presented shortly after the X or the O
appears on the screen. The participant is instructed to press the X or O key as rapidly as possible for
each trial, but to inhibit the key press on each of the trials on which the tone is presented.
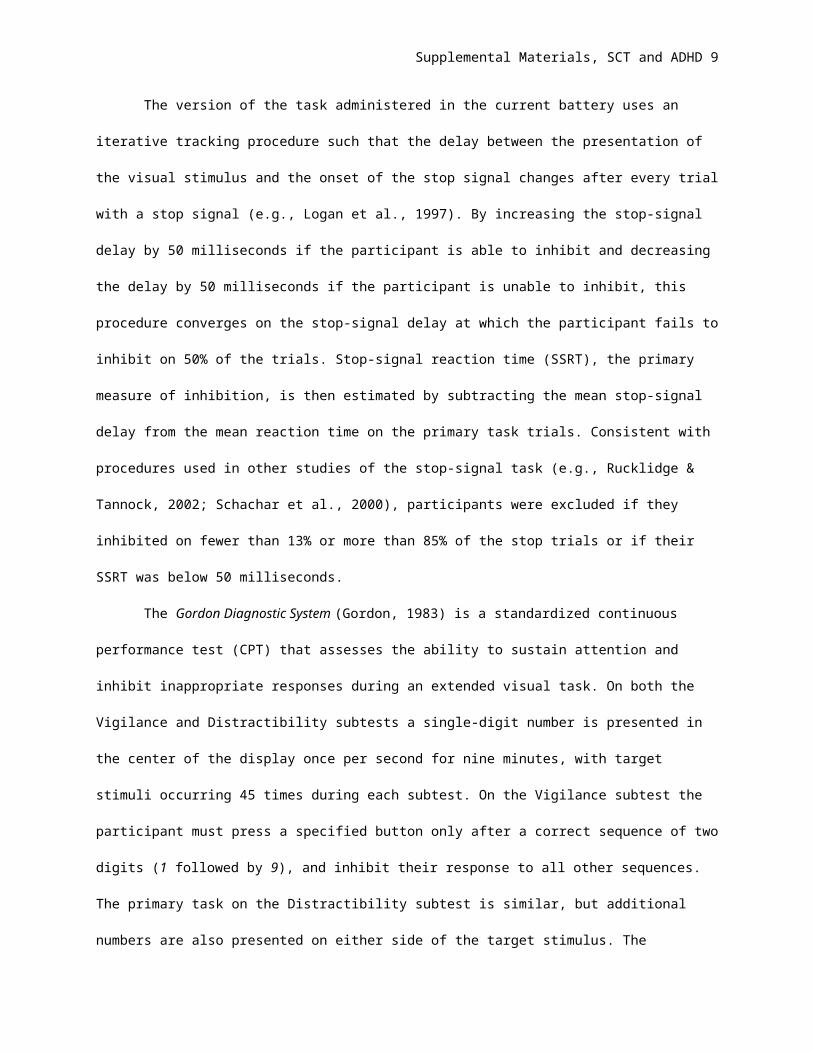
The version of the task administered in the current battery uses an iterative tracking procedure
such that the delay between the presentation of the visual stimulus and the onset of the stop signal
changes after every trial with a stop signal (e.g., Logan et al., 1997). By increasing the stop-signal delay
by 50 milliseconds if the participant is able to inhibit and decreasing the delay by 50 milliseconds if the
participant is unable to inhibit, this procedure converges on the stop-signal delay at which the participant
fails to inhibit on 50% of the trials. Stop-signal reaction time (SSRT), the primary measure of inhibition, is
then estimated by subtracting the mean stop-signal delay from the mean reaction time on the primary task
trials. Consistent with procedures used in other studies of the stop-signal task (e.g., Rucklidge & Tannock,
Page 7
Supplemental Materials, SCT and ADHD 7
2002; Schachar et al., 2000), participants were excluded if they inhibited on fewer than 13% or more than
85% of the stop trials or if their SSRT was below 50 milliseconds.
The Gordon Diagnostic System (Gordon, 1983) is a standardized continuous performance test
(CPT) that assesses the ability to sustain attention and inhibit inappropriate responses during an
extended visual task. On both the Vigilance and Distractibility subtests a single-digit number is presented
in the center of the display once per second for nine minutes, with target stimuli occurring 45 times during
each subtest. On the Vigilance subtest the participant must press a specified button only after a correct
sequence of two digits (1 followed by 9), and inhibit their response to all other sequences. The primary
task on the Distractibility subtest is similar, but additional numbers are also presented on either side of the
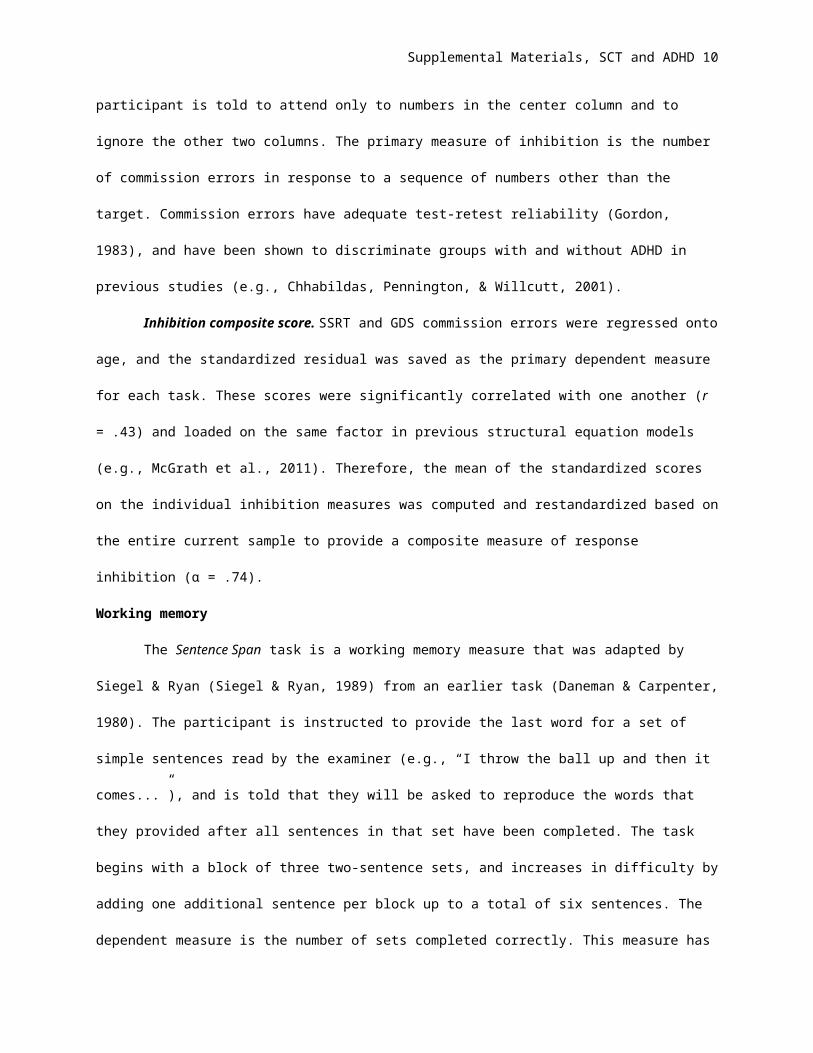
target stimulus. The participant is told to attend only to numbers in the center column and to ignore the
other two columns. The primary measure of inhibition is the number of commission errors in response to a
sequence of numbers other than the target. Commission errors have adequate test-retest reliability
(Gordon, 1983), and have been shown to discriminate groups with and without ADHD in previous studies
(e.g., Chhabildas, Pennington, & Willcutt, 2001).
Inhibition composite score. SSRT and GDS commission errors were regressed onto age, and
the standardized residual was saved as the primary dependent measure for each task. These scores
were significantly correlated with one another (r = .43) and loaded on the same factor in previous
structural equation models (e.g., McGrath et al., 2011). Therefore, the mean of the standardized scores
on the individual inhibition measures was computed and restandardized based on the entire current
sample to provide a composite measure of response inhibition (α = .74).
Working memory
The Sentence Span task is a working memory measure that was adapted by Siegel & Ryan
(Siegel & Ryan, 1989) from an earlier task (Daneman & Carpenter, 1980). The participant is instructed to
provide the last word for a set of simple sentences read by the examiner (e.g., “I throw the ball up and
then it comes...”), and is told that they will be asked to reproduce the words that they provided after all
sentences in that set have been completed. The task begins with a block of three two-sentence sets, and
increases in difficulty by adding one additional sentence per block up to a total of six sentences. The
dependent measure is the number of sets completed correctly. This measure has adequate internal
Page 8
Supplemental Materials, SCT and ADHD 8
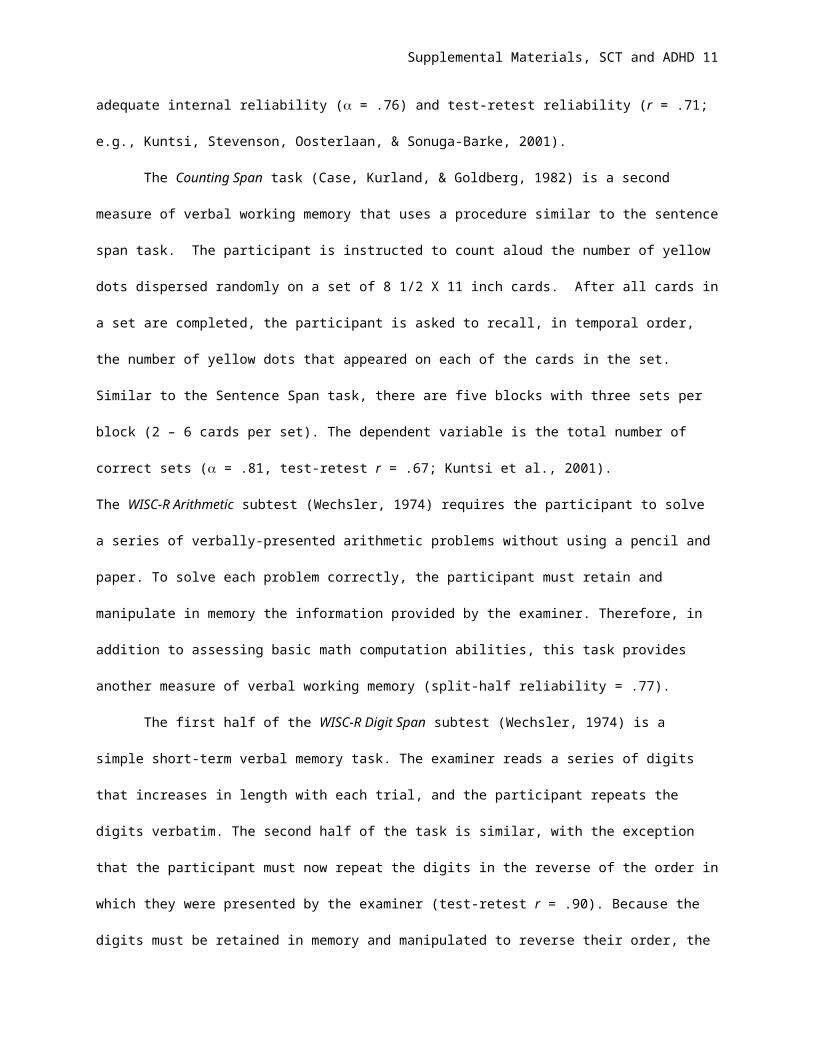
reliability ( = .76) and test-retest reliability (r = .71; e.g., Kuntsi, Stevenson, Oosterlaan, & Sonuga-Barke,
2001).
The Counting Span task (Case, Kurland, & Goldberg, 1982) is a second measure of verbal
working memory that uses a procedure similar to the sentence span task. The participant is instructed to
count aloud the number of yellow dots dispersed randomly on a set of 8 1/2 X 11 inch cards. After all
cards in a set are completed, the participant is asked to recall, in temporal order, the number of yellow
dots that appeared on each of the cards in the set. Similar to the Sentence Span task, there are five
blocks with three sets per block (2 – 6 cards per set). The dependent variable is the total number of
correct sets ( = .81, test-retest r = .67; Kuntsi et al., 2001).
The WISC-R Arithmetic subtest (Wechsler, 1974) requires the participant to solve a series of verbally-
presented arithmetic problems without using a pencil and paper. To solve each problem correctly, the
participant must retain and manipulate in memory the information provided by the examiner. Therefore, in
addition to assessing basic math computation abilities, this task provides another measure of verbal
working memory (split-half reliability = .77).
The first half of the WISC-R Digit Span subtest (Wechsler, 1974) is a simple short-term verbal
memory task. The examiner reads a series of digits that increases in length with each trial, and the
participant repeats the digits verbatim. The second half of the task is similar, with the exception that the
participant must now repeat the digits in the reverse of the order in which they were presented by the
examiner (test-retest r = .90). Because the digits must be retained in memory and manipulated to reverse
their order, the digits backward component of the Digit Span task is interpreted as a measure of verbal
working memory (e.g., Rucklidge & Tannock, 2002).
Working memory composite score. The three working memory measures are moderately
correlated (r = .47 - .59) in our sample, and consistently load on the same factor in exploratory and
confirmatory factor analyses (e.g., McGrath et al., 2011). Therefore, after age-regressed standardized
scores were created for each measure based on the full sample, the mean of these scores was computed
and restandardized to provide a composite measure of verbal working memory (α = .77).
Page 9
Supplemental Materials, SCT and ADHD 9
Processing Speed
The WISC-R Coding subtest (Wechsler, 1974) and WISC-III Symbol Search subtest (Wechsler,
1991) are paper-and-pencil measures of processing speed that have been shown to be associated with
ADHD in previous studies (e.g., Chhabildas et al., 2001; Rucklidge & Tannock, 2002). The Coding subtest
requires the participant to rapidly copy symbols associated with specific digits based on a key provided at
the top of the page, and the dependent measure is the total number of correct items after two minutes.
The Symbol Search subtest requires the participant to match a symbol to an identical target that is
displayed among several distracter stimuli that share some physical features. The dependent measure is
the number of correct items minus the number of incorrect items completed before the two minute time
limit. Psychometric studies of the WISC-R and WISC-III indicate that these subtests have adequate
reliability (test-retest r = .88 for WISC-R Coding and .86 for WISC-III Symbol Search), and they correlate
relatively modestly with FSIQ (Wechsler, 1974; 1991), suggesting that they may tap aspects of
processing speed that are at least partially independent of general intelligence.
The Colorado Perceptual Speed Test (DeFries, Singer, Foch, & Lewitter, 1978) requires the
participant to circle one of four possible letter strings to match a target letter string as quickly as possible.
The primary dependent variable it the total number of items completed correctly in two minutes. The
alternate forms reliability of the CPS total score is .91 in our sample.
Finally, the Educational Testing Service Identical Pictures subtest (French, Ekstrom, & Price,
1963) requires the participant to identify as quickly as possible the one picture out of five options that is
an exact match to a target picture. The primary dependent measure is the number of items completed
correctly in two minutes, and the alternate forms reliability of the identical pictures score is .92 in our
sample.
Processing speed composite score. Correlations between the four processing speed
measures were significant and medium to large in magnitude (r = .52 - .66), and all four measures had a
primary loading on a latent processing speed factor in our previous analyses (McGrath et al., 2011).
Therefore, a composite processing speed score was created by calculating and restandardizing the mean
of the age-regressed standardized scores on the four measures (α = .84).
Page 10
Supplemental Materials, SCT and ADHD 10
Naming Speed
The Rapid Automatized Naming Test is an adaptation of the measure developed by Denckla and
Rudel (Denckla & Rudel, 1976). On each of the four test trials the participant names as many objects,
numbers, letters, or colors as possible in 15 seconds (test-retest r = .80 - .86). Correlations between the
four trials are moderate to high in our sample (r = .50 - .75), and the four scores loaded together on a
naming speed factor in our previous analyses (McGrath et al., 2011). A composite measure of naming
speed was crated by computing and restandardizing the mean of the age-regressed standardized scores
for the four test trials (α = .85).
Sustained attention
The primary measure of sustained attention is the number of omission errors (failure to respond
to the target sequence) during the CPT described previously (Gordon, 1983). The number of omission
errors were highly correlated across blocks and between the two parts of the task in the current sample (r
= .61 - .76; α = .88).
Response variability
The primary measures of response variability was the intraindividual standard deviation of
reaction times on the primary task (i.e., no stop signal) trials of the stop-signal task (e.g., Logan et al.,
1997; Schachar et al., 2000). The age-corrected response variability scores for the four blocks of the task
had adequate internal consistency (α = .86). A standardized composite response variability score was
created by restandardizing the mean of the age-regressed scores from the four experimental blocks of the
task.
Page 11
Supplemental Materials, SCT and ADHD 11
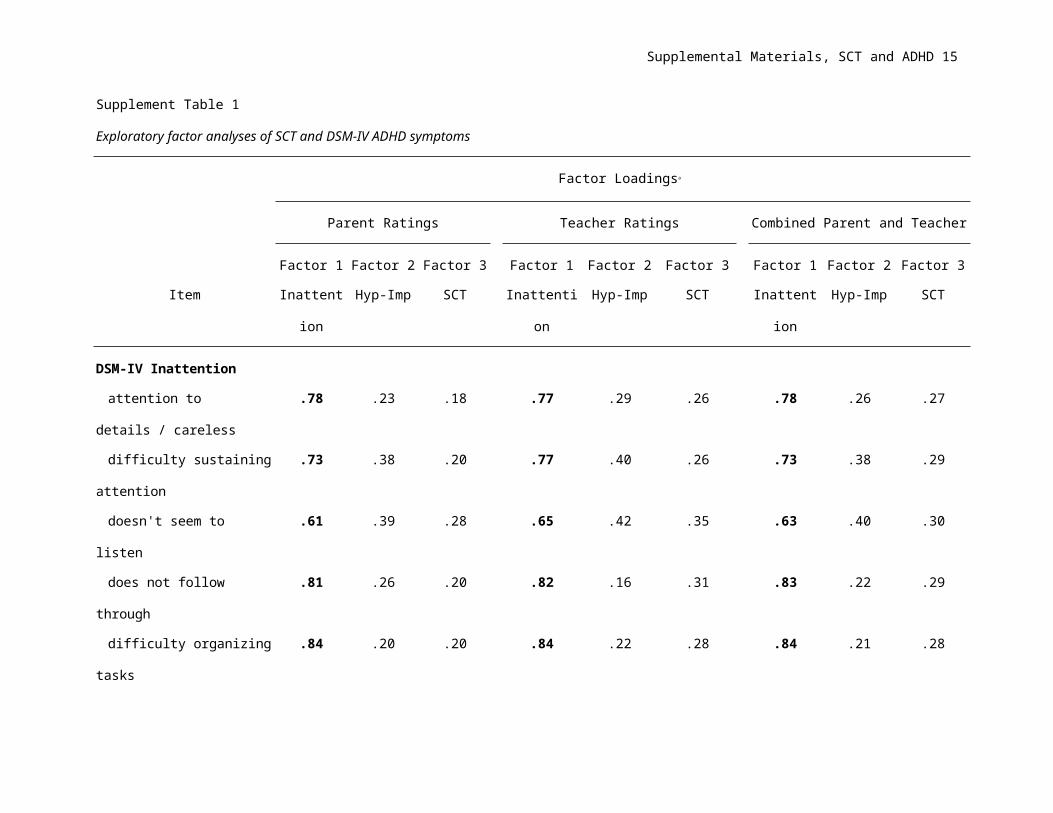
Supplement Table 1
Exploratory factor analyses of SCT and DSM-IV ADHD symptoms
Factor Loadingsa
Parent Ratings Teacher Ratings Combined Parent and Teacher
Factor 1 Factor 2 Factor 3 Factor 1 Factor 2 Factor 3 Factor 1 Factor 2 Factor 3
Item Inattention Hyp-Imp SCT Inattention Hyp-Imp SCT Inattention Hyp-Imp SCT
DSM-IV Inattention
attention to details / careless .78 .23 .18 .77 .29 .26 .78 .26 .27
difficulty sustaining attention .73 .38 .20 .77 .40 .26 .73 .38 .29
doesn't seem to listen .61 .39 .28 .65 .42 .35 .63 .40 .30
does not follow through .81 .26 .20 .82 .16 .31 .83 .22 .29
difficulty organizing tasks .84 .20 .20 .84 .22 .28 .84 .21 .28
avoids sustained effort .82 .21 .22 .79 .24 .33 .79 .26 .32
loses things need for tasks .74 .25 .24 .78 .23 .25 .78 .24 .26
easily distracted .75 .38 .23 .70 .41 .19 .73 .38 .23
forgetful .75 .29 .28 .77 .24 .36 .76 .27 .31
DSM-IV Hyperactivity-impulsivity symptoms
fidgets or squirms in seat .44 .61 .08 .43 .69 .07 .38 .64 .08
leaves seat .42 .65 .07 .35 .74 .00 .40 .69 .02
Page 12
Supplemental Materials, SCT and ADHD 12
runs / climbs .36 .65 .01 .16 .79 .08 .31 .69 .01
Page 13
Supplemental Materials, SCT and ADHD 13
Supplement Table 1
Exploratory factor analyses of SCT and DSM-IV ADHD symptoms
Factor Loadingsa
Parent Ratings Teacher Ratings Combined Parent and Teacher
Factor 1 Factor 2 Factor 3 Factor 1 Factor 2 Factor 3 Factor 1 Factor 2 Factor 3
Item Inattention Hyp-Imp SCT Inattention Hyp-Imp SCT Inattention Hyp-Imp SCT
DSM-IV Hyperactivity-impulsivity symptoms continued
difficulty playing quietly .34 .71 .05 .26 .77 .06 .34 .72 .07
on the go / driven by a motor .24 .78 .01 .19 .85 -.05 .24 .81 .04
talks excessively .10 .79 .05 .24 .80 -.13 .15 .80 .01
blurts out answers .17 .81 .04 .12 .88 -.05 .13 .86 .01
difficulty waiting turn .26 .80 .10 .15 .87 .01 .19 .85 .11
interrupts / intrudes .22 .78 .10 .16 .87 .00 .15 .83 .11
SCT items
sluggish / slow .25 .06 .80 .29 .04 .86 .29 .04 .83
seems to be "in a fog" .28 .16 .73 .33 .02 .75 .29 .12 .76
drowsy, sleepy .15 .06 .86 .19 .02 .84 .17 .06 .86
stares blankly .21 .25 .68 .26 .05 .79 .24 .14 .76
underactive, slow moving .13 -.14 .73 .23 .02 .86 .18 -.04 .84
Page 14
Supplemental Materials, SCT and ADHD 14
daydreams/lost in thoughts .38 .17 .67 .47 .06 .71 .43 .19 .66
Supplement Table 1
Exploratory factor analyses of SCT and DSM-IV ADHD symptoms
Factor Loadingsa
Parent Ratings Teacher Ratings Combined Parent and Teacher
Factor 1 Factor 2 Factor 3 Factor 1 Factor 2 Factor 3 Factor 1 Factor 2 Factor 3
Item Inattention Hyp-Imp SCT Inattention Hyp-Imp SCT Inattention Hyp-Imp SCT
Factor Eigenvalue 10.91 3.07 1.49 11.10 4.78 1.38 11.50 3.83 1.33
Items dropped from the final model
Easily confused .40 .19 .67 .49 .10 .65 .49 .13 .67
Seems not to hear .44 .35 .53 .47 .18 .61 .46 .31 .58
Absentminded .59 .20 .48 .60 .12 .55 .60 .18 .55
aloadings from EFA of the items that were included in the final model.
Page 15
Supplemental Materials, SCT and ADHD 15
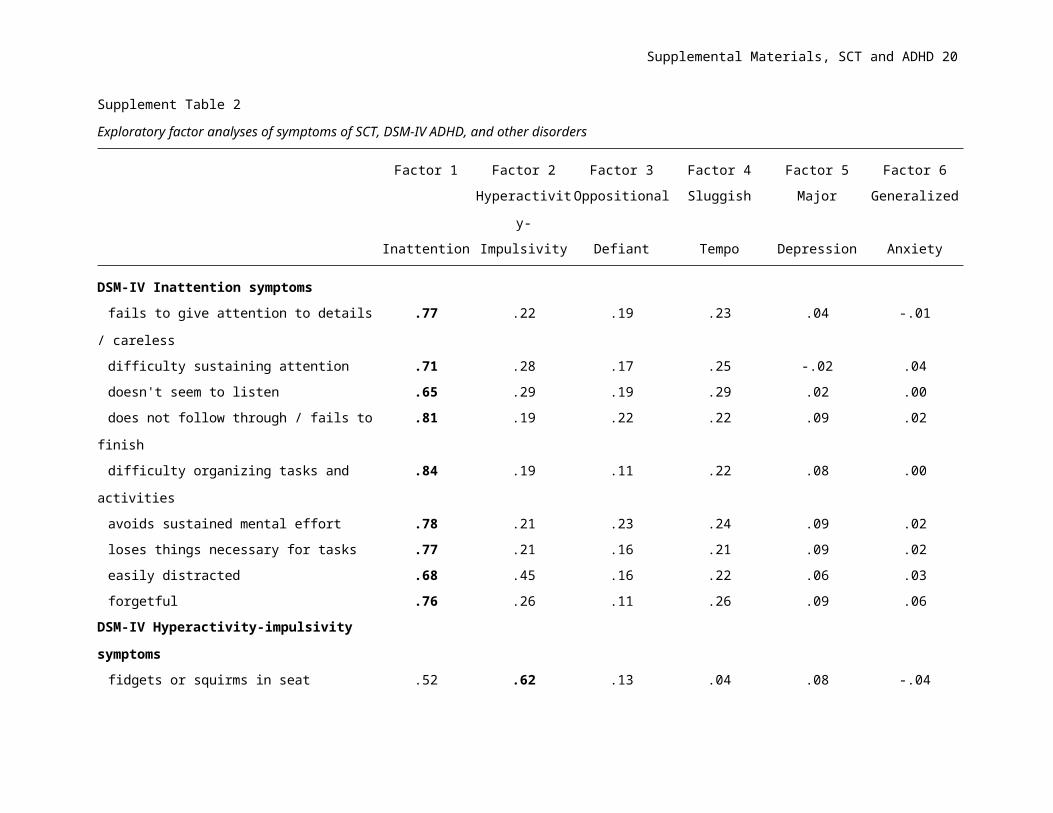
Supplement Table 2
Exploratory factor analyses of symptoms of SCT, DSM-IV ADHD, and other disorders
Factor 1 Factor 2 Factor 3 Factor 4 Factor 5 Factor 6
Hyperactivity- Oppositional Sluggish Major Generalized
Inattention Impulsivity Defiant Tempo Depression Anxiety
DSM-IV Inattention symptoms
fails to give attention to details / careless .77 .22 .19 .23 .04 -.01
difficulty sustaining attention .71 .28 .17 .25 -.02 .04
doesn't seem to listen .65 .29 .19 .29 .02 .00
does not follow through / fails to finish .81 .19 .22 .22 .09 .02
difficulty organizing tasks and activities .84 .19 .11 .22 .08 .00
avoids sustained mental effort .78 .21 .23 .24 .09 .02
loses things necessary for tasks .77 .21 .16 .21 .09 .02
easily distracted .68 .45 .16 .22 .06 .03
forgetful .76 .26 .11 .26 .09 .06
DSM-IV Hyperactivity-impulsivity symptoms
fidgets or squirms in seat .52 .62 .13 .04 .08 -.04
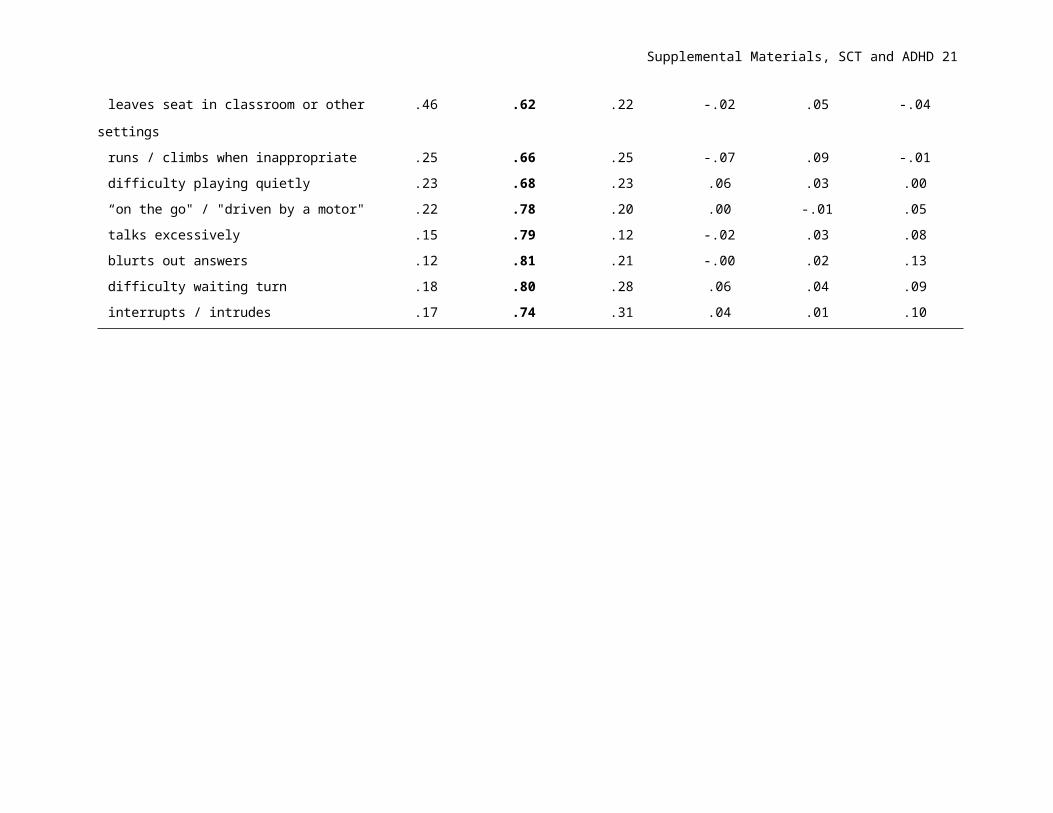
leaves seat in classroom or other settings .46 .62 .22 -.02 .05 -.04
runs / climbs when inappropriate .25 .66 .25 -.07 .09 -.01
difficulty playing quietly .23 .68 .23 .06 .03 .00
“on the go" / "driven by a motor" .22 .78 .20 .00 -.01 .05
talks excessively .15 .79 .12 -.02 .03 .08
blurts out answers .12 .81 .21 -.00 .02 .13
difficulty waiting turn .18 .80 .28 .06 .04 .09
Page 16
Supplemental Materials, SCT and ADHD 16
interrupts / intrudes .17 .74 .31 .04 .01 .10
Page 17
Supplemental Materials, SCT and ADHD 17
Supplement Table 2
Exploratory factor analyses of symptoms of SCT, DSM-IV ADHD, and other disorders
Factor 1 Factor 2 Factor 3 Factor 4 Factor 5 Factor 6
Hyperactivity- Oppositional Sluggish Major Generalized
Inattention Impulsivity Defiant Tempo Depression Anxiety
DSM-IV ODD symptoms
loses temper .16 .19 .65 -.05 .04 .01
argues with adults .13 .23 .71 -.04 .10 .03
actively defies / refuses to comply .14 .12 .71 .04 .03 -.11
deliberately annoys .14 .20 .61 -.04 .00 -.08
blames others for his/her own mistakes .12 .23 .60 -.01 -.08 .01
touchy / easily annoyed .09 .14 .54 .14 .09 .20
angry / resentful .13 .11 .67 .16 .16 .13
spiteful / vindictive .09 .19 .55 .15 .03 .16
SCT items
sluggish / slow to respond .24 -.04 .07 .80 .12 .00
seems to be "in a fog" .33 .12 .06 .66 .02 .01
drowsy, sleepy .25 .00 .04 .77 .12 .11
stares blankly .25 .16 .07 .64 .00 .07
underactive, slow moving .25 -.06 -.03 .75 .10 .08
daydreams/lost in thoughts .38 .04 .05 .69 .08 .18
Page 18
Supplemental Materials, SCT and ADHD 18
Supplement Table 2
Exploratory factor analyses of symptoms of SCT, DSM-IV ADHD, and other disorders
Factor 1 Factor 2 Factor 3 Factor 4 Factor 5 Factor 6
Hyperactivity- Oppositional Sluggish Major Generalized
Inattention Impulsivity Defiant Tempo Depression Anxiety
DSM-IV Major Depressive Disorder symptoms
depressed / irritable mood .06 -.03 .14 .14 .64 .15
diminished interest in activities -.02 .09 -.11 .14 .69 .02
weight loss or gain -.05 .06 .07 .06 .55 .18
insomnia/hypersomnia .05 .14 .15 .24 .45 .24
psychomotor agitation or retardation .08 -.06 .07 .60 .25 .01
fatigue / loss of energy .04 -.02 -.04 .20 .67 .06
worthless / guilt .33 .02 .08 .03 .43 .45
diminished ability to concentrate .38 .01 .11 .03 .50 .20
thoughts of death/suicide .13 .02 .08 -.14 .60 .11
DSM-IV Generalized Anxiety Disorder symptoms
excessive anxiety and worry .03 -.02 .12 .04 .19 .59
restless / on edge -.08 .08 -.05 -.08 .11 .54
easily fatigued .05 .03 .02 .01 .12 .62
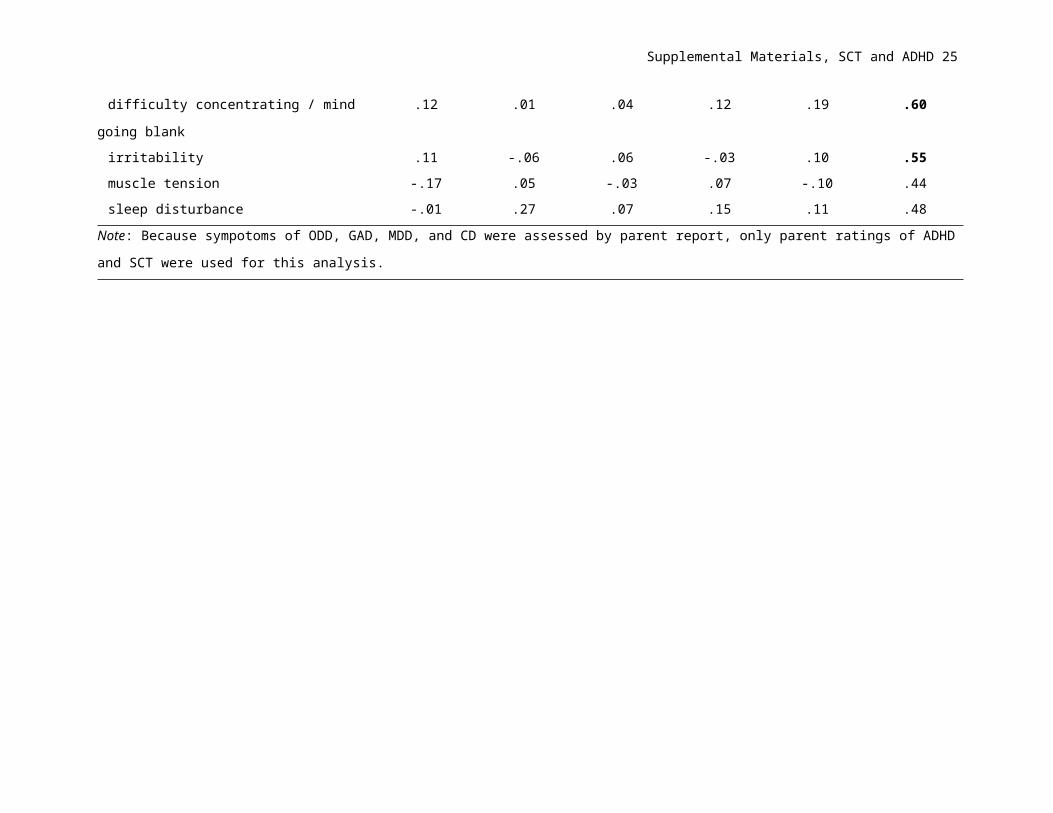
difficulty concentrating / mind going blank .12 .01 .04 .12 .19 .60
irritability .11 -.06 .06 -.03 .10 .55
muscle tension -.17 .05 -.03 .07 -.10 .44
sleep disturbance -.01 .27 .07 .15 .11 .48
Page 19
Supplemental Materials, SCT and ADHD 19
Note: Because sympotoms of ODD, GAD, MDD, and CD were assessed by parent report, only parent ratings of ADHD and SCT were used for this
analysis.
Page 20
Supplemental Materials, SCT and ADHD 20
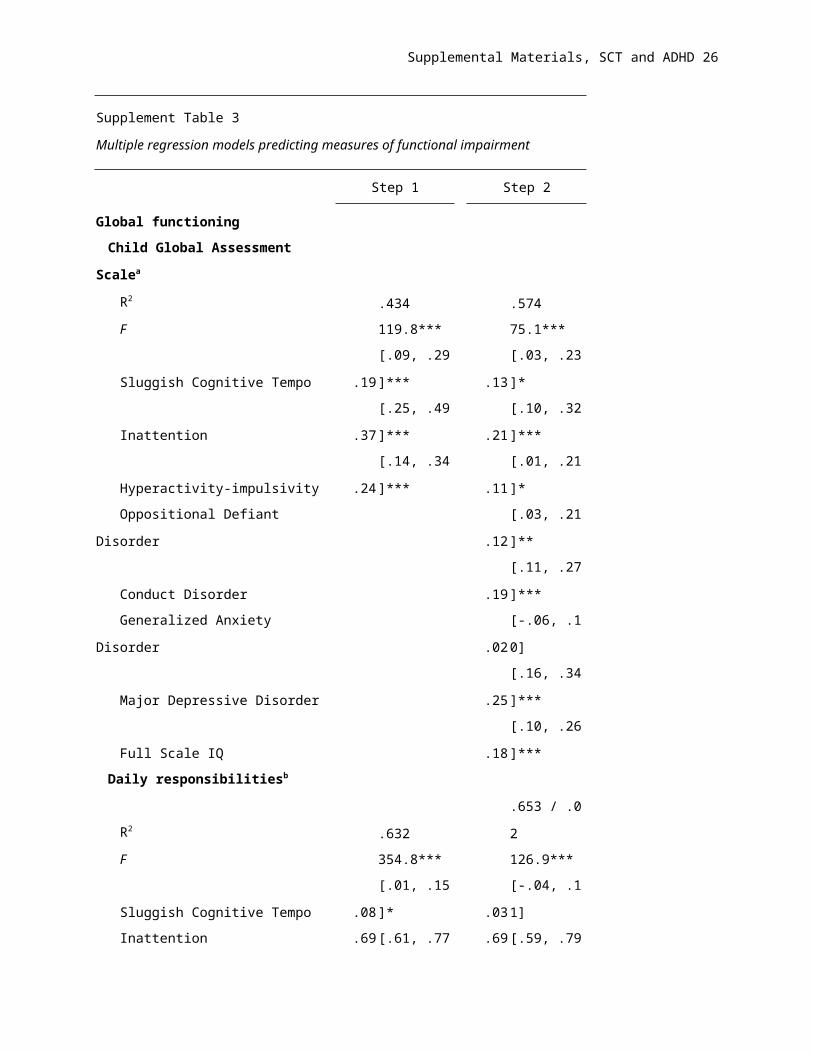
Supplement Table 3
Multiple regression models predicting measures of functional impairment
Step 1 Step 2
Global functioning
Child Global Assessment Scalea
R2 .434 .574
F 119.8*** 75.1***
Sluggish Cognitive Tempo .19 [.09, .29]*** .13 [.03, .23]*
Inattention .37 [.25, .49]*** .21 [.10, .32]***
Hyperactivity-impulsivity .24 [.14, .34]*** .11 [.01, .21]*
Oppositional Defiant Disorder .12 [.03, .21]**
Conduct Disorder .19 [.11, .27]***
Generalized Anxiety Disorder .02 [-.06, .10]
Major Depressive Disorder .25 [.16, .34]***
Full Scale IQ .18 [.10, .26]***
Daily responsibilitiesb
R2 .632 .653 / .02
F 354.8*** 126.9***
Sluggish Cognitive Tempo .08 [.01, .15]* .03 [-.04, .11]
Inattention .69 [.61, .77]** .69 [.59, .79]***
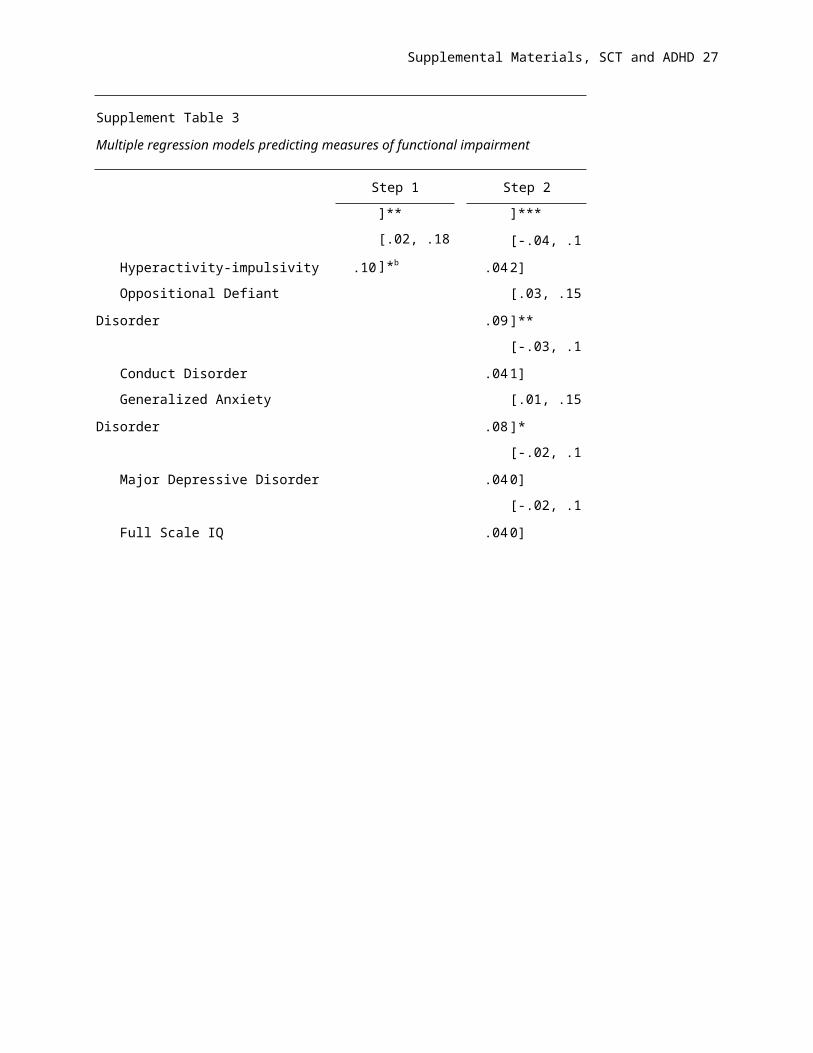
Hyperactivity-impulsivity .10 [.02, .18]*b .04 [-.04, .12]
Oppositional Defiant Disorder .09 [.03, .15]**
Conduct Disorder .04 [-.03, .11]
Generalized Anxiety Disorder .08 [.01, .15]*
Major Depressive Disorder .04 [-.02, .10]
Full Scale IQ .04 [-.02, .10]
Page 21
Supplemental Materials, SCT and ADHD 21
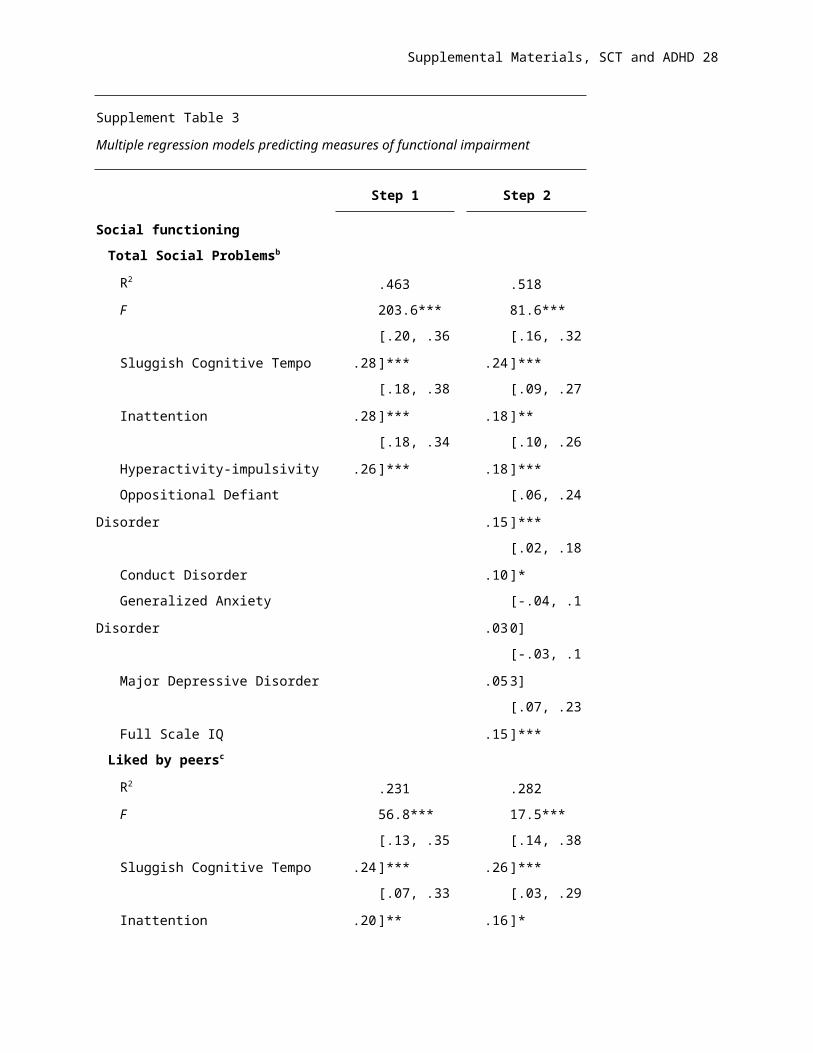
Supplement Table 3
Multiple regression models predicting measures of functional impairment
Step 1 Step 2
Social functioning
Total Social Problemsb
R2 .463 .518
F 203.6*** 81.6***
Sluggish Cognitive Tempo .28 [.20, .36]*** .24 [.16, .32]***
Inattention .28 [.18, .38]*** .18 [.09, .27]**
Hyperactivity-impulsivity .26 [.18, .34]*** .18 [.10, .26]***
Oppositional Defiant Disorder .15 [.06, .24]***
Conduct Disorder .10 [.02, .18]*
Generalized Anxiety Disorder .03 [-.04, .10]
Major Depressive Disorder .05 [-.03, .13]
Full Scale IQ .15 [.07, .23]***
Liked by peersc
R2 .231 .282
F 56.8*** 17.5***
Sluggish Cognitive Tempo .24 [.13, .35]*** .26 [.14, .38]***
Inattention .20 [.07, .33]** .16 [.03, .29]*
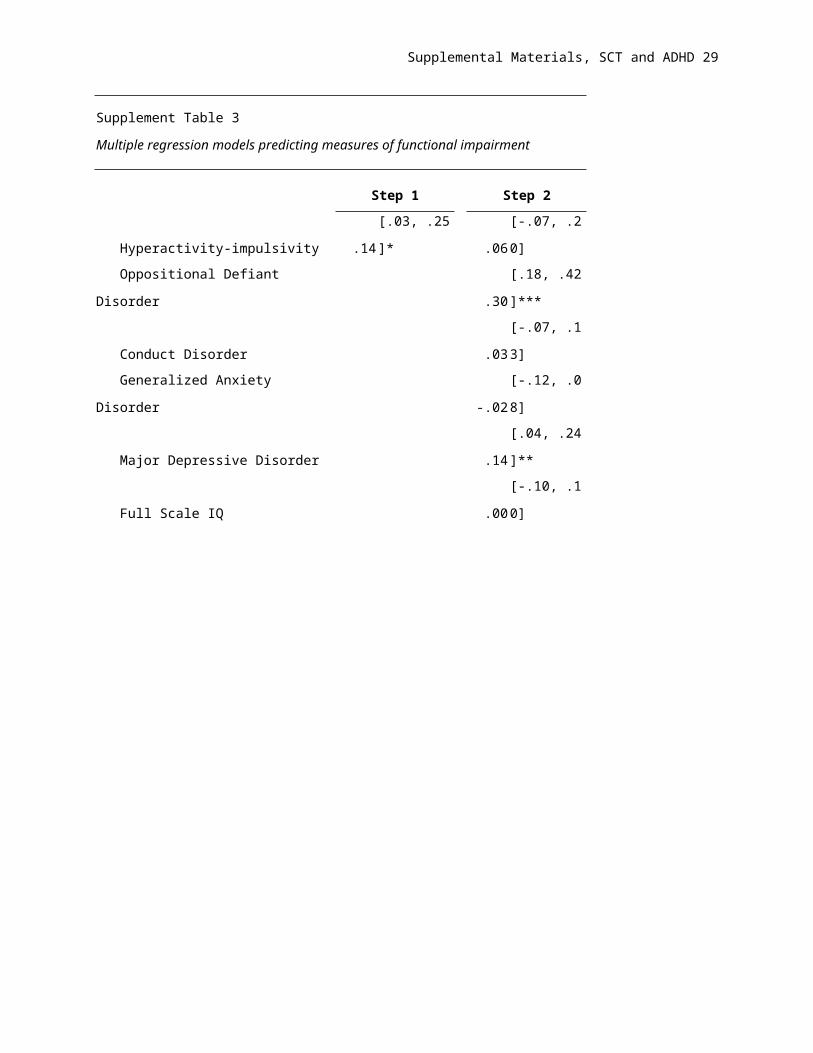
Hyperactivity-impulsivity .14 [.03, .25]* .06 [-.07, .20]
Oppositional Defiant Disorder .30 [.18, .42]***
Conduct Disorder .03 [-.07, .13]
Generalized Anxiety Disorder -.02 [-.12, .08]
Major Depressive Disorder .14 [.04, .24]**
Full Scale IQ .00 [-.10, .10]
Page 22
Supplemental Materials, SCT and ADHD 22
Supplement Table 3
Multiple regression models predicting measures of functional impairment
Step 1 Step 2
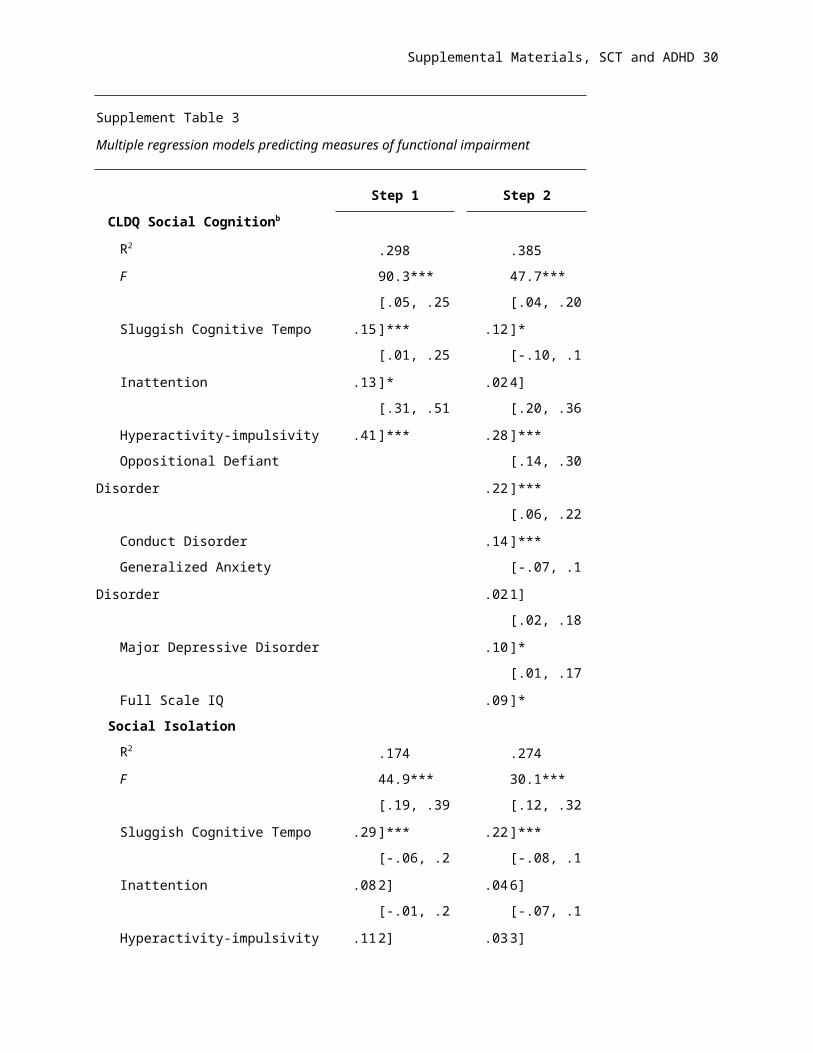
CLDQ Social Cognitionb
R2 .298 .385
F 90.3*** 47.7***
Sluggish Cognitive Tempo .15 [.05, .25]*** .12 [.04, .20]*
Inattention .13 [.01, .25]* .02 [-.10, .14]
Hyperactivity-impulsivity .41 [.31, .51]*** .28 [.20, .36]***
Oppositional Defiant Disorder .22 [.14, .30]***
Conduct Disorder .14 [.06, .22]***
Generalized Anxiety Disorder .02 [-.07, .11]
Major Depressive Disorder .10 [.02, .18]*
Full Scale IQ .09 [.01, .17]*
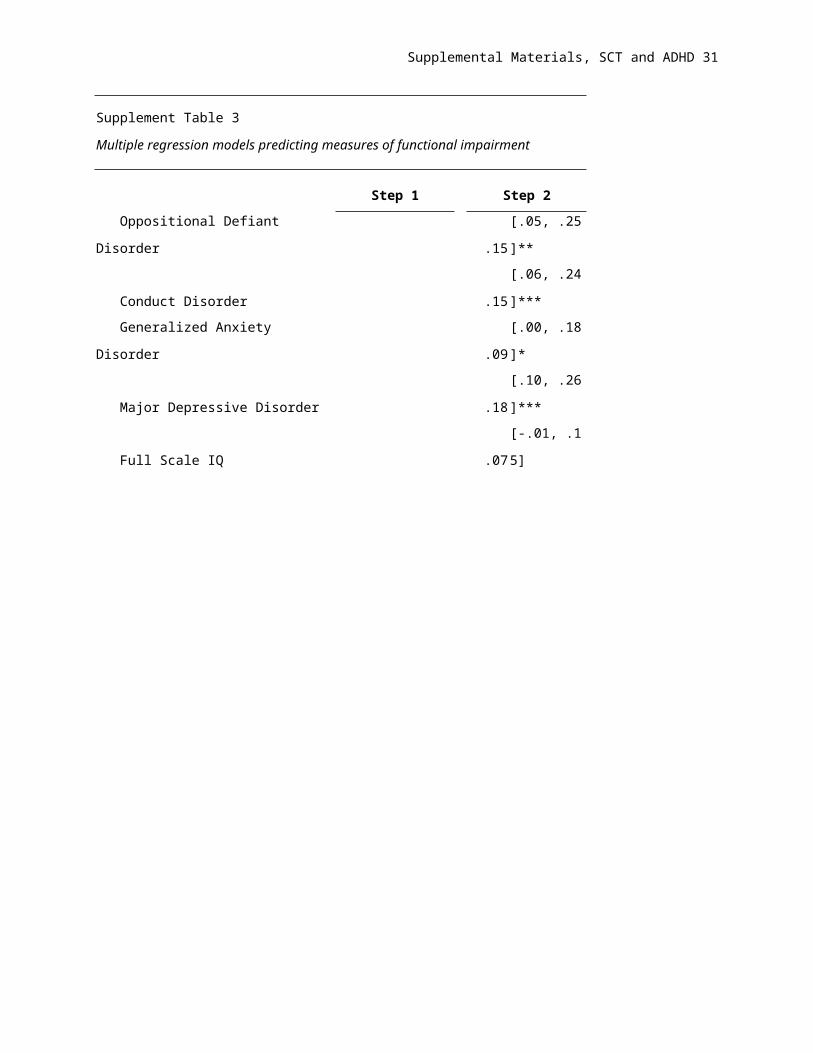
Social Isolation
R2 .174 .274
F 44.9*** 30.1***
Sluggish Cognitive Tempo .29 [.19, .39]*** .22 [.12, .32]***
Inattention .08 [-.06, .22] .04 [-.08, .16]
Hyperactivity-impulsivity .11 [-.01, .22] .03 [-.07, .13]
Oppositional Defiant Disorder .15 [.05, .25]**
Conduct Disorder .15 [.06, .24]***
Generalized Anxiety Disorder .09 [.00, .18]*
Major Depressive Disorder .18 [.10, .26]***
Full Scale IQ .07 [-.01, .15]
Page 23
Supplemental Materials, SCT and ADHD 23
Supplement Table 3
Multiple regression models predicting measures of functional impairment
Step 1 Step 2
Ignored by peersc
R2 .185 .201
F 30.9*** 11.0***
Sluggish Cognitive Tempo .23 [.10, .36]*** .23 [.10, .36]***
Inattention .27 [.12, .42]*** .21 [.05, .37]**
Hyperactivity-impulsivity .03 [-.09, .22] .03 [-.11, .17]
Oppositional Defiant Disorder .14 [.02, .26]*
Conduct Disorder .02 [-.10, .14]
Generalized Anxiety Disorder -.04 [-.14, .06]
Major Depressive Disorder -.02 [-.14, .10]
Full Scale IQ .06 [-.06, .18]
Disliked by peersc
R2 .130 .206
F 20.4*** 11.5***
Sluggish Cognitive Tempo .06 [-.08, .20] .06 [-.08, .20]
Inattention .20 [.05, .35]*** .11 [-.05, .26]
Hyperactivity-impulsivity .21 [.07, .35]*** .11 [-.03, .25]
Oppositional Defiant Disorder .37 [.25, .49]***
Conduct Disorder .08 [-.04, .20]
Generalized Anxiety Disorder -.04 [-.16, .08]
Major Depressive Disorder -.05 [-.17, .07]
Full Scale IQ .10 [-.02, .22]
Page 24
Supplemental Materials, SCT and ADHD 24
Supplement Table 3
Multiple regression models predicting measures of functional impairment
Step 1 Step 2
Academic functioning
Understand assignmentsb
R2 .440 .509
F 114.0*** 54.8***
Sluggish Cognitive Tempo .22 [.12, .32]*** .22 [.12, .32]***
Inattention .45 [.32, .58]*** .49 [.35, .63]***
Hyperactivity-impulsivity .07 [-.03, .17] .05 [-.06, .16]
Oppositional Defiant Disorder .06 [-.04, .16]
Conduct Disorder -.08 [-.17, .01]
Generalized Anxiety Disorder .15 [.05, .25]**
Major Depressive Disorder .26 [.16, .36]***
Full Scale IQ .15 [.05, .25]***
Gradesc
R2 .303 .540
F 67.1*** 31.6***
Sluggish Cognitive Tempo .16 [.04, .30]*** .11 [.00, .22]*
Inattention .48 [.36, .60]*** .30 [.18, .42]***
Hyperactivity-impulsivity .02 [-.09, .13] .02 [-.08, .12]
Oppositional Defiant Disorder -.04 [-.13, .05]
Conduct Disorder .06 [-.03, .15]
Generalized Anxiety Disorder .07 [-.02, .16]
Major Depressive Disorder -.04 [-.12, .04]
Full Scale IQ .57 [.49, .65]***
Page 25
Supplemental Materials, SCT and ADHD 25
Supplement Table 3
Multiple regression models predicting measures of functional impairment
Step 1 Step 2
Academic achievement
Mathb
R2 .212 .614
F 56.2*** 108.5***
Sluggish Cognitive Tempo .19 [.09, .29]*** .08 [.00, .16]*
Inattention .33 [.21, .45]*** .10 [.01, .19]*
Hyperactivity-impulsivity .01 [-.09, .11] .02 [-.03, .07]
Oppositional Defiant Disorder .09 [.02, .16]*
Conduct Disorder .01 [-.07, .09]
Generalized Anxiety Disorder .04 [-.03, .11]
Major Depressive Disorder .01 [-.06, .08]
Full Scale IQ .71 [.65, .78]***
Single word readingb
R2 .205 .438
F 60.4*** 60.3***
Sluggish Cognitive Tempo .16 [.07, .25]*** .09 [.00, .18]*
Inattention .33 [.21, .45]*** .14 [.03, .25]**
Hyperactivity-impulsivity -.03 [-.12, .06] .01 [-.07, .09]
Oppositional Defiant Disorder .01 [-.07, .09]
Conduct Disorder .06 [-.01, .13]
Generalized Anxiety Disorder .02 [-.04, .08]
Major Depressive Disorder .04 [-.04, .12]
Full Scale IQ .55 [.49, .61]***
Page 26
Supplemental Materials, SCT and ADHD 26
Supplement Table 3
Multiple regression models predicting measures of functional impairment
Step 1 Step 2
Reading Comprehensiond
R2 .182 .569
F 39.4*** 60.1***
Sluggish Cognitive Tempo .16 [.04, .28]**c .04 [-.08, .16]
Inattention .26 [.12, .40]** .13 [.01, .24]*
Hyperactivity-impulsivity .08 [-.04, .20] .00 [-.10, .10]
Oppositional Defiant Disorder .01 [-.09, .11]
Conduct Disorder .06 [-.04, .16]
Generalized Anxiety Disorder .11 [.03, .19]**
Major Depressive Disorder .12 [.02, .22]*
Full Scale IQ .72 [.64, .80]***
Written Languagee
R2 .236 .370
F 12.6*** 6.2***
Sluggish Cognitive Tempo .28 [.09, .47]*** .22 [.01, .43]*
Inattention .21 [-.02, .44] .02 [-.24, .48]
Hyperactivity-impulsivity .20 [-.02, .42] .17 [-.05, .39]
Oppositional Defiant Disorder .15 [-.15, .45]
Conduct Disorder .08 [-.16, .32]
Generalized Anxiety Disorder -.13 [-.35, .13]
Major Depressive Disorder .19 [-.05, .43]
Full Scale IQ .45 [.26, .64]***
Note: CLDQ = Colorado Learning Difficulties Questionnaire. All measures are
scaled so that a positive B indicates greater impairment. aN = 545. bN = 716. cN =
595. dn = 510. e186
* = P < .05, ** = P < .01, *** = P < .001
Page 27
Supplemental Materials, SCT and ADHD 27
Supplement Table 4
Multiple regression models predicting measures of neuropsychological
functioning
Step 1 Step 2
Processing Speed
R2 .259 .457
F 82.3*** 65.9***
Sluggish Cognitive Tempo .15 [.07, .23]** .08 [.00, .16]*
Inattention .38 [.27, .49]*** .21 [.11, .31]***
Hyperactivity-impulsivity .04 [-.04, .12] .04 [-.04, .12]
Oppositional Defiant Disorder .04 [-.04, .12]
Conduct Disorder -.04 [-.12, .01]
Generalized Anxiety Disorder .03 [-.04, .11]
Major Depressive Disorder .08 [.00, .15]*
Full Scale IQ .51 [.45, .57]***
Naming Speed
R2 .171 .267
F 47.9*** 27.4***
Sluggish Cognitive Tempo .16 [.08, .24]*** .11 [.02, .20]*
Inattention .29 [.17, .41]*** .20 [.08, .32]**
Hyperactivity-impulsivity -.03 [-.12, .06] .02 [-.08, .12]
Oppositional Defiant Disorder .05 [-.03, .13]
Conduct Disorder .02 [-.06, .10]
Generalized Anxiety Disorder .02 [-.06, .10]
Major Depressive Disorder .13 [.05, .21]**
Full Scale IQ .33 [.25, .41]***
Page 28
Supplemental Materials, SCT and ADHD 28
Supplement Table 4
Multiple regression models predicting measures of neuropsychological
functioning
Step 1 Step 2
Sustained attention
R2 .112 .224
F 26.4*** 23.2***
Sluggish Cognitive Tempo .20 [.10, .30]*** .11 [.01, .21]*
Inattention .16 [.04, .28]* .06 [-.04, .16]
Hyperactivity-impulsivity .02 [-.08, .11] .06 [-.04, .16]
Oppositional Defiant Disorder -.08 [-.17, .01]
Conduct Disorder .02 [-.06, .10]
Generalized Anxiety Disorder .04 [-.04, .12]
Major Depressive Disorder .10 [.02, .18]*
Full Scale IQ .38 [.30, .46]***
Inhibition
R2 .163 .224
F 42.1*** 24.6***
Sluggish Cognitive Tempo .10 [-.01, .21] .05 [-.05, .15]
Inattention .27 [.14, .41]*** .19 [.07, .31]**
Hyperactivity-impulsivity .13 [.03, .23]* .13 [.03, .23]*
Oppositional Defiant Disorder .00 [-.10, .10]
Conduct Disorder -.03 [-.12, .04]
Generalized Anxiety Disorder .05 [-.03, .13]
Major Depressive Disorder .02 [-.08, .12]
Full Scale IQ .28 [.20, .36]***
Page 29
Supplemental Materials, SCT and ADHD 29
Supplement Table 4
Multiple regression models predicting measures of neuropsychological
functioning
Step 1 Step 2
Working Memory
R2 .126 .249
F 29.6*** 26.6***
Sluggish Cognitive Tempo .09 [-.01, .19] .02 [-.08, .12]
Inattention .24 [.12, .36]*** .11 [.00, .22]*
Hyperactivity-impulsivity .03 [-.06, .12] .02 [-.08, .12]
Oppositional Defiant Disorder .00 [-.08, .08]
Conduct Disorder .01 [-.07, .09]
Generalized Anxiety Disorder .06 [-.14, .02]
Major Depressive Disorder .01 [-.09, .11]
Full Scale IQ .42 [.34, .50]***
Response Variability
R2 .141 .216
F 32.9*** 11.0***
Sluggish Cognitive Tempo .10 [.00, .20] .04 [-.06, .14]
Inattention .29 [.15, .43]*** .19 [.05, .33]**
Hyperactivity-impulsivity .05 [-.05, .15] .00 [-.05, .15]
Oppositional Defiant Disorder .03 [-.07, .13]
Conduct Disorder .10 [.02, .18]*
Generalized Anxiety Disorder .03 [-.05, .11]
Major Depressive Disorder .01 [-.09, .11]
Full Scale IQ .29 [.21, .37]***
Note: Note: N = 716. All measures are scaled so that a positive B
indicates greater impairment.
* = p < .05, ** = P < .01, *** = P < .001
Page 30
Supplemental Materials, SCT and ADHD 30
Section 3:References for Supplemental Materials
Achenbach, T. M., & Rescorla, L. A. (2001). Manual for ASEBA School-age Forms and Profiles.
Burlington, VT: University of Vermont Research Center for Children, Youth, and Families.
Case, R., Kurland, M., & Goldberg, J. (1982). Operational efficiency and the growth of short-term memory
span. Journal of Experimental Child Psychology, 33, 386-404.
Chhabildas, N., Pennington, B. F., & Willcutt, E. G. (2001). A comparison of the neuropsychological
profiles of the DSM-IV subtypes of ADHD. Journal of Abnormal Child Psychology, 29, 529-540.
Daneman, M., & Carpenter, P. A. (1980). Individual differences in working memory and reading. Journal
of Verbal Learning and Verbal Behavior, 19, 450-466.
DeFries, J. C., Singer, S. M., Foch, T. T., & Lewitter, F. I. (1978). Familial nature of reading disability.
British Journal of Psychiatry, 132, 361-367.
Denckla, M. B., & Rudel, R. G. (1976). Rapid "automatized" naming (R.A.N): dyslexia differentiated from
other learning disabilities. Neuropsychologia, 14, 471-479.
Dishion, T. (1990). The peer context of troublesome child and adolescent behavior. In P. E. Leone (Ed.),
Understanding troubled and troubling youth (pp. 128-153). Newbury Park, CA: Sage.
Dunn, L. M., & Markwardt, F. C. (1970). Examiner's Manual: Peabody Individual Achievement Test. Circle
Pines, MN: American Guidance Service.
French, J. W., Ekstrom, R. G., & Price, L. A. (1963). Manual for a kit of reference tests for cognitive
factors. Princeton, NJ: Educational Testing Service.
Gordon, M. (1983). The Gordon Diagnostic System. DeWitt, NY: Gordon Systems.
Graham, S., Berninger, V., Weintraub, N., & Schafer, W. (1998). The development of handwriting fluency
and legibility in grades 1 through 9. Journal of Educational Research, 92, 42-52.
Jastak, S., & Wilkinson, G. S. (1984). Wide Range Achievement Test, Revised: Administration Manual.
Wilmington, DE.
Kuntsi, J., Stevenson, J., Oosterlaan, J., & Sonuga-Barke, E. J. S. (2001). Test-retest reliability of a new
delay aversion task and executive function measures. British Journal of Developmental
Psychology, 19, 339-348.
Leslie, L., & Caldwell, J. S. (2001). Qualitative Reading Inventory, Third Edition. New York: Addison
Wesley Longman, Inc.
Logan, G. D., Schachar, R. J., & Tannock, R. (1997). Impulsivity and inhibitory control. Psychological
Science, 8, 60-64.
McGrath, L. M., Pennington, B. F., Shanahan, M. A., Santerre-Lemmon, L. E., Barnard, H. D., Willcutt, E.
G., . . . Olson, R. K. (2011). A multiple deficit model of reading disability and
attention-deficit/hyperactivity disorder: Searching for shared cognitive deficits. Journal of Child
Psychology and Psychiatry, 52, 547-557.
Page 31
Supplemental Materials, SCT and ADHD 31
McGrew, K. S., & Woodcock, R. W. (2001). Technical Manual: Woodcock-Johnson III. Itasca,IL: Riverside
Publishing.
Monroe, M., & Sherman, E. E. (1966). Group Diagnostic Reading Aptitude and Achievement Test:
Intermediate Form: C.H. Nevins.
Reich, W., Welner, Z., & Herjanic, B. (1997). Diagnostic Interview for Children and Adolescents - IV. North
Towanda Falls, NY: Multi-Health System, Inc.
Rucklidge, J. J., & Tannock, R. (2002). Neuropsychological profiles of adolescents with ADHD: effects of
reading difficulties and gender. Journal of Child Psychology and Psychiatry, 43, 988-1003.
Schachar, R., Mota, V. L., Logan, G. D., Tannock, R., & Klim, P. (2000). Confirmation of an inhibitory
control deficit in attention-deficit/hyperactivity disorder. Journal of Abnormal Child Psychology, 28,
227-235.
Setterberg, S., Bird, H., & Gould, M. (1992). Parent and Interviewer version of the Children's Global
Assessment Scale. New York: Columbia University.
Shanahan, M. A., Pennington, B. F., Yerys, B. E., Scott, A., Boada, R., Willcutt, E. G., . . . DeFries, J. C.
(2006). Processing speed deficits in attention deficit/hyperactivity disorder and reading disability.
Journal of Abnormal Child Psychology, 34, 585-602.
Siegel, L. S., & Ryan, E. B. (1989). The development of working memory in normally achieving and
subtypes of learning disabled children. Child Development, 60, 973-980.
Torgesen, J., Wagner, R., & Rashotte, C. A. (1999). A Test of Word Reading Efficiency (TOWRE).
Austin,TX: Pro-Ed.
Wechsler, D. (1974). Manual for the Wechsler Intelligence Scale for Children, Revised. New York, NY:
The Psychological Corporation.
Wechsler, D. (1991). Manual for the Wechsler Intelligence Scale for Children, Third Edition. San
Antonio,TX: The Psychological Corporation.
Wiederhold, J. L., & Bryant, B. R. (1993). Gray Oral Reading Test - Third Edition. Austin, TX: Pro-Ed.
Willcutt, E. G., Betjemann, R. S., McGrath, L. M., Chhabildas, N. A., Olson, R. K., DeFries, J. C., &
Pennington, B. F. (2010). Etiology and neuropsychology of comorbidity between RD and ADHD:
The case for multiple-deficit models. Cortex, 46, 1345-1361.
Willcutt, E. G., Boada, R., Riddle, M. W., Chhabildas, N., DeFries, J. C., & Pennington, B. F. (2011).
Colorado Learning Difficulties Questionnaire: Validation of a parent-report screening measure.
Psychological Assessment, 23, 778-791.
Willcutt, E. G., Pennington, B. F., Olson, R. K., Chhabildas, N., & Hulslander, J. (2005).
Neuropsychological analyses of comorbidity between reading disability and attention deficit
hyperactivity disorder: In search of the common deficit. Developmental Neuropsychology, 27, 35-
78.


![link.springer.com10.1007/s10853... · Web viewThe synthesis of compound 4-((4'-hydroxyphenylazo)phenyl)acetamide was prepared according to our previous report [15]. 4-Aminophenylacetamide](https://static.documents.pub/doc/80x56/5aba51687f8b9ad1768b5f3d/link-101007s10853web-viewthe-synthesis-of-compound-4-4-hydroxyphenylazophenylacetamide.jpg)