Link Positions Matter: A NoncommutativeRouting Metric for Wireless Mesh Networks
Gentian Jakllari†, Stephan Eidenbenz∗, Nicolas Hengartner∗, Srikanth V. Krishnamurthy‡, MichalisFaloutsos‡
†Raytheon BBN Technologies, ‡University of California, Riverside, ∗Los Alamos National LaboratoryEmail: [email protected], {eidenben,nickh}@lanl.gov, {krish,michalis}@cs.ucr.edu
�
Abstract—We revisit the problem of computing the path with the min-imum cost in terms of the expected number of link layer transmissions(including retransmissions) in wireless mesh networks. Unlike previousefforts, such as the popular ETX, we account for the fact that MACprotocols (including the IEEE 802.11 MAC) incorporate a finite numberof transmission attempts per packet. This in turn leads to our keyobservation: the performance of a path depends not only on the numberof the links on the path and the quality of its links, but also, on therelative positions of the links on the path. Based on this observation,we propose ETOP, a path metric that accurately captures the expectednumber of link layer transmissions required for reliable end-to-endpacket delivery. We analytically compute ETOP, which is not trivial, sinceETOP is a noncommutative function of the link success probabilities.Although ETOP is a more involved metric, we show that the problemof computing paths with the minimum ETOP cost can be solved by agreedy algorithm. We implement and evaluate a routing approach basedon ETOP on a 25-node indoor mesh network. Our experiments showthat the path selection with ETOP consistently results in superior TCPgoodput (by over 50% in many cases) compared to path selection basedon ETX. We also perform an in-depth analysis of the measurements tobetter understand why the paths selected by ETOP improve the TCPperformance.
Index Terms—Wireless Networks, Routing Metrics, IEEE 802.11Testbeds.
1 Introduction
REDUCING the number of link layer retransmissions in
a wireless mesh networks is critical for ensuring high
overall throughput. This can be achieved by selecting routes
with inherently reliable links. This has a two-fold effect. First,
the throughput of the flows using these paths is higher. Second,
the throughput of the network as a whole increases, since the
fewer transmissions lead to lower network-wide contention.
In this paper, we revisit the problem of computing the path
with the minimum cost in terms of the expected number of
link layer transmissions in mesh networks. Note that when
we discuss the path cost, the term transmissions includes also
retransmissions of packets. The distinguishing aspect of our
work is that we account for a limited number of retransmis-
sions at the link layer in contrast to most previous studies.
Specifically, recent efforts that have considered the problem
An earlier version of this paper appeared in IEEE INFOCOM 2008 [16]
[10], [6], [11], [13], make an implicit or explicit assumption
that there are either an infinite number of retransmission or no
retransmission attempts per packet at the link layer. However,
in practice, such as in IEEE 802.11 networks, there are a
bounded number of retransmission attempts at the link layer.
In these networks, routing strategies that are developed with
the previous metrics may result in paths which would incur
a higher than optimal number of expected retransmissions at
the link layer.
The key observation that motivates this work is that the
cost of a path when the link layer offers limited reliability
depends not only on the number of links on the path and the
quality of these links, but also on the relative positions of the
links on the path. In more detail, one has to account for the
possibility that a packet may be dropped at the link layer given
the bounded number of retransmissions at that layer. With a
reliable transport protocol, such a dropped packet will have to
be retransmitted from the source. Thus, a packet drop close to
the destination is expensive, since it induces retransmissions
(in the subsequent transport layer retransmission attempt) on
links that were successfully traversed prior to the drop.
0.1
0.1
11
11
1
S
X
A
Y
CB
R
Fig. 1. The effect of the link positions on the performanceof a path.
We illustrate this issue with the toy example in Figure 1.
There are two paths from the source S to the destination R; the
number next to each link depicts the probability of a successful
transmission (denoted as link success probability) across that
link. At first glance, it may seem that it is better to use the
path [S, X, Y, R] instead of [S, A, B, C, R]. In fact, previous
strategies such as [10], will choose that path. However, the
path [S, A, B, C, R] is better than [S, X, Y, R]. If the link
layer performs at most two transmissions per packet (i.e., only
one retransmission is allowed), it is easy to compute that the
IEEE TRANSACTIONS ON MOBILE COMPUTINGThis article has been accepted for publication in a future issue of this journal, but has not been fully edited. Content may change prior to final publication.
2
expected total number of link layer transmissions per packet
is approximately 13 for the path [S, A, B, C, R], while it is
approximately 20 for the path [S, X, Y, R]. The higher cost
is due to the bad link that is closer to the destination, in the
path [S, X, Y, R].
Based on the aforementioned observation, we propose a
path metric, which accurately captures the expected number
of link layer transmissions assuming a finite number of re-
transmissions at this layer. We call our metric the Expected
number of Transmissions On a Path or ETOP for short. ETOP
considers the relative position of the links and thus, it is
a noncommutative function of the link success probabilities
unlike the previously proposed metrics. Our contributions can
be summarized as follows:
(i) We derive a closed form expression to compute the ETOP
cost of a path. Note that this derivation is non-trivial; the ETOP
cost cannot be computed as a simple sum of link level metrics,
because of the finite number of retransmissions at the link
layer.
(ii) We prove that, despite its more involved calculation,
ETOP satisfies: (a) the greedy-choice property, and (b) the
optimal sub-structure property. Thus, computing the paths of
minimum ETOP cost can be achieved with a greedy approach
[9], and we develop an algorithm to that effect.
(iii) We develop and implement ETOP-R, an ETOP-based
routing protocol. We evaluate its performance on an indoor
wireless mesh network consisting of 25 nodes and compare it
with that of ETX-based routing [10]. We observe that ETOP-R
computes paths that yield higher TCP goodput (by over 50%
in many cases) compared to ETX-based routing. ETOP-R also
reduces UDP datagram losses significantly.
(iv) We perform an analysis of the results at a microscopic
level. With ETOP-R, we observe a reduced number of link
layer transmissions and packet drops, and a higher TCP
congestion window size (by as much as 300%).
We wish to point out here that lossy links are fairly common
in wireless mesh networks. This has been observed in prior
work [10], [14] and we observe that losses due to failed MAC
layer retransmissions are common in our indoor network. Note
that we cannot simply blacklist and preclude the use of lossy
links; the link quality fluctuates in time. Furthermore, some
lossy links may be on exclusive paths to certain destinations.
The rest of the paper is organized as follows. In section 2,
we discuss related work. In section 3, we analytically compute
ETOP. In section 4, we show that the problem of minimizing
the ETOP cost can be solved with a greedy algorithm. In
section 5, we describe the implementation of ETOP-R. In
section 6, we present our experimental results. Our conclusions
form Section 7.
2 Related Work and BackgroundMany measurement studies [5], [26], [14], [23], [8], [21] have
shown that links experience losses in wireless networks.
ETX: In [10], the authors design a link metric called ETX
(for expected transmission count), which is equal to the inverse
of a link’s reliability. The end-to-end cost of a path is the sumof the ETX values of the links on the path; the routing layer
simply computes routes that minimize this cost. A mecha-
nism for estimating the link reliabilities, based on dedicated
broadcast packets, was also proposed. Experiments on a 29-
node 802.11 testbed showed that ETX-based routing results
in better end-to-end throughput as compared to minimum-hop
routing [10].Other Related Efforts: The efforts in [13], [24], [25], [19],
[6], [7] have used the inverse of the link reliability (ETX) in
combination with other parameters (such as the link bandwidth
[13]) for improving routing performance in multihop wireless
networks. In [13], Draves et al. propose a new routing metric,
WCETT, that considers the link bandwidth and interference in
addition to the (inverse of) the link reliability. Koksal et al.
[7] propose mETX and ENT that extend ETX to account for
highly variable link reliabilities. In [6], the authors use a metric
similar to ETX for finding minimum energy paths. In a follow
up effort [11], the authors introduce two more models. In the
first model the link layer performs no retransmissions and
all the reliability is handled end-to-end. In the second model,
referred to as the mixed model, the link layer either performs
no retransmissions, and the reliability is handled end-to-end, or
it performs an unbounded number of retransmissions. For both
the models the authors design optimal algorithms. However,
the case in which the link layer offers a finite number of
retransmissions is not considered. In [24], the product of ETX
with the distance traversed towards the destination, is used
for energy-efficient geographic routing. In [25] the authors
use an ETX like metric for routing in sensor networks. In
[22], a similar model is used for energy efficient routing. In
this work, routing is jointly considered with power control,
and in addition to the unicast case, the multicast case is
also considered. In [27], [19], based on measurements, the
authors argue that using broadcast packets to estimate the
link reliability for data packets could lead to inaccuracies.
Therefore, both efforts propose algorithms for data-driven link
reliability estimation.We wish to stress that, the inverse of the link reliability
estimates the expected number of transmissions (including
retransmissions), E, needed to send a packet across a link,
with the implicit assumption that an infinite number of re-
transmissions is allowed on the link. Therefore, the link layer
never drops a packet. To elucidate this, let p be the probability
of a successful transmission across a link. Assuming that
the outcomes of the transmission attempts on the link are
independent and identically distributed, E can be computed
as:
E =∞X
j=1
j(1 − p)jp =1
p(1)
Since the link layer never drops a packet, there is never a
need for a transport layer retransmission. This simplifies the
calculation of the retransmissions needed for reliable packet
delivery over a path; the number of retransmissions depends
only on the link quality and not on their positions, i.e., the
calculation is commutative.In practice, however, there are a bounded number of link
layer transmission attempts (as with 802.11) per packet and
a reliable transport protocol will need to perform an end-to-
end retransmission to cope with link layer packet drops. In
IEEE TRANSACTIONS ON MOBILE COMPUTINGThis article has been accepted for publication in a future issue of this journal, but has not been fully edited. Content may change prior to final publication.
3
this case, as discussed with our toy example in Figure 1, the
relative position of the links on a path becomes important
when computing the cost of a path.
3 Computing ETOPIn this section, we present an analytical model for computing
the ETOP cost of a path. In our model, unlike previous efforts,
we account for the bounded number of retransmission attempts
at the link layer (leading to possible packet drops at this layer).
We then assume that a transport layer protocol (such as TCP)
until the packet is finally delivered to the destination.
We make the following assumptions.
a. The probability of a successful transmission on a link
does not change between retransmission attempts. In other
words, the outcomes of link layer transmission attempts are
independent and identically distributed (IID)1.
b. Implicitly, we assume that the power and bit-rate used
for each transmission by a node does not change. If nodes are
allowed to change their transmission properties, the probability
of success will vary.
Network representation and notation: We model the
wireless network as a directed graph G(V, E, w), where V is
the set of nodes and E the links. Every link i ∈ E is assigned
a weight 0 < pi ≤ 1, which represents the packet delivery
probability over that link with a single transmission attempt.
Consider the problem of sending a packet from a source
node v0, to a destination node vn, along a n-link path via nodes
v1, v2 . . . vn. The source, node v0, initiates an e2e attempt.
First, the packet is passed on to the link layer, which will
transmit it to node v1. If successfully received by node v1, it
will then be transmitted to node v2, and so forth, until the
packet reaches node vn. There is a probability 0 < pi ≤ 1, i =
1, . . . , n that the packet, when transmitted by node vi−1, will
reach node vi. If the packet transmitted by node vi−1 does
not reach node vi, it is transmitted again by the link layer
of node vi−1. Up to K transmission attempts (including the
initial attempt) are made, and the packet is dropped if the Kth
transmission fails to reach node vi. The drop is reported to the
transport layer of node v0. In response, the transport layer of v0
initiates a new e2e attempt for the same packet. For every e2e
attempt, there is a cost: the number of link level transmissions
during this attempt. Let Tn be a random variable that represents
the sum of the costs of all the e2e attempts made in order for
a packet to be delivered from node v0 to node vn. Our goalis to compute the expected value of Tn, the ETOP cost of thepath, as a function of link weights, pi, and the bound on thenumber of link level transmissions, K.
Let Yn denote the random variable representing the number
of e2e attempts required in order for the packet to be delivered
to the destination on the n-hop path. Let M� denote the number
of consecutive hops that are successfully traversed along the
path, beginning at node v0, in the �th e2e attempt. Thus,
1. This assumption is made to keep the computation tractable; a similarassumption is made in almost all related work (for example, in [10], [12]).Our experimentations on a real mesh network show that there are benefitswith our approach in spite of this assumption.
v0 v1 v2 v3 v4
Sourcep1 p2
p3 p4
H1,2=K
v0 v1 v2 v3 v4
Sourcep1 p2 p3
p4Destination
Destination
First e2e attempt (l =1) failed after crossing two links -> M1=2Second e2e attempt (l =2) succeeded -> M2=4There were two e2e attempts on a 4 links path -> Y4=2
l =1
l =2
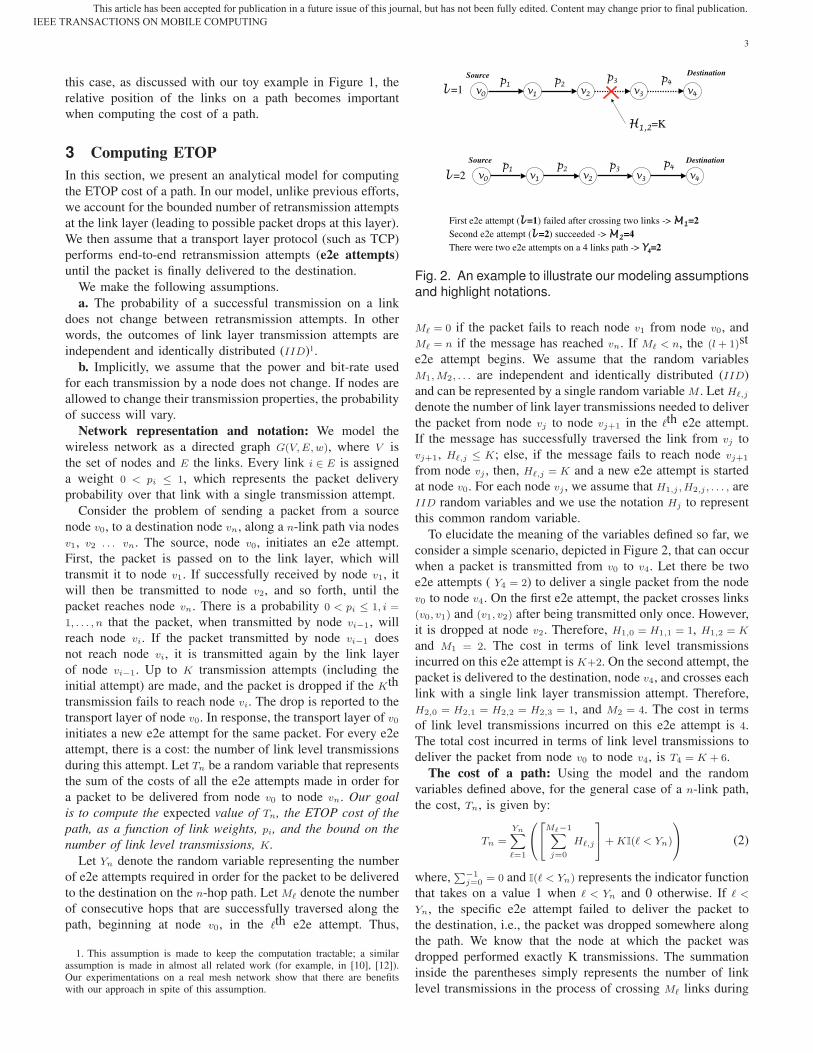
Fig. 2. An example to illustrate our modeling assumptionsand highlight notations.
M� = 0 if the packet fails to reach node v1 from node v0, and
M� = n if the message has reached vn. If M� < n, the (l + 1)st
e2e attempt begins. We assume that the random variables
M1, M2, . . . are independent and identically distributed (IID)
and can be represented by a single random variable M . Let H�,j
denote the number of link layer transmissions needed to deliver
the packet from node vj to node vj+1 in the �th e2e attempt.
If the message has successfully traversed the link from vj to
vj+1, H�,j ≤ K; else, if the message fails to reach node vj+1
from node vj , then, H�,j = K and a new e2e attempt is started
at node v0. For each node vj , we assume that H1,j , H2,j , . . . , are
IID random variables and we use the notation Hj to represent
this common random variable.
To elucidate the meaning of the variables defined so far, we
consider a simple scenario, depicted in Figure 2, that can occur
when a packet is transmitted from v0 to v4. Let there be two
e2e attempts ( Y4 = 2) to deliver a single packet from the node
v0 to node v4. On the first e2e attempt, the packet crosses links
(v0, v1) and (v1, v2) after being transmitted only once. However,
it is dropped at node v2. Therefore, H1,0 = H1,1 = 1, H1,2 = K
and M1 = 2. The cost in terms of link level transmissions
incurred on this e2e attempt is K+2. On the second attempt, the
packet is delivered to the destination, node v4, and crosses each
link with a single link layer transmission attempt. Therefore,
H2,0 = H2,1 = H2,2 = H2,3 = 1, and M2 = 4. The cost in terms
of link level transmissions incurred on this e2e attempt is 4.
The total cost incurred in terms of link level transmissions to
deliver the packet from node v0 to node v4, is T4 = K + 6.
The cost of a path: Using the model and the random
variables defined above, for the general case of a n-link path,
the cost, Tn, is given by:
Tn =
YnX�=1
0@24M�−1X
j=0
H�,j
35+ KI(� < Yn)
1A (2)
where,P−1
j=0 = 0 and I(� < Yn) represents the indicator function
that takes on a value 1 when � < Yn and 0 otherwise. If � <
Yn, the specific e2e attempt failed to deliver the packet to
the destination, i.e., the packet was dropped somewhere along
the path. We know that the node at which the packet was
dropped performed exactly K transmissions. The summation
inside the parentheses simply represents the number of link
level transmissions in the process of crossing M� links during
IEEE TRANSACTIONS ON MOBILE COMPUTINGThis article has been accepted for publication in a future issue of this journal, but has not been fully edited. Content may change prior to final publication.
4
the �th e2e attempt .
Theorem 1. The expected number of transmissions for deliv-ering a packet over a path (v0, . . . vn), ETOP, is:
E[Tn] =
0@K +
n−2Xj=0
(E[Hj |Hj ≤ K] P[M > j|M < n])
1A
× E[Yn − 1] +
n−1Xj=0
E[Hj |Hj ≤ K]. (3)
Proof: To prove the claim, we first condition on Yn, thenumber of e2e attempts. Then,
E[Tn] = EYn [E[Tn|Yn]]
= EYn
24
YnX�=1
E
24
M�−1Xj=0
H�,j
˛̨˛̨˛̨ Yn
35
35 + KE
24
YnX�=1
I(� < Yn)
35
= EYn
24
YnX�=1
n−2Xj=0
E [ I(M� > j)H�,j |Yn]
35 + KE[(Yn − 1)]
The conditional expectation within the summation can be
written as (by further conditioning on M�):
EˆI(M� > j)H�,j
˛̨Yn˜
= EM�|Yn
ˆI(M� > j)E[H�,j |Yn, M�]
˛̨Yn˜.
Let us consider the case where a link j is successfully
traversed during the e2e attempt l, i.e., j < M� and � ≤ Yn.
In this case the number of attempts on link j can be at most
K, i.e., H�,j ≤ K (Note that if there is a failure on a link j,
Summing the latter over j ∈ {0, 1, . . . , n − 1} and � ≤ Yn and
using the fact that M� are independent copies of M and H�,j
are independent copies of Hj , we get
E[Tn] = E[(Yn − 1)]
n−2Xj=0
(E[Hj |Hj ≤ K] P[M > j|M < n])
+
n−1Xj=0
E[Hj |Hj ≤ K] + KE[(Yn − 1)].
which is the claimed result.
Next, we transform Equation (3) so that it can be expressed
in terms of the link weights {pi, i = 1, ...n}, the bound on the
number of link layer transmissions, K, and the length of the
path, n.
Let πi, i = 1, .., n be the probability that the packet is
not dropped on the link (vi−1, vi). Given our assumptions,
and since there will be at most K link layer transmissions,
πi = 1 − (1 − pi)K . For i = 1, . . . define ρi = π1 × · · · × πi. The
tail probability of M is P[M > i] = π1 × π2 × · · · × πi+1 = ρi+1.
Yn has a geometric distribution with parameter P[M ≥ n] =
π1π2 × · · · × πn = ρn; this is because Yn = � implies that there
are � − 1 e2e attempts that fail, followed by the e2e attempt
that succeeds . It follows that
P[M > i|M < n] =P[i < M < n]
P[M < n]=
P[M > i] − P[M ≥ n]
1 − P[M ≥ n]
=ρi+1 − ρn
1 − ρn. (5)
Corollary 1. The expected cost of delivering a packet over apath (v0, . . . vn), the ETOP cost of the path, can be expressedsimply in terms of the link weights {pi, i = 1, ...n}, the boundon the number of link layer transmissions, K, and the lengthof the path, n, as:
E[Tn] =
n−2Xi=0
„Ei
ρi+1
ρn
«+ K
1 − ρn
ρn+ En−1. (6)
where ρi = π1 × · · · × πi and Ei = E[Hi|Hi ≤ K]
Proof: Using Equation (5) and the newly defined vari-
ables, Equation (3) reduces to :
E[Tn] =
„1
ρn− 1
« K +
n−2Xi=0
Eiρi+1 − ρn
1 − ρn
!+
n−1Xi=0
Ei
=
n−2Xi=0
Ei
„ρi+1 − ρn
ρn+ 1
«+ K
1 − ρn
ρn+ En−1
=
n−2Xi=0
„Ei
ρi+1
ρn
«+ K
1 − ρn
ρn+ En−1.
We show that Ei = E[Hi|Hi ≤ K], the expected number of
transmission from node vi−1 to vi can be computed simply as
function of pi and K in Lemma 1.
Lemma 1. The expected number of transmissions on a linki ∈ E with weight p, for delivering a packet to the receiver,given that the number of attempts is bounded by a constant K
is:
E[Hi|Hi ≤ K] =KX
j=1
j(1 − p)j−1p
1 − (1 − p)K+1
Proof: E[Hi|Hi ≤ K] =PK
j=1 jP (Hi = j|Hi ≤ K) where,
P (Hi = j|Hi ≤ K]) =P (Hi = j ∩ Hi ≤ K)
P (Hi ≤ K)
=P (Hi = j)
1 − P (Hi > K)=
(1 − p)j−1p
1 − (1 − p)K+1
Lemma 2. The ETOP metric is a noncommutative function ofthe link success probabilities.
Proof: Assume to the contrary that ETOP is a commu-
tative function of the link success probabilities. If this is the
case, the cost assigned by ETOP to the paths with link success
probabilities (1,1,0.2) and (0.2,1,1) should be the same. Using
Equation (6) and setting K = 3, the ETOP costs for the
two paths are 7 and 8.54, respectively . This contradicts our
assumption and thus, ETOP is noncommutative.
Note that Equation (6) defines the ETOP metric. For every
n, Equation (6) maps a n-link path to its ETOP cost. This
IEEE TRANSACTIONS ON MOBILE COMPUTINGThis article has been accepted for publication in a future issue of this journal, but has not been fully edited. Content may change prior to final publication.
5
mapping is not a simple sum of the link metrics, and is
noncommutative. In Section 4, we design a simple greedy
algorithms that can find minimum ETOP cost paths from a
node to all the other nodes in the network.
4 Our Greedy Routing ApproachIn this section, we first show that the problem of finding
the path with the minimum ETOP cost between two nodes
(minimum ETOP cost problem) can be solved by a greedy
approach. Then, we present one such greedy algorithm.
Theorem 2. The minimum ETOP cost problem can be opti-mally solved by a greedy algorithm.
Proof: An optimization problem can be solved by a
greedy algorithm, if two properties hold [9]: the greedy choice
property, and the optimal sub-structure property. Thus, the
proof is immediate from Lemmas 3 and 4.
Lemma 3. The minimum ETOP cost problem satisfies thegreedy-choice property.
Proof: It suffices to show that the cost of a path Xn+1 =
[v0, ..., vn+1] can be computed by: (a) the cost of the sub-path
Xn =[v0, ..., vn] and, (b) the weight of link (vn, vn+1).
Let E[Tn] and E[Tn+1] be the cost of the above paths Xn and
Xn+1, respectively. We begin by using Equation (6) for Xn+1,
and then, we express E[Tn+1] in terms of E[Tn] as follows:
E[Tn+1] =
n−1Xi=0
„Ei
ρi+1
ρn+1
«+ K
1 − ρn+1
ρn+1+ En
=1
πn+1
n−2Xi=0
„Ei
ρi+1
ρn
«+ En−1
1
πn+1+ K
1 − ρn
ρn
1
πn+1
− K1 − ρn
ρn
1
πn+1+ K
(1 − ρnπn+1)
ρnπn+1+ En
=1
πn+1
"n−2Xi=0
„Ei
ρi+1
ρn
«+ K
1 − ρn
ρn+ En−1
#
+K(ρn − ρnπn+1)
ρnπn+1+ En
=1
πn+1E[Tn] + K
1 − πn+1
πn+1+ En (7)
Recall that πn+1 = 1−(1−pn+1)K is the probability of no drop
on the link (vn, vn+1), pn+1 is the weight of the link (vn, vn+1),
K is the bound on the number of retransmissions, and En is
the expected number of transmissions on that link.
Equation (7) shows that the cost of Xn+1 can be calculated
by the cost of Xn and the weight of link (vn, vn+1), and this
concludes the proof.
Lemma 4. The minimum ETOP cost problem satisfies theoptimal sub-structure property, that is, the sub-path of anoptimal path is itself an optimal path.
Proof: We prove the lemma by contradiction. Let us
assume that the “minimum cost path” is Xm = [v0, ..., vm]
and assume that there exists at least one node such that the
sub-structure property does not hold. Then, we can find a node
vn−1 such that: Xn−1 = [v0, ..., vn−1] in not optimal, while Xn
= [v0, ..., vn] is optimal.
Using Equation (7), the cost of path Xn is given below:
E[Tn] =1
πnE[Tn−1] + K
1 − πn
πn+ En−1 (8)
where, E[Tn−1] is the cost of the path Xn−1.
Since we assumed that the sub-structure property does not
hold for path Xn−1, there exists a path X′n−1 from vo to vn−1,
with cost:
E[T′n−1] < E[Tn−1]. (9)
Consequently, using path X′n−1, we can define another path
X′n from v0 to vn with cost:
E[T′n] =
1
πnE[T
′n−1] + K
1 − πn
πn+ En−1 (10)
The terms 1πn
, K 1−πnπn
and En−1 are all positive. Thus,
combining Equations (8), and (10) with Inequality (9), we
conclude that: E[T′n] < E[Tn]. However, this contradicts the
assumption that E[Tn] is the minimum cost from v0 to vn.
4.1 The ETOP-based algorithm (ETOP-R)
Having proved that a greedy approach can compute the paths
with the minimum ETOP cost, we design an algorithm based
on Dijkstra’s single-source shortest path algorithm [9] for
doing so. The algorithm takes as input: (a) a graph representing
the the network, (b) the edge weights, represented by the πi
(the probability of no drop), (c) a bound on the number of
retransmissions at the link layer, K, and (d) a source node.
The algorithm computes the minimum ETOP paths from the
source to every other node.
With Dijkstra’s algorithm, if node u precedes node v, on a
path from the source node to v, and d[u] is the cost of the path
to u, the cost to v is:
d[v] = d[u] + w(u, v) (11)
where, w(u, v) is the non-negative weight of link (u, v).
In our case, the key observation is that with ETOP, from
Equation 7, the cost to node v is given by:
d[v] =d[u]
π[u][v]+ K
1 − π[u][v]
π[u][v]+ LinkCostu,v (12)
where, π[u][v] is the probability of no drop between nodes
u and v, and LinkCost is the expected number of transmis-
sions (including retransmissions) over link (u, v) as defined in
Lemma 1. Note that the cost functions in Equations 11 and
12 define optimization problems that satisfy the greedy-choice
and sub-structure property. Based on this, we design ETOP-
based routing, which is depicted in detail in Figure 3. The
procedure differs from the Dijkstra’s algorithm in the Relaxprocedure on line 10, where we replace Equation 11 with
Equation 12. The correctness of our algorithm follows from
the correctness of Dijkstra’s algorithm.
IEEE TRANSACTIONS ON MOBILE COMPUTINGThis article has been accepted for publication in a future issue of this journal, but has not been fully edited. Content may change prior to final publication.
6
ETOP-R(G, π, s, K)
1: Initialize (G,s)2: S ← ∅3: Q ← V [G]4: while Q = ∅ do5: u ← MIN(Q)6: S ← S ∪ {u}7: for each vertex v ∈ Adj[u] do8: Relax(u, v, π[u][v], K)
15: for each vertex u ∈ V [G] do16: d[u] = ∞17: f [u] = NULL18: d[s] = 0
Fig. 3. Our ETOP-based algorithm for identifying theminimum ETOP cost path. It takes as input a graphG(V, E), a source node s, the bound on the number ofretries, K, and the |V | × |V | array of link probabilities ofno drop, π.
5 ImplementationIn order to quantify the benefits of using ETOP, we implement
a routing strategy based on the algorithm described in Section
network (Figure 7) consists of 25 Soekris net4826 nodes [4],
deployed on one floor of our building. Each node runs a
Debian v3.1 Linux distribution with kernel version 2.6. We
have equipped the nodes with EMP-8602-6G 802.11a/b/g WiFi
cards [1], which embed the Atheros AR5006 chipset; the
cards are controlled by the Linux MadWifi driver, version
0.9.3 [3]. Each card is connected to a 5-dBi gain, external
omnidirectional antenna. We use the 802.11a mode to avoid
interference from co-located 802.11b/g networks. We use the
popular Click toolkit [20] to implement our routing strategy.
Routing Implementation: We implement ETOP-based
routing as part of a modified version of the dynamic source
routing protocol (DSR) [17] developed by De Couto et al
[10] for the Linux kernel. We chose DSR because (i) it
is one of the most popular protocols for multihop wireless
networks and hence, its implementations are readily available
and (ii) it allows a source to decide on the path to the
destination (required by ETOP-R since it is noncommutative).
Furthermore, we consider the ETX metric for comparison and
use the implementation of the routing strategy based on ETX
[10]. For ease of notation we refer to ETOP-based routing as
ETOP-R and to ETX-based routing as ETX-R.
DSR mechanics: With DSR [17], a node attempts to find
a route to a destination by broadcasting a route request
message (RREQ). The RREQ is subsequently re-broadcasted
once by each nodes in the network, upon receipt. A node
inserts its own address in the RREQ before re-broadcasting it.
The sequence of addresses in the forwarded RREQ specifies
the route traversed from the source to the destination. Upon
receiving a RREQ, the destination sends a route reply message
(RREP) to the source (with the route embedded within), along
the reverse route recorded in the corresponding RREQ. The
source stores the routes collected from all the RREPs received
in a cache and uses, for a limited time, the route with the
minimum hop count for forwarding data2. Note that as in [10],
the route error messages (RERR messages) induced by DSR
are disabled during the experiments; this functionality of DSR
is not utilized with either ETX-R or ETOP-R.Implementation of ETX-R: To estimate and use the link
qualities, a link-measurement component was implemented
by [10] as a separate element in Click [20]; it runs on
every node and uses small broadcast packets to estimate the
delivery probability from this node to each of its neighbors.
The delivery probabilities computed by the link-measurement
component are used to compute the ETX metric as described
in Section 2. With ETX-R, when a node forwards a RREQ
it includes the ETX metric on the link to the node from
which it received the RREQ. This information is then reported
back to the source through the RREPs. At the source, this
information is passed on to the link-measurement component,
which maintains a cache (the ETX link cache) of all the
known nodes and the ETX metrics of their corresponding
links. Whenever the source needs a route, if the destination
is in the cache, the link-metric component will return the
route with the minimum ETX-weight, computed by running
Dijkstra’s weighted shortest path algorithm on the topology
constructed with the nodes and links in the ETX link cache.Implementation of ETOP-R To implement our ETOP-based
algorithm, first we build a new cache for ETOP that is similar
to the ETX link cache, except that the links are now repre-
sented by their delivery probabilities. The ETOP cache is not
populated by collecting data via an explicit new mechanism,
but is derived from the information in the ETX link cache. We
exploit the simple relation between ETX and the link delivery
probability (ETX = 1psuccess
). In computing ETX, the authors
assume that the probes compute the probability of successfully
delivering a packet across a link; ETX is computed to be
the inverse of this probability. With ETOP, the probability
of successfully delivering a packet across a link is given by
πi, the probability that a packet is “not” dropped on a given
link. Thus, we equate πi to 1/ETX. This value is then used
in computing the ETOP cost as discussed earlier. Finally, the
ETOP-based algorithm, described in Figure 3, is implemented
within the link-measurement component; it takes as input the
ETOP link cache and returns the route with the minimum
ETOP cost.Mapping our models to the implementation: The models
(from Section 3) for computing ETOP were based on a
set of assumptions that the link delivery probabilities are
IID. However, in reality, this may not always hold. Packet
drops may sometimes reflect correlated behaviors. First note
2. A complete description of the DSR protocol is omitted due to spacelimitations; instead, we briefly describe the route discovery mechanismbecause of its relevance to the ETX-R and ETOP-R implementations.
IEEE TRANSACTIONS ON MOBILE COMPUTINGThis article has been accepted for publication in a future issue of this journal, but has not been fully edited. Content may change prior to final publication.
7
that it is extremely difficult to accurately characterize these
correlations; second, it may also be difficult to take them
into account while performing routing since they may have
high temporal fluctuations. Thus, the goal of our design is to
reduce the number of link layer retransmissions and improve
throughput performance; we do recognize that it may be
difficult to actually minimize the number of transmissions in
practice.
Finally, note that the probe messages are of small size (128
bytes) and are sent at the basic rate. For the transmission of the
actual data, which are much larger (1500 bytes), Samplerate
rate control mechanism is used in our cards [3]. Because
the packet delivery probability depends on its size as well
as the rates at which it is transmitted, the probes may over-
estimate the probability of a data packet delivery. However, our
contribution is not a new way of computing the link delivery
probabilities; instead we rely on a previously used method (the
one used in the original work on ETX [10]).
Comparisons: We compare ETOP-based routing with ETX-
based routing [10], since it represents a large class of previ-
ously proposed metrics. Other metrics use the ETX cost in
conjunction with other features (such as multi-rate capabilities
[13], or energy consumption [6]) in the final selection of the
paths. The ETOP cost could be possibly used in lieu of the
ETX cost and this will be considered in future work.
6 Experimental Evaluation of ETOPIn this section we evaluate the performance of ETOP-R and
compare it with that of ETX-R. In summary, we make the
following main observations:
• ETOP-R improves the median TCP goodput in our
testbed when compared to ETX-R. The improvements are
more pronounced on longer paths; for three and four hop
paths we observe goodput improvements of over 50%.
• The use of ETOP-R reduces the number of link layer
compared to ETX-R; for some TCP flows, the reduction
is as high as 60%.
• The use of ETOP-R allows TCP to operate at higher
congestion windows compared to ETX-R; for a typical
flow, we observe that the median window size is about
four times higher.
6.1 Impact of ETOP-R and ETX-R on long lived TCPFlowsThe Set up: For the first set of experiments, we choose at
random a large number of source-destination pairs, 110, out of
the possible 25× 24 = 600 possible combinations and run TCP
sessions on each pair for 3 minutes. The time used is similar to
that in the experiments reported in [12]. We use “Iperf” [2] to
measure the maximum achievable TCP bandwidth (goodput).
To make the results between the metrics comparable, the
following setup (similar to that in [10]) is used. For each of
the 110 node pairs, we run ETX-R immediately followed by
ETOP-R. Thus, the results with the two metrics are obtained
within minutes of each other; we expect the channel conditions
0
0.1
0.2
0.3
0.4
0.5
0.6
0.7
0.8
0.9
1
100
200
300
400
500
600
700
800
900
1000
TCP Goodput (Kbps)
Cu
mu
lati
ve F
racti
on
of
No
de P
air
s
ETX-R
ETOP-R
(a) CDF of the TCP goodput for all 110 paths.
Median TCP Goodput (Kbps) Path
Length # Pairs
ETX-R ETOP-R
All Lengths 110 523.1 640.4
1-hop 39 681.7 665.8
2-hops 41 546.5 632.7
3-hops 23 382.3 648.2
4-hops 7 272.8 422.3
(b) Median TCP goodput for all path lengths.
Fig. 4. ETOP-R offers significant improvement, by over50%, over ETX-R for the node pairs separated by 3 ormore hops.
to have changed little during this time3. On every path, the
protocols are allowed to run for 90 secs to achieve stable
operations. Then, the source pings the destination for 5 sec,
at a rate of one packet per second, to allow the protocols to
discover the paths to the destination. The source then initiates
a TCP connection with the destination. Every run (for the 110
pairs) takes approximately 15 hours. We repeat the experiment
six times and compute an average to reduce the impact of
temporal variations.
ETOP-R improves TCP goodput over ETX-R: In Figure 4
the CDF and the medians4 of the distribution of the measured
TCP goodputs for ETOP-R and ETX-R are depicted. The CDF
for all the 110 node-pairs, depicted in Figure 4(a), shows that
ETOP-R performs better than ETX-R, by as much as 65%,
in a wide range of goodputs. Another interesting observation
is that the goodput does not drop as sharply as expected
when the number of hops increases. This is due to the fact
that the TCP throttles the transmit rate as acknowledgments
are not arriving on time, which can happen often in face of
lossy links. A more detailed look into the data, Figures 5(a)-
5(d), reveals that the regime of goodput values where ETOP-R
offers significant improvements correspond to those achieved
by node-pairs separated by three or more hops; the regime of
goodput values where the statistical performance of ETOP-R
and ETX-R are similar, correspond to those achieved by node-
pairs one or two hops away. This is expected, since, for the
node pairs that are separated by one or two hops the position
3. While this holds in most cases, it is not always true.
4. When the distribution of the data is skewed (as it is in our case), themedian is more representative of a typical observation than the mean[15].
IEEE TRANSACTIONS ON MOBILE COMPUTINGThis article has been accepted for publication in a future issue of this journal, but has not been fully edited. Content may change prior to final publication.
8
CDF: Path Length 1 hop
0
0.1
0.2
0.3
0.4
0.5
0.6
0.7
0.8
0.9
1
100
200
300
400
500
600
700
800
900
1000
1100
1200
TCP Goodput (Kbps)
Cu
mu
lati
ve F
racti
on
o
f N
od
e P
air
sETX-R
ETOP-R
(a) CDF of the TCP goodput for node pairs that are 1-hopapart
CDF: Path Length 2 hops
0
0.1
0.2
0.3
0.4
0.5
0.6
0.7
0.8
0.9
1
100
200
300
400
500
600
700
800
900
1000
1100
1200
TCP Goodput (Kbps)
Cu
mu
lati
ve F
racti
on
of
No
de P
air
s
ETX-R
ETOP-R
(b) CDF of the TCP goodput for node pairs that are 2-hopsapart
CDF: Path Length 3 hops
0
0.1
0.2
0.3
0.4
0.5
0.6
0.7
0.8
0.9
1
100
150
200
250
300
350
400
450
500
550
600
650
700
750
800
850
900
950
TCP Goodput (Kbps)
Cu
mu
lati
ve F
racti
on
of
No
de P
air
s
ETX-R
ETOP-R
(c) CDF of the TCP goodput for node pairs that are 3-hopsapart
CDF: Path Length 4 hops
0
0.1
0.2
0.3
0.4
0.5
0.6
0.7
0.8
0.9
1
100 150 200 250 300 350 400 450 500 550
TCP Goodput (Kbps)
Cu
mu
lati
ve F
racti
on
of
No
de P
air
s
ETX-R
ETOP-R
(d) CDF of the TCP goodput for node pairs that are 4-hopsapart
Fig. 5. The CDF of the goodputs distribution for the 110 node pairs organized by path length. ETOP-R offers significantimprovement, by as much as 200%, over ETX-R for the node pairs separated by 3 or 4 hops.
MAC EnD (%) 83.3 3.8 1.5 3.6 13.4 3.9 4.3 3.4 9.7 2.8
W. P. Reliability 0.41 0.78 0.78 0.86 0.56 0.76 0.64 0.82 0.72 0.76
W. P. Length 3 4.4 3 3.1 3.9 4.4 3.5 4.7 3.3 4.3
Fig. 6. ETOP-R reduces the link layer retransmissionsand packet drops, which leads to higher TCP goodput.
of the link has little or no impact and thus, ETOP-R can offer
little or no improvements.
6.2 MAC level performance of ETOP-R and ETX-RETOP-R is designed to reduce the retransmissions costs at the
MAC layer and thus, it is important that we examine whether
ETOP-R has met its design goals. To this end, we focus our
attention on 5 node pairs for which the paths were among
the longest in our testbed; as discussed earlier both ETX-
R and ETOP-R are designed to provide improvements over
long paths. Iperf is once again used to establish long-lived
TCP flows; only 1 flow is active at a time. During runtime,
using the athstats tool provided with the MadWifi driver [3],
for each flow, at every node that participated in that flow,
the following statistics are gathered at the MAC layer: (i)
the number of transmissions (including retransmissions), (ii)
the number of packets that were dropped after the maximum
number of retransmissions was exceeded. In our experiments
we disable the RTS/CTS, thus, the default long retry limit5 of
7 is used by the wireless cards.To present the data in a meaningful way, we define two
new measures: the Effective Number of transmissions and
Retransmissions (EnR), and the Effective number of Dropped
packets (EnD). For a TCP flow, the EnR is calculated as the
ratio of the packets received at the destination to the total
number of transmissions and retransmissions attempted at the
MAC layer while this TCP flow was alive. This measure
is a good estimate of the cost of delivering a TCP packet
successfully from the source to the destination. Similarly, the
EnD for a TCP flow is calculated as the ratio of all the packet
drops to the number of transmissions (retransmissions are notcounted) performed by the MAC of the source, while the
specific TCP flow was alive. This measure is a good estimate
of the percentage of the packets that were sent by the MAC
of the source and were dropped somewhere along the path.
In addition to these two measures, in Figure 6, we show the
TCP goodput, the weighted path reliability and length, for all
the five TCP flows. We record all the paths traversed by a
TCP flow during the experiment and the number of packets
sent over each of the paths. The reliability (the product of the
delivery probabilities of the links on the path) and length of
each path are weighted by the number of packets sent over
5. We intended to perform experiments with varying retry limits. However,in our cards this functionality is implemented in the firmware, to which wecould not obtain access.
IEEE TRANSACTIONS ON MOBILE COMPUTINGThis article has been accepted for publication in a future issue of this journal, but has not been fully edited. Content may change prior to final publication.
9
that path to compute the latter two metrics.
The use of ETOP-R reduces MAC transmissions andpacket drops: Our experiments validate our intuition that
ETOP-R reduces the number of transmissions needed for e2e
reliable data delivery. As seen in Figure 6, ETOP-R typically
reduces he EnR significantly, which in turn leads to higher
TCP goodput. Furthermore, we notice that ETOP-R generates
more reliable (which leads to reduced EnD) but longer paths
compared to ETX-R. This is a direct consequence of the
ETOP-R design. ETOP-R assigns higher costs to the packet
drops close to the destination (See Equation (7), in Section
4) and thus, it prefers more reliable although possibly longer
alternatives.
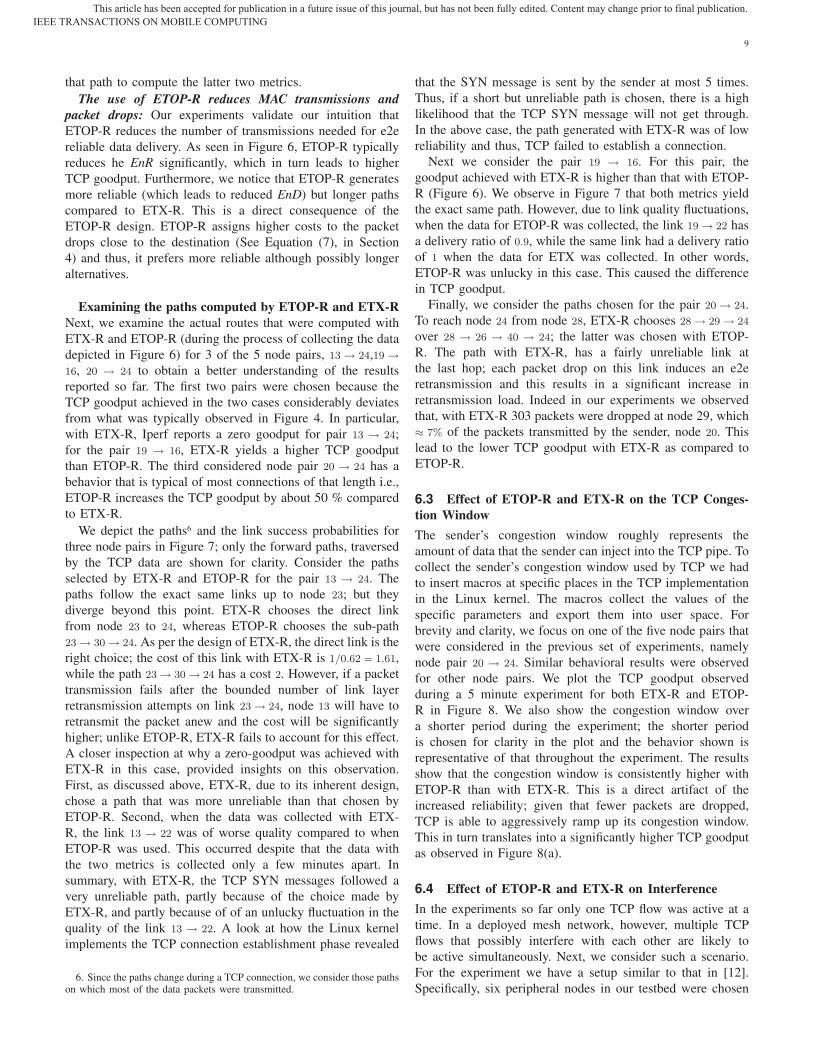
Examining the paths computed by ETOP-R and ETX-RNext, we examine the actual routes that were computed with
ETX-R and ETOP-R (during the process of collecting the data
depicted in Figure 6) for 3 of the 5 node pairs, 13 → 24,19 →16, 20 → 24 to obtain a better understanding of the results
reported so far. The first two pairs were chosen because the
TCP goodput achieved in the two cases considerably deviates
from what was typically observed in Figure 4. In particular,
with ETX-R, Iperf reports a zero goodput for pair 13 → 24;
for the pair 19 → 16, ETX-R yields a higher TCP goodput
than ETOP-R. The third considered node pair 20 → 24 has a
behavior that is typical of most connections of that length i.e.,
ETOP-R increases the TCP goodput by about 50 % compared
to ETX-R.
We depict the paths6 and the link success probabilities for
three node pairs in Figure 7; only the forward paths, traversed
by the TCP data are shown for clarity. Consider the paths
selected by ETX-R and ETOP-R for the pair 13 → 24. The
paths follow the exact same links up to node 23; but they
diverge beyond this point. ETX-R chooses the direct link
from node 23 to 24, whereas ETOP-R chooses the sub-path
23 → 30 → 24. As per the design of ETX-R, the direct link is the
right choice; the cost of this link with ETX-R is 1/0.62 = 1.61,
while the path 23 → 30 → 24 has a cost 2. However, if a packet
transmission fails after the bounded number of link layer
retransmission attempts on link 23 → 24, node 13 will have to
retransmit the packet anew and the cost will be significantly
higher; unlike ETOP-R, ETX-R fails to account for this effect.
A closer inspection at why a zero-goodput was achieved with
ETX-R in this case, provided insights on this observation.
First, as discussed above, ETX-R, due to its inherent design,
chose a path that was more unreliable than that chosen by
ETOP-R. Second, when the data was collected with ETX-
R, the link 13 → 22 was of worse quality compared to when
ETOP-R was used. This occurred despite that the data with
the two metrics is collected only a few minutes apart. In
summary, with ETX-R, the TCP SYN messages followed a
very unreliable path, partly because of the choice made by
ETX-R, and partly because of of an unlucky fluctuation in the
quality of the link 13 → 22. A look at how the Linux kernel
implements the TCP connection establishment phase revealed
6. Since the paths change during a TCP connection, we consider those pathson which most of the data packets were transmitted.
that the SYN message is sent by the sender at most 5 times.
Thus, if a short but unreliable path is chosen, there is a high
likelihood that the TCP SYN message will not get through.
In the above case, the path generated with ETX-R was of low
reliability and thus, TCP failed to establish a connection.
Next we consider the pair 19 → 16. For this pair, the
goodput achieved with ETX-R is higher than that with ETOP-
R (Figure 6). We observe in Figure 7 that both metrics yield
the exact same path. However, due to link quality fluctuations,
when the data for ETOP-R was collected, the link 19 → 22 has
a delivery ratio of 0.9, while the same link had a delivery ratio
of 1 when the data for ETX was collected. In other words,
ETOP-R was unlucky in this case. This caused the difference
in TCP goodput.
Finally, we consider the paths chosen for the pair 20 → 24.
To reach node 24 from node 28, ETX-R chooses 28 → 29 → 24
over 28 → 26 → 40 → 24; the latter was chosen with ETOP-
R. The path with ETX-R, has a fairly unreliable link at
the last hop; each packet drop on this link induces an e2e
retransmission and this results in a significant increase in
retransmission load. Indeed in our experiments we observed
that, with ETX-R 303 packets were dropped at node 29, which
≈ 7% of the packets transmitted by the sender, node 20. This
lead to the lower TCP goodput with ETX-R as compared to
ETOP-R.
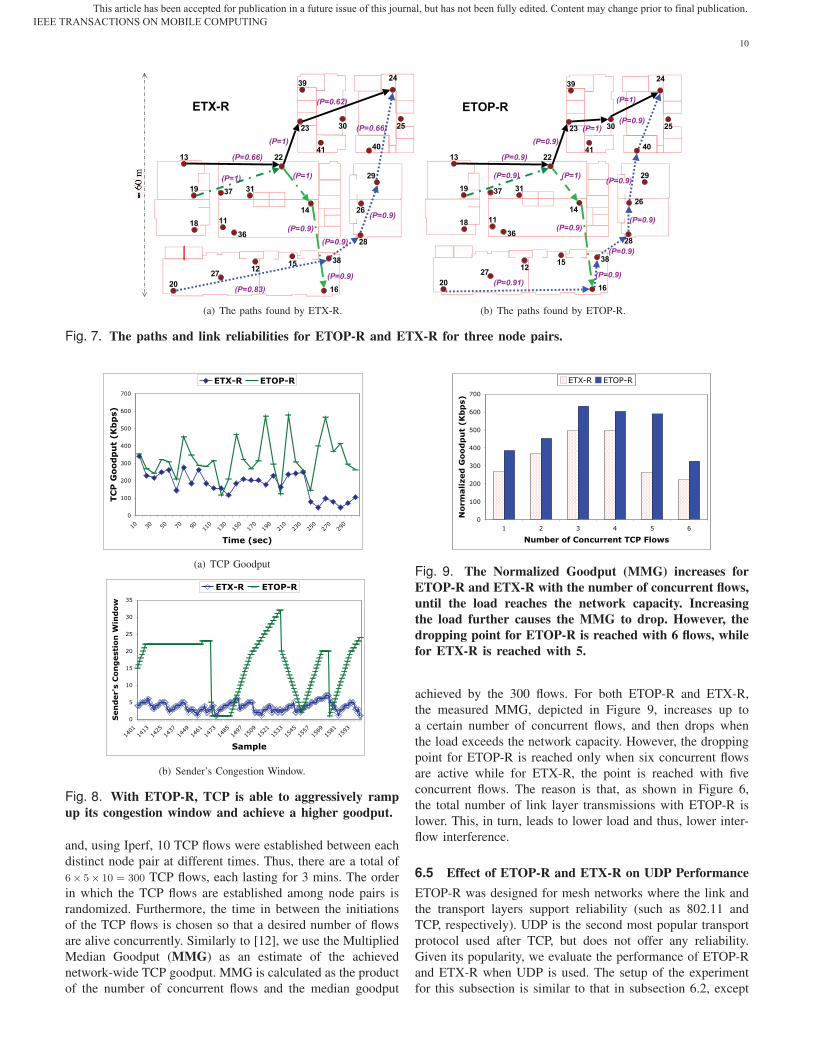
6.3 Effect of ETOP-R and ETX-R on the TCP Conges-tion WindowThe sender’s congestion window roughly represents the
amount of data that the sender can inject into the TCP pipe. To
collect the sender’s congestion window used by TCP we had
to insert macros at specific places in the TCP implementation
in the Linux kernel. The macros collect the values of the
specific parameters and export them into user space. For
brevity and clarity, we focus on one of the five node pairs that
were considered in the previous set of experiments, namely
node pair 20 → 24. Similar behavioral results were observed
for other node pairs. We plot the TCP goodput observed
during a 5 minute experiment for both ETX-R and ETOP-
R in Figure 8. We also show the congestion window over
a shorter period during the experiment; the shorter period
is chosen for clarity in the plot and the behavior shown is
representative of that throughout the experiment. The results
show that the congestion window is consistently higher with
ETOP-R than with ETX-R. This is a direct artifact of the
increased reliability; given that fewer packets are dropped,
TCP is able to aggressively ramp up its congestion window.
This in turn translates into a significantly higher TCP goodput
as observed in Figure 8(a).
6.4 Effect of ETOP-R and ETX-R on InterferenceIn the experiments so far only one TCP flow was active at a
time. In a deployed mesh network, however, multiple TCP
flows that possibly interfere with each other are likely to
be active simultaneously. Next, we consider such a scenario.
For the experiment we have a setup similar to that in [12].
Specifically, six peripheral nodes in our testbed were chosen
IEEE TRANSACTIONS ON MOBILE COMPUTINGThis article has been accepted for publication in a future issue of this journal, but has not been fully edited. Content may change prior to final publication.
10
20
36
31
2712
15
11
14
19
13
37
22
29
26
28
40
25
24
41
3023
39
18
38
16
(P=0.66)
(P=1)
(P=0.62)
(P=1) (P=1)
(P=0.9)
(P=0.83)
(P=0.9)
(P=0.9)
(P=0.9)
(P=0.66)
ETX-R
(a) The paths found by ETX-R.
20
36
31
2712
15
11
14
19
13
37
22
29
26
28
40
25
24
41
3023
39
18
38
16
(P=0.9)
(P=0.9)
(P=1)
(P=1)
(P=0.9) (P=1)
(P=0.9)
(P=0.91)(P=0.9)
(P=0.9)
(P=0.9)
(P=0.9)
(P=0.9)
ETOP-R
(b) The paths found by ETOP-R.
Fig. 7. The paths and link reliabilities for ETOP-R and ETX-R for three node pairs.
0
100
200
300
400
500
600
700
10
30
50
70
90110130150170190210230250270290
Time (sec)
TC
P G
oo
dp
ut
(K
bp
s)
ETX-R ETOP-R
(a) TCP Goodput
0
5
10
15
20
25
30
35
1401
1413
1425
1437
1449
1461
1473
1485
1497
1509
1521
1533
1545
1557
1569
1581
1593
Sample
Sen
der's
Co
ng
esti
on
Win
do
w
ETX-R ETOP-R
(b) Sender’s Congestion Window.
Fig. 8. With ETOP-R, TCP is able to aggressively rampup its congestion window and achieve a higher goodput.
and, using Iperf, 10 TCP flows were established between each
distinct node pair at different times. Thus, there are a total of
6× 5× 10 = 300 TCP flows, each lasting for 3 mins. The order
in which the TCP flows are established among node pairs is
randomized. Furthermore, the time in between the initiations
of the TCP flows is chosen so that a desired number of flows
are alive concurrently. Similarly to [12], we use the Multiplied
Median Goodput (MMG) as an estimate of the achieved
network-wide TCP goodput. MMG is calculated as the product
of the number of concurrent flows and the median goodput
0
100
200
300
400
500
600
700
1 2 3 4 5 6
Number of Concurrent TCP Flows
No
rm
ali
zed
Go
od
pu
t (K
bp
s)
ETX-R ETOP-R
Fig. 9. The Normalized Goodput (MMG) increases forETOP-R and ETX-R with the number of concurrent flows,until the load reaches the network capacity. Increasingthe load further causes the MMG to drop. However, thedropping point for ETOP-R is reached with 6 flows, whilefor ETX-R is reached with 5.
achieved by the 300 flows. For both ETOP-R and ETX-R,
the measured MMG, depicted in Figure 9, increases up to
a certain number of concurrent flows, and then drops when
the load exceeds the network capacity. However, the dropping
point for ETOP-R is reached only when six concurrent flows
are active while for ETX-R, the point is reached with five
concurrent flows. The reason is that, as shown in Figure 6,
the total number of link layer transmissions with ETOP-R is
lower. This, in turn, leads to lower load and thus, lower inter-
flow interference.
6.5 Effect of ETOP-R and ETX-R on UDP PerformanceETOP-R was designed for mesh networks where the link and
the transport layers support reliability (such as 802.11 and
TCP, respectively). UDP is the second most popular transport
protocol used after TCP, but does not offer any reliability.
Given its popularity, we evaluate the performance of ETOP-R
and ETX-R when UDP is used. The setup of the experiment
for this subsection is similar to that in subsection 6.2, except
IEEE TRANSACTIONS ON MOBILE COMPUTINGThis article has been accepted for publication in a future issue of this journal, but has not been fully edited. Content may change prior to final publication.
11
0
2
4
6
8
10
12
100 200 300 400 500
UDP Bandwidth (Kbps)
No
rm
alized
Dro
pp
ed
Packets
ETX-R ETOP-R
Fig. 10. ETOP-R computes paths that are more reliableand thus reduces the UDP datagram losses significantly.
that UDP flows were generated instead of TCP. In Figure
10, the median percentage of the dropped UDP datagrams7
from the total transmitted by the source, is depicted. The UDP
throughputs achieved for both policies were very similar for
all UDP data rates (bandwidths) considered8. When the paths
computed by ETOP-R are used for the UDP transfers, the
packet drops are significantly lower. This is a direct conse-
quence of the ability of ETOP-R to generate more reliable
paths than ETX-R (as shown earlier in Figure 6).
7 ConclusionsIn this paper, we revisit the problem of computing the path
with the minimum cost in terms of the number of link
layer transmissions and retransmissions in multi-hop wireless
networks. The key feature that distinguishes our work is that
we consider a finite number of link level retransmissions,
unlike previous efforts (such as ETX). We demonstrate that
in addition to the magnitude of the link reliabilities on a path,
the relative ordering of the links is critical in computing the
correct minimum cost path. We provide an analytical model to
compute a noncommutative path metric, ETOP, that captures
this cost. We show that in spite of ETOP’s complex form, the
problem of computing the path with the minimum ETOP value
can be solved using our greedy routing strategy. We implement
ETOP-based routing and perform extensive experiments on
a 25 node indoor mesh network to quantify and evaluate
its performance. We compare the performance of the paths
computed with our metric with those computed with a routing
strategy based on ETX. Our scheme outperforms the ETX
based routing, by over 50% in many cases, in terms of TCP
7. Usually a UDP datagram is fragmented into several IP packets, andlosing a single IP packet will lead to the loss of the entire datagram. To avoidthis we made the datagrams small enough to fit into one packet.
8. For the node pairs considered, the UDP throughput observed was neverhigher than 500 Kbps. Thus, the choice of the UDP rates depicted.
[5] D. Aguayo, J. Bicket, S. Biswas, G. Judd, and R. Morris. Link-levelmeasurements from an 802.11b mesh network. In ACM SIGCOMM2004.
[6] S. Banerjee and A. Misra. Minimum energy paths for reliable commu-nication in multi-hop wireless networks. In ACM MobiHoc 2002.
[7] C. Koksal and H. Balakrishnan. Quality-Aware Routing Metrics forTime-Varying Wireless Mesh Networks. IEEE JSAC, 24(11), November2006.
[8] A. Cerpa, J. L. Wong, M. Potkonjak, and D. Estrin. Temporal propertiesof low power wireless links: modeling and implications on multi-hoprouting. In ACM MobiHoc 2005.
[9] T. Cormen, C.Leiserson, and R.Rivest. Introduction to Algorithms.McGraw Hill, 2000.
[10] D. S. J. De Couto, D. Aguayo, J. Bicket, and R. Morris. A high-throughput path metric for multi-hop wireless routing. In ACM Mobi-Com 2003.
[11] Q. Dong, S. Banerjee, M. Adler, and A. Misra. Minimum energy reliablepaths using unreliable wireless links. In ACM Mobihoc 2005.
[12] R. Draves, J. Padhye, and B. Zill. Comparison of routing metrics forstatic multi-hop wireless networks. In ACM SIGCOMM 2004.
[13] R. Draves, J. Padhye, and B. Zill. Routing in multi-radio, multi-hopwireless mesh networks. In ACM MobiCom 2004.
[14] D. Ganesan, B. Krishnamachari, A. Woo, D. Culler, D. Estrin, andS. Wicker. Complex behavior at scale: An experimental study of low-power wireless sensor networks. technical report csd-tr 02-0013, ucla,february 2002.
[15] R. Jain. The Art of Computer Systems Performance Analysis. John Wileyand Sons, Inc., 1991.
[16] Gentian Jakllari, Stephan Eidenbenz, Nick Hengartner, Srikanth V.Krishnamurthy, and Michalis Faloutsos. Link positions matter: Anoncommutative routing metric for wireless mesh networks. In IEEEINFOCOM 2008.
[17] D. B. Johnson, D. A. Maltz, and Y. Hu. The Dynamic Source RoutingProtocol for Mobile Ad Hoc Networks (DSR). Internet draft (work inprogress). IETF, April 2003.
[18] J.Proakis. Digital Communications. McGraw Hill, 2000.
[19] K. Kim and K. G. Shin. On accurate measurement of link quality inmulti-hop wireless mesh networks. In ACM MobiCom ’06.
[20] E. Kohler, R. Morris, B. Chen, J. Jannotti, and M. F. Kaashoek. Theclick modular router. ACM Trans. Comput. Syst., 18(3):263–297, 2000.
[21] D. Kotz, C. Newport, R. S. Gray, J. Liu, Y. Yuan, and C. Elliott.Experimental evaluation of wireless simulation assumptions. In ACMMSWiM 2004.
[22] X. Li, Y. Shu, H. Chen, and X. Chu. Energy efficient routing withunreliable links in wireless networks. In IEEE MASS 2006.
[23] H. Lundgren, E. Nordstro, and Ch. Tschudin. Coping with commu-nication gray zones in ieee 802.11b based ad hoc networks. In ACMWOWMOM ’02.
[24] K. Seada, M. Zuniga, A. Helmy, and B. Krishnamachari. Energy-efficient forwarding strategies for geographic routing in lossy wirelesssensor networks. In ACM SenSys ’04.
[25] A. Woo, T.Tong, and D. Culler. Taming the underlying challenges ofreliable multihop routing in sensor networks. In ACM SenSys ’03.
[26] M. D. Yarvis, W. S. Conner, L. Krishnamurthy, A. Mainwaring,J. Chhabra, and B. Elliott. Real-world experiences with an interactivead hoc sensor network. In IEEE ICPPW 2002.
[27] H. Zhang, A. Arora, and P. Sinha. Learn on the fly: Data-drivenlink estimation and routing in sensor network backbones. In IEEEINFOCOM, 2006.
IEEE TRANSACTIONS ON MOBILE COMPUTINGThis article has been accepted for publication in a future issue of this journal, but has not been fully edited. Content may change prior to final publication.
12
8 PHOTOS AND BIOGRAPHIES
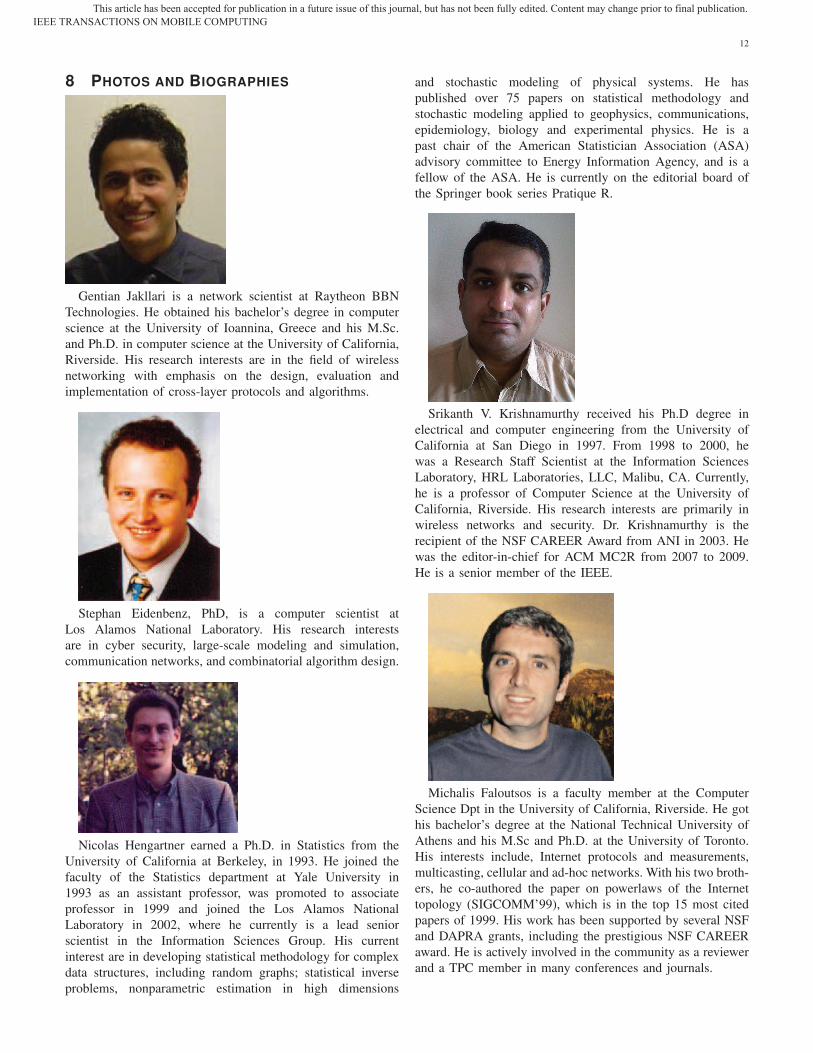
Gentian Jakllari is a network scientist at Raytheon BBN
Technologies. He obtained his bachelor’s degree in computer
science at the University of Ioannina, Greece and his M.Sc.
and Ph.D. in computer science at the University of California,
Riverside. His research interests are in the field of wireless
networking with emphasis on the design, evaluation and
implementation of cross-layer protocols and algorithms.
Stephan Eidenbenz, PhD, is a computer scientist at
Los Alamos National Laboratory. His research interests
are in cyber security, large-scale modeling and simulation,
communication networks, and combinatorial algorithm design.
Nicolas Hengartner earned a Ph.D. in Statistics from the
University of California at Berkeley, in 1993. He joined the
faculty of the Statistics department at Yale University in
1993 as an assistant professor, was promoted to associate
professor in 1999 and joined the Los Alamos National
Laboratory in 2002, where he currently is a lead senior
scientist in the Information Sciences Group. His current
interest are in developing statistical methodology for complex
data structures, including random graphs; statistical inverse
problems, nonparametric estimation in high dimensions
and stochastic modeling of physical systems. He has
published over 75 papers on statistical methodology and
stochastic modeling applied to geophysics, communications,
epidemiology, biology and experimental physics. He is a
past chair of the American Statistician Association (ASA)
advisory committee to Energy Information Agency, and is a
fellow of the ASA. He is currently on the editorial board of
the Springer book series Pratique R.
Srikanth V. Krishnamurthy received his Ph.D degree in
electrical and computer engineering from the University of
California at San Diego in 1997. From 1998 to 2000, he
was a Research Staff Scientist at the Information Sciences
Laboratory, HRL Laboratories, LLC, Malibu, CA. Currently,
he is a professor of Computer Science at the University of
California, Riverside. His research interests are primarily in
wireless networks and security. Dr. Krishnamurthy is the
recipient of the NSF CAREER Award from ANI in 2003. He
was the editor-in-chief for ACM MC2R from 2007 to 2009.
He is a senior member of the IEEE.
Michalis Faloutsos is a faculty member at the Computer
Science Dpt in the University of California, Riverside. He got
his bachelor’s degree at the National Technical University of
Athens and his M.Sc and Ph.D. at the University of Toronto.
His interests include, Internet protocols and measurements,
multicasting, cellular and ad-hoc networks. With his two broth-
ers, he co-authored the paper on powerlaws of the Internet
topology (SIGCOMM’99), which is in the top 15 most cited
papers of 1999. His work has been supported by several NSF
and DAPRA grants, including the prestigious NSF CAREER
award. He is actively involved in the community as a reviewer
and a TPC member in many conferences and journals.
IEEE TRANSACTIONS ON MOBILE COMPUTINGThis article has been accepted for publication in a future issue of this journal, but has not been fully edited. Content may change prior to final publication.


![Concepts ETOP[2]](https://static.documents.pub/doc/80x56/547759d85806b578068b466c/concepts-etop2.jpg)


