34
Linking Current and Future Score Scales for the AICPA Uniform CPA Exam i Technical Report August 4, 2009 W0902 Wendy Lam University of Massachusetts Amherst

Linking Current and Future Score Scales for the AICPA Uniform CPA Exami
Technical Report
August 4, 2009 W0902
Wendy Lam
University of Massachusetts Amherst

Linking Current and Future Score Scales for the AICPA Uniform CPA Exam 1
Copyright © 2007 by American Institute of Certified Public Accountants, Inc.

Linking Current and Future Score Scales for the AICPA Uniform CPA Exam 2
Background The Uniform CPA exam has evolved over the years since its first administration in 1917. Still, the primary goal of the exam remains the same: To grant a CPA license to individuals “after they have demonstrated entry-level knowledge and skills necessary to protect the public interest in a rapidly changing business and financial environment” (AICPA, 2008). Since 2004, the computer-based Uniform CPA exam has been comprised of four independently-scored sections: Auditing and Attestation (AUD), Financial Accounting and Reporting (FAR), Regulation (REG) and Business Environment and Concepts (BEC). Each section addresses different aspects of accounting proficiency. In addition, each section is constructed by using different types of item formats, specifically, multiple-choice questions, simulations, and essay questions. Currently, the BEC section consists of only multiple-choice items. The reported score for each section (AUD, FAR, REG and BEC) is obtained using a multi-step procedure. First, each component (multiple-choice, simulations and essay) is scored separately with a scale ranging from 0 to 100. Then, policy weights are applied to each component, 70% for multiple-choice items, 20% for simulations items, and 10% for essay questions. The sum of these weighted component scores is then transformed to the reporting score scale, ranging from 0 to 99, with a passing score set at 75. Moreover, the Uniform CPA exam uses a compensatory scoring model, which means that examinees’ performance on any item (or item format) can be compensated by his/her performance on other items or other components of the section. In the case of BEC, a 100% weight is applied to the multiple-choice component, as this is the only item format that is used in the section.
The Uniform CPA exam is a computerized multistage adaptive test, which is one of the variations of a computerized-adaptive test (CAT). In multistage testing, instead of administering an individual item that more or less matches the ability of the examinee, groups of items are selected and are administered at different stages of the test. These groups of items are referred to as testlets or modules, and usually there are multiple testlets within a stage. The score for an examinee is updated after each stage of the administration, and the difficulty of the testlet for the subsequent stage is determined by the performance on the testlet in the current stage; hence, this permits examinees the chance to review and/or skip items within a testlet. BEC section uses a non-adaptive multistage testing model, meaning that only moderately-difficulty testlets are administered in all three stages.
In 2008, a practice analysis was conducted to “[evaluate] the knowledge, tasks and skills required for entry-level CPAs, to determine the feasibility and resources required for assessment, and to develop a blueprint documenting the content and skills of the examinations” (AICPA, 2008). The goal of a practice analysis is to provide an evaluation of the important aspects of the job performance related to the field of interest. This process is important to all professional licensure exams and is expected to be conducted periodically. Based on the results of this practice analysis, some modifications of the current content specifications will be implemented and consequently components of each section will be different from the current exam. These changes will be effective in 2010. In general, there will still be four independently scored sections (AUD, FAR, REG and BEC) for the 2010 Uniform CPA exam; however, some of the existing content topics will either be discarded from their current section or be moved to other exam sections. All essay items will be consolidated within the BEC section; thus, there will not be any writing prompts in the AUD, FAR or REG sections for the new exam. It is also possible that a simulation component will be introduced to the BEC section. More simulations will be

Linking Current and Future Score Scales for the AICPA Uniform CPA Exam 3
tested on the other three sections, but there will be fewer measurement opportunities related to each simulation. Making the simulations smaller in size means that more can be tested in each section and makes it possible to do more effective pilot testing of new ones. In addition, it is recommended that there be a separate cutscore for each component of the exam. The thinking is that a compensatory scoring model would still be applied, and the weighting for each component will be a policy decision to be made in 2010 prior to the launching of the new exam.
Given all these upcoming changes to the Uniform CPA exam, there are some major challenges the AICPA will need to overcome before launching the 2010 exam. Some questions to be addressed include:
1. Due to the changes in the content specifications, items are either deleted or being moved
across exam sections. Is it appropriate to link the 2010 multiple-choice component to the current MCQ scales? (The answer here is almost certainly yes since expected changes in the item content are generally minor.)
2. If linking needs to be performed across the two versions for the CPA exam, which
linking design should be used? And what would be the requirement for a robust linking condition? (The emphasis here will be on the MCQ scales.)
3. Currently, the simulation items are “anchored” or “linked” to the multiple-choice
component for the current exam, which places them onto the multiple-choice scale. Given the structural changes of the simulation component in the 2010 exam, is it appropriate to link to the previous version of the exam (and the MCQ scales) or is it more appropriate to begin a simulation score scale? (The expectation is that the simulations will be placed on their own scale.)
4. On each section of the exam, the passing score is set at the overall test level. However,
a decision has been made to at least explore obtaining separate cutscores for each test component (i.e., multiple-choice questions, simulations and essays). Valuable data have been collected continuously since the launching of the CBT exam in 2004. What would be the best way to utilize the existing information to derive separate cutscores by test component? (A plan is being developed by John Mattar and Ronald Hambleton and the preliminary plan has been approved by the Psychometric Oversight Committee.)
These are several of the questions that the AICPA is currently trying to answer.

Linking Current and Future Score Scales for the AICPA Uniform CPA Exam 4
Purpose of the Study
The purpose of the present study was to evaluate several equating designs and identify and investigate issues in linking the existing exams and the new exams based on item response theory (IRT), particularly for the multiple-choice sections. The study involved a review of the literature and practices to address the following questions as they relate to the AICPA Uniform CPA exam:
1. What are the most common IRT linking designs?
2. What are the practical issues that should be considered when selecting linking items?
3. What should be done to identify and handle aberrant linking items?
4. When two groups of examinees differ substantially in ability (as might happen when the new exam is put in place, at least for a short time), what are the best ways to carry out the linking? (This question is analogous to the issues involved in vertically equating tests.)
5. How do statistics of multiple-choice items change when they are being moved from one exam section to another?
6. To what extent can the pretest data be utilized before the launching of the new exam?
The focus of this report will be on questions 1 to 3, but some attention at the end of the report will be given to the remaining questions. These remaining questions will require empirical data for them to be answered fully.
Linking Current and Future Score Scales for the AICPA Uniform CPA Exam 5
1. Common IRT Linking Designs
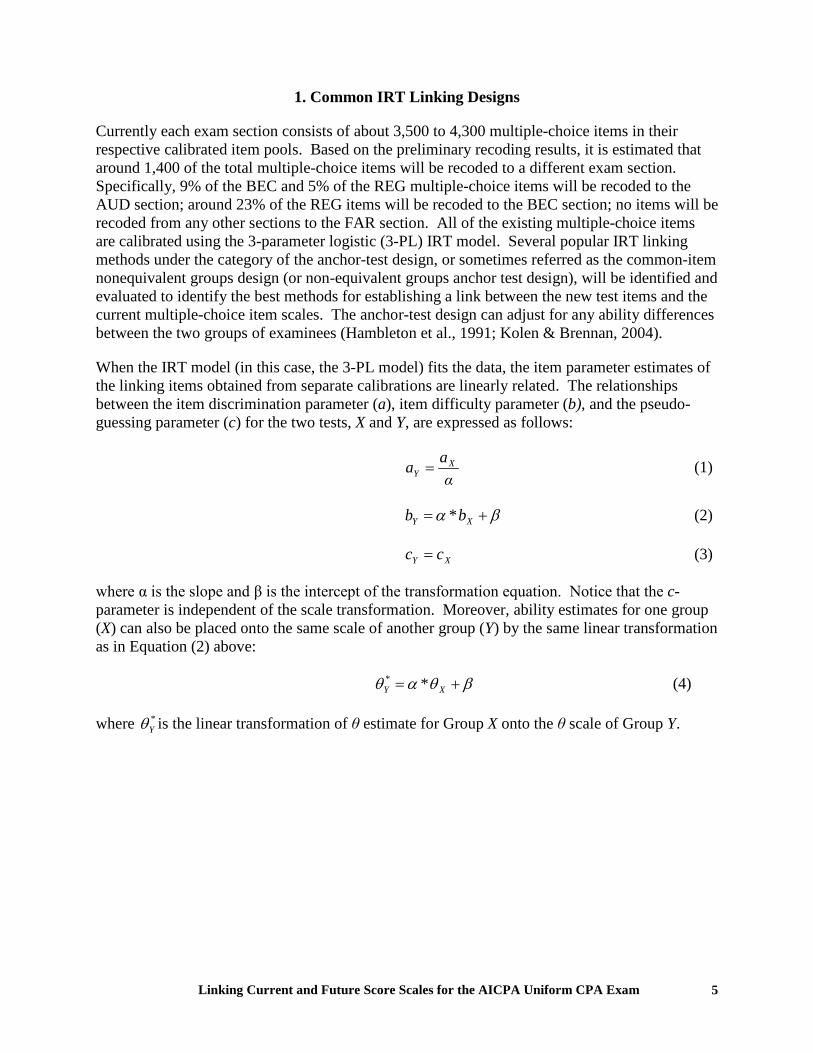
Currently each exam section consists of about 3,500 to 4,300 multiple-choice items in their respective calibrated item pools. Based on the preliminary recoding results, it is estimated that around 1,400 of the total multiple-choice items will be recoded to a different exam section. Specifically, 9% of the BEC and 5% of the REG multiple-choice items will be recoded to the AUD section; around 23% of the REG items will be recoded to the BEC section; no items will be recoded from any other sections to the FAR section. All of the existing multiple-choice items are calibrated using the 3-parameter logistic (3-PL) IRT model. Several popular IRT linking methods under the category of the anchor-test design, or sometimes referred as the common-item nonequivalent groups design (or non-equivalent groups anchor test design), will be identified and evaluated to identify the best methods for establishing a link between the new test items and the current multiple-choice item scales. The anchor-test design can adjust for any ability differences between the two groups of examinees (Hambleton et al., 1991; Kolen & Brennan, 2004).
When the IRT model (in this case, the 3-PL model) fits the data, the item parameter estimates of the linking items obtained from separate calibrations are linearly related. The relationships between the item discrimination parameter (a), item difficulty parameter (b), and the pseudo-guessing parameter (c) for the two tests, X and Y, are expressed as follows:
α
aa XY = (1)
βα += XY bb * (2)
XY cc = (3)
where α is the slope and β is the intercept of the transformation equation. Notice that the c-parameter is independent of the scale transformation. Moreover, ability estimates for one group (X) can also be placed onto the same scale of another group (Y) by the same linear transformation as in Equation (2) above:
βθαθ += XY ** (4)
where *Yθ is the linear transformation of θ estimate for Group X onto the θ scale of Group Y.

Linking Current and Future Score Scales for the AICPA Uniform CPA Exam 6
Mean and Mean (MM) Method
The MM method uses the average of the a- and the b-parameter estimates based on the common item sets to obtain the slope (α) and intercept (β) for the above linear transformation equations (Loyd & Hoover, 1980; as cited by Kolen & Brennan, 2004):
X
Y
aa
α = (5)
XY bb *αβ −= (6)
where Xa , Ya and Xb , Yb are the respective averaged a- and b-parameter estimates of the linking items from Test X and Test Y. Substituting Equation (5) and (6) into Equation (1), (2) and (4) above transforms the a-, b-parameters and also the ability estimates from Test X to Test Y.
Mean and Sigma (MS) Method
The MS method uses the mean and the standard deviation of the b-parameter estimates based on the common item sets to obtain the slope (α) and intercept (β) for the above linear transformation equations (Hambleton et al., 1991):
X
Y
ss
α = (7)
where Xs and Ys are the respective standard deviations of the b-parameter estimates for anchor items in Test X and Test Y.
The equation to obtain the intercept (β) is the same as in Equation (6). Linear transformation of the a-, b- and θ- estimates from Test X to Test Y is obtained by substituting Equation (6) and (7) into Equation (1), (2) and (4), respectively.
Robust Mean and Sigma Method
This method is similar to the MS method above, but it also takes into account the different standard errors associated with the parameter estimates (Linn et al., 1981; as cited by Hambleton et al., 1991). This method is further improved by an iterative procedure as suggested by Stocking and Lord (1983). Steps to perform Linn et al’s method are presented in the following:
Step 1: The diagonal element of the inverted information matrix corresponding to the item difficulty is the estimated variance of the b-parameter estimate. The dimension of the information matrix for a 3-PL model is 3x3; hence, the element corresponding to the item difficulty would be entry [2, 2].

Linking Current and Future Score Scales for the AICPA Uniform CPA Exam 7
Step 2: The weight for each pair of the common item, wi, is obtained by taking the inverse of the larger variance between the pair of b-parameter estimates ),( YX bb .
Step 3: The scaled weight for each pair of common item, 'iw , is then computed by the following
equation:
∑=
= k
ii
ii
w
ww
1
'
where k is the number of common items.
Step 4: Weighted estimates, 'Xb and '
Yb , of Xb and Yb , respectively, are computed by
ii XiX bwb '' = and
ii YiY bwb '' =
Then, the mean and standard deviation of 'Xb and '
Yb are determined and the α and β are obtained based on the same method as in the MS method using these weighted estimates.
The Stocking and Lord (1983) iterative procedure continues with the following steps. These equations are adopted from the original Stocking and Lord (1983) paper.
Step 5: Compute the Tukey’s weights (Mosteller & Tukey, 1977; cited in Stocking and Lord, 1983), iT , for each common item using the following equation:
<
−=
otherwiseS
DS
DT
ii
i
,0
1*6
if ,*6
1222
where iD is the perpendicular distance of the common item to the transformation line, βα += '' * XY bb , and S is the median of iD
Step 6: Reweight each point by a combined weight, iU :
i
k
iii
iii
TW
TWU*
*
∑=
=
Linking Current and Future Score Scales for the AICPA Uniform CPA Exam 8
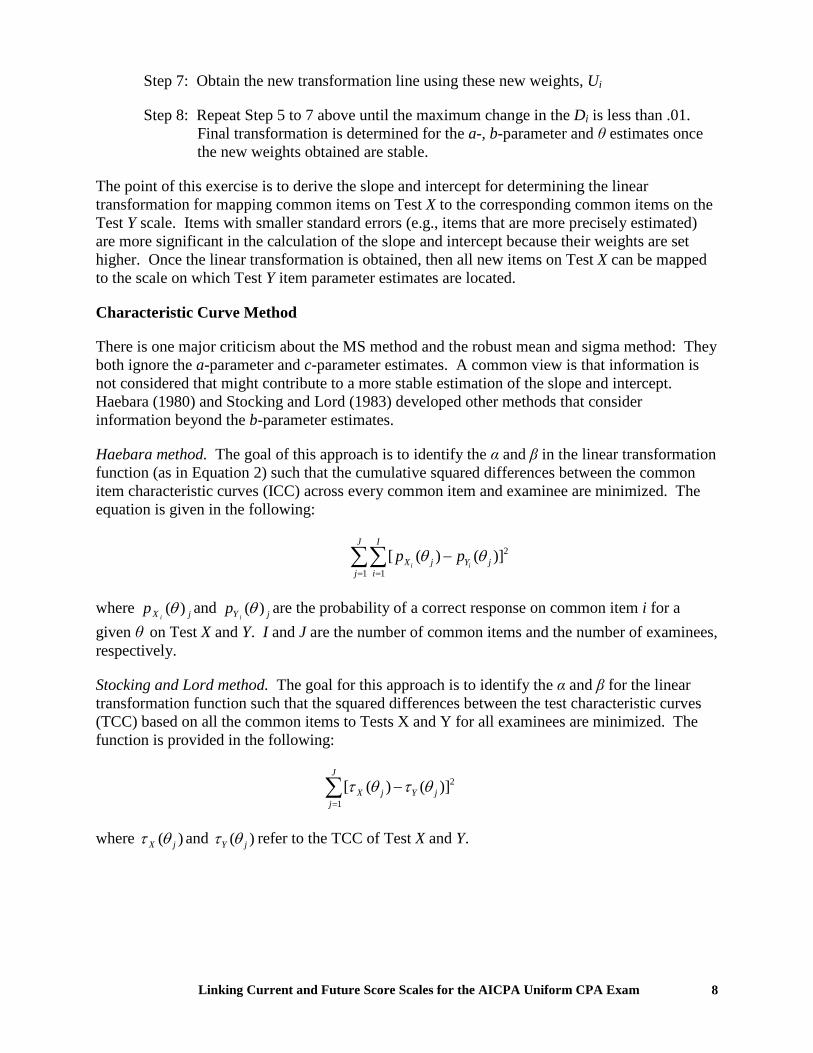
Step 7: Obtain the new transformation line using these new weights, Ui
Step 8: Repeat Step 5 to 7 above until the maximum change in the Di is less than .01. Final transformation is determined for the a-, b-parameter and θ estimates once the new weights obtained are stable.
The point of this exercise is to derive the slope and intercept for determining the linear transformation for mapping common items on Test X to the corresponding common items on the Test Y scale. Items with smaller standard errors (e.g., items that are more precisely estimated) are more significant in the calculation of the slope and intercept because their weights are set higher. Once the linear transformation is obtained, then all new items on Test X can be mapped to the scale on which Test Y item parameter estimates are located.
Characteristic Curve Method
There is one major criticism about the MS method and the robust mean and sigma method: They both ignore the a-parameter and c-parameter estimates. A common view is that information is not considered that might contribute to a more stable estimation of the slope and intercept. Haebara (1980) and Stocking and Lord (1983) developed other methods that consider information beyond the b-parameter estimates.
Haebara method. The goal of this approach is to identify the α and β in the linear transformation function (as in Equation 2) such that the cumulative squared differences between the common item characteristic curves (ICC) across every common item and examinee are minimized. The equation is given in the following:
2
1 1[ ( ) ( )]
i i
J I
X j Y jj i
p pθ θ= =
−∑∑
where jX ip )(θ and jY i
p )(θ are the probability of a correct response on common item i for a given θ on Test X and Y. I and J are the number of common items and the number of examinees, respectively.
Stocking and Lord method. The goal for this approach is to identify the α and β for the linear transformation function such that the squared differences between the test characteristic curves (TCC) based on all the common items to Tests X and Y for all examinees are minimized. The function is provided in the following:
2
1[ ( ) ( )]
J
X j Y jj
τ θ τ θ=
−∑
where ( )X jτ θ and ( )Y jτ θ refer to the TCC of Test X and Y.
Linking Current and Future Score Scales for the AICPA Uniform CPA Exam 9
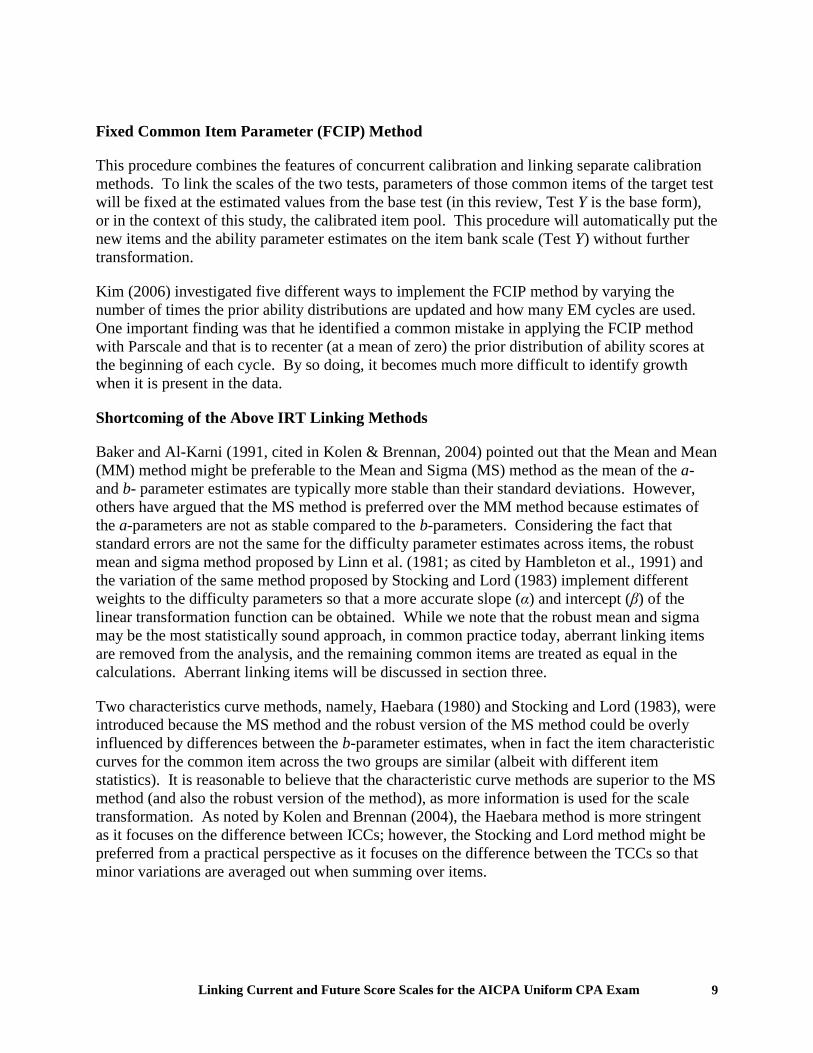
Fixed Common Item Parameter (FCIP) Method
This procedure combines the features of concurrent calibration and linking separate calibration methods. To link the scales of the two tests, parameters of those common items of the target test will be fixed at the estimated values from the base test (in this review, Test Y is the base form), or in the context of this study, the calibrated item pool. This procedure will automatically put the new items and the ability parameter estimates on the item bank scale (Test Y) without further transformation.
Kim (2006) investigated five different ways to implement the FCIP method by varying the number of times the prior ability distributions are updated and how many EM cycles are used. One important finding was that he identified a common mistake in applying the FCIP method with Parscale and that is to recenter (at a mean of zero) the prior distribution of ability scores at the beginning of each cycle. By so doing, it becomes much more difficult to identify growth when it is present in the data.
Shortcoming of the Above IRT Linking Methods
Baker and Al-Karni (1991, cited in Kolen & Brennan, 2004) pointed out that the Mean and Mean (MM) method might be preferable to the Mean and Sigma (MS) method as the mean of the a- and b- parameter estimates are typically more stable than their standard deviations. However, others have argued that the MS method is preferred over the MM method because estimates of the a-parameters are not as stable compared to the b-parameters. Considering the fact that standard errors are not the same for the difficulty parameter estimates across items, the robust mean and sigma method proposed by Linn et al. (1981; as cited by Hambleton et al., 1991) and the variation of the same method proposed by Stocking and Lord (1983) implement different weights to the difficulty parameters so that a more accurate slope (α) and intercept (β) of the linear transformation function can be obtained. While we note that the robust mean and sigma may be the most statistically sound approach, in common practice today, aberrant linking items are removed from the analysis, and the remaining common items are treated as equal in the calculations. Aberrant linking items will be discussed in section three.
Two characteristics curve methods, namely, Haebara (1980) and Stocking and Lord (1983), were introduced because the MS method and the robust version of the MS method could be overly influenced by differences between the b-parameter estimates, when in fact the item characteristic curves for the common item across the two groups are similar (albeit with different item statistics). It is reasonable to believe that the characteristic curve methods are superior to the MS method (and also the robust version of the method), as more information is used for the scale transformation. As noted by Kolen and Brennan (2004), the Haebara method is more stringent as it focuses on the difference between ICCs; however, the Stocking and Lord method might be preferred from a practical perspective as it focuses on the difference between the TCCs so that minor variations are averaged out when summing over items.

Linking Current and Future Score Scales for the AICPA Uniform CPA Exam 10
Although the FCIP method is a popular linking procedure (especially when the Rasch model is used), there are many practical issues that could affect the robustness of the method. For example, items could be removed from the item pool over time due to content changes or for security purposes, and item estimates could be affected. Moreover, when items are being administered repeatedly, updating the parameter estimates in the bank might be necessary (Kolen & Brennan, 2004). The FCIP method could be risky in some cases because no check is made to see whether the item statistics remain the same over time in its routine application. However, we are aware that the AICPA has a procedure that checks the item statistics for items that are being administered in every testing window. In addition, a bank recalibration is performed after several years. The implementation of the above procedures would resolve concerns regarding the drift in item statistics over time.
Evaluation of the IRT Linking Methods
As illustrated in the previous review, several methods are available for linking different tests to a common scale, but it is often uncertain which method is best in a particular situation. In the context of linking via IRT, several criteria for evaluating a linking study have been proposed. In this section, we review criteria for evaluating IRT-based linking studies.
a. How well do the methods do near the cutscore?
One practical suggestion for evaluating different options to conduct a linking is to look at the effects of different linking strategies on how examinees are classified by a test. If the different methods provide similar classifications of examinees, and lead to similar estimates of decision consistency or accuracy, they can be considered equally appropriate. However, where differences occur, the methods that produce more accurate or consistent results may be preferred.
Baldwin et al. (2007) examined the classification accuracy rates of the five IRT linking methods reviewed above: MM, MS, two characteristic curve methods (Haebara and Stocking and Lord) and the FCIP, using simulated data of a mixed item format test. They examined three different ability distribution conditions: fixed distribution at N (0,1), mean-shift distribution, and the negatively skewed, over four testing administrations. In general, their results showed that when there is no growth (i.e. no change in the ability distributions over time), misclassification rates are similar across the five methods for both short anchor test (20% of total test length) and long anchor test (30% of total test length) conditions. However, the FCIP method tended to have higher misclassification rates when the amount of growth increased (i.e. mean-shift condition) or when the ability distributions were skewed. Moreover, longer anchor tests resulted in smaller misclassification rates. The issue of higher misclassification rates due to the choice of the FCIP linking method might not be a concern to the AICPA as they closely monitored the behavior of those items that are being administered in every testing window and performed bank recalibration every several years. In addition, errors noted by Kim (2006), would not be made in the application of the FCIP linking method as they have been made in some of the recent research studies using the marginal maximum likelihood estimation. When the corrections are made, the problem of underestimation can be eliminated or substantially reduced (see, for example, Keller, Hambleton, Parker, & Copella, 2009).
b. Similarity of score distributions

Linking Current and Future Score Scales for the AICPA Uniform CPA Exam 11
Tong and Kolen (2005) also provided criteria for evaluating a linking study. First, they suggested checking the similarity of the scale scores distributions between the base test form and the new test form after the implementation of the linking procedure by using the nonparametric Kolmogorov T statistic. They reasoned that this is a powerful statistic that could detect distributional differences. In addition, they also suggested practitioners to check whether the first-order and the second-order equity properties hold. The first-order equity refers to whether examinees have the same expected scale score on the two forms, and the second-order equity refers to whether examinees have the same conditional standard error of measurement on the two forms, both conditional on the true score.
Using simulated data, they found there was a positive relationship between the similarity of forms and how well the equity properties hold. To preserve all the properties, the two forms to be linked should be very similar in difficulty.
c. Population invariance
Dorans and Holland (2000), Dorans (2002), and Kolen and Brennan (2004) proposed the use of “population invariance” as a criterion for evaluating the results of equating. Using this criterion, tests are considered equitable to the extent that the same equating function is obtained across important subgroups of the examinee population. To evaluate population invariance, separate equatings are done using the data for the entire population (i.e., the typical equating procedure) and using only the data for the subgroup of interest. Invariance can be assessed by looking at differences in achievement level classifications (Wells et al., 2007) across the two equatings, differences in test form concordance tables (Wells et al. 2007), or by computing the root mean square difference (or the root expected mean square difference) between the two equating functions (Dorans, 2004b). When item response theory (IRT) is used, as is the case with the CPA Exam, differences between the separate test characteristic curves computed from different populations such as examinees in different test administration windows or regions of the country, could be used to evaluate invariance.
Test reliability has an influence on population invariance. Brennan (2008) made three observations based on a recent review of articles that are all related to population invariance (p. 104):
1. Carefully constructed alternative forms with equal reliability are (nearly) population invariant
2. Population invariance requires sufficient reliability, and
3. Tests that measure the same construct but whose scores have different reliabilities tend not to be population invariant.
Thus, the degree to which the old and forthcoming forms of the CPA Exam differ with respect to score reliability and construct equivalence is likely to determine the degree to which the linking functions will be invariant across sub-populations of interest.

Linking Current and Future Score Scales for the AICPA Uniform CPA Exam 12
2. Factors in Selecting Linking Items
In this study, we will concentrate on the anchor-test based procedure (i.e., using common items) with the nonequivalent groups design. In this design, there are two groups of examinees, P, and Q, who took test X and Y, respectively. In addition to test X and Y, there also exist a common set of items, C, which is taken by the two groups of examinees. Examinees’ performance on the linking item set will be used to disentangle the differences in test difficulty and the examinees’ ability. There are two types of common items. When the common items contribute to the examinee’s total score, they are referred as internal links; otherwise, they are referred as external links. As noted by Kolen (2007), test X and Y are typically somewhat different in content and are administered under different measurement conditions from samples that are different than the population, as a result, not much statistical control could be implemented. Hence, the quality of the linking results will likely depend on test content, different measurement conditions and samples of examinees used for the linking procedure. This situation matches that to be faced by the AICPA since the content of exam sections will not be strictly parallel across the old and new versions of the exam, and we will not know if the candidates who take the different exams are of similar proficiency.
There are a number of factors that should be considered when selecting linking items as they all contribute to the quality of the linking result. For example, the number of linking items used; the characteristics of these linking items; the content and statistical representativeness of the common items; and sample size requirements. These factors will be discussed next. Each has been extensively studied in the equating literature.
a. Number of Linking Items
A rule of thumb suggested by many researchers (see for example, Hambleton et al., 1991; Kolen & Brennan, 2004) is that the number of linking items should be at least 20% to 25% of the total number of items in the tests (that have 40 items or more). Another recommendation by Angoff (1971, as cited by Huff & Hambleton, 2001) is that the linking set should consist of no fewer than 20 items or no fewer than 20 percent of the number of items in Form X and Y, whichever number of items is larger. At the same time, the decision on how many common items are suitable should be based on both content and statistical grounds. Klein and Kolen (1985) found that when two groups of examinees are similar in their ability, length of the anchor test had little effect on the quality of the linking result. However, when different ability groups were used, the length of the anchor test did make a difference. Generally, more linking items will result in more accurate equating when the two groups of examinee are dissimilar. In addition, short linking tests tend to result in unreliable scores and the correlation between the anchor tests and the total test will be lower than desired (Petersen, 2007).
b. Characteristics of Linking Items: Content and Statistics
Angoff (1987) pointed out that “when the two groups are not randomly equivalent, then only an anchor test that is parallel to X and Y can give trustworthy results” (p. 292). Kolen and Brennan (2004) also indicated “when using the common-item nonequivalent groups design, common-item sets should be built to the same specifications, proportionally, as the total test if they are to reflect group differences adequately. In constructing common-item sections, the sections should be long enough to adequately represent test content” (p. 271). To check if the two tests are

Linking Current and Future Score Scales for the AICPA Uniform CPA Exam 13
measuring the same construct, their specifications should be compared for both content and statistical equivalence.
Checking for content equivalence could be done by comparing the test specifications, which include checking on the total number of items, different item types, number of items for each item type, and item content. Statistical equivalence is ensured by the similar mean, standard deviation of the linking sets and those obtained from the total test. Moreover, the correlation of the linking items should be high with the total test forms.
It is important not to have common items that are too easy for one group and too difficult for the other because parameter estimates obtained from the two calibrations could be very different (because of sampling errors) which would eventually cause poor results in linking. In addition, the mean difficulty of the anchor tests should be close to the tests to be equated (Petersen et al., 1982; Holland, 2007). Context effects would also affect the functionality of linking items. For example, some researchers suggest that common items should be placed in approximately the same position in the old and new test forms (see for example, Cook & Petersen, 1987; Kolen, 1988; Kolen & Brennan, 2004), although this suggestion is certainly more problematic in an adaptive testing context. The role of positioning of linking items has become an ever increasing concern of testing agencies, and with research indicating that the issue is much more important than has been assumed. Researchers have also suggested that item stems and alternatives for common items should be the same and appear in the same order across the two forms (Brennan & Kolen, 1987; Cizek, 1994; cited in Kolen & Brennan, 2004).
Studies have suggested that linking results could be improved if the common item sets are content and statistically representative of the two tests (see for example, Cook et al., 1988; Klein & Jarjoura, 1985; Peterson et al., 1982). Content representation of the common items is especially important when the examinee groups differ in ability level. Klein and Jarjoura (1985) noted that “when nonrandom groups in a common-item equating design perform differentially with respect to various content areas covered in a particular examination, it is important that the common items directly reflect the content representation of the full test forms. A failure to equate on the basis of content-representative anchors may lead to substantial equating error” (p. 205).
In addition, anchor test scores that exhibit a high correlation with total test scores is another criterion for a good anchor test, as suggested by a number of researchers (see for example, Angoff, 1971; Budescu, 1985; Dorans et al, 1998; Petersen et al., 1989; von Davier et al., 2004; as cited by Sinharay & Holland, 2006).
Recent studies by Sinharay and Holland (2006, 2007, 2008) suggest relaxing the parallelism of the statistical representation between the anchor test and the equated tests. Practically, it is very difficult to construct an anchor test that represents a mini version of the total test, as one of the requirements of the anchor test is to include very difficult or very easy items to ensure adequate spread of item difficulties. Typically, such items are discarded from the item bank due to poor statistical properties (e.g.: low discrimination). Therefore, anchor tests that have a more relaxed requirement on the spread of the item difficulties might be more operationally convenient.
Sinharay and Holland (2006) proposed two other versions of anchor tests that are still proportionally content representative to the tests to be equated, but only consist of linking items of medium difficulty (as referred as miditest) and linking items with spread of item difficulties

Linking Current and Future Score Scales for the AICPA Uniform CPA Exam 14
between the overall test and the miditest (as referred as semi-miditest). Their results suggested that the correlation between the semi-miditest and the total test are almost as high as the correlation between the miditest and the total test; in fact, the correlation of these two new versions of anchor tests are always higher than the averaged correlation of the minitest to the total test. As they explained in their results, this finding is useful as the miditest might be more difficult to obtain than the semi-miditest operationally. Since results obtained from internal and external anchors based on simulations are the same, their final recommendation is to choose anchor test based on operational convenience. For internal anchor items, using minitest as an anchor might be more convenient because items with extreme difficulty could be used for linking the two tests. On the other hand, when using external anchors, more stress should be put on the content representation and average item difficulties of the linking item set.
c. Sample Size Requirements
Sample size requirements for the common-item nonequivalent linking design have not been widely studied, although a larger sample is always recommended to ensure the stability of equating result. For some designs it is possible to derive sampling errors for the parameters of the linear transformation so the impact of the sample size can be known. However, as stated by Harris and Crouse (1993), “an exact definition of “very large” has not been established and the efficacy of different criterion sample sizes has not been examined. Furthermore, a large sample equating does not necessarily provide the true equating results” (p. 232).
The rule of thumb for sample size requirements suggested by Kolen and Brennan (2004) is in the context of random groups design; they felt too that their suggestions are also applicable to the common-item nonequivalent groups design. For example, using the standard deviation unit as a criterion, under normality assumptions, the standard error of equating for the random groups design between z-scores of -2 to +2 was shown to be less than .10 raw score standard deviation unit when using samples of 400 per form.
Other researchers have suggested using around 700 to 1,500 examinees per form for equating under the three-parameter model; however a sample with the uniform distribution is better than a larger sample in a normal distribution because the uniform distribution provides more information for examinees in the tails of the distribution (see for example, Hambleton et al., 1991; Harris & Crouse; 1993; Reckase, 1979a). However, other factors should also be taken into account when deciding the sample size requirement, for instance, the shapes of the sample score distributions, the degree of equating precision required, and test dimensionality. If the principle interest is on a particular score or score range for making high stake decisions (a common scenario in licensure or certification exams), then the primary concern should be put on the precision at the passing score. Brennan and Kolen (1987) suggested that for this situation, the best approach is to pick equating procedures that concentrate on the region around the cutscore, even at the potential expense for poorer equating result obtained at other scores. This seems like a good rule to follow for organizations such as the AICPA.
3. Aberrant Linking Items
Several suggestions for determining whether the common items are functioning differently between the two groups have been provided in the literature. Both IRT and classical statistics

Linking Current and Future Score Scales for the AICPA Uniform CPA Exam 15
can be used (see for example, Hambleton et al., 1991; Kolen & Brennan, 2004). Kolen and Brenan suggested comparing classical item difficulties (p-values) of the common items. If the p-value difference of a common item is bigger than .10 in absolute value, then further inspection should be made to decide whether dropping the item from the linking set is necessary. Delta values and perpendicular distance are routinely considered by organizations such as ETS (Huff & Hambleton, 2001). Hambleton et al. (1991) suggest checking the performance of the common items based on delta values as the p-values are ordinal measurements and their plot tends to be curvilinear because of this. Deltas, in principle, will be linearly related, and outliers can be spotted with a rule of thumb. For example, if the difference between the two delta values for any given item is substantially larger than the average difference between pairs of delta values, then the item is differentially functioning and is considered an outlier.
Using the IRT statistics, a- b-, and c-parameter estimates of the common items can be plotted against each other to look for outliers. Items that are more than two or three standard errors from the major axis line are closely investigated to determine the reason for the differential functioning between forms (Huff & Hambleton, 2001). If the difference in performance was due to a change in item presentation, or increased/decreased emphasis in the curriculum on the skill or knowledge measured by that item, then the item is deleted from the anchor set. If there’s no reason can be inferred from the differential functioning, then the appropriate course of action is less obvious. The general recommendation is usually to retain all anchor items unless there is a compelling reason to suggest that the item in question has been changed in some important way between the two administrations. However, in practice, scaling should be done in both ways, excluding aberrant linking items and including them in the scaling process, and results obtained from each should be compared. The practical consequence of aberrant item deletion is best known prior to deciding whether or not to exclude items.
After aberrant common items are dropped from the original linking set, the “new” common item set might not fully represent the test specifications. In this case, additional linking items might need to be dropped to maintain the content balance. Therefore, the length of the linking test should be long enough to tolerate removal of some items during the equating process so that items remaining in the anchor test still adequately represent the content and statistical specifications. Other research has suggested alternative ways to achieve proportional content balance of the common item set, Harris (1991; as cited by Kolen & Brennan, 2004) suggested using different weights for item scores in the common item set to achieve the content balance. A recent study by Hu et al. (2008) indicated that there is an interaction effect between the equating methods, group equivalence, and also the number and scores of the outliers contributed to the total test. Under the nonequivalent groups (NX(0,1) and NY(1,1)) design, Stocking and Lord characteristic curve and MS transformation work best when outliers were excluded; however the robust mean and sigma method was not recommended in the Hu et al. research.
4. Linking Using Different Ability Samples
Since the CPA Exam can be taken many times during a given year, there are concerns about the seasonal variations in candidates’ performance on the exam and how these differences may
Linking Current and Future Score Scales for the AICPA Uniform CPA Exam 16
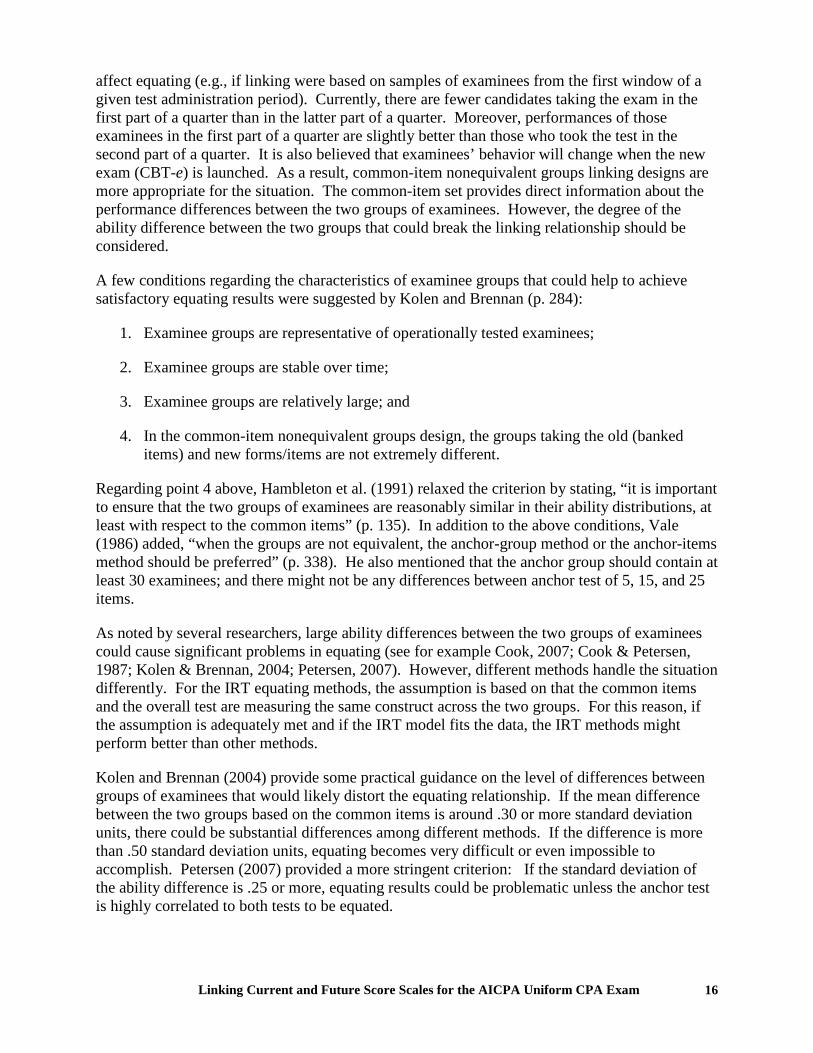
affect equating (e.g., if linking were based on samples of examinees from the first window of a given test administration period). Currently, there are fewer candidates taking the exam in the first part of a quarter than in the latter part of a quarter. Moreover, performances of those examinees in the first part of a quarter are slightly better than those who took the test in the second part of a quarter. It is also believed that examinees’ behavior will change when the new exam (CBT-e) is launched. As a result, common-item nonequivalent groups linking designs are more appropriate for the situation. The common-item set provides direct information about the performance differences between the two groups of examinees. However, the degree of the ability difference between the two groups that could break the linking relationship should be considered.
A few conditions regarding the characteristics of examinee groups that could help to achieve satisfactory equating results were suggested by Kolen and Brennan (p. 284):
1. Examinee groups are representative of operationally tested examinees;
2. Examinee groups are stable over time;
3. Examinee groups are relatively large; and
4. In the common-item nonequivalent groups design, the groups taking the old (banked items) and new forms/items are not extremely different.
Regarding point 4 above, Hambleton et al. (1991) relaxed the criterion by stating, “it is important to ensure that the two groups of examinees are reasonably similar in their ability distributions, at least with respect to the common items” (p. 135). In addition to the above conditions, Vale (1986) added, “when the groups are not equivalent, the anchor-group method or the anchor-items method should be preferred” (p. 338). He also mentioned that the anchor group should contain at least 30 examinees; and there might not be any differences between anchor test of 5, 15, and 25 items.
As noted by several researchers, large ability differences between the two groups of examinees could cause significant problems in equating (see for example Cook, 2007; Cook & Petersen, 1987; Kolen & Brennan, 2004; Petersen, 2007). However, different methods handle the situation differently. For the IRT equating methods, the assumption is based on that the common items and the overall test are measuring the same construct across the two groups. For this reason, if the assumption is adequately met and if the IRT model fits the data, the IRT methods might perform better than other methods.
Kolen and Brennan (2004) provide some practical guidance on the level of differences between groups of examinees that would likely distort the equating relationship. If the mean difference between the two groups based on the common items is around .30 or more standard deviation units, there could be substantial differences among different methods. If the difference is more than .50 standard deviation units, equating becomes very difficult or even impossible to accomplish. Petersen (2007) provided a more stringent criterion: If the standard deviation of the ability difference is .25 or more, equating results could be problematic unless the anchor test is highly correlated to both tests to be equated.

Linking Current and Future Score Scales for the AICPA Uniform CPA Exam 17
Using a mixed item format test, Han, Li, and Hambleton (2005) showed that even when test forms are strictly parallel, if there are sizable ability differences (averaged ability difference between the two groups based on the common items is .50 or 1.0 standard deviation unit) between the equating samples, the FCIP method tended to underestimate the abilities of the more capable examinees. The largest equating error can be up to 9% of the total raw score point. On the other hand, equating results obtained based on the MS and the Stocking and Lord method for the same condition were better, the largest equating error was about 4% to 6% of the total raw score point for the two methods. They suggested that equating should not be done when the ability differences between the two groups are as large as was simulated in their study.
In a recent study by Keller et al. (2008), they investigated the sustainability of three equating methods (FCIP-1, FCIP-2, and the Stocking and Lord method) across four administrations of a large scale assessment. The situation they investigated is similar to that faced by the AICPA. They were interested in capturing growth across parallel forms of a state achievement test over time, which is similar to accounting for differences in proficiency across groups taking parallel forms. The difference between the FCIP-1 method and the FCIP-2 method is that the former does not update the prior ability distribution after each EM-cycle of the calibration, while the FCIP-2 method does update the distribution after each EM-cycle of the calibration. Their results showed that the FCIP-2 and the Stocking and Lord methods produced more accurate results in assessing both consistent and differential growth, compared to the FCIP-1 method. In addition, these two methods had higher classification accuracy rates than the FCIP-1 method. For FCIP-2, the misclassification tended to be slightly underestimated whereas for the Stocking and Lord method, it was slightly overestimated.
5. Impacts on Moving Test Items across Different Sections
As mentioned in the previous section, it was determined that the content of some multiple-choice items will be recoded to a different exam section. Therefore, it is important to assess the changes in item parameter estimates for items that are moving from one section to another. An ongoing research study about this issue is being conducted by the AICPA examination team (Chuah & Finger, 2008). Based on the preliminary results of the study, it was decided that the FCIP linking design will be implemented so that the parameter estimates for items that are moving away from their original exam section will be recalibrated and placed onto the same scale to those that are in the other exam section. This is done by fixing item parameters for items that exist in the calibrated item pool of the target test, while items that are being moved from other section will be recalibrated using a 3-PL IRT model.
To properly implement the IRT model, several model assumptions should be checked. One of the most fundamental assumptions is unidimensionality, which means only one ability trait is being measured by the items in the test. This assumption cannot be met strictly in reality because other factors also contribute to the test performance, for example, level of motivation or test anxiety; therefore, if the data exhibit a dominant component or factor, it is considered that the unidimensionality assumption is being met adequately (Hambleton et al., 1991). The unidimensionality assumption is especially important for adaptive tests, as in the case of the CPA Exam, since the adaptive features rely heavily on IRT models to estimate test scores. As a result, a proper use of the IRT model is required for the production of valid test scores.

Linking Current and Future Score Scales for the AICPA Uniform CPA Exam 18
Although there is no direct way to determine if the IRT assumptions are being met completely, indirect evidence can be collected and assessed through various dimensionality analyses. Several different methods have been developed for dimensionality analysis through years of research. Hattie (1985) reviewed over 30 indices for the assessment of unidimensionality. Since then, newer methods have been proposed. Some of the popular dimensionality analyses methods include linear factor analysis, non-linear factor analysis (NLFA), principle component analysis, IRT-based indexes, structural equation modeling (SEM), Stout’s test of essential unidimensionality (i.e.: the DIMTEST), and multidimensional scaling (MDS).
Even with the extensive methods and software packages available to check dimensionality, it still remains difficult to assess the dimensionality of adaptive tests due to two major reasons. First, the best approach to conduct a dimensionality analysis is during model selection and item calibration stage; however, a pre-calibrated item pool is necessary for any CAT design. Therefore, dimensionality analysis can only be done as a post hoc analysis. Secondly, due to the nature of the CAT test design, there are inherent problems in the data that can prohibit carrying out the dimensionality analysis in a “usual” way. These problems include large amounts of non-random missing data or relatively small numbers of examinees per test item even when the total number of examinees participating in the testing may be quite large. In addition, examinees being tested typically have more restricted ranges of proficiency due to the adaptive nature of the test. Several popular methods for dimensionality analysis will be discussed in the following section.
Bejar’s Analysis
Bejar’s (1980) method involves multiple calibrations for a set of items and involves including different sets of items in each calibration. The current availability of DIMTEST and other dimensionality detection methods has decreased the use of this method, but the unique features involved with the new CPA Exam (i.e., moving items across sections) increases the applicability of this procedure for evaluating the dimensionality of the forthcoming exams. Bejar’s analysis of unidimensionality involves four steps:
Step 1: Identify the subset of items that might be measuring a different trait from the total test. (For the CPA Exam, these would be the items being moved from one section to another.)
Step 2: Calibrate the total set of items using a 3-PL model. (For the CPA Exam, in the context of the section to which they were moved)
Step 3: Calibrate the subset items that are identified in Step 1 with a 3-PL model. (For the CPA Exam, in the context of the section where they were originally calibrated)
Step 4: Compare the b-parameter estimates obtained from Step 2 and Step 3 above by plotting them against each other to determine the extent to which the two sets are linearly related.
Bejar (1980) suggested that this method is most useful when the researchers are able to postulate the nature of departure from unidimensionality. Bejar’s rationale was that parameter estimates obtained from the total test and a subset of items from one content area should be indifferent, aside from sampling error, if the data are truly unidimensional. However, if parameter estimates

Linking Current and Future Score Scales for the AICPA Uniform CPA Exam 19
obtained from the total test are different than those parameter estimates based on a subset of items from a content area, it means there is a unique component that is germane to that content area.
In addition to comparing the difficulty parameter estimates, Bejar’s method could also be accomplished by using the discrimination (a-) and pseudo-guessing (c-) parameter estimates obtained from Step 2 and Step 3 above. However, as the estimates of the b-parameter are more stable than a- and c-parameters, the result of unidimensionality analysis might be confounded with the accuracy of the estimation of the a- and c- parameters.
Step 5: Compute the principle axis line. If the principle axis coincides with the major axis (i.e. a reference line drawn from the origin through the plane at a 45-degree angle), unidimensionality is supported. The slope (α) of the major axis is 1 and the intercept (β) is 0. α and β for the principle axis line is calculated by the following equations:
( ) ( )12
212
221
22
21
*2*4
σσσσσσ
α+−±−
=
21 YY αβ −=
where 21σ and 2
2σ are the variance of the difficulty estimates based on content area only, and the total test, respectively. 12σ is the covariance of the two sets of difficulty parameter estimates. 1Y and 2Y are the corresponding averaged difficulty parameter estimates. The decision on whether to add or minus the second term in the numerator should be made so that the slope will always be positive.
If the principal axis and the major axis differ in intercept but not in slope, the difference is most likely due to the random errors in the process of estimating the parameters. However, the unidimensionality assumption is violated when the two axes differ in slope.
Residual Analysis
This procedure includes fitting a unidimensional IRT model to the data, using model parameter estimates to predict the item performance and summarize the residuals. Residual analysis can act as a proxy of dimensionality study due to the large amount of missing data in CAT design. There are two types of residuals that can be obtained from the IRT model: Raw residual and standardized residual.
A raw residual is the difference between the observed item performance and the expected item performance based on the sample of examinees used in the calibration. And the equation to obtain raw residual is:
)( ijijij PEPr −=
where i refers to the item, j refers to the ability category, Pij refers to the observed proportion correct in the jth ability group for item i and E(Pij) refers to the expected proportion correct for item i in ability group j based on the IRT model.

Linking Current and Future Score Scales for the AICPA Uniform CPA Exam 20
The ability continuum is usually divided into equal width intervals for the calculation of residuals. The number of examinees in each interval should be large enough so that statistics obtained would be stable. However, on the other hand, examinees within each interval should be homogeneous in their ability. Hambleton et al. (1991) recommended dividing the ability continuum into 10-15 intervals.
There are two ways to obtain the expected proportion correct for a given ability category once the number of ability intervals is decided. One way is to calculate the average of the probability of correct response using all examinees in the ability category; another way is taking the mid-point from the ability category as a representative value and calculates the probability of correct response from this mid-point θ value.
The standardized residual (SR) is an alternative for the residual analysis as there are criticisms that the raw residual does not take into account the sampling error associated with the expected proportion correct within an ability category. The SR is computed by dividing the raw residual by the standard error of the expected proportion correct, and the equation is as follows:
j
ijij
ijij
NPEPE
rz
)](1[*)( −=
where Nj is the number of examinees in ability group j. When the IRT model fits the data, the SR is expected to be small and approximately normally distributed with mean of 0 and standard deviation of 1.
Another approach to help in the interpretation of SR is to compare the distribution of SRs with those obtained from the simulated data. Assuming the item and ability estimates from the IRT model to be true, item response data can be generated and SRs for the simulated data can be obtained based on the above procedure. The distribution of SR based on simulated data serves as the baseline for the comparison. If the distribution of SRs based on the real data follows the distribution from the simulated data, then it can be concluded that the model fits the data. IRT residual analyses can be obtained by the ResidPlots-2 (Liang, Han, & Hambleton, 2008), which calculates raw and standardized residuals, and has many other descriptive and graphical indices that can be used to evaluate fit, including comparing residuals to those obtained from data simulated to fit the IRT model.
In the context of the CPA Exam, model fit can be checked for those linking items based on their original parameter estimates from their original section and how they fit after they are moved to another section. If the fit is poor, this might suggest that the item statistics from the old section are problematic and should be recalibrated in the new section.
Linking Current and Future Score Scales for the AICPA Uniform CPA Exam 21
Eigenvalue Plots
An eigenvalue plot is one of the most popular ways to assess the dimensionality of a dataset, as the procedure is available in many statistical software packages. Previous research suggested several criteria to determine if the data are unidimensional. One of the indications of unidimensionality is that the first eigenvalue is four or five times bigger than the second eigenvalue. Reckase (1979b) proposed that if the first eigenvalue accounts for 20% or more of the variance, then the data have a dominant first factor. Lord (1980) suggested if the ratio of the first eigenvalue and the second eigenvalue is substantially bigger than the ratio of the second eigenvalue to the others, then unidimensionality exists. Due to the CAT nature of the CPA exam, this method might be problematic due to the sparse data matrix. Imputing data is always possible, but in this instance, the amount of data missing will be very large.
Multidimensional Scaling (MDS)
The use of multidimensional scaling (MDS) for assessing test dimensionality is relatively new, but appears promising. It is considered to be a non-linear alternative to linear factor analysis and it is designed to reveal the underlying structure of the data visually. The MDS procedure is readily available in many commercial statistical software packages such as SAS and SPSS.
Previous research has shown that the MDS approach is particularly useful in identifying the dimensionality of polytomous items using the Euclidean distances as measures of item proximity when compared to the results obtained from the exploratory and confirmatory factor analysis based on simulated data (De Ayala & Hertzog, 1991; as cited by Meara, Robin & Sireci, 2000). Using simulated data, Meara et al. (2000) investigated the utility of MDS approach in assessing the dimensionality of dichotomous items based on two different MDS indices. They found that MDS can adequately detect multidimensionality when there are a large number of items and the dimensions are not highly correlated. However, both MDS indices failed to identify multidimensionality when the dimensions were highly correlated, which is similar to results obtained from linear and non-linear factor analysis. When more than one dimension underlie the data, but are highly correlated, a single dimension may still be defensible for scoring examinees and scaling the items.
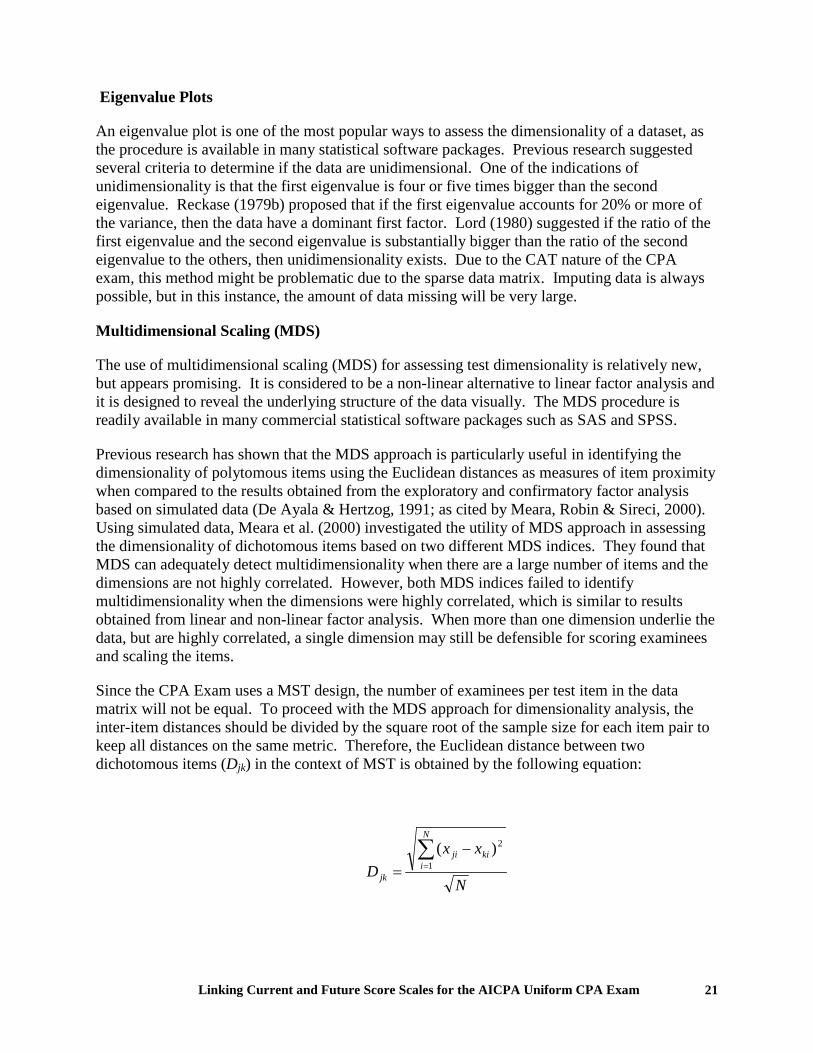
Since the CPA Exam uses a MST design, the number of examinees per test item in the data matrix will not be equal. To proceed with the MDS approach for dimensionality analysis, the inter-item distances should be divided by the square root of the sample size for each item pair to keep all distances on the same metric. Therefore, the Euclidean distance between two dichotomous items (Djk) in the context of MST is obtained by the following equation:
N
xxD
N
ikiji
jk
∑=
−= 1
2)(

Linking Current and Future Score Scales for the AICPA Uniform CPA Exam 22
where xji and xki refers to the scored response of examinees i to item j and item k, respectively. And N equals to the number of examinees who responded to both item j and item k.
Different numbers of dimensional solutions can be chosen for the analysis. Like other modeling approaches, the more dimensions in the MDS model, the better the statistical fit. Thus, the task for the researcher is to determine the point at which no substantive improvement in fit of the model to the data occurs. Each dimensional solution is typically evaluated based on the R2 and STRESS fit statistics, as well as on the interpretability of each dimension. Kruskal & Wish (1978) suggested it is important to examine the STRESS values from all n-dimensional configurations before choosing the appropriate dimensionality. From a plot of dimensionality versus STRESS, if the error level is small, the plot will show an “elbow” when the dimensionality used to describe the data equals the true dimensionality of the data. However, analysis of dichotomous item data often have moderate to high levels of error. Nevertheless, Kruskal and Wish provided a rule of thumb that data are unidimensional if the STRESS value for a one-dimensional solution is equal to or less than .15. Meara et al. (2000) lend some support to that criterion.
To perform the MDS analysis for the CPA exam, the dataset will need to be reorganized so that it will consist of examinees taking multiple sections of the exam. For example, to examine the dimensionality of the “new” AUD section, response data from examinees who have taken the AUD, BEC and REG section will be considered. The response data for this MDS analysis would include all items from the AUD section and those items from BEC and REG section that are going to move into the AUD section, based on the same examinees who have taken the three exams within a given testing period. Similarly, to examine the dimensionality of the “new” BEC section using the MDS analysis, response data from the BEC section (after eliminating those items that are moving into the AUD section) will be combined with those REG items that are determined to be moving into the BEC section taken by the same examinees. MDS analysis can then be performed using these datasets and decision of the number of dimensions of the two “new” tests could be determined based on fit and interpretability criteria as mentioned above.
Other Issues to Consider
Assuming the AICPA moves forward with their current plans to use FCIP in linking the current exam to the 2010 exam, there are still other issues that should be considered before the full implementation of the FCIP linking design. For example, the sample size for each item should be considered, especially the sample size of those additional test items that were moved from other exam section. When conducting a linking study, a larger sample is always preferred over a smaller sample, especially when the data are calibrated using the 3-PL model, as in the case for the CPA Exam. Previous research suggested having at least 700 to 1,500 examinees per form for equating when using a 3-PL model (Hambleton et al., 1991). Therefore, it is necessary to check the number of examinees taking each item in the item pool so that the stability of the item parameter estimates can be guaranteed and hence the stability of the linking results.
Moreover, due to small samples or violation of unidimensionality assumption, there could be a convergence problem when calibrating those additional items to the existing item bank. In addition, if the calibration program fails to estimate the c-parameter for those additional items, they could be fixed based on some conventional approach (for example, 1/(number of answer
Linking Current and Future Score Scales for the AICPA Uniform CPA Exam 23
choices)). Another method is to set priors to these additional items based on the averaged c-parameter from all the other items that exist in the item pool.
6. Utilization of the Pretest Data
Pretest data can be used to provide preliminary evaluation of aberrant linking items and also the dimensionality analyses as described in the previous section. Moreover, it can also be used as a check on the scaled score distribution between the existing and the upcoming CPA exam.
Discussion
This report was designed to address six questions the AICPA determined were important for evaluating their plans for scaling the new CPA Exam sections. In this section, we revisit these questions and, where appropriate, provide some recommendations based on our review of the literature.
1. What are the most common IRT linking designs?
We have reviewed six of the most commonly used IRT linking designs: Mean/Mean, Mean/Sigma, Robust Mean/Sigma, two characteristic curves methods (Haebara and Stocking and Lord methods), and the fixed common item parameter method. Each of the method has its own merit and its shortcomings. Several criteria in the evaluation of the IRT linking methods are also provided in the report.
2. What are the practical issues that should be considered when selecting linking items?
Three practical issues are reviewed in this report for the criterion in selecting linking items: number of linking items, content/statistical characteristics of the linking sets, and sample size requirements. A general recommendation for the number of linking items is that the number should not be less than 20 items or not fewer than 20 percent of the total number of items, whichever number of items is larger (Huff & Hambleton, 2001). Anchor item sets need to be built to the same content and format specifications as the total test (Kolen & Brennan, 2004). Furthermore, the statistical properties of the anchor set should approximate the properties of the total test. There should be 700 to 1,500 examinees per form for equating when using a 3-PL model (Hambleton et al., 1991).

Linking Current and Future Score Scales for the AICPA Uniform CPA Exam 24
3. What should be done to identify and handle aberrant linking items?
Research and practice in this area suggests comparing the parameter estimates for linking items based on separate calibrations for each group or form to be linked. This can be done using delta plots or plots of IRT parameters. A popular rule of thumb is to flag items that are three standard errors beyond the linear equating line based on predicting one set of parameters from the other. In such analyses, the direction of any aberrancy should be considered, since changes in item difficulty may balance out and have little or no effect at all on the link. The content representativeness of the link should also be considered before deleting any items. Items are candidates for deletion if they fall three standard errors from the linear equating line, their effects are not balanced by other items, and their deletion does not have a substantive effect on the representativeness of the anchor. When it is unclear whether items should be deleted from the anchor, we support Kolen’s and Brennan’s (2004) recommendation to conduct the linking both with and without the aberrant items to evaluate their effect and base the inclusion/exclusion decision on the practical impact of each option. Another suggestion is to follow Stocking’s and Lord’s robust mean-sigma approach, which essentially weights each linking item by its standard error. Items with larger standard errors receive lower weights and can be included in the link, since their effect will be minimized.
4. When two groups of examinees differ substantially in ability (as might happen when the new exam is put in place, at least for a short time), what are the best ways to carry out the linking?
This question is analogous to the issues involved in vertically equating tests. Based on the results of a recent study conducted by Keller et al. (2008), both the FCIP-2 and the Stocking and Lord methods produce higher classification accuracy rate and more accurate estimates of growth compared to the FCIP-1 method, with FCIP-2 slightly underestimating and Stocking and Lord slightly overestimating. Therefore, we would not recommend the FCIP-1 method (i.e. not updating the prior ability distribution after each EM-cycle) for linking the two exams. It is more appropriate to use either the FCIP-2 or the Stocking and Lord method for linking; however, due to the nature of the MST test design and complexity of the data, FCIP-2 would be easier to implement.
5. How do statistics of multiple-choice items change when they are being moved from one exam section to another?
At this juncture, it is difficult to predict what the effect of changing exam sections will be on the multiple-choice item statistics. Therefore, research will be needed to evaluate these effects. The method proposed by Bejar (1980) should be useful for these evaluations since they involve calibrating items with different sets of items in the calibration runs. The methods for evaluating aberrant items described in (3) above, are also relevant for evaluating these effects.
6. To what extent can the pretest data be utilized before the launching of the new exam?
The pretest data will be critical for evaluating the issues discussed in (3) and (5) above. When pretest data are available, we can begin evaluating the effect of changing exam

Linking Current and Future Score Scales for the AICPA Uniform CPA Exam 25
sections on multiple-choice item parameters, stability of item parameters across forms to be linked, and proficiency differences across older and newer CPA Exam candidates.
Summary
In this report, we investigated several issues that are important to the design and evaluation of the forthcoming CPA Exam. The research we reviewed provides guidance on how to approach and resolve specific issues in linking the score scales for the current exam to the new exam. However, in many cases, the guidelines are not unequivocal, and analysis of pilot test and other data will need to be conducted to inform the decisions to be made.

Linking Current and Future Score Scales for the AICPA Uniform CPA Exam 26
References
Angoff, W. H. (1987). Technical and practical issues in equating: A discussion of four papers. Applied Psychological Measurement, 11(3), 291-300.
Baldwin, S., Baldwin, P, & Nering, M. (2007, April). A comparison of IRT equating methods on recovering item parameters and growth in mixed-format tests. Paper presented at the meeting of the American Educational Research Association, Chicago, IL.
Bejar, I. I. (1980). A procedure for investigating the unidimensionality of achievement tests based on item parameter estimates. Journal of Educational Measurement, 17(4), 283-296.
Board of Examiners Examination Team. (2008). Exposure draft: Proposed content and skill specifications for the Uniform CPA Examination. Ewing, NJ: American Institute of Certified Public Accountants.
Brennan, R. L. (2008). A discussion of population invariance. Applied Psychological Measurement, 32(1), 102-114.
Brennan, R. L., & Kolen, M. J. (1987). Some practical issues in equating. Applied Psychological Measurement, 11(3), 279-290.
Chuah, C. S., & Finger, M. S. (2008). Impact of CSO changes on item calibration of multiple-choice items. Ewing, NJ: American Institute of Certified Public Accountants.
Cook, L. L. (2007). Practical problems in equating test scores: A practitioner’s perspective. In N. J. Dorans, M. Pommerich, & P. W. Holland (Eds.), Linking and aligning scores and scales (pp. 73-88). New York: Springer.

Linking Current and Future Score Scales for the AICPA Uniform CPA Exam 27
Cook, L. L., Eignor, D. R., & Taft, H. (1988). A comparative study of the effects of recency of instruction on the stability of IRT and conventional item parameter estimates. Journal of Educational Measurement, 25(1), 31-45.
Cook, L. L., & Petersen, N. S. (1987). Problems related to the use of conventional and item response theory equating methods in less than optimal circumstances. Applied Psychological Measurement, 11(3), 225-244.
Dorans, N. J. (2002). Recentering and realigning the SAT score distributions: How and
why. Journal of Educational Measurement, 39(1), 59 – 84.
Dorans, N. J. (2004). Using subpopulation invariance to assess test score equity. Journal
of Educational Measurement, 41(1), 43-68.
Dorans, N. J., & Holland, P. W. (2000). Population invariance and the equitability of tests: Basic theory and the linear case. Journal of Educational Measurement, 37(4), 281-306.
Haebara, T. (1980). Equating logistic ability scales by a weighted least squares method. Japanese Psychological Research, 22, 144-149.
Hambleton, R. K., Swaminathan, H., & Rogers, H. J. (1991). Fundamentals of item response theory. Newbury Park, CA: Sage.
Han, N., Li, S., & Hambleton, R. K. (2005, April). Comparing kernel and IRT equating methods. Paper presented at the meeting of the National Council on Measurement in Education, Montreal, Canada.
Harris, D. J., & Crouse, J. D. (1993). A study of criteria used in equating. Applied Measurement in Education, 6(3), 195-240.

Linking Current and Future Score Scales for the AICPA Uniform CPA Exam 28
Hattie, J. (1985). Methodology review: Assessing unidimensionality of tests and items. Applied Psychological Measurement, 9(2), 139-164.
Holland, P. W. (2007). A framework and history for score linking. In N. J. Dorans, M. Pommerich, & P. W. Holland (Eds.), Linking and aligning scores and scales (pp. 5-30). New York: Springer.
Hu, H., Rogers, W. T., & Vukmirovic, Z. (2008). Investigation of IRT-based methods in the presence of outlier common items. Applied Psychological Measurement, 32(4), 311-333.
Huff, K. L., & Hambleton, R. K. (2001). The detection and exclusion of differentially functioning
anchor items. (Center for Educational Assessment Research Report No. 415). Amherst, MA: University of Massachusetts, Center for Educational Assessment.
Keller, L. A., Hambleton, R. K., Parker, P., & Copella, J. (2008). MCAS equating research
report: An investigation of FCIP-1, FCIP-2, and Stocking and Lord equating methods (Center for Educational Assessment Research Report No. 690). Amherst, MA: University of Massachusetts, Center for Educational Assessment.
Kim, S. (2006). A comparative study of IRT fixed parameter calibration methods. Journal of Educational Measurement, 43(4), 355-381.
Klein, L. W., & Jarjoura, D. (1985). The importance of content representation for common-item equating with nonrandom groups. Journal of Educational Measurement, 22(3), 197-206.
Klein, L. W., & Kolen, M. J. (1985, April). Effect of number of common items in common-item equating with nonrandom groups. Paper presented at the meeting of the American Educational Research Association, Chicago.
Kolen, M. J. (1988). An NCME instructional module on traditional equating methodology. Educational Measurement: Issues and Practice, 7(4), 29-36.
Kolen, M. J. (2007). Data collection design and linking procedures. In N. J. Dorans, M. Pommerich, & P. W. Holland (Eds.), Linking and aligning scores and scales (pp. 31-55). New York: Springer.

Linking Current and Future Score Scales for the AICPA Uniform CPA Exam 29
Kolen, M. J., & Brennan, R. L. (2004). Test equating: Methods and practices (2nd ed.). New York: Springer.
Kruskal, J. B., & Wish, M. (1978). Multidimensional scaling. Newbury Park, CA: SAGE publications.
Liang, T., Han, K. T., & Hambleton, R. K. (2008). ResidPlots-2: Computer software for IRT graphical residual analyses, Version 2.0 [Computer Software]. Amherst, MA: University of Massachusetts, Center for Educational Assessment.
Lord, F. M. (1980). Applications of item response theory for practical testing problems. New York: Lawrence Erlbaum Publishers.
Meara, K., Robin, F., & Sireci, S. G. (2000). Using multidimensional scaling to assess the dimensionality of dichotomous item data. Multivariate Behavioral Research, 35(2), 229-259.
Petersen, N. S. (2007). Equating: Best practices and challenges to best practices. In N. J. Dorans, M. Pommerich, & P. W. Holland (Eds.), Linking and aligning scores and scales (pp. 59-72). New York: Springer.
Petersen, N. S., Marco, G. L., & Stewart, E. E. (1982). A test of adequacy of linear score equating models. In R. L. Linn (Ed.), Educational measurement (3rd ed., pp.221-262). New York: Macmillan.
Reckase, M. D. (1979a, April). Item pool construction for use with latent trait models. Paper presented at the meeting of the American Educational Research Association, San Francisco.
Reckase, M. D. (1979b). Unifactor latent trait models applied to multifactor tests: Results and implications. Journal of Educational Statistics, 4(3), 207-230.

Linking Current and Future Score Scales for the AICPA Uniform CPA Exam 30
Sinharay, S., & Holland, P. W. (2006). The correlation between the scores of a test and an anchor test (ETS Research Rep. No. RR-06-04). Princeton, NJ: Educational Testing Services.
Sinharay, S., & Holland, P. W. (2007). Is it necessary to make anchor tests mini-versions of the tests being equated or can some restrictions be relaxed? Journal of Educational Measurement, 44(3), 249-275.
Sinharay, S., & Holland, P. W. (2008). Choice of anchor test in equating (Research Spotlight Issue 1). Princeton, NJ: Educational Testing Services.
Stocking, M. L., & Lord, F. M. (1983). Developing a common metric in item response theory. Applied Psychological Measurement, 7(2), 201-210.
Tong, Y., & Kolen, M. J. (2005). Assessing equating results on different equating criteria. Applied Psychological Measurement, 29(6), 418-432.
Vale, C. D. (1986). Linking item parameters onto a common scale. Applied Psychological Measurement, 10(4), 333-344.
Wells, C. S., Baldwin, S., Hambleton, R. K., Karantonis, A., Jirka, S., Sireci, S. G., Keller, R., &. Keller. L. A. (2007). Evaluating score equity across selected states for the 2005 Grade 8 NAEP math and reading assessments (Center for Educational Assessment Research Report No. 604). Amherst, MA: University of Massachusetts, Center for Educational Assessment.

Linking Current and Future Score Scales for the AICPA Uniform CPA Exam 31
References (Identified, But Not Incorporated Into the Report)
Dorans, N. J. (1990). Equating methods and sampling designs. Applied Measurement in Education, 3, 3-17.
Dorans, N. J. (2000). Distinctions among classes of linkages (College Board Research Note No. RN-11). New York: The College Board.
Dorans, N. J. (2004). Editor’s introduction to special issue: Assessing the population sensitivity of equating functions. Journal of Educational Measurement, 41(1), 1-2.
Dorans, N. J., & Feigenbaum, M. D. (1994). Equating issues engendered by changes to the new SAT and PSAT/NMSQT. In I. M. Lawrence, N. J. Dorans, M. D. Feigenbaum, N. J. Feryok, A. P. Schmitt, & N. K. Wright (Eds.), Technical issues related to the introduction of the new SAT and PSAT/NMSQT (ETS Research Memorandum No. RM-94-10). Princeton, NJ: Educational Testing Services.
Dorans, N. J., & Middleton, K. (2008, April). Challenges faced in extreme linkages. Paper presented at the meeting of the National Council on Measurement in Education, New York City.
Hanson, B. A., & Béguin, A. A. (1999, April). Obtaining a common scale for IRT item parameters using separate versus concurrent estimation in the common item nonequivalent groups equating design. Paper presented at the meeting of the National Council on Measurement in Education, Montreal, Canada.
Harris, D. J. (1991, April). Equating with nonrepresentative common item sets and nonequivalent groups. Paper presented at the meeting of the American Educational Research Association, Chicago.
Harris, D. J., & Kolen, M. J. (1986). Effect of examinee group on equating relationships. Applied Psychological Measurement, 10, 35-43.
Linking Current and Future Score Scales for the AICPA Uniform CPA Exam 32
Holland, P. W., & Dorans, N. J. (2006). Linking and equating. In R. L. Brennan (Ed.), Educational measurement (4th ed., pp. 187-220). Westport, CT: Praeger Publishers.
Kim, S. H., & Cohen, A. S. (1998). A comparison of linking and concurrent calibration under item response theory. Applied Psychological Measurement, 22(2), 131-143.
Kolen, M. J. (1985, April). Comparison of methods for linear equating under the common item nonequivalent populations design. Paper presented at the meeting of the American Educational Research Association, Chicago.
Liu, J., & Walker, M. E. (2007). Score linking issues related to test content changes. In N. J. Dorans, M. Pommerich, & P. W. Holland (Eds.), Linking and aligning scores and scales (pp. 110-134). New York: Springer.
Livingston, S. A., Dorans, N. J., & Wright, N. K. (1990). What combination of sampling and equating methods works best? Applied Measurement in Education, 3, 73-95.
Skaggs, G., & Lissitz, R. W. (1986). IRT test equating: Relevant issues and a review of recent research. Review of Educational Research, 56, 495-529.
Skaggs, G., & Lissitz, R. W. (1988). Effect of examinee ability on test equating invariance. Applied Psychological Measurement, 12, 69-82.
Wingersky, M. S., Cook, L. L., & Eignor, D. R. (1987). Specifying the characteristics of linking items used for item response theory item calibration (RR-87-24). Princeton, NJ: Educational Testing Service.
Woodruff, D. (1988, April). An analytical comparison among three linear equating methods for the common item nonequivalent populations design. Paper presented at the meeting of the American Educational Research Association, New Orleans, LA.

Linking Current and Future Score Scales for the AICPA Uniform CPA Exam 33
Young, M. J. (2006). Vertical scales. In S. M. Downing, & T. M. Haladyna (Eds.), Handbook of test development (pp. 469-486). Mahwah, NJ: Lawrence Erlbaum Associates.
i This report was prepared for the AICPA Psychometrics and Research Examinations Team, Ewing, NJ. The author is grateful for the direction and suggestions provided by Dr. John Matter, Dr. David Chuah, and Dr. Oliver Zhang from the AICPA and Professors Ronald Hambleton and Stephen Sireci at the University of Massachusetts Amherst.


