Linking Lean & Quality Systems With Business Strategies (via Hoshin Kanri) Jd Marhevko VP QLMS & EHS, Accuride Corp FOUR (4) Time AME Manufacturing Excellence Site Winner 2018 Industry Week Manufacturing Plant of the Year
Transcript
Linking Lean & Quality Systems
With Business Strategies
(via Hoshin Kanri)
Jd Marhevko
VP QLMS & EHS, Accuride Corp FOUR (4) Time AME Manufacturing Excellence Site Winner
2018 Industry Week Manufacturing Plant of the Year
AccurideCorp.com 2
2
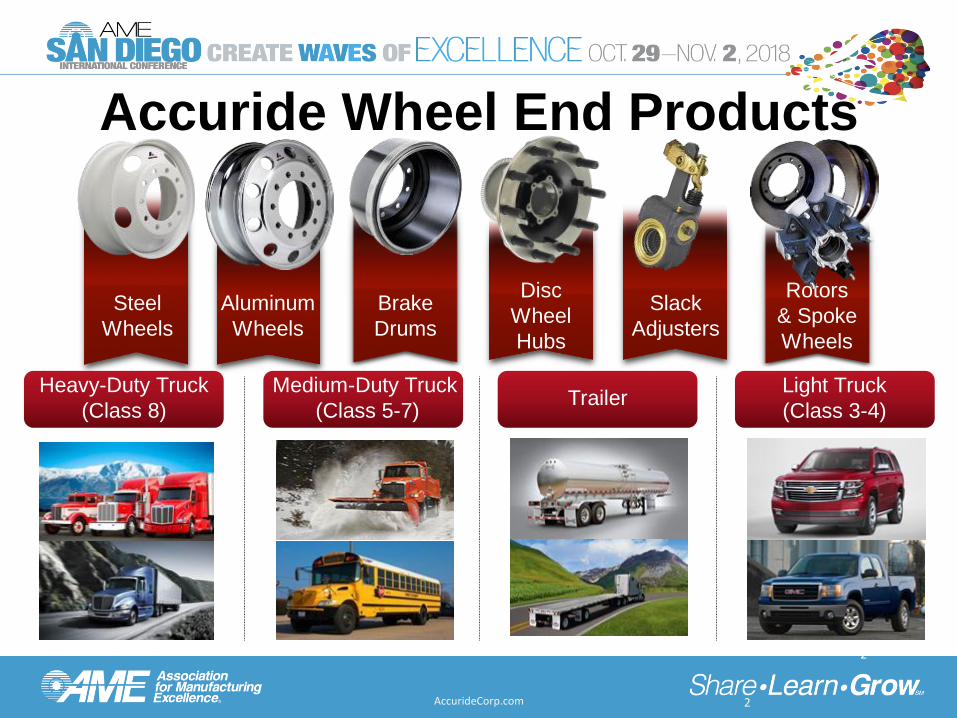
Steel
Wheels
Aluminum
Wheels
Brake
Drums
Slack
Adjusters
Rotors
& Spoke
Wheels
Disc
Wheel
Hubs
Accuride Wheel End Products
Heavy-Duty Truck
(Class 8) Trailer
Medium-Duty Truck
(Class 5-7)
Light Truck
(Class 3-4)
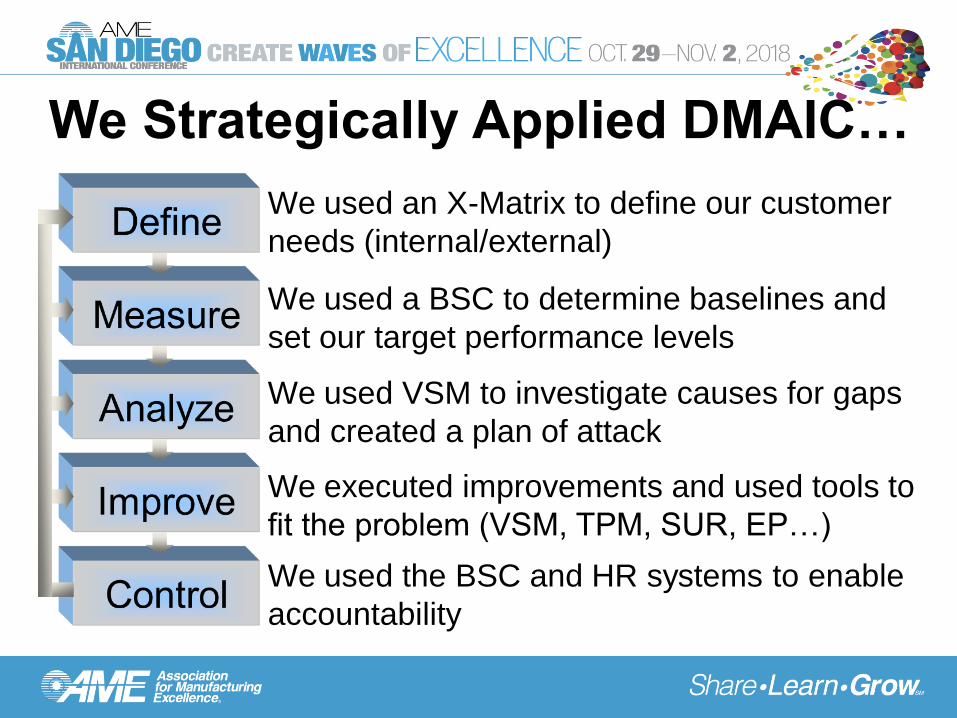
Learning ObjectivesAcross this time we will…
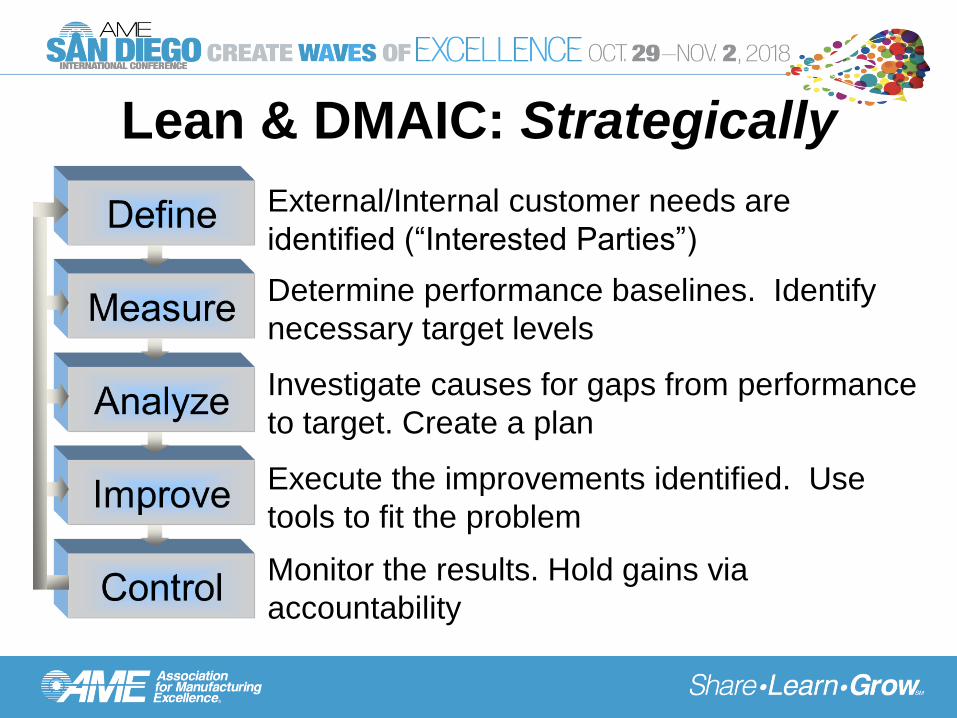
• Tactically apply Define, Measure, Analyze, Improve and
Control (DMAIC) to link Lean Management System
(LMS) strategies to that of the organization via Hoshin
Kanri
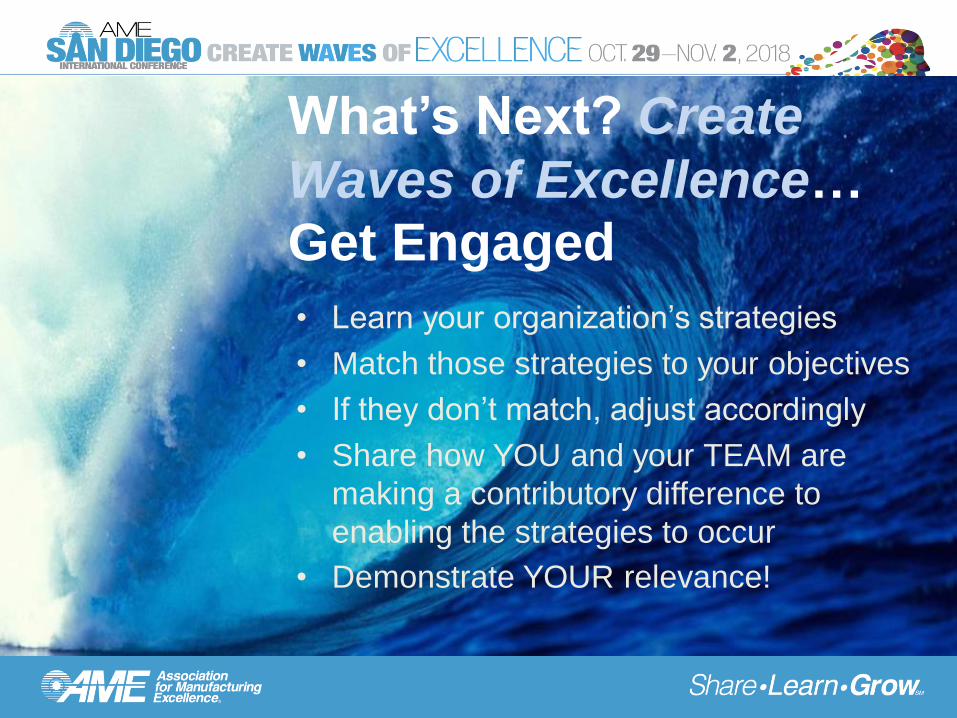
• See how this lean tool can be applied to any business
• Increase your understanding and ability to create
waves of excellence and engage yourself in the
development, management and execution of a strategic
plan
Lean is FLOW through pull. It
uses an enterprise-wide set of
concepts and tools. Lean
strengthens an organization’s
competitive advantage realized
from operating its processes
A Definition of Lean
1.Lean “Operations”. Effective, Efficient flow of Product
2.Transactional systems: Effective, Efficient flow of Data/Information
3.Align Product & Transactional Value Streams across the Enterprise
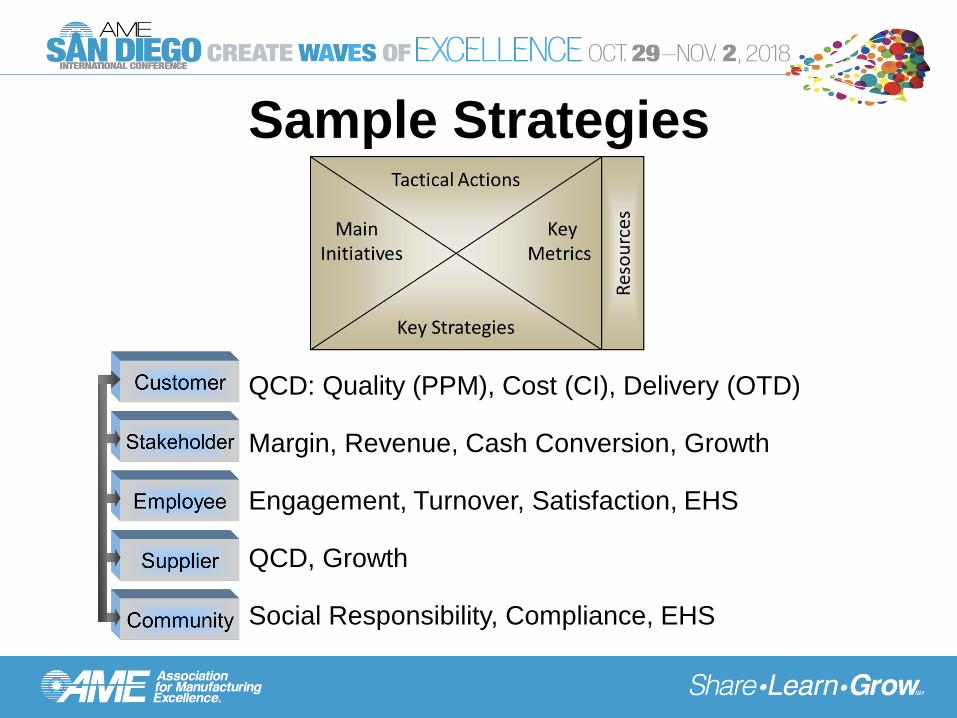
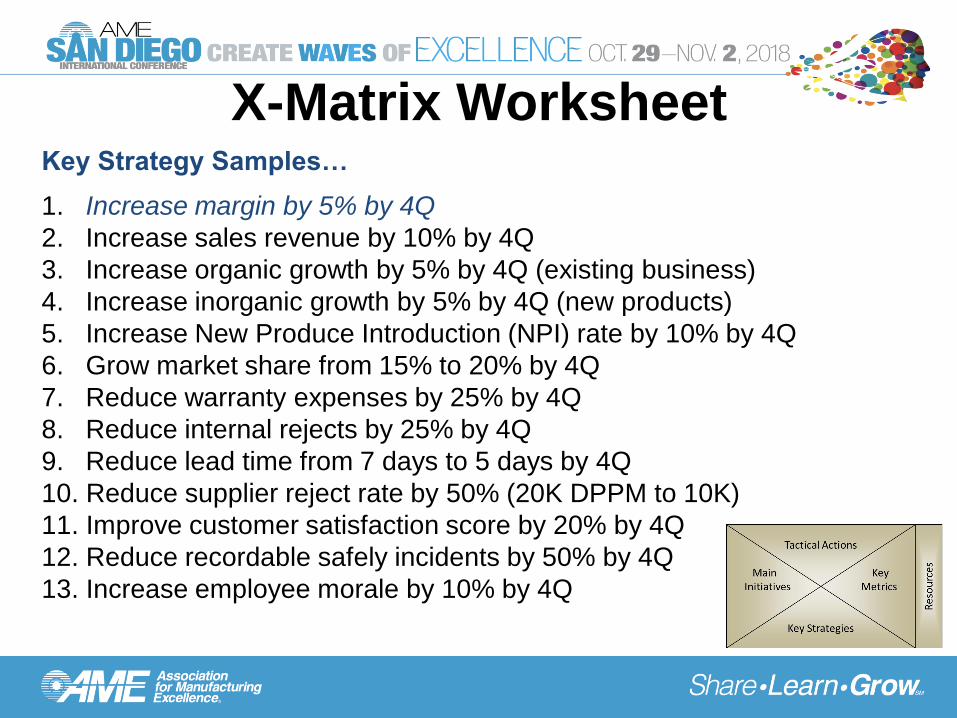
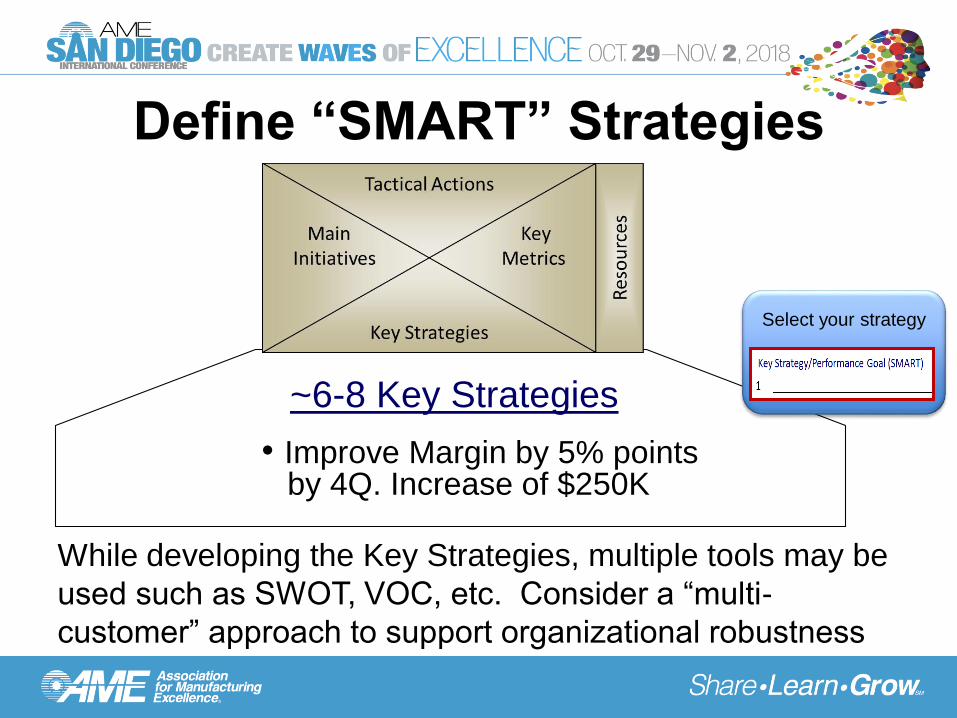
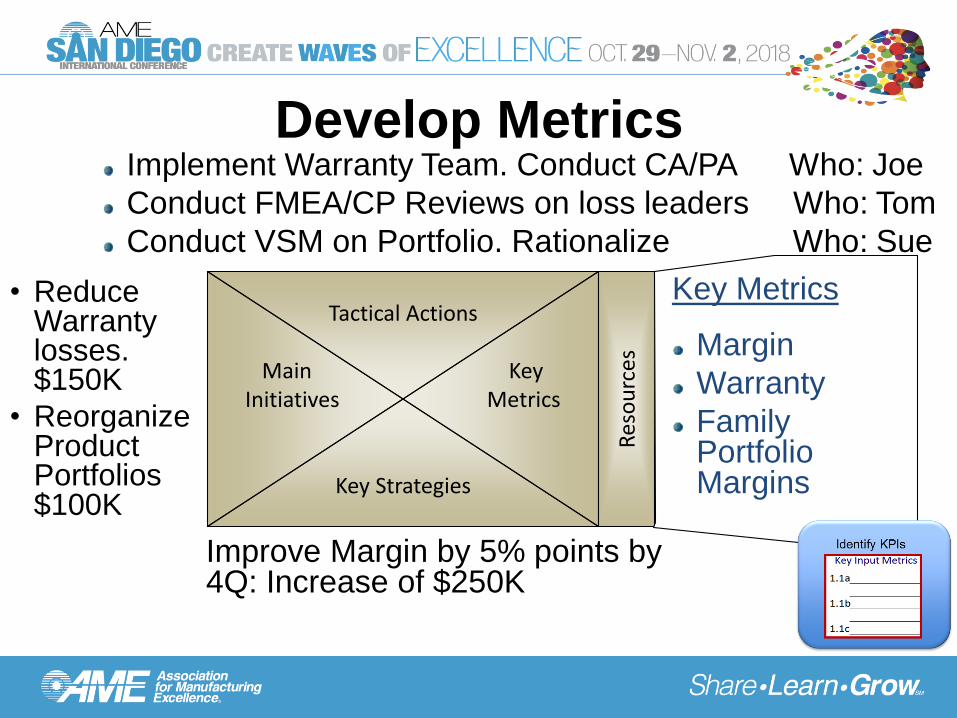
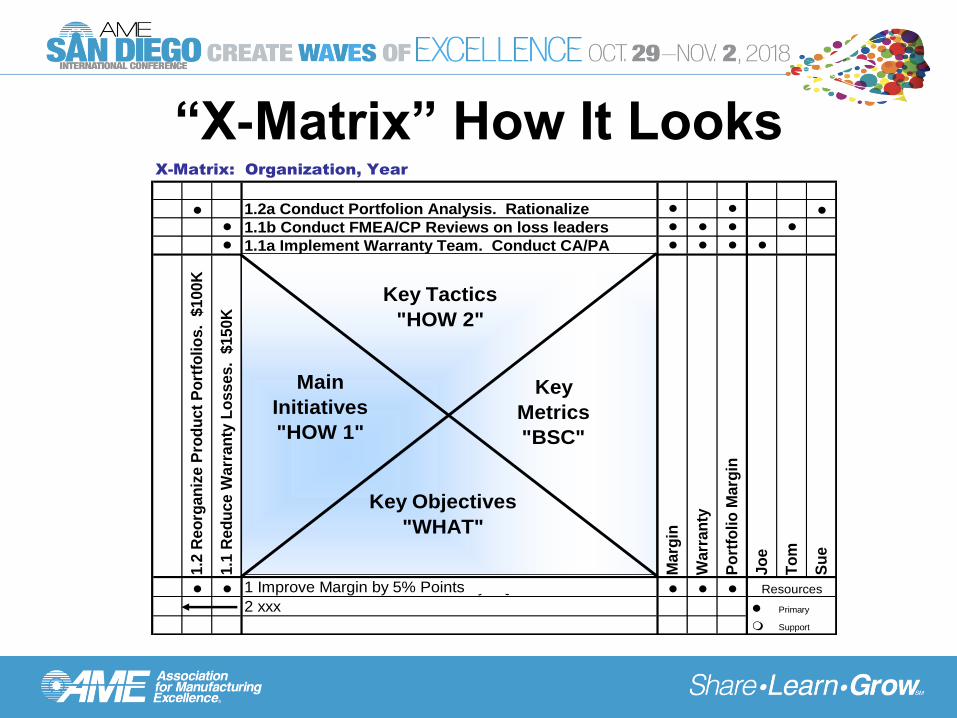
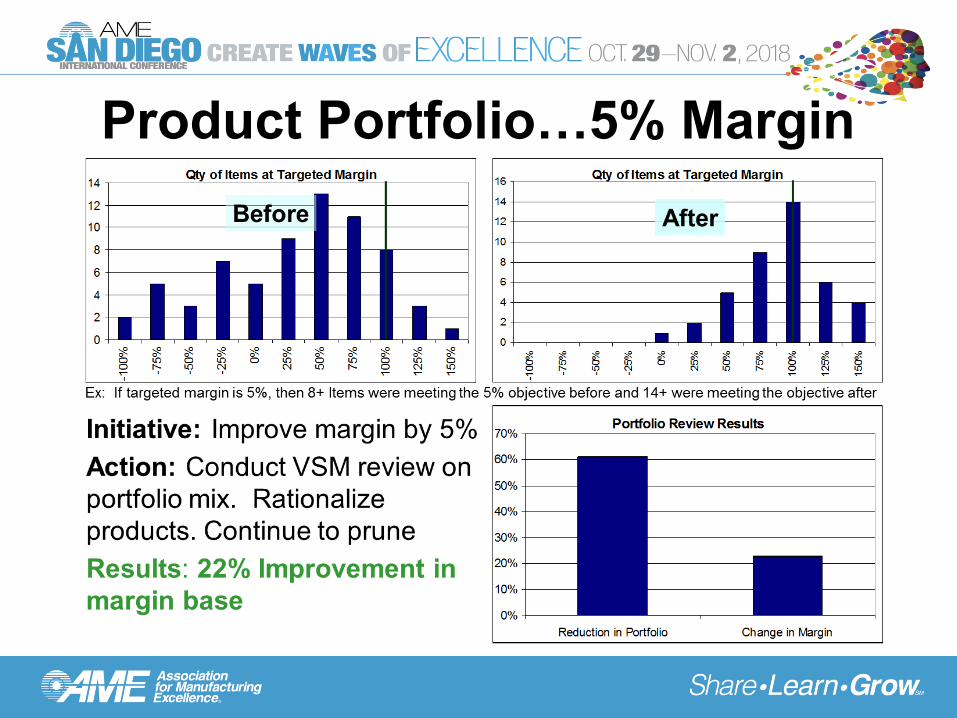
Improve Margin by 5% points by 4Q: Increase of $250K
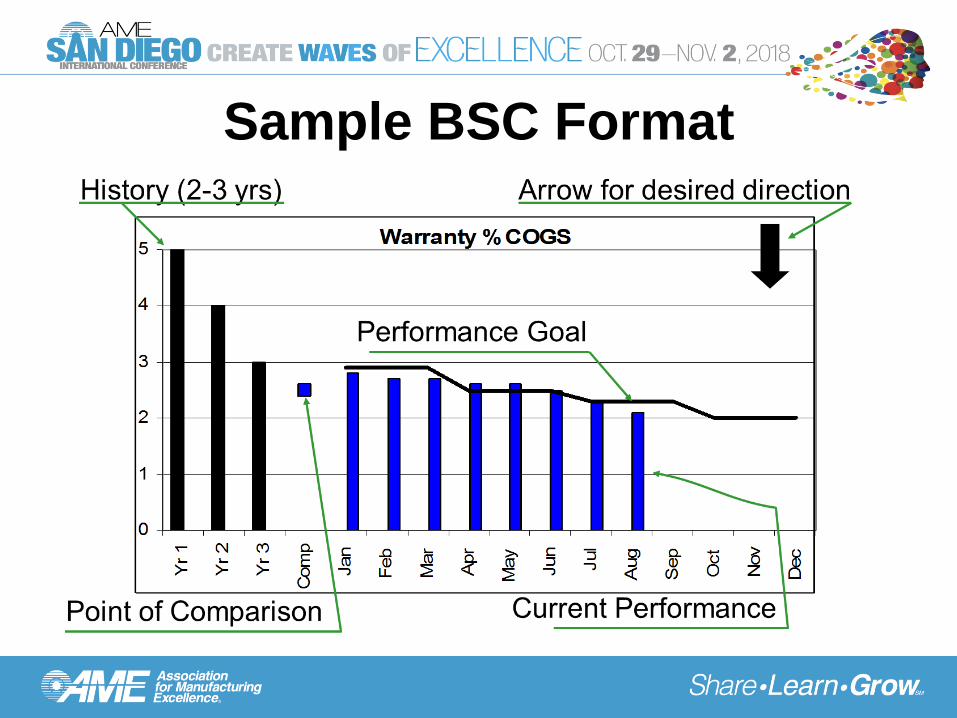
Key Metrics
Implement Warranty Team. Conduct CA/PA Who: Joe
Conduct FMEA/CP Reviews on loss leaders Who: Tom
Conduct VSM on Portfolio. Rationalize Who: Sue
Margin
Warranty
Family Portfolio Margins
Develop Metrics
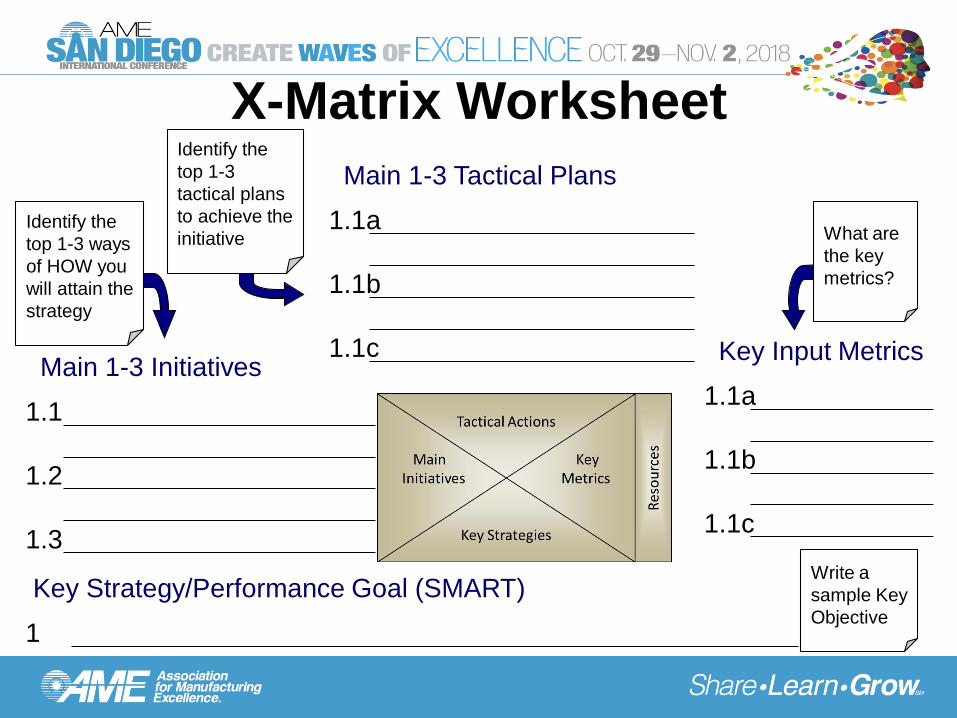
X-Matrix: Organization, Year
l 1.2a Conduct Portfolion Analysis. Rationalize l l l
l 1.1b Conduct FMEA/CP Reviews on loss leaders l l l l
l 1.1a Implement Warranty Team. Conduct CA/PA l l l l
1.2
Reo
rgan
ize P
rod
uct
Po
rtfo
lio
s. $
100K
1.1
Red
uce W
arr
an
ty L
osses. $
150K
Marg
in
Warr
an
ty
Po
rtfo
lio
Marg
in
Jo
e
To
m
Su
e
l l 1 Improve Margin by 5% Points by 4Q08 l l l
2 xxx l Primary
m Support
Resources
Key Tactics
"HOW 2"
Key Objectives
"WHAT"
Main
Initiatives
"HOW 1"
Key
Metrics
"BSC"
“X-Matrix” How It Looks
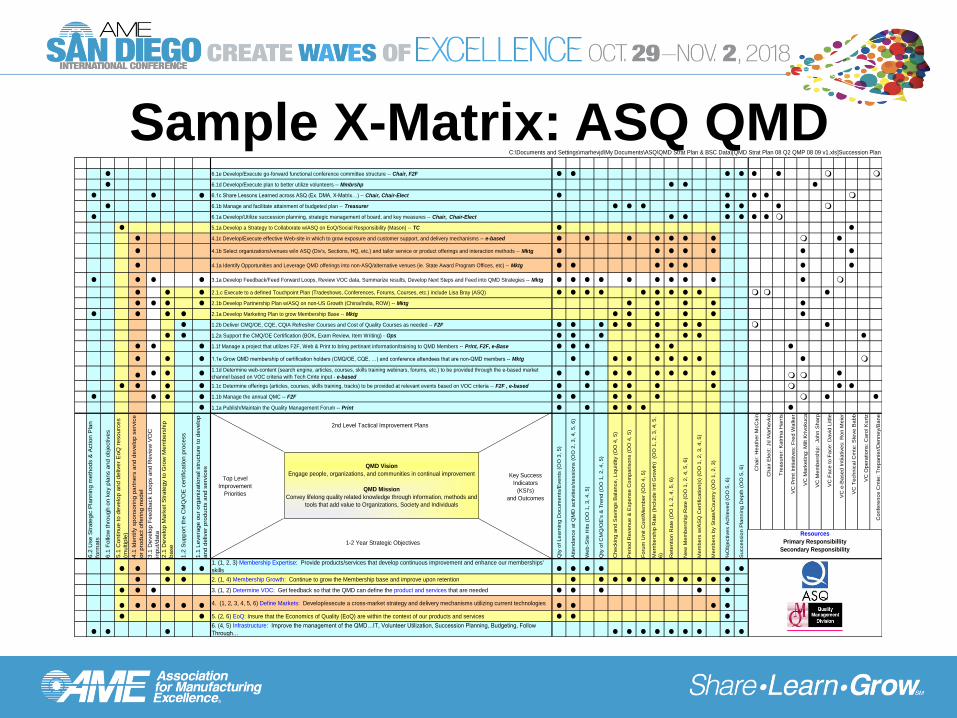
C:\Documents and Settings\marhevjd\My Documents\ASQ\QMD Strat Plan & BSC Data\[QMD Strat Plan 08 Q2 QMP 08 09 v1.xls]Succession Plan
l 6.1e Develop/Execute go-forward functional conference committee structure -- Chair, F2F l l l l l l m m
l 6.1d Develop/Execute plan to better utilize volunteers -- Mmbrshp l l l
l l l 6.1c Share Lessons Learned across ASQ (Ex. DMA, X-Matrix…) -- Chair, Chair-Elect l l l l m
l 6.1b Manage and facilitate attainment of budgeted plan -- Treasurer l l l l l l m
l 6.1a Develop/Utilize succession planning, strategic management of board, and key measures -- Chair, Chair-Elect l l l l l l m
l 5.1a Develop a Strategy to Collaborate w/ASQ on EoQ/Social Responsibility (Mason) -- TC l l
l 4.1c Develop/Execute effective Web-site in which to grow exposure and customer support, and delivery mechanisms -- e-based l l l l l l l m l
l 4.1b Select organizations/venues w/in ASQ (Div's, Sections, HQ, etc.) and tailor service or product offerings and interaction methods -- Mktg l l l l l l l
l 4.1a Identify Opportunities and Leverage QMD offerings into non-ASQ/alternative venues (ie. State Award Program Offices, etc) -- Mktg l l l l l l l
l l l l 3.1a Develop Feedback/Feed Forward Loops, Review VOC data, Summarize results, Develop Next Steps and Feed into QMD Strategies -- Mktg l l l l l l l l l l m
l l l 2.1.c Execute to a defined Touchpoint Plan (Tradeshows, Conferences, Forums, Courses, etc.) include Lisa Bray (ASQ) l l l l l l l l l m m l
l l l l 2.1b Develop Partnership Plan w/ASQ on non-US Growth (China/India, ROW) -- Mktg l l l l l
l l l l 2.1a Develop Marketing Plan to grow Membership Base -- Mktg l l l l l l
l 1.2b Deliver CMQ/OE, CQE, CQIA Refresher Courses and Cost of Quality Courses as needed -- F2F l l l l l l l l m l
l l 1.2a Support the CMQ/OE Certification (BOK, Exam Review, Item Writing) - Ops l l l l l l l
l l l 1.1f Manage a project that utilizes F2F, Web & Print to bring pertinant information/training to QMD Members -- Print, F2F, e-Base l l l l l l
l l l 1.1e Grow QMD membership of certification holders (CMQ/OE, CQE, …) and conference attendees that are non-QMD members -- Mktg l l l l l l l l m
l l l l1.1d Determine web-content (search engine, articles, courses, skills training webinars, forums, etc.) to be provided through the e-based market
channel based on VOC criteria with Tech Cmte input - e-based l l l l l l l l m m l
l l l l 1.1c Determine offerings (articles, courses, skills training, tracks) to be provided at relevant events based on VOC criteria -- F2F , e-based l l l l l l m l l
l l l l 1.1b Manage the annual QMC -- F2F l l l l l m l l
l 1.1a Publish/Maintain the Quality Management Forum -- Print l l l l l l
6.2
Use
Str
ate
gic
Pla
nn
ing m
eth
od
s &
Actio
n P
lan
form
ats
6.1
Fo
llo
w t
hro
ug
h o
n k
ey p
lans a
nd
ob
jective
s
5.1
Co
ntin
ue
to
de
ve
lop a
nd
de
live
r E
oQ
re
so
urc
es
(multip
le)
4.1
Identify
sponsoring p
art
ners
and d
evelo
p s
erv
ice
or
pro
du
ct
off
erin
g m
od
el
3.1
De
ve
lop F
ee
dba
ck L
oo
ps a
nd
Revie
w V
OC
inpu
t/d
ata
2.1
De
ve
lop M
ark
et S
tra
teg
y t
o G
row
Me
mb
ers
hip
base
1.2
Su
pp
ort
the
CM
Q/O
E c
ert
ific
atio
n p
roce
ss
1.1
Leve
rag
e o
ur
org
aniz
atio
na
l str
uctu
re t
o d
eve
lop
and
de
live
r p
rodu
cts
and
se
rvic
es
Qty
of
Le
arn
ing
Do
cu
me
nts
/Eve
nts
(O
O 3
, 5
)
Att
en
da
nce
at
QM
D a
ctivitie
s/s
essio
ns (
OO
2,
3,
4,
5,
6)
We
b-S
ite
Hits (
OO
1,
3,
4,
5)
Qty
of
CM
Q/O
E's
& T
ren
d (
OO
1,
2,
4,
5)
Che
ckin
g a
nd
Sa
vin
gs B
ala
nce
, L
iqu
idity (
OO
4,
5)
Pe
rio
d R
eve
nu
e &
Exp
en
se
Co
mp
ari
so
ns (
OO
4,
5)
Fo
rum
Un
it C
ost/
Me
mb
er
(OO
4,
5)
Me
mb
ers
hip
Ra
te (
Inclu
de
In
tl G
row
th)
(O
O 1
, 2
, 3
, 4
, 5
,
6)
Rete
ntio
n R
ate
(O
O 1
, 2
, 4
, 5
, 6
)
New
Me
mb
ers
hip
Ra
te (
OO
1,
2,
4,
5,
6)
Me
mb
ers
w/A
SQ
Ce
rtific
atio
n(s
) (O
O 1
, 2
, 3
, 4
, 5
)
Me
mb
ers
by S
tate
/Co
un
try (
OO
1,
2,
3)
%O
bje
ctive
s A
ch
ieve
d (
OO
5,
6)
Su
cce
ssio
n P
lan
nin
g D
ep
th (
OO
5,
6)
Cha
ir:
Hea
the
r M
cC
ain
Cha
ir E
lect:
Jd
Ma
rhe
vko
Tre
asu
rer:
Ka
trin
a H
arr
is
VC
Pri
nt
Initia
tive
s:
Fre
d W
alk
er
VC
Ma
rke
tin
g:
Milt
Kri
vo
ku
ca
VC
Me
mb
ers
hip
: J
oh
n S
ha
rp
VC
Fa
ce
to
Fa
ce
: D
avid
Little
VC
e-B
ase
d I
ntiia
tive
s:
Ron
Me
ier
VC
Te
ch
nic
al C
mte
: S
teve
Ba
bb
VC
Op
era
tio
ns:
Caro
l K
urt
z
Con
fere
nce
Cm
te:
Tre
pa
nie
r/D
en
ne
y/B
an
e
l l l l l
1. (1, 2, 3) Membership Expertise: Provide products/services that develop continuous improvement and enhance our memberships'
skills l l l l l l
l l l 2. (1, 4) Membership Growth: Continue to grow the Membership base and improve upon retention l l l l l l l l l l l
l l l 3. (1, 2) Determine VOC: Get feedback so that the QMD can define the product and services that are needed l l l l l
l l l l l l4. (1, 2, 3, 4, 5, 6) Define Markets: Develop/execute a cross-market strategy and delivery mechanisms utilizing current technologies
l l l l
l l 5. (2, 6) EoQ: Insure that the Economics of Quality (EoQ) are within the context of our products and services l l l
l l l
6. (4, 5) Infrastructure: Improve the management of the QMD…IT, Volunteer Utilization, Succession Planning, Budgeting, Follow
There are hundreds of excellent books/tools/sites, etc. Here are few that I have used as recent references:
• Accuride Corporation. Lean Management 50-50-20. Marhevko, Srivastava, Blair• ASQ Quality Management Division. ASQ-QM.org. • ASQ.org• AME.org• Lean Enterprise Institute (LEI) at Lean.org• Superfactory.com• Hoshin Kanri for the Lean Enterprise. Developing Competitive Capabilities and
Managing Profit. Thomas L. Jackson • The Lean Pocket Guide: National Association of Job Shops and Small Manufacturers
(NAJS)• From Good to Great. Jim Collins • The Tipping Point. How Little Things can make a big Difference. Malcolm Gladwell• Blink. The Power of Thinking without Thinking. Malcolm Gladwell• Toyota Production System. Beyond Large Scale Production. Taichii Ohno• The Toyota Way. Jeffrey Liker• The Executive Guide to Understanding and Implementing the Baldrige Criteria.
Leonard & McGuire• The Executive Guide to Understanding and Implementing Lean Six Sigma.