88
Published Project Report PPR572 Linking offence histories to accident causation using OTS data J Stannard, R Cookson and R Hutchins
Published Project Report PPR572
Linking offence histories to accident causation using OTS data
J Stannard, R Cookson and R Hutchins


Transport Research Laboratory
PUBLISHED PROJECT REPORT PPR572
Linking offence histories to accident causation using OTS data
by J Stannard, R Cookson and R Hutchins (TRL)
Prepared for: Project Record: Client's Project Reference No.
Linking offence histories to accident causation using OTS data
Client: Department for Transport, Road User Safety Division
(Kylie Lovell)
Copyright Transport Research Laboratory September 2010
This Published Report has been prepared for Department for Transport.
The views expressed are those of the author(s) and not necessarily those of Department for Transport.
Name Date
Approved
Project Manager
Rebecca Cookson 28/09/2010
Technical Referee
Roy Minton 28/09/2010

Published Project Report
TRL PPR572
When purchased in hard copy, this publication is printed on paper that is FSC (Forest Stewardship Council) and TCF (Totally Chlorine Free) registered.

Published Project Report
TRL i PPR572
Contents
List of Figures iii
List of Tables iv
Executive summary 6
Abstract 8
1 Introduction 9
1.1 OTS 9
1.2 Human behaviour 10
1.3 The relationship between general offences and motoring offences 10 1.3.1 New Zealand 10 1.3.2 USA 10 1.3.3 Denmark 11 1.3.4 Australia 11 1.3.5 UK 11
1.4 Structure of this report 12
2 Aims and objectives 13
2.1 Aims of the research 13
2.2 Part A objectives 13
2.3 Part B objectives 14
3 Linking OTS and offence data – Part A 15
3.1 OTS Data 15
3.2 Offence Data 15 3.2.1 Police National Computer 15 3.2.2 Driver and Vehicle Licensing Agency (DVLA) 15 3.2.3 Voters’ register 15
3.3 Database development 15
3.4 Re-coding of Offence Database 16
3.5 Data Entry and Data Checking 16 3.5.1 Checking Content 16
3.6 Number of matching cases 16
3.7 Part B- Data linking and analysis 16
3.8 Limitations 17
4 Part B- Results 18
4.1 Descriptions of statistical tests used 18 4.1.1 Chi-squared 18
4.2 Descriptive Results 18 4.2.1 Identity Match 18 4.2.2 Offence History found 18 4.2.3 Age 19 4.2.4 Gender 21

Published Project Report
TRL ii PPR572
4.3 Link between fault in accident and offence history 22
4.4 Link between collision severity and offence history 24
4.5 Links between road user types and offending 26
4.6 Causation Factors and Precipitating factors in OTS 27 4.6.1 Overview 27
4.7 Link between precipitating factor and offence type 28 4.7.1 Motoring offences 28 4.7.2 General offences 28
4.8 Link between causation type and offence type 29 4.8.1 At fault in a collision and “drugs offences” 29 4.8.2 At fault in the collision and Drink and/or drug driving
offences 29 4.8.3 At fault in the collision and violence offences 30 4.8.4 Drink or drug driving (501 or 502) as a contributory factor 30 4.8.5 Aggressive or Careless, reckless or in a hurry (601 or 602)
as a contributory factor 32 4.8.6 Exceeding the speed limit or travelling to fast for the
conditions (306 or 307) as a contributory factor 35
4.9 Comparison with National Data 37
5 Discussion 41
5.1 Descriptives 41
5.2 Link between fault in accident and offence history 41
5.3 Link between collision severity and offence history 41
5.4 Link between road user type and offence history 42
5.5 Link between precipitating factor and offence type 42
5.6 Link between causation type and offence type 42
5.7 Comparison with National data 43
5.8 Study limitations 43
6 Conclusions and recommendations 45
6.1 Recommendations 45
Acknowledgements 46
References 46
Appendix A Theories of Human Behaviour 48
Appendix B Database development 50
Appendix C Contributory Factors Table 54
Appendix D Additional Tables 55
Appendix E Shared Annex: Linking offence histories to accident causation using OTS data: the VSRC and TRL findings 60

Published Project Report
TRL iii PPR572
List of Figures
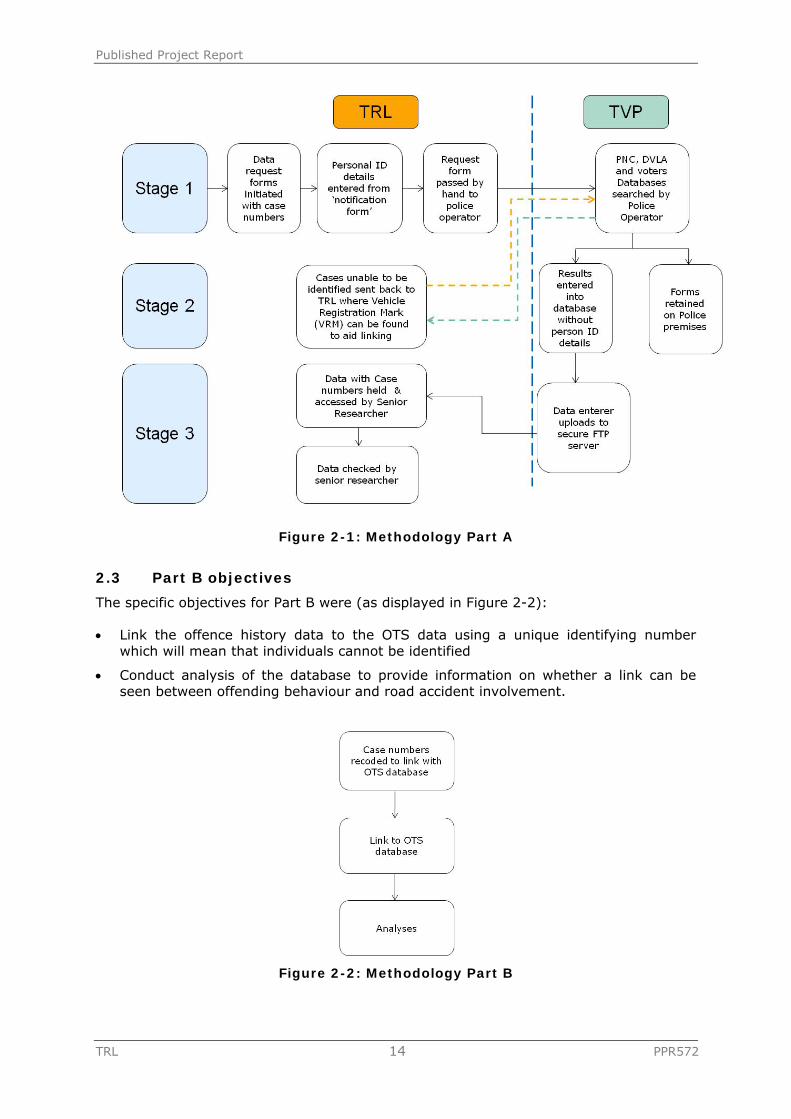
Figure 2-1: Methodology Part A ............................................................................ 14
Figure 2-2: Methodology Part B ............................................................................ 14
Figure 4-1: Age distribution of all Active Road Users compared to the identity matched sample ........................................................................................................ 19
Figure 4-2: Collision type for all precipitating road users .......................................... 27
Figure 4-3: Most common precipitating factors (precipitating only n=1389) ............... 27
Figure 4-4: Most common ‘very likely’ Contributory Factors 2005 (precipitating only n=762) ....................................................................................................... 28

Published Project Report
TRL iv PPR572
List of Tables
Table 4-1. Breakdown of level of matching for the Active Road Users ........................ 18
Table 4-2. Number of Matching ARUs with offence histories ...................................... 18
Table 4-3: Presence of DVLA offence histories for identity matched active road users, by age group ................................................................................................... 20
Table 4-4: Presence of PNC histories for identity matched active road users, by age group ......................................................................................................... 21
Table 4-5: Presence of DVLA offence histories for identity matched active road users, by gender ........................................................................................................ 21
Table 4-6: Presence of PNC offence histories for identity matched active road users, by gender ........................................................................................................ 22
Table 4-7: Number of at fault and not at fault drivers in the collision linked with presence of DVLA offence history ................................................................................. 22
Table 4-8: Number of at fault and not at fault drivers in the collision linked with presence of PNC offence history ................................................................................... 23
Table 4-9: Presence of DVLA offence histories for identity matched active road users, by gender and fault (attribution of precipitating factor) .......................................... 23
Table 4-10: Presence of PNC offence histories for identity matched active road users, by gender and fault (attribution of precipitating factor) .......................................... 23
Table 4-11: Accident severity and presence of any top level offences, by category ...... 24
Table 4-12: Accident severity and presence of any motoring offences, by category ..... 25
Table 4-13: Presence of offence histories for identity matched active road users, by road user type .................................................................................................... 26
Table 4-14: PNC histories of identity matched active road users ............................... 26
Table 4-15: Presence of offence code VIII (drugs offences) and fault of active road user ................................................................................................................. 29
Table 4-16: Presence of offence code 3 (driving etc. after consuming alcohol or taking drugs) and fault of driver ............................................................................... 30
Table 4-17: Presence of offence code I (violence against the person) and fault of driver ................................................................................................................. 30
Table 4-18: Drink or drug driving as a contributory factor and presence of offence history ................................................................................................................. 31
Table 4-19: Drink or drug driving as a contributory factor and presence of offence code I (violence against the person) ......................................................................... 31
Table 4-20: Drink or drug driving as a contributory factor and presence of offence codes III, IV or V (burglary, robbery, theft and handling stolen goods) ......................... 31
Table 4-21: Drink or drug driving as a contributory factor and presence of offence code VII (criminal damage) ................................................................................... 32
Table 4-22: Drink or drug driving as a contributory factor and presence of offence code VIII (drug offences) ...................................................................................... 32
Table 4-23: Aggressive driving or careless, reckless or in a hurry as a contributory factor and presence of offence history ...................................................................... 33

Published Project Report
TRL v PPR572
Table 4-24: Aggressive driving or careless, reckless or in a hurry as a contributory factor and presence of offence code I (violence against the person) .............................. 33
Table 4-25: Aggressive driving or careless, reckless or in a hurry as a contributory factor and presence of offence codes III, IV or V (burglary, robbery pr theft and handling stolen goods) ............................................................................................... 34
Table 4-26: Aggressive driving or careless, reckless or in a hurry as a contributory factor and presence of offence code VII (criminal damage) .......................................... 34
Table 4-27: Aggressive driving or careless, reckless or in a hurry as a contributory factor and presence of offence code VIII (drugs offences) ........................................... 34
Table 4-28: Exceeding the speed limit or travelling too fast for the conditions as a contributory factor and presence of offence history ........................................... 35
Table 4-29: Exceeding the speed limit or travelling too fast for the conditions as a contributory factor and presence of offence code I (violence against the person) ... 35
Table 4-30: Exceeding the speed limit or travelling too fast for the conditions as a contributory factor and presence of offence codes III, IV or V (burglary, robbery or theft and handling stolen goods) ..................................................................... 36
Table 4-31: Exceeding the speed limit or travelling too fast for the conditions as a contributory factor and presence of offence code VII (criminal damage) ............... 36
Table 4-32: Exceeding the speed limit or travelling too fast for the conditions as a contributory factor and presence of offence code VIII (drugs offences) ................. 37
Table 4-33: Comparison of the TRL sample with national data for general offences ...... 38
Table 4-34: Comparison of the TRL sample with national data for motoring offences .... 39

Published Project Report
TRL 6 PPR572
Executive summary The Department for Transport (DfT) commissioned both TRL and VSRC to investigate potential links between offending behaviour and road accident involvement in accidents investigated by their respective On The Spot (OTS) teams; Dodson & Hill (in preparation) describes the findings from the VSRC study. The OTS project was an in-depth on scene accident investigation project which aimed to establish an in-depth database that could be used to improve the understanding of the causes and consequences of road traffic collisions, and thus aid the government in reducing road casualties.
Theories of human behaviour suggest that:
driving behaviour is closely linked to other behaviours,
driving behaviour is part of a complex system linked to social and attitudinal factors, and
propensity to engage in risk-taking behaviour may be influenced by an individual’s level of self-control; specifically, low levels of self-control may be related to propensity to engage in risk-taking behaviour.
Evidence from the literature suggests that there are links between criminal behaviour and motoring offences. Previous research has demonstrated that relationships exist between risky driving and use of alcohol, illicit drugs and antisocial behaviour.
The principle aim of this project was to explore the links between offending and collision involvement, including assessing whether a link could be found between certain high risk causes of collisions (such as drink driving and loss of control at excessive speed) and profiles of serious and repeat offending. To achieve this, the project was divided into two parts. The first (Part A) involved TRL working with Thames Valley Police (TVP) to collect the offence history data and enter it into a TRL designed database. The second part (Part B) was concerned with linking offence data to the OTS database and analysing the data to determine whether there are any links between offending behaviour and road accident involvement.
The analysis focussed on drivers, riders and walkers (active road users) that have been involved in accidents that were part of the OTS project, phases II and III (October 2003 to March 2010). Analysis of the data found that 87% of the 2,109 active road users in TRL’s OTS database (phases 2 & 3) were matched with the DVLA, PNC or Voters’ databases. Of those matched, almost half (47%) had an offence history.
Offences were separated onto the origin of the data (i.e. PNC or DVLA) and the nature of the offence (general or motoring). Looking at general offences, ‘Summary Motoring’ offences were the most commonly recorded, this being the case for 83% of people with an offence history. The most frequently recorded motoring offence was ‘Speed Limit Offences’; this was recorded for 17.5% of people with an offence history.
In terms of age, the number of Active Road Users (ARUs) with identities matched was highest for the 20-34 year age groups. For general offences, the most commonly found precipitating factor linked with summary motoring offences was loss of control. Exploration of precipitating factors linked with motoring offence groups identified that for ‘Speed Limit Offences’, the most commonly linked precipitating factor was loss of control.
Of the ARUs in the DVLA database who were considered to be at fault, 40% were found to have an offence history, and this compared with 31% of those not at fault having an offence history. Similar trends were found for the link between fault and offence history in the PNC data. People who had offence histories were significantly more likely to have been at fault in their accident than those without offence histories. The road user type with the highest percentage of offence history were HGV drivers (62% of sample had a recorded offence history), and this was followed by LGV drivers (57%).
Published Project Report
TRL 7 PPR572
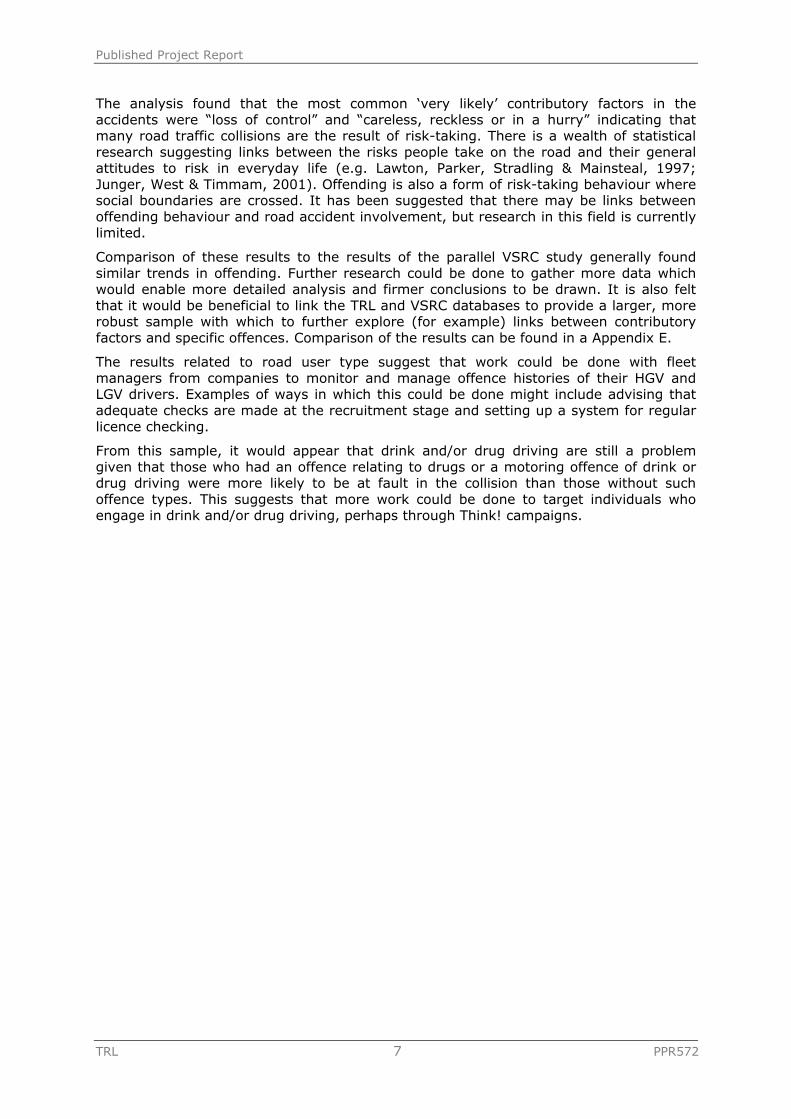
The analysis found that the most common ‘very likely’ contributory factors in the accidents were “loss of control” and “careless, reckless or in a hurry” indicating that many road traffic collisions are the result of risk-taking. There is a wealth of statistical research suggesting links between the risks people take on the road and their general attitudes to risk in everyday life (e.g. Lawton, Parker, Stradling & Mainsteal, 1997; Junger, West & Timmam, 2001). Offending is also a form of risk-taking behaviour where social boundaries are crossed. It has been suggested that there may be links between offending behaviour and road accident involvement, but research in this field is currently limited.
Comparison of these results to the results of the parallel VSRC study generally found similar trends in offending. Further research could be done to gather more data which would enable more detailed analysis and firmer conclusions to be drawn. It is also felt that it would be beneficial to link the TRL and VSRC databases to provide a larger, more robust sample with which to further explore (for example) links between contributory factors and specific offences. Comparison of the results can be found in a Appendix E.
The results related to road user type suggest that work could be done with fleet managers from companies to monitor and manage offence histories of their HGV and LGV drivers. Examples of ways in which this could be done might include advising that adequate checks are made at the recruitment stage and setting up a system for regular licence checking.
From this sample, it would appear that drink and/or drug driving are still a problem given that those who had an offence relating to drugs or a motoring offence of drink or drug driving were more likely to be at fault in the collision than those without such offence types. This suggests that more work could be done to target individuals who engage in drink and/or drug driving, perhaps through Think! campaigns.

Published Project Report
TRL 8 PPR572
Abstract This research project explores the links between offence histories and accident involvement of over 2000 active road users (ARUs) whose accident data were collected by TRL On The Spot (OTS) researchers between October 2003 and March 2010. The first part of the research matched ARUs from the OTS database onto the DVLA, PNC or Voters’ databases. Matches were found for 87% of ARUs, with 47% of these having a previous offence on either the DVLA or PNC database (or both). The most common general offence type found was for summary motoring and the most common motoring offence type was for speed limit offences. Of the matched ARUs, 40% who were considered to be at fault in the OTS recorded accident were found to have an offence history compared to 31% of those who were not considered to be at fault. Similarly, those ARUs who had drink and drug driving offences were more likely to be at fault in the accident, as were those who had a drugs related general offence. This suggests that more work could be done to target individuals who engage in drink and/or drug driving, perhaps through Think! campaigns. HGV drivers had the highest percentage of both DVLA and PNC offences, followed by LGV drivers. The results related to road user type suggest that work could be done with fleet managers from companies to monitor and manage offence histories of their HGV and LGV drivers. Examples of ways in which this could be done might include advising on whether adequate checks are made at the recruitment stage and setting up a system for regular licence checking. Comparison of the results in the Thames Valley region to a parallel report written by VSRC on the Nottinghamshire region generally found similar trends in offending.

Published Project Report
TRL 9 PPR572
1 Introduction An analysis of the On The Spot database of all Active Road Users in this current study found that the most common ‘very likely’ contributory factors in the accidents were “loss of control” and “careless, reckless or in a hurry” indicating that many road traffic collisions are the result of risk-taking. There is a wealth of statistical research suggesting links between the risks people take on the road and their general attitudes to risk in everyday life (e.g. Lawton, Parker, Stradling & Mainsteal, 1997; Junger, West & Timmam, 2001). Offending is also a form of risk-taking behaviour where social boundaries are crossed. It has been suggested many times that there may be links between offending behaviour and road accident involvement, but research in this field is currently limited.
The Department for Transport (DfT) commissioned TRL to investigate potential links between offending behaviour and road accident involvement in accidents investigated by the TRL On The Spot (OTS) team. Subsequent sections of this chapter provide an overview of the OTS project, describe relevant theories of human behaviour and explore the current (albeit limited) research into offending behaviour and road accident involvement.
1.1 OTS
In the year 2000, the Department for Transport (DfT) and the Highways Agency (HA) set up the OTS accident investigation project. This project was undertaken by two organisations: TRL (Transport Research Laboratory) based in the Thames Valley Police region and the VSRC (Vehicle Safety Research Centre, part of Loughborough University) based in the Nottinghamshire Police region, each organisation collected information relating to 250 accidents per year. The study aimed to establish an in-depth database that could be used to improve the understanding of the causes and consequences of road traffic collisions, and thus aid the government in reducing road casualties. In contrast to other accident studies which are based on evidence gathered after incidents, or based on secondary evidence, OTS investigations allowed “perishable” accident data to be gathered. These included trace marks on the highway, pedestrian contact marks on vehicles, the final resting places of the vehicles involved, weather at the time of the incident, visibility and traffic conditions. For each collision investigated, medical data pertaining to the injuries suffered by casualties was obtained from hospital records and questionnaires were sent to those involved in the collision to collect information on items relating to purpose of journey, familiarity with the scene of the accident, their opinions of the contributory factors and information on injuries. Expert investigators from these teams attended the scenes of collisions, usually within 15 minutes of an incident occurring, using dedicated response vehicles and equipment. In total, the teams made in-depth investigations of about 500 crashes per year, and recorded in excess of 2,000 pieces of information about each collision.
The data collected at the scene includes information relating to the speeds of the vehicles prior to the impact, the dynamics of road users during impacts and information relating to the performance of new vehicle and highway safety features. The majority of this “perishable” information can only be collected by visiting the scene while the vehicles are in situ, and a full understanding of the causes and dynamics of the crash are usually impossible without it.
The OTS project therefore collected highly detailed accident causation data and because personal details are also collected from those involved in collisions investigated it is possible to link the collision data to individual offence records. This makes it possible to correlate a range of accident data with offender profiles to identify behavioural patterns.

Published Project Report
TRL 10 PPR572
OTS consists of three phases each of which spans approximately a three year period. At the end of each phase, new fields have been added and existing fields enhanced, to improve the quality of the data collected. This project has used Phases II and III as the request forms which provided names addresses and dates of birth of the majority of the drivers and riders in OTS were introduced at the beginning of Phase II.
1.2 Human behaviour
Several psychological theories have been put forward with a view to illustrating the potential for relationships between general and motoring offences. Detailed background into individual theories may be seen in Appendix A. To briefly summarise the literature associated with theories of human behaviour, it is suggested that:
driving behaviour is closely linked to other behaviours,
driving behaviour is part of a complex system linked to social and attitudinal factors, and
propensity to engage in risk-taking behaviour may be influenced by an individual’s level of self-control; specifically, low levels of self-control may be related to propensity to engage in risk-taking behaviour.
1.3 The relationship between general offences and motoring offences
Evidence suggests that there are links between motoring offences and all other offences. Previous research has demonstrated that relationships exist between risky driving and use of alcohol, marijuana, other illicit drugs and antisocial behaviour (Bina, Graziano & Bonino, 2006).
Whilst a full review of literature was outside the scope of the project, a scan of published research was undertaken to provide background for this report and this is summarised in the following sections. This was conducted using a search of the TRL Knowledge Base as well as internet search engines. The Knowledge Base comprises a number of databases, including the Transport Research Abstracting and Cataloguing System (TRACS). This is the main catalogue of transport research publications held both in the TRL library and elsewhere. It contains bibliographic references and abstracts of English and foreign language articles from journals, books and research reports. It is the English language version of the worldwide ITRD (International Transport Research Documentation database) and contains abstracts from publications in the USA, Australia, Scandinavia, the Netherlands and Canada, in addition to UK material. The database has been updated daily since 1972 and comprises 260,000 items. This is the prime literature resource for transport research. The Knowledge Base also includes the PROJEX database that contains summaries of current and recently completed research projects undertaken in ITRD member countries.
1.3.1 New Zealand
In New Zealand in 1978, Parsons investigated the social characteristics of 1509 ‘serious’ motorway offenders. For each offender, patterns of motoring offences were analysed. The results of the analysis identified a trend whereby serious motor offenders had distinctive characteristics related to general offences. Typically, violent and antisocial social behaviour were found to be associated with motoring offences. Parsons suggested that offenders who consider violence to be part of ‘normal’ behaviour would be likely to demonstrate this type of behaviour when driving (Parsons, 1978).
1.3.2 USA
An American study by Nochajski, Miller, Wieczovek (1993) investigated whether offence history makes a difference to the effects of drink-driving treatment programs. The

Published Project Report
TRL 11 PPR572
results of their study suggest that despite completion of a drink-driving treatment program, those participants with previous criminal convictions were more than twice as likely to be convicted for repeat drink-drive convictions as those without previous criminal records. The findings from this research also suggest that it is possible to predict subsequent drink-drive offences based the number of minor and major general offences committed by those already in possession of drink-drive convictions (Nochajski et al, 1993).
1.3.3 Denmark
The link between motoring and non-motoring convictions and accident involvement may differ depending on the type of conviction. Christoffersen, Soothill and Francis (2007) investigated the characteristics of men born in Denmark in 1966 who have been convicted for a drink-drive offence. This study found that some convictions were significant predictors of a drink-driving offence.
1.3.4 Australia
In Australia, Palk and Davey (2005) conducted a comparative analysis of serious traffic offences using the same categories as Rose (2000), discussed in section 1.3.5, (drink-driving, disqualified driving and dangerous driving) and non-traffic offences in Queensland. In addition to the offence data, Police Officers’ logs (modified for the research) were collected from three Queensland regions for a five-week period. The results of the comparative analysis showed for both non-traffic and traffic offences, young males were most frequently represented. For both offence categories (motoring and non-motoring) it was found that alcohol was frequently involved and these events most frequently occurred on weekends after midnight. Reviews of the Police Officers’ logs showed that certain serious traffic offences and non-traffic offences, such as disturbances and offences against the person, share similar characteristics and occur in concentrated places and at similar times (Palk & Davey, 2005).
1.3.5 UK
Several UK studies investigated the relationship between general and motoring offences. In 1999, Sugg found that drivers convicted of traffic offences were more likely to have prior convictions (including theft, burglary, criminal damage and violent offences) than were drivers with no motoring convictions (Sugg, 1999). Chenery, Henshaw and Pease (1999) monitored the association between offending behaviour and illegal parking in disabled bays. The study considered two groups; those illegally parked in disabled bays and a legally parked vehicle nearby. The results from their study showed that 20% of the vehicles parked illegally in disabled parking bays would warrant immediate police attention; this compared with 2% of legally parked vehicles. Further exploration into criminal records revealed that 33% of the illegally parked vehicles’ owners had criminal records compared with 2% of the legally parked vehicles’ owners.
A further UK study was conducted by Rose in 2000. This examined motoring offenders who fell into three categories; drink drivers, disqualified drivers and dangerous drivers. Rose acknowledged that: “…dangerous driving and disqualified driving showed some broad similarities”
Rose (2000, p30). This suggests that the ‘disqualified drivers’ may have included drink-drivers and dangerous drivers although no clear distinction was made. The results of this study showed that many offenders from these groups had also committed general offences such as violence, burglary, robbery, theft and handling, criminal damage and drug offences (Rose, 2000). Clear differences were apparent between the offenders in the three motoring offence categories; 40% of drink-drivers had a (previous) criminal

Published Project Report
TRL 12 PPR572
record, 50% of those charged with dangerous driving had a (previous) criminal record and 79% of disqualified drivers had a previous criminal record. These findings therefore suggest that each motoring offence varies in its level of association with general offences i.e. that drink drivers have the lowest association with general offenders and disqualified drivers, the greatest, depicting a complicated relationship. This study has links with the Problem-Behaviour theory discussed in Appendix A, Section A.3.
In a study by Broughton (2006) the Driver and Vehicle Licensing Agency (DVLA) records of the motoring offences of 52,000 drivers were linked with their offence histories, as recorded by the Home Office. The research found that that the number of motoring and non-motoring offences an individual commits are linked; male drivers who have committed between four and eight non-motoring offences have, on average, committed 21 times as many serious motoring offences than those with no non-motoring convictions. Broughton (2006) also identified that individuals who had nine or more general and motoring convictions were 100 times more likely to have received a “driving whilst disqualified” motoring conviction. On the other hand, as the number of non-motoring offences increased, the number of speeding offences was found to decrease. However, links between offending behaviour (in terms of both motoring and non-motoring offences) and accident involvement (regardless of any subsequent prosecution for that accident) have been less well researched.
In 2006, VSRC at Loughborough University successfully piloted the collection of offence history data with Nottinghamshire Police, for a small sample of crashes involving risk-taking. Following further development of the linking methodology VSRC have matched data from approximately 2,500 active road users involved in collisions investigated by the VSRC OTS team between 2003 and 2009 to offence history databases. The results from the VSRC project are reported in Dodson & Hill (in preparation).
TRL have undertaken a parallel study, repeating the process for OTS active road users in the TRL area, capturing equivalent data in cooperation with Thames Valley Police. This report presents the results from the TRL area, comparisons between the results of the reports from the two areas can be found in a joint annex.
1.4 Structure of this report
Based on the background set out above, this report is structured as follows:
Section 2 presents the aims and objectives and illustrates the process designed to address these.
Section 3 introduces the sources of OTS and offence history data and describes the processes involved in meeting the Part A objectives in terms of developing a database to allow links to be explored
The specific analyses involved in addressing the Part B objectives are detailed in Section 4.
Section 5 discusses the outcomes of analyses and links between offending behaviour and road accident involvement.

Published Project Report
TRL 13 PPR572
2 Aims and objectives
2.1 Aims of the research
The hypothesis being tested in the study was to confirm whether a link could be found between certain high risk causes of collisions (such as drink driving and loss of control at excessive speed) and profiles of serious and repeat offending. This report is therefore only concerned with Active Road Users; that is the person in control of their vehicle in the collision.
The project was divided into two parts. The first (Part A) involved TRL working with Thames Valley Police (TVP) to collect the offence history data and enter it into a TRL designed database. The second part (Part B) was concerned with linking offence data to the OTS database and analysing the data to determine whether there are any links between offending behaviour and road accident involvement.
2.2 Part A objectives
The specific objectives for Part A were to:
Make certain that all involved project members read and sign the protocols and procedures for the data collection teams to follow and ensure the safe and secure processing of that data (see Appendix B).
Create a database for entry of offence data.
Pass the only copy of the names, addresses, and dates of birth held by TRL to Thames Valley Police.
Collect offence history data and enter it into the database. The data are obtained from the following Police systems:
o Police National Computer (PNC);
o Driver and Vehicle Licensing Agency (DVLA) Database; and
o Voters’ register (for identification only, if no link can be found on either the PNC or DVLA databases).
Figure 2-1 displays the methodological approach to addressing the Part A objectives in further detail.
Published Project Report
TRL 14 PPR572
Figure 2-1: Methodology Part A
2.3 Part B objectives
The specific objectives for Part B were (as displayed in Figure 2-2): Link the offence history data to the OTS data using a unique identifying number
which will mean that individuals cannot be identified
Conduct analysis of the database to provide information on whether a link can be seen between offending behaviour and road accident involvement.
Figure 2-2: Methodology Part B

Published Project Report
TRL 15 PPR572
3 Linking OTS and offence data – Part A
3.1 OTS Data
As part of the OTS project, TRL produced a database to hold all of the information collected at accident scenes. The database is capable of accepting data from both TRL and VSRC, and it currently contains records of 4,560 accidents for research and analysis.
The database is structured into a hierarchy of different levels in order to make use of such a large data set. The main data levels in the OTS database are Scene, Path, Vehicle, Human and Injury:
Scene level: this level contains all the data which relates to the whole accident and the whole collision scene. Examples of level 1 data fields include the date of the accident and whether the scene was in daylight or darkness.
Path level: this level contains data relating to the various approaches to the actual locus of the accident. This level is necessary in distinguishing environmental factors that are different dependent on the path a particular road user took to arrive at the locus.
Vehicle level: at this level, each vehicle is given a unique identification within those sharing the same approach. At this point, the data can explicitly describe how a vehicle on the first approach collided head-on with a vehicle on the second approach.
Human and injury level: these levels continue with humans linked to each vehicle and injuries linked to each person.
Since the start of Phase II, as part of the accident investigation process, names and addresses of those involved in the accident are obtained, to facilitate the sending of questionnaires and extraction of medical records. These names and addresses are not recorded in the OTS database, where participants are identified only by anonymous reference numbers.
3.2 Offence Data
3.2.1 Police National Computer
The Police National Computer (PNC) holds conviction data, which has been supplemented by arrest information from April 2005. This system is used by all Police forces in England, Wales, Scotland and Northern Ireland and other criminal justice organisations.
3.2.2 Driver and Vehicle Licensing Agency (DVLA)
This system contains data on driving offences and licence status and is accessible through the Police network. To search this database usually requires an exact full name and date of birth; otherwise a null return is likely. With common names, there may be multiple returns and the current address is required to make a definite match.
3.2.3 Voters’ register
Whilst the voters’ register does not record offences, it was used by TVP to provide an identity match for Active Road Users (ARUs) where a positive match could not be found on either the PNC or DVLA databases, or where such searches were inclusive (returned too many possible individuals).
3.3 Database development
Protocols and procedures for the data collection teams were defined at the beginning of the project. A list of names and addresses of active road users involved in OTS-
Published Project Report
TRL 16 PPR572
investigated accidents was generated and the only copy of this list was passed from TRL to TVP. An Access database with a user-friendly “front end” was generated, into which TVP staff entered offence history data. Details of the offender, the general offences and motoring offences were entered via three data entry screens, as shown in Appendix B. Each data entry screen linked to a table, and the tables were linked by the “offender case number” (see below).
3.4 Re-coding of Offence Database
To ensure the anonymity of individuals during this project, an algorithm was applied to the OTS case numbers to produce the “offender case number”. Since all data which could identify an individual during the lifecycle of the project was held by TVP and the researchers who undertook the analyses for Part B of the project had no previous access to the raw OTS data, no individual could be identified.
Once the offence data was collected and returned to TRL, researchers applied an algorithm to the offender case number to get the unique OTS reference number that would identify the person within the accident. The offence history could then be linked to the OTS data.
3.5 Data Entry and Data Checking
When carrying out data checks for offence histories, staff checked the PNC and DVLA databases using all of the following reference points; driving licence number, full name and the vehicles registered at addresses. In addition, staff checked possible alternative spellings of names and reversed them if necessary. The register of voters was also used to cross check both names and addresses.
3.5.1 Checking Content
Upon commencing data entry, TVP staff initially completed 10 entries which were then checked by a member of TRL staff. This check involved using Queries to confirm the following:
that all individuals that could be found on the DVLA database had their licence type completed
that all individuals found on the PNC or DVLA offence databases had corresponding offences linked to them
that all motoring offences were also included in the general offence table that all general offences that were related to a motoring offence were included in
the motoring offence table
3.6 Number of matching cases
A matched case is one where there was a positive ID match in the PNC, DVLA or Voters’ databases for an ARU, irrespective of whether a conviction was found. Thirteen percent of the ARUs provided by TRL could not be matched to any of the databases. For those individuals that could not be matched using a name and date of birth further information in the form of the Vehicle Registration Mark (VRM) was supplied to TVP, however this did not significantly increase the number of matches found.
3.7 Part B- Data linking and analysis
Having applied the algorithm to convert the Offence Case number to the relevant OTS reference field (see Section 3.4), the two databases were linked in Access based on these values.

Published Project Report
TRL 17 PPR572
A number of queries were then run on the Access database to extract the data required for analysis. This data was then converted into SPSS and the required statistical tests were run as described in Section 4.
3.8 Limitations
A number of challenges associated with the collection and analysis of data were identified during this project. The limitations identified included:
Reliance on identity data provided by active road users at OTS collision scenes, for example, accurate spellings of names. In addition, if an active road user failed to provide their middle name(s), this could lead to unsuccessful matching against the DVLA database.
Where multiple returns occur for a combination of name and Date of Birth, postcodes are checked for matches but, if people have moved, this again results in matching not being possible. Furthermore, if OTS case files do not include “Dates of Birth”, an extension of the search time occurs and the likelihood of finding a match is reduced.
By using predominantly police data, there is a risk of underestimation of involvement of crime in the present sample since after a specified time period offences are removed from an individual’s record. This may or may not leave a skeleton record for that individual. The data therefore provides a minimum count of crimes committed.
Additionally, it is likely that some offences would have been cleared from the police-held databases, meaning that not all offence histories are complete. Guidelines on retention of offence histories for older data are complex and may have been deleted for older offenders, but retained for younger ones. With regard to DVLA, offence histories are held for 11 years for:
o Drunk or drug driving
o Causing death by careless driving while under the influence of drink or drugs
o Causing death by careless driving, then failing to produce a specimen for analysis
All other cases (for example, reckless/dangerous driving) are held for four years.
Despite the apparent limitations, the datasets used in this study provide the opportunity to develop a unique insight into the relationship between offending and accident involvement.

Published Project Report
TRL 18 PPR572
4 Part B- Results This section provides detailed results of the analyses conducted as part of the objectives of Part B described in Section 2.3.
The results from the Offence History data can be found in sections 4.2 and 4.9 with results linking the Offence History and the OTS data in the remaining sections.
4.1 Descriptions of statistical tests used
4.1.1 Chi-squared
The majority of analyses undertaken and described in Section 4 are Chi-squared tests. This measures how associated the data between two variables are by comparing differences between the frequencies found and those expected; expected frequencies assume an even split in the data between the two variables.
4.2 Descriptive Results
Of the 2,109 active road users in TRL OTS accidents from Phases 2 and 3 with their names and addresses recorded, 87% (1,845) had their identity confirmed (i.e. using the police or voters’ databases as a minimum to match names and address where accurately recorded). It should be noted that these were the details given to the OTS investigators at the scene by the involved people. It is possible that the active road users may have provided details of other people, so it is not possible to be completely certain that the people matched were in fact the people in charge of the vehicles at the time of the accident.
4.2.1 Identity Match
The breakdown of the type of match obtained for these 1,845 active road users is shown in Table 4-1. DVLA and PNC matches were found for 368 of the active road users, the majority (79%) of the matched active road users were matched with DVLA data only.
Table 4-1. Breakdown of level of matching for the Active Road Users
All ARUs DVLA & PNC Match
DVLA only Match
PNC only Match
Voters only Match
No identity match made
2109 368 1451 11 15 264
4.2.2 Offence History found
The breakdown of the matched active road users with respect to the offence history presence and where the offence history was found is shown in Table 4-2. Of the matched active road users, 873 (47%) had an offence history.
Table 4-2. Number of Matching ARUs with offence histories
Number of matched ARUs
DVLA & PNC DVLA only PNC only No Offence History
1845 82 479 312 972
All subsequent tables will only include data where an identity match has been made unless otherwise stated.

Published Project Report
TRL 19 PPR572
As well as being separated into the origin of the offence data record as described in Table 4-2 (PNC or DVLA), offences were also separated into two groups – general offences and motoring offences. General offences includes all offences found, and is further subdivided into 12 classes of offence, as shown in Table B1. Motoring offences includes all motoring related offences (where the data source could be either PNC or DVLA). It is also further sub divided into 25 offence codes (Table B2)
Table D1 in Appendix D shows the number of ARUs who have an offence. This is split by both the twelve general offence categories and the number of offences for each ARU. Summary motoring offences were the most commonly recorded, as would be expected due to the sample selected being involved in road traffic accidents. This offence group was recorded for 578 of the 873 with an offence history (66%). For the majority of this group (415), the active road user had only one summary motoring general offence recorded. The highest number of summary motoring offences recorded for an active road user was 46; this was the greatest number of convictions in one offence group to be found for any of the active road users. The next most frequently identified offence group was violence against the person, followed by theft and handling stolen goods, which were associated with 148 and 122 of the active road users respectively.
Table D2 in shows the motoring offences split into motoring offence classifications. Motoring offence 16: speed limit offences, was the most frequently recorded motoring offence, with 324 active road users with this conviction. The next most frequent motoring offences were drink/drug driving and vehicle insurance offences.
4.2.3 Age
The age distribution of the ID matched sample mirrors the age distribution of total active road user sample as shown in Figure 4-1. Whilst there were some age groups (e.g. 17-19) where there was a higher percentage of positive identification than other age groups, non matched ARUs were spread amongst all age groups, and as such it can be assumed that there is no bias in non matched ARUs to specific ages. The percentage of ID matched ARUs was lowest in the unknown group. This is unsurprising given that the Date of Birth of the road user was one demographic used by TVP to search for ARUs.
Figure 4-1: Age distribution of all Active Road Users compared to the identity matched sample
Table 4-3 shows the DVLA offences recorded for active road users split by age group. The highest percentage of DVLA offence histories found was for the 20-24 year age group with 46% of the active road users obtaining a positive match. The active road

Published Project Report
TRL 20 PPR572
users in the 60-64 year age group had the lowest DVLA offence history rate at 23%. For the entire sample of active road users, 38% were found to have a DVLA offence history.
Table 4-3: Presence of DVLA offence histories for identity matched active road users, by age group
Age Group
DVLA Offence History Found Total % Offence Found
DVLA OH Yes
DVLA OH No
No DVLA Match
Child 9 12 21 43%
17-19 51 96 147 35%
20-24 117 132 5 254 46%
25-29 102 137 239 43%
30-34 77 109 2 188 41%
35-39 65 107 2 174 37%
40-44 63 113 176 36%
45-49 64 90 154 42%
50-54 37 79 3 119 31%
55-59 23 59 82 28%
60-64 15 51 66 23%
65+ 33 88 2 123 27%
Unknown 39 59 2 100 39%
Total 695 1132 16 1843 38%
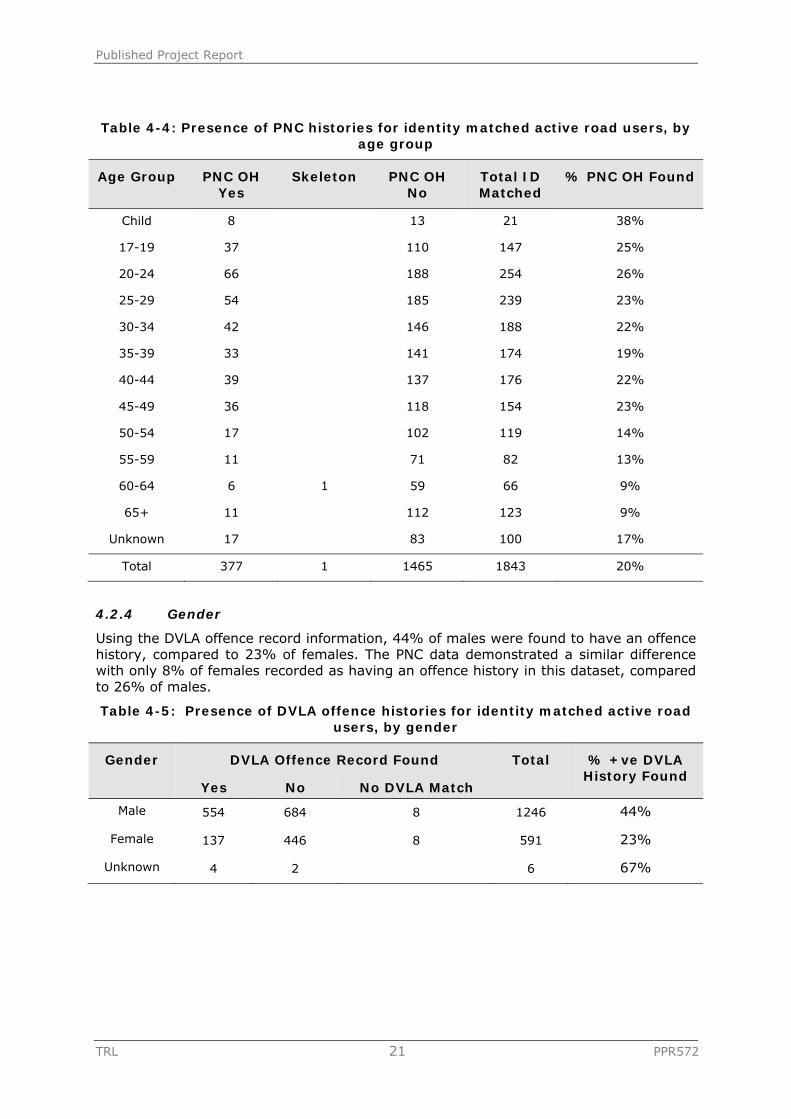
Using the PNC data, a similar trend for offences was found, as shown in Table 4-4. Again, the 20-24 year old active road users had a high proportion of offence histories, although the highest percentage was that of the Child category with 38% having an offence history. Only three ARUs in the child category were found to be driving (or riding) a vehicle for which they were too young to achieve a licence for.
Published Project Report
TRL 21 PPR572
Table 4-4: Presence of PNC histories for identity matched active road users, by age group
Age Group PNC OH Yes
Skeleton PNC OH No
Total ID Matched
% PNC OH Found
Child 8 13 21 38%
17-19 37 110 147 25%
20-24 66 188 254 26%
25-29 54 185 239 23%
30-34 42 146 188 22%
35-39 33 141 174 19%
40-44 39 137 176 22%
45-49 36 118 154 23%
50-54 17 102 119 14%
55-59 11 71 82 13%
60-64 6 1 59 66 9%
65+ 11 112 123 9%
Unknown 17 83 100 17%
Total 377 1 1465 1843 20%
4.2.4 Gender
Using the DVLA offence record information, 44% of males were found to have an offence history, compared to 23% of females. The PNC data demonstrated a similar difference with only 8% of females recorded as having an offence history in this dataset, compared to 26% of males.
Table 4-5: Presence of DVLA offence histories for identity matched active road users, by gender
Gender DVLA Offence Record Found Total % +ve DVLA History Found
Yes No No DVLA Match
Male 554 684 8 1246 44%
Female 137 446 8 591 23%
Unknown 4 2 6 67%

Published Project Report
TRL 22 PPR572
Table 4-6: Presence of PNC offence histories for identity matched active road users, by gender
Gender PNC OH Yes
Skeleton PNC OH No
Total ID Matched
% PNC OH Found
Male 327 1 918 1246 26%
Female 50 541 591 8%
Unknown 6 6 0%
4.3 Link between fault in accident and offence history
Since all drivers in this study were accident-involved, some difficulties arose when investigating whether a link between offending history and road accident involvement existed owing to a lack of control data. Therefore the drivers were divided into two groups – those where the precipitating factor was linked to the driver, who was therefore considered “at fault” in the collision, and those where the precipitating factor was linked to another party within the collision. Table 4-7 shows these two groups split by the presence of DVLA offences and matches. Of the active road users who were considered to be at fault in the accident, 40% were found to have an offence history compared to 31% of those not at fault. Using a Chi square test between presence of DVLA offence history and No DVLA offence history or no DVLA match, evidence was found of a significant difference.
Table 4-7: Number of at fault and not at fault drivers in the collision linked with presence of DVLA offence history
DVLA offence history
No DVLA offence history
No DVLA Match
Total ID Matched
% DVLA OH
Fault (precipitating road user) 552 826 11 1389 40%
Not Fault (not precipitating road user) 143 306 5 454 31%
2<0.01 Table 4-8 shows whether the driver was considered to be at fault or not in the accident and whether they had a general (including motoring) offence linked to them for the PNC data. This also showed a higher percentage of offences found for those who were recorded as being at fault for the accident and again, Chi square tests showed these differences to be significant.

Published Project Report
TRL 23 PPR572
Table 4-8: Number of at fault and not at fault drivers in the collision linked with presence of PNC offence history
Gender PNC OH Yes
Skeleton PNC OH No
Total ID Matched
% PNC OH Found
Fault (precipitating road user) 320 1 1068 1389 23%
Not Fault (not precipitating road user) 57 397 454 13%
2<0.01 Just over half of the DVLA matched male precipitating active road users were found to have a DVLA offence history, compared to just 24% of the females. For the non-precipitating road users, 37% of males and 21% of females were found to have a previous DVLA offence.
Table 4-9: Presence of DVLA offence histories for identity matched active road users, by gender and fault (attribution of precipitating factor)
Precipitating Active Road User
DVLA Offence History Found
Gender Total
Male Female Unknown
Yes No 494 331 1 826
Yes 443 107 2 552
No Match 6 5 11
No No 190 115 1 306
Yes 111 30 2 143
No Match 2 3 5
Of precipitating males, 42% have an identified PNC offence record, compared to 20% of non-precipitating males. Again, females have lower offence rates with 11% of precipitating active road users and 5% of non-precipitating road users.
Table 4-10: Presence of PNC offence histories for identity matched active road users, by gender and fault (attribution of precipitating factor)
Precipitating Active Road User
PNC History Found
Gender Total
Male Female Unknown
Yes Yes 277 43 320
No 665 400 3 1068
Skeleton 1 1
No Yes 50 7 57
No 253 141 3 397
Skeleton - - - 0

Published Project Report
TRL 24 PPR572
4.4 Link between collision severity and offence history
Given the “not at fault” driver (i.e. the driver who did not have the precipitating causation factor in the collision attributed to them) may be an entirely innocent party in the accident, this section considers only drivers who were considered to be at fault (where the driver had the precipitating factor applied to them). Table 4-11 shows the top level offence type for the precipitating road users split by accident severity. Indictable motoring offences were those found to have the highest proportion of fatal accident involved precipitating road users, although this was only one fatal accident. Due to the small number of fatal accidents in the sample, no firm conclusions can be drawn for these accidents. Precipitating active road users with indictable motoring offences were also involved in the highest proportion of serious accidents. Table 4-12 shows the motoring offence type for the precipitating road users split by accident severity. Driving licence related offences and vehicle insurance offences were found to have high proportions of KSI involved precipitating road users.
Table 4-11: Accident severity and presence of any top level offences, by category
Top Level Offence Type
Fatal Serious (KSI) Slight Non-Injury Total
Violence against the person 3 28 (31) 98 63 192
Sexual offences 3 7 10
Burglary 8 (8) 21 11 40
Robbery 1 (1) 5 5 11
Theft and handling stolen goods 2 38 (40) 100 46 186
Fraud and forgery 1 3 (4) 16 9 29
Criminal damage 2 12 (14) 34 16 64
Drug offences 2 18 (20) 45 28 93
Other indictable (excluding motoring
offences) 3 (3) 10 2 15
Other summary (excluding motoring
offences) 3 21 (24) 47 23 94
Indictable motoring 1 5 (6) 6 3 15
Summary motoring 30 83 (113) 305 197 615

Published Project Report
TRL 25 PPR572
Table 4-12: Accident severity and presence of any motoring offences, by category
Motoring Offence Type
Fatal Serious (KSI) Slight Non-Injury
Total
Causing death or bodily harm 3 1 (4) 4
Dangerous driving 1 6 (7) 3 10
Driving etc. after consuming alcohol or
taking drugs 3 9 (12) 48 39 99
Careless driving 1 7 (8) 30 11 49
Accident offences 1 1 (2) 3 5
Unauthorised taking or theft of motor
vehicle 1 3 (4) 21 10 35
Driving licence related offences 9 20 (29) 33 11 73
Vehicle insurance offences 13 23 (36) 49 33 118
Vehicle registration and excise licence
offences 1 (1) 1
Work record and employment offences 1 (1) 1
Vehicle test offences 4 (4) 2 6
Fraud, forgery etc., associated with vehicle or driver
records 3 3 6
Vehicle or part in dangerous or
defective condition 1 (1) 6 9 16
Speed limit offences 10 28 (38) 139 102 279
Motorway offences (other than speeding) 2 (2) 1 3
Neglect of traffic directions 1 1 (2) 18 9 29
Neglect of pedestrian rights 1 1 2
Miscellaneous motoring offences 5 (5) 10 6 21
Other 1 1 (2) 3 1 6

Published Project Report
TRL 26 PPR572
4.5 Links between road user types and offending
Table 4-13 shows the DVLA offence histories found split by road user types. The highest percentage of offence histories was for the HGV drivers followed by the LGV drivers, with cyclists having the lowest offence history rate. These two groups also had the highest percentage of PNC offences as shown in Table 4-14.
Table 4-13: Presence of offence histories for identity matched active road users, by road user type
DVLA Offence History Found
% Offence Found
Road User Type
Yes No No DVLA Match
Total
Car Driver 528 938 16 1482 37%
LGV Driver 64 48
112 57%
HGV Driver 41 25
66 62%
Bus Driver 6 9
15 40%
Pedestrian 7 18
25 28%
Cyclist 7 22
29 24%
Motorcyclist 42 69
111 38%
Other
3
3 -
Total 695 1132 16 1843 38%
Table 4-14: PNC histories of identity matched active road users
Road User Type PNC OH Yes
Skeleton Record
PNC OH No Total ID Matched
% PNC OH found
Car Driver 270 1 1211 1482 18%
LGV Driver 35 77 112 31%
HGV Driver 32 34 66 48%
Bus Driver 3 12 15 20%
Pedestrian 7 18 25 28%
Cyclist 7 22 29 24%
Motorcyclist 23 88 111 21%
Other 3 3 0%
Total 377 1 1465 1843 20%

Published Project Report
TRL 27 PPR572
4.6 Causation Factors and Precipitating factors in OTS
4.6.1 Overview
This overview gives a summary of the accident data in terms of collision types, OTS accident causation (precipitating factors) and Contributory Factors. Having considered the most common contributory and precipitating factors, the link between these and some offence histories, in line with reviewed literature can be considered (Section 4.8)
In order to give an overview of an accident and the movement of vehicles in this accident, a collision type is assigned. Figure 4-2 shows the distribution of these collision types for the precipitating road users. This shows the most common collision types for these road users are cornering, lost control off road (straight roads) and rear end.
Figure 4-2: Collision type for all precipitating road users
For each accident in OTS, one precipitating factor is identified and linked to the road user responsible for this factor. Figure 4-3 shows the most common precipitating factors, which were: loss of control, failed to avoid object or vehicle in carriageway and failed to give way.
Figure 4-3: Most common precipitating factors (precipitating only n=1389)
0
50
100
150
200
250
Number of Collisions
0%
5%
10%
15%
20%
25%
30%
35%
40%
45%
Loss of control of vehicle
Failed to avoid object or vehicle in carriageway
Failed to give way
Poor turn or manoeuvre
Percentage
of Accidents

Published Project Report
TRL 28 PPR572
OTS also uses the Contributory Factor system used in STATS19, which was introduced in 2005. For this analysis only those Contributory Factors that were assigned as “very likely to have contributed” were analysed, and the results are shown in Figure 4-4. The most common ‘very likely’ contributory factors recorded were loss of control, careless, reckless or in a hurry and failed to judge other persons path or speed.
Figure 4-4: Most common ‘very likely’ Contributory Factors 2005 (precipitating only n=762)
4.7 Link between precipitating factor and offence type
OTS researchers assign a precipitating factor to an accident when undertaking their investigation. Each precipitating factor is assigned to an individual road user within that accident. It is of interest to investigate whether offence groups could be linked to different precipitating factors, based on the individual to whom the precipitating factor was linked.
4.7.1 Motoring offences
Table D4 shows the number of motoring offences found for each precipitating factor, for drivers to whom the precipitating factor was assigned. The table does not include drivers who were not considered to be “precipitative”.
4.7.2 General offences
Table D5 in is similar to Table D4 but shows general offences, rather than motoring offences.
0%
5%
10%
15%
20%
25%
30%
35%
40%
45%
Loss of control
Careless, reckless or in
a hurry
Failed to judge other persons path or speed
Failed to look properly
Travelling too fast for
conditions
Percentage
of accidents

Published Project Report
TRL 29 PPR572
4.8 Link between causation type and offence type
These analyses were undertaken based on hypotheses developed from previous literature (see section 1.3). Offence codes are those detailed in Table B1 and Table B2. Contributory factors are assigned at the scene by the OTS researcher, using the contributory factors 2005 format and relate to a vehicle (and individual) within the database. A table showing the contributory factors that are recorded can be found in Appendix C. The contributory factor data used in the following tables was only used if the OTS researcher had assigned a confidence of “very likely” that the contributory factor was part of accident causation. Forty percent of drink-drivers had a (previous) criminal record so if drink driving is a contributory factor in the accident, we can expect that the individual to whom the contributory factor is attributed is more likely to have presence of an offence history. Based on evidence that drivers convicted of traffic offences were more likely to have prior convictions (including theft, burglary, criminal damage and violent offences) than those not convicted for traffic offences, this section tests the hypothesis that a link exists between drink or drug driving being a contributory factor and a variety of offence history types. This section only considers those identified on either the DVLA or PNC database. Given the specific nature of some offences, this means that they could be taken from either database.
4.8.1 At fault in a collision and “drugs offences”
Table 4-15 shows the relationship between drugs offences and the fault of the driver. There is a higher percentage of at fault road users for those where a drugs offence was found than for the road users with no drugs offences found. This difference was found to be significant; those who were the precipitating road user in the collision were more likely to have a drugs offences found (received prior, linked or after the collision) than those who were not the precipitating road user.
Table 4-15: Presence of offence code VIII (drugs offences) and fault of active road user
Presence of offence code VIII
No Presence of offence code VIII
Fault (precipitating road user)
53 1336
Not Fault (not precipitating road user)
6 448
2<0.01
4.8.2 At fault in the collision and Drink and/or drug driving offences
Table 4-16 shows the relationship between drugs offences and the fault of the driver. There is a higher proportion of at fault road users for those where a driving after consuming alcohol/drugs offence was found than for the road users with no drugs offences. This difference was found to be significant. ARUs who have an offence relating to drink or drug driving (received prior, linked or after the collision) were more often the precipitating road user than not.

Published Project Report
TRL 30 PPR572
Table 4-16: Presence of offence code 3 (driving etc. after consuming alcohol or taking drugs) and fault of driver
Presence of driving offence code 3
No Presence of driving offence code 3
Fault (precipitating road user)
82 1307
Not Fault (not precipitating road user)
9 445
2<0.01
4.8.3 At fault in the collision and violence offences
Previous research has found a tendency for violent and antisocial social behaviour to be associated with motoring offences. Based on this evidence, there is an expectation that this would link to fault attribution within an accident. Table 4-17 shows a comparison between presence of a violence offence and whether the road user was at fault. Of those where a violence against the person offence was found, 84% were found to be an at fault active road user. For those with no presence of this offence, 75% were the at fault active road user. These differences were found to be significant.
Table 4-17: Presence of offence code I (violence against the person) and fault of driver
Presence of offence code I
No Presence of offence code I
Fault (precipitating road user)
124 1265
Not Fault (not precipitating road user)
23 431
2<0.01
4.8.4 Drink or drug driving (501 or 502) as a contributory factor
4.8.4.1 Presence of Offence history
Table 4-18 considers whether there is a link between the presence of an offence history and whether drink or drug driving was a causation factor in the accident. Whilst drink or drug driving may be a causation factor in the collision, it is considered here as the contributory factor where it is linked to the ARU. The proportions of those where a contributory factor of drink or drug driving was assigned, were very similar between those with and without an offence history (94% and 97% respectively). However, from chi-tests this difference was found to be significant.

Published Project Report
TRL 31 PPR572
Table 4-18: Drink or drug driving as a contributory factor and presence of offence history
Offence history present
No offence history present
Contributory factor 501 or 502 linked to ARU
655 1116
No presence of contributory factor 501 or 502, or factor not linked to ARU
40 32
2<0.01
4.8.4.2 Presence of “Violence against the person” conviction
Table 4-19 shows the link between the contributory factors relating to drink or drug driving and the general offence code I, violence against the person. No significant difference was found between the presence of the contributory factors linked to the ARU and the presence of the violence against the person general offence code.
Table 4-19: Drink or drug driving as a contributory factor and presence of offence code I (violence against the person)
Presence of offence code I
No Presence of offence code I
Contributory factor 501 or 502 linked to ARU
138 1633
No presence of contributory factor 501 or 502, or factor not linked to ARU
9 63
2>0.05
4.8.4.3 Presence of “Burglary”, “Robbery” or “Theft and handling stolen goods” conviction
Table 4-20 shows the link between the contributory factors relating to drink or drug driving and the general offence codes III, IV and V; burglary, robbery, theft and handling stolen goods. No significant difference was found between the presence of the contributory factors linked to the ARU and the presence of these general offence codes.
Table 4-20: Drink or drug driving as a contributory factor and presence of offence codes III, IV or V (burglary, robbery, theft and handling stolen goods)
Presence of offence codes III, IV or V
No presence of offence codes III, IV or V
Contributory factor 501 or 502 linked to ARU
124 1647
No presence of contributory factor 501 or 502, or factor not linked to ARU
3 69
2>0.05

Published Project Report
TRL 32 PPR572
4.8.4.4 Presence of “Criminal damage” conviction
Table 4-21 shows the link between the contributory factors relating to drink or drug driving and the general offence code VII, criminal damage. No significant difference was found between the presence of the contributory factors linked to the ARU and the presence of the offence code relating to criminal damage.
Table 4-21: Drink or drug driving as a contributory factor and presence of offence code VII (criminal damage)
Presence of offence code VII
No presence of offence code VII
Contributory factor 501 or 502 linked to ARU
58 1713
No presence of contributory factor 501 or 502, or factor not linked to ARU
0 72
2>0.05
4.8.4.5 Presence of “Drug offences” conviction
It could reasonably be expected that there may be an association between the presence of a drug offence and whether drink or drug driving was a contributory factor in the accident (and linked to the ARU). Table 4-22 shows that whilst there is a significant difference between the presence of drug offences and a drink or drug driving contributory factor linked to the ARU, the presence of the drug contributory factor was more likely in cases where there was no presence of a drink or drug driving conviction, or where this conviction was not linked to the ARU.
Table 4-22: Drink or drug driving as a contributory factor and presence of offence code VIII (drug offences)
Presence of offence code VIII
No presence of offence code VIII
Contributory factor 501 or 502 linked to ARU
51 1720
No presence of contributory factor 501 or 502, or factor not linked to ARU
8 64
2<0.01 (percentage of those with offence code VIII greater where no presence of contributory factor 501 or 502 than with it)
4.8.5 Aggressive or Careless, reckless or in a hurry (601 or 602) as a contributory factor
Aggressive, careless or reckless driving could be considered to be linked to risk-taking behaviours. Similar to the hypotheses tested in 4.8.4, this section explores the existence of a link between aggressive, careless or reckless driving and a variety of offence history types.

Published Project Report
TRL 33 PPR572
4.8.5.1 Presence of Offence history
Whilst aggressive driving or careless, reckless or in a hurry may be a causation factor in the collision it is considered here as the contributory factor where it is linked to the driver. Table 4-23 shows that there was no significant difference between those with and without an offence history amongst drivers with the contributory factors aggressive driving or careless, reckless or in a hurry assigned.
Table 4-23: Aggressive driving or careless, reckless or in a hurry as a contributory factor and presence of offence history
Offence history present
No offence history present
Contributory factor 601 or 602 linked to ARU
486 831
No presence of contributory factor 601 or 602, or factor not linked to ARU
209 317
2>0.05
4.8.5.2 Presence of “Violence against the person” conviction
As described in section 4.8.3 violent and antisocial behaviour has been found to be associated with motoring offences. Table 4-24 shows a comparison between the presence of a violence offence and whether there was a contributory factor of aggressive driving or one of careless, reckless or in a hurry. Of those with a violence against the person offence 65% were assigned one of these contributory factors, compared to 72% where there was no presence of this offence code. These differences were not found to be significant.
Table 4-24: Aggressive driving or careless, reckless or in a hurry as a contributory factor and presence of offence code I (violence against the
person)
Presence of offence code I
No Presence of offence code I
Contributory factor 601 or 602 linked to ARU
96 1221
No presence of contributory factor 601 or 602, or factor not linked to ARU
51 475
2>0.05
4.8.5.3 Presence of “Burglary”, “Robbery” or “Theft and handling stolen goods” conviction
Table 4-25 shows the link between the contributory factors relating to aggressive driving or being careless, reckless or in a hurry and the general offence codes III, IV and V; burglary, robbery, theft and handling stolen goods. No significant difference was found between the presence of the contributory factors linked to the ARU and the presence of these general offence codes.

Published Project Report
TRL 34 PPR572
Table 4-25: Aggressive driving or careless, reckless or in a hurry as a contributory factor and presence of offence codes III, IV or V (burglary,
robbery pr theft and handling stolen goods)
Presence of offence codes III, IV or V
No presence of offence codes III, IV or V
Contributory factor 601 or 602 linked to ARU
84 1233
No presence of contributory factor 601 or 602, or factor not linked to ARU
43 483
2>0.05
4.8.5.4 Presence of “Criminal damage” conviction
Table 4-26 shows the link between the contributory factors relating to aggressive driving or being careless, reckless or in a hurry and the general offence code VII, criminal damage. No significant difference was found between the presence of the contributory factors linked to the ARU and the presence of these general offence codes.
Table 4-26: Aggressive driving or careless, reckless or in a hurry as a contributory factor and presence of offence code VII (criminal damage)
Presence of offence code VII
No presence of offence code VII
Contributory factor 601 or 602 linked to ARU
38 1279
No presence of contributory factor 601 or 602, or factor not linked to ARU
20 506
2>0.05
4.8.5.5 Presence of “Drug offences” conviction
Table 4-27 shows the link between the contributory factors relating to aggressive driving or being careless, reckless or in a hurry and the general offence code VIII, drugs offences. No significant difference was found between the presence of the contributory factors linked to the ARU and the presence of these general offence codes.
Table 4-27: Aggressive driving or careless, reckless or in a hurry as a contributory factor and presence of offence code VIII (drugs offences)
Presence of offence code VIII
No presence of offence code VIII
Contributory factor 601 or 602 linked to ARU
39 1278
No presence of contributory factor 601 or 602, or factor not linked to ARU
20 506
2>0.05

Published Project Report
TRL 35 PPR572
4.8.6 Exceeding the speed limit or travelling to fast for the conditions (306 or 307) as a contributory factor
Exceeding the speed limit or travelling too fast for the conditions could be considered to be linked to risk-taking behaviours. Similar to the hypotheses tested in section 4.8.4, this section explores the existence of a link between exceeding the speed limit or travelling too fast for the conditions and a variety of offence history types. For example, if the number of speeding offences decreases with the number of non-motoring offences committed, it could be expected that the number of non-motoring offences will be lower in those individuals to whom speed was a contributory factor in the accident. Table 4-28 shows the link between the contributory factors 306 and 307 (exceeding the speed limit or travelling too fast for the conditions) and the presence of offence history. Thirty nine percent of ARUs who had either contributory factor 306 or 307 linked to them had an offence history, compared with 44% of those without either contributory factor. Whilst this difference was significant, it indicates that the presence of an offence history was more likely where there was neither contributory factor 306 or 307 linked to the driver.
Table 4-28: Exceeding the speed limit or travelling too fast for the conditions as a contributory factor and presence of offence history
Offence history present
No offence history present
Contributory factor 306 or 307 linked to ARU
549 964
No presence of contributory factor 306 or 307, or factor not linked to ARU
146 184
2<0.01(percentage of those with an offence history is greater where there is no presence of contributory factor 306 or 307 than with it)
4.8.6.1 Presence of “Violence against the person” conviction
Table 4-29 further explores whether there is a link between aggressive behaviours and some motoring offence types, as described by previous research and considered in sections 4.8.3, 4.8.4.2 and 4.8.5.2. A significant difference was found between the presence of offence code I, violence against the person and contributory factors relating to travelling too fast for the conditions or exceeding the speed limit; 72% of ARUs who had a violence against the person offence found had either contributory factor 306 or 307 linked to them, compared with 83% of those with no presence of that offence code. Therefore, whilst this difference was significant, it indicates that the presence of a violence against the person offence was more likely when there was neither contributory factor 306 or 307 linked to the driver.
Table 4-29: Exceeding the speed limit or travelling too fast for the conditions as a contributory factor and presence of offence code I (violence against the
person)
Presence of offence code I
No Presence of offence code I
Contributory factor 306 or 307 linked to ARU
106 1407
No presence of contributory factor 306 or 307, or factor not linked to ARU
41 289
2<0.01(percentage of those with offence code I is greater where there is no presence of contributory factor 306 or 307 than with it)

Published Project Report
TRL 36 PPR572
4.8.6.2 Presence of “Burglary”, “Robbery” or “Theft and handling stolen goods” conviction
Table 4-30 shows the link between the contributory factors relating to exceeding the speed limit or travelling too fast for the conditions and the general offence codes III, IV and V; burglary, robbery or theft and handling stolen goods. Seventy six percent of those who had an offence code III, IV or V had either contributory factor 306 or 307 (or both) linked to them, compared to 82% with no presence of those offence codes. No significant difference was found between the presence of the contributory factors linked to the ARU and the presence of these general offence codes.
Table 4-30: Exceeding the speed limit or travelling too fast for the conditions as a contributory factor and presence of offence codes III, IV or V (burglary,
robbery or theft and handling stolen goods)
Presence of offence codes III, IV or V
No presence of offence codes III, IV or V
Contributory factor 306 or 307 linked to ARU
97 1416
No presence of contributory factor 306 or 307, or factor not linked to ARU
30 300
2>0.05
4.8.6.3 Presence of “Criminal damage” conviction
Table 4-31 shows the link between the contributory factors relating to exceeding the speed limit or travelling too fast for the conditions and the general offence code VI, handling stolen goods. Seventy four percent of those who had an offence code VI found had either contributory factor 306 or 307 (or both) linked to them, compared to 82% with no presence of the offence code. No significant difference was found between the presence of the contributory factors linked to the ARU and the presence of these general offence codes.
Table 4-31: Exceeding the speed limit or travelling too fast for the conditions as a contributory factor and presence of offence code VII (criminal damage)
Presence of offence code VII
No presence of offence code VII
Contributory factor 306 or 307 linked to ARU
43 1470
No presence of contributory factor 306 or 307, or factor not linked to ARU
15 315
2>0.05
4.8.6.4 Presence of “Drug offences” conviction
Table 4-32 shows the link between the contributory factors relating to exceeding the speed limit or driving too fast for the conditions and the general offence code VIII, drugs offences. No significant difference was found between the presence of the contributory factors linked to the ARU and the presence of these general offence codes.

Published Project Report
TRL 37 PPR572
Table 4-32: Exceeding the speed limit or travelling too fast for the conditions as a contributory factor and presence of offence code VIII (drugs offences)
Presence of offence code VIII
No presence of offence code VIII
Contributory factor 306 or 307 linked to ARU
42 1471
No presence of contributory factor 306 or 307, or factor not linked to ARU
17 313
2<0.05
4.9 Comparison with National Data
The Ministry of Justice provided data on all UK offences between 1999 and 2008 as both motoring offences and non motoring offences. Table 4.33 shows the comparison for both number of offences and number of offenders between the TRL sample and national data. There was a higher percentage of motoring offences in the TRL sample compared to the national sample, which is unsurprising given all individuals within the TRL sample had been involved in a road collision. There was a lower percentage of theft and handling stolen goods offences (17% in the national sample, compared to 1% in the TRL sample) and a higher percentage of fraud and forgery offences (5% compared to 15%).
Table 4-34 shows the number and percentage of each motoring offence code in the national and TRL sample. The national data provided by the Ministry of Justice did not include data for some motoring offence codes, and as such these are not included in either the number or percentage for the TRL sample. There was a lower percentage of offenders and offences relating to drink or drug driving in the TRL sample compared to the National Sample. There was a higher percentage of fraud and forgery associated with the vehicle or driver records in the TRL sample compared to the national sample, although there was the same percentage of offenders within the two samples.
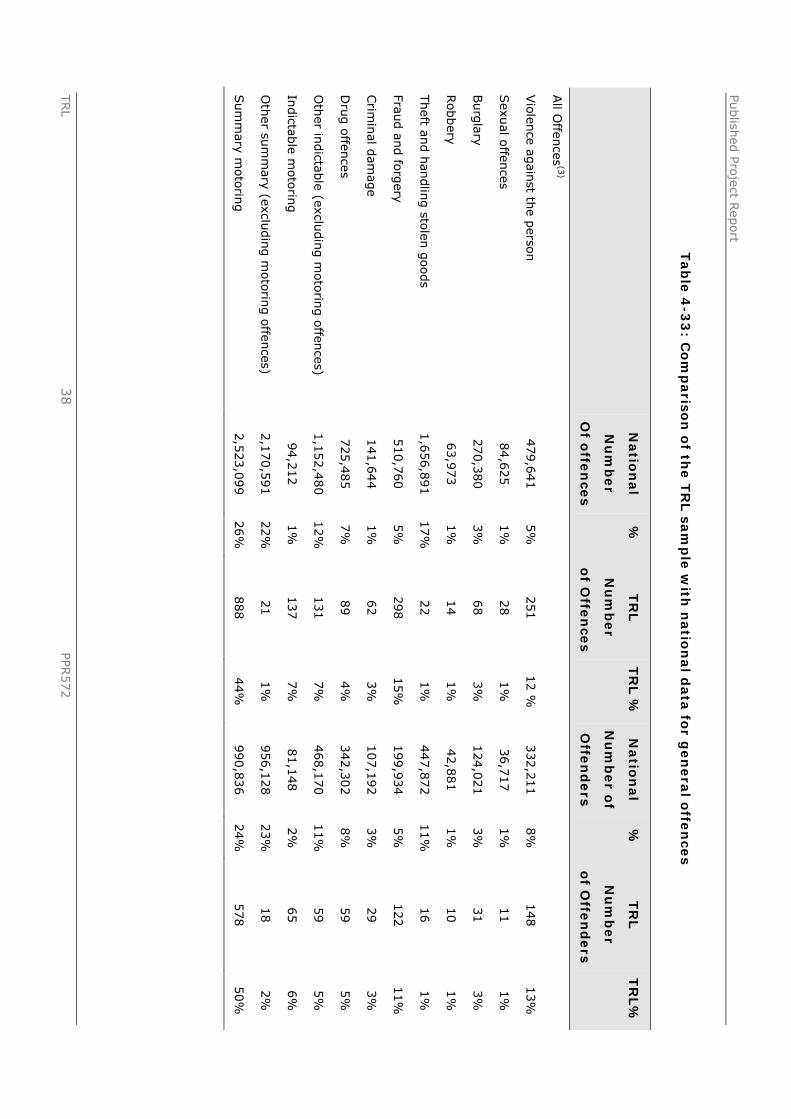
Publish
ed Pro
ject Rep
ort
TRL
38
PPR
572
Tab
le 4
-33
: Co
mp
ariso
n o
f the T
RL sa
mp
le w
ith n
atio
nal d
ata
for g
en
era
l offe
nce
s
N
atio
nal
Nu
mb
er
Of o
ffen
ces
%
TR
L
Nu
mb
er
of O
ffen
ces
TR
L %
N
atio
nal
Nu
mb
er o
f
Offe
nd
ers
%
TR
L
Nu
mb
er
of O
ffen
ders
TR
L%
All O
ffences
(3)
Vio
lence ag
ainst th
e perso
n
479,6
41
5%
251
12 %
332,2
11
8%
148
13%
Sexu
al offen
ces 84,6
25
1%
28
1%
36,7
17
1%
11
1%
Burg
lary 270,3
80
3%
68
3%
124,0
21
3%
31
3%
Robbery
63,9
73
1%
14
1%
42,8
81
1%
10
1%
Theft an
d h
andlin
g sto
len g
oods
1,6
56,8
91
17%
22
1%
447,8
72
11%
16
1%
Fraud an
d fo
rgery
510,7
60
5%
298
15%
199,9
34
5%
122
11%
Crim
inal d
amag
e 141,6
44
1%
62
3%
107,1
92
3%
29
3%
Dru
g o
ffences
725,4
85
7%
89
4%
342,3
02
8%
59
5%
Oth
er indictab
le (excludin
g m
oto
ring o
ffences)
1,1
52,4
80
12%
131
7%
468,1
70
11%
59
5%
Indictab
le moto
ring
94,2
12
1%
137
7%
81,1
48
2%
65
6%
Oth
er sum
mary (exclu
din
g m
oto
ring o
ffences)
2,1
70,5
91
22%
21
1%
956,1
28
23%
18
2%
Sum
mary m
oto
ring
2,5
23,0
99
26%
888
44%
990,8
36
24%
578
50%

Publis
hed
Pro
ject
Rep
ort
TRL
39
PP
R572
Tab
le 4
-34
: C
om
pari
son
of
the T
RL s
am
ple
wit
h n
ati
on
al d
ata
fo
r m
oto
rin
g o
ffen
ces
Mo
tori
ng
Off
en
ce T
yp
e
Nati
on
al
Nu
mb
er
of
Off
en
ces
%
TR
L N
um
ber
of
Off
en
ces
%
Nati
on
al
Nu
mb
er
of
Off
en
ders
%
TR
L N
um
ber
of
Off
en
ders
%
Cau
sing d
eath
or
bodily
har
m
27,1
21
1%
5
1%
23,3
70
1%
5
2%
D
anger
ous
dri
ving
49,7
11
2%
11
3%
45,2
24
3%
11
4%
D
rivi
ng e
tc.
afte
r co
nsu
min
g
alco
hol or
taki
ng d
rugs
892,5
46
35%
110
25%
753,9
92
44%
91
30%
Acc
iden
t offen
ces
128,5
64
5%
6
1%
89,0
22
5%
5
2%
U
nau
thorise
d t
akin
g o
r
thef
t of
moto
r ve
hic
le
112,4
90
4%
55
13%
75,8
77
4%
32
11%
D
rivi
ng lic
ence
rel
ated
offen
ces
597,2
37
24%
88
20%
317,5
85
18%
57
19%
Veh
icle
insu
rance
offen
ces
675,4
70
27%
138
32%
381,6
67
22%
96
32%
Fr
aud,
forg
ery
etc.
,
ass
oci
ated
with v
ehic
le o
r dri
ver
reco
rds
42,9
73
2%
20
5%
36,1
71
2%
7
2%


Published Project Report
TRL 41 PPR572
5 Discussion
5.1 Descriptives
Broughton (2006) previously found that there was a correlation between motoring offences and other types of offence. This study has re-investigated and furthered this work, investigating the correlation between offence histories and accident involvement, regardless of any prosecution resulting from the accident.
Eighty seven percent of active road users in TRL’s OTS database (phases 2 & 3) were matched with the DVLA, PNC or Voters’ databases. Of those matched, almost half (47%) had an offence history.
Offences were separated according to the origin of the data (i.e. PNC or DVLA) and the nature of the offence (general or motoring). General offences included all offences found. In terms of general offences, ‘Summary Motoring’ offences were the most commonly recorded; this was the case for 66% of people with an offence history. Other frequently identified offence groups included: violence against the person, theft and handling stolen goods and drug offences. The most frequently recorded motoring offence was ‘Speed Limit Offences’; this was recorded for 17.5% of people with an offence history. This was followed by drink/drug driving and vehicle insurance offences.
In terms of age, the number of ARUs with identities matched was highest for the 20-34 year age groups. The highest percentage of DVLA offences was found in the 20-24 year age group (with matches for 46%). The lowest rate was found in the 60-64 year age group (23%). These trends through age groups are consistent with those reported nationally (Home Office, 2010). Offences committed by children had the highest percentage of PNC offence history (38%), and a high level of DVLA offences. This may be due to the matching process as someone who is too young to be on the electoral roll may be found on the PNC database, thus a match can be found for the sole reason that they have committed an offence. Only three children were driving or riding a vehicle which they were not old enough to hold a licence for in this dataset. For both DVLA and PNC offence record information, males were more likely to have an offence history than females.
5.2 Link between fault in accident and offence history
Drivers were split into two groups. Where the precipitating factor was linked to the driver, they were categorised as ‘at fault’; where the precipitating factor was linked to another party within the collision, the driver was categorised as ‘not at fault’. Of the ARUs in the DVLA database who were considered to be at fault, 40% were found to have an offence history, compared with 31% of those not at fault having an offence history. Similar trends were found for the link between fault and offence history in the PNC data. Chi square tests identified that for both of the data sources, people who had offence histories were significantly more likely to have been at fault in their accident than those without offence histories. This supports the relationship found in Broughton (2006), which found that people who committed non-motoring offences were more likely to commit motoring offences.
5.3 Link between collision severity and offence history
Based on at-fault drivers only, indictable motoring offences were found to be the general offence type with which the highest proportion of fatal accidents were associated, and this was also the case for serious accidents. When looking specifically at motoring offences, driving licence-related and vehicle insurance offences were found to have the highest proportion of KSI-involved participating road users.

Published Project Report
TRL 42 PPR572
5.4 Link between road user type and offence history
From the DVLA offence histories, it was found that HGV drivers had the highest percentage of offence history (62%), followed by LGV drivers (57%). This is unsurprising given that the average mileages of HGVs and LGVs are higher than those for other modes (derived from DfT (2009)). However, this was also the case for PNC data. Cyclists had the lowest rate of offence history in the DVLA records, whereas in the PNC database car drivers had the lowest rate of offence history. This difference can be explained due to the cyclists only being recorded in the PNC data if they had an offence record, thus increasing the percentage of cyclists that were offenders.
5.5 Link between precipitating factor and offence type
The most common collision types for precipitating road users in accidents were cornering, loss of control/off road (on straight roads) and rear end. The most common precipitating factors in accidents were loss of control, failure to avoid an object or vehicle in the carriageway, and failure to give way. Loss of control was also the most common ‘very likely’ contributory factor according to the contributory factor system (which is the same as that used in STATS19).
An investigation into whether offence groups could be linked to different precipitating factors (based on the individual to whom the precipitating factor was linked) was conducted.
For general offences, the most commonly found precipitating factor linked with summary motoring offences was loss of control, followed by failure to give way. This was also the case for the other frequently identified general offence groups (violence against the person, theft and handling stolen goods and drug offences). Exploration of precipitating factors linked with motoring offence groups identified that for ‘Speed Limit Offences’, the most commonly linked precipitating factors were loss of control and failure to give way, and this was the same for vehicle insurance offences. For drink/drug driving, the most commonly linked precipitating factors were loss control again, and failure to avoid an object/vehicle in the carriageway. Previous work, for example Fails and Lawton (2005), also showed that loss of control was the most common precipitating factor in accidents, and that this factor was disproportionately common in accidents in which speed was a contributory factor.
5.6 Link between causation type and offence type
Bina, Graziano & Bonino (2006) demonstrated a link between risky driving and the use of illicit drugs, alcohol and anti social behaviour. Whilst this previous research was undertaken in Italy, findings from the current study support this within the UK; ARUs who were found to have received a drugs related general offence or motoring related drink and/or drug driving offence were found to be more likely to be at fault in the collision than those who did not have the presence of such an offence code. These offences could have been obtained before, linked to or subsequent to the collision being investigated. ARUs who had a “violence against the person” general offence were also found to be more likely to be the precipitating road user.
A difference in the presence of offence histories relating to the presence of drink or drug driving contributory factors was also found. ARUs with no presence of an offence history were more likely to have a contributory factor linked to drink or drug driving than those with an offence history. Consistent with Broughton (in preparation), the same was also found to be true when considering the contributory factors exceeding the speed limit or travelling too fast for the conditions; ARUs where no offence history was found were more likely to have these contributory factors than those where an offence history was found.

Published Project Report
TRL 43 PPR572
When considering the link between specific offence types and causation factors very few significant differences were found; for most cases investigated no link was found between the presence of a specific offence code and a specific contributory factor linked to the driver. A link was found between the presence of an offence code relating to drugs offences and the presence of drink or drug driving as a contributory factor. These offences could have been obtained prior, linked or subsequent to the collision. However, the presence of drug offences was more likely where there was no presence of contributory factors relating to drink or drug driving linked to that ARU. A link was also found between contributory factors relating to exceeding the speed limit or travelling too fast for the conditions and the presence of an offence for violence against the person; a violence against the person offence was more likely to be present when these contributory factors were not linked to the ARU or were not applicable for that collision.
5.7 Comparison with National data
A higher percentage of motoring offences were recorded in the TRL sample compared with the national sample, which is unsurprising given that all individuals within the TRL sample had been involved in a road collision. The TRL sample also had a higher percentage of fraud and forgery offences compared to the national sample (15% compared to 5%). A lower percentage of theft and handling stolen goods offences was seen when comparing TRL’s sample to the national sample (17% in the national sample, compared to 1% in the TRL sample). Again, this tallies with the relationship found in Broughton (2006), which found a correlation between non-motoring offences and motoring offences, and the most serious motoring offences in particular.
The national data provided by the Ministry of Justice did not include data for some motoring offence codes, and as such these are not included in either the number or percentage for the TRL sample. A lower percentage of offenders and offences relating to drink or drug driving were recorded in the TRL sample compared with the national sample. A higher percentage of fraud and forgery offences associated with the vehicle or driver records was seen in the TRL sample compared with the national sample, but there were the same percentage of offenders within the two samples.
5.8 Study limitations
This study considered the active road users from the OTS database. Whilst the database holds data on a number of road users involved in collisions across a number of factors the number of active road users investigated in this study was 2109; with 1845 being positively identified on PNC, DVLA or voters databases. When considering the link between different contributory factors and different offence types, low numbers were often returned for some groups. This was especially true when considering the presence of different motoring offences, and so the link between these and causation factors could not be fully investigated. Combining data from the TRL and VSRC report may provide sufficient data to investigate these.
Both the PNC and DVLA database have offences removed after a fixed period of time. When DVLA offences are removed from the database, no subsequent trace of them can be found, whilst on the PNC database a skeleton record may be found. It cannot be confirmed whether “no offence present” for either database means that the ARU had never received a conviction, or whether an offence had been removed from the system. This is especially true of the phase 2, and therefore older data, where a smaller percentage of offence histories was found compared to the phase 3 data.
Comparisons on the number and type of offences with National data and comparisons with a similar study undertaken by VSRC were undertaken. Whilst these two data sources provide information as to some differences between the TVP region and other UK regions they do not provide a reliable indication of how these findings may be reflected across the UK.


Published Project Report
TRL 45 PPR572
6 Conclusions and recommendations This section summarises the findings from this study and then presents recommendations for further research.
A difference was found in the offence histories between those who were at fault and those who were not at fault in the OTS investigated collision. Those who were at fault in the collision were more likely to have an offence history than those who were not at fault.
HGV drivers in the sample were more likely to have an offence history (irrespective of fault in the collision) than other road user types. LGV drivers were the second most likely. This suggests that work could be done with fleet managers from companies to monitor and manage offence histories of their HGV and LGV drivers. Examples of ways in which this could be done might include advising on checks that could be made at the recruitment stage and setting up a system for regular licence checking.
Active road users who had an offence relating to drugs offences or a motoring offence of drink or drug driving were more likely to be at fault in the collision than those without such offence types. This suggests that more work could be done to target individuals who engage in drink and/or drug driving, perhaps through Think! campaigns.
Active road users who had a violence against the person offence were more likely to be at fault in the collision than those where no such offence was found. This supports previous research by Bina, Graziano & Bonino (2006).
The TRL sample was found to be similar to the VSRC sample, with the main difference appearing between the offender road user types in the PNC data. Further work would be required to fully investigate the differences and compare them to the national data, but an overview of the results from both projects can be found in the joint annex.
The TRL sample had a higher percentage of fraud and forgery offences and a lower percentage of theft and handling stolen goods offences when compared to national figures. The results from this research may not therefore be nationally representative.
6.1 Recommendations
It is felt that further research could be done to gather more data which would enable more detailed analysis and firmer conclusions to be drawn. For example, in addition to comparing the results from the two centres, it would be beneficial to link the TRL and VSRC databases to provide a larger, more robust sample with which to further explore areas such as links between contributory factors and specific offences.
Offences are frequently removed from both Police and DVLA databases after given periods of time as discussed earlier in this report. Consequently, it is not possible to gain a full understanding of the relationship between driving offences and non-driver offences from this database. It may be possible to gain a better understanding of the relationship by using the 1% DVLA sample1 that TRL holds, which retains details of past driving offences, though the problems associated with the deletion of Police files would remain.
1 An archive of licensing information has been set up at TRL which contains details of approximately 1 per cent of licensed drivers; it contains all of the current DVLA data of interest for this sample of drivers, plus any details which have been removed from the DVLA file. The archive was established in 1986, so the details are essentially complete since 1984. It allows the details of the offences which have been committed over more

Published Project Report
TRL 46 PPR572
Acknowledgements The work described in this report was carried out in the Safety Division of the Transport Research Laboratory. The authors are grateful to Roy Minton who carried out the technical review and auditing of this report.
The authors are also grateful to Liz Fullalove and the Thames Valley Police Team who collected the offence data.
References
Brace, C., Whelan, M., Clark, B., & Oxley, J. (2009). The relationship between crime and road safety. Monash University: Report No 284.
Broughton, J. (2006). The correlation between motoring offences and other types of offence. TRL Report. TRL650. Crowthorne: Transport Research Laboratory.
Bina, M., Graziano, F., & Bonino, S. (2006). Risky driving and lifestyles in adolescence. Accident Analysis and Prevention 38 (3) 472-481.
Chenery, S., Henshaw, C., & Pease, K. (1999). Illegal parking in disabled bays: A means of offender targeting. Briefing Note 1/99. London: Home Office.
Christoffersen, M, Soothill, K, and Francis, B. (2008) Risk Factors for a First time Drink-Driving Conviction among Young Males: A Birth Cohort Study of All Males Born in Denmark in 1966. Journal of Substance Abuse Treatment.
DfT (2009). Reported Road Casualties Great Britain: 2008 Annual Report. London: The Stationary Office.
Donovan, John E. and Richard Jessor. 1985. “Structure of Problem Behavior in Adolescence and Young Adulthood.” Journal of Consulting and Clinical Psychology 55 890-904.
Donovan, John E., Richard Jessor, and Frances M. Costa. 1988. “Syndrome of Problem Behavior in Adolescence: A Replication.” Journal of Consulting and Clinical Psychology 56 762-765.
Fails, A & Lawton, B. (2005). An Investigation into the Role of Speed in Accidents, using ‘On the Spot’ data. Crowthorne: Transport Research Laboratory.
Gottfredson, M. R., & Hirschi, T. (1990). A General Theory of Crime. Stanford, CA: Stanford University Press.
Hatakka, M., Keskinen, E., Gregersen, N.P., Glad, A., Hernetkoski, K. (2002). From control of the vehicle to personal self-control; broadening the perspectives to driver education.
Home Office. (2010). Crime in England and Wales 2009/10: Findings from the British Crime Survey and police recorded crime. Home Office, London.
Jessor, R., & Jessor, S. L. (1977). Problem behavior and psychological development: A longitudinal study of youth. New York: Academic Press.
Junger, M., West, R., & Timman, R. (2001). Crime and Risky Behavior in Traffic: An example of Cross-situational Consistency. Journal of Research and Crime Delinquency, 23(4), 439-459.
than two decades to be linked to the offenders' personal details such as age, sex, region of residence and any previous convictions for driving offences.

Published Project Report
TRL 47 PPR572
Lawton, R, Parker, D, Stradling, S.G. & Mainsteal A.S.R. (1997) Predicting road traffic accidents. British Journal of Psychology, 88, 249-262.
Nochajski, T., Miller, B., Wieczorek, W., & Whitney, R. (1993). The effects of a Drinker-Driver treatment program: does criminal history make a difference. Criminal Justice and behaviour 20 (2), 174-189.
Palk, G., Davey, J. (2005). A comparative analysis of the nature and extent of traffic offences and their relationship to other non-traffic offences. Conference Proceedings: Road Safety Research- Policing and Education (2005).
Parsons, K. (1978). Violence on the road, a logistical extension to the sub-culture of violence thesis? Research Section: Department of Justice, New Zealand.
Richards, DC., Cookson, RE., Cuerden, RW. (2010). Linking accidents in national statistics to in-depth accident data. PPR513. Crowthorne: Transport Research Laboratory.
Rose, G. (2000). The criminal histories of serious traffic offenders. London: Home Office Research Study.
Sugg, D. (1998). Motor projects in England and Wales: An evaluation. Home Office: Research Development and Statistics Directorate.

Published Project Report
TRL 48 PPR572
Appendix A Theories of Human Behaviour
A.1 Theory of Self-Control
Gottfredson and Hirschi (1990) proposed that the likelihood of a person committing crime(s) was based on the level of self-control held by the person and that behaviour is consistent across a range of situations. People with low levels of self-control are more likely to succumb to short-term pleasures with little or no regard for the long term. As a result of this, they are more likely to be involved in risky behaviours and suffer the consequences, which may include traffic accidents, divorce, unemployment and illness (Gottfredson & Hirishi, cited in Brace, Whelan, Clark & Oxley, 2009).
A.2 Hierarchical approach
When examining driver behaviour in relation to road safety, it is important to distinguish between what a driver is capable of doing, and what a driver chooses to do. For example, behaviours that are detrimental to road safety can result from a driver lacking the appropriate skills (i.e. related to capability), or they can result from a driver choosing an inappropriate course of action, even if he or she has high levels of driving skill and knowledge about what is appropriate (i.e. related to choice).
In a 2002 paper, Hatakka, Keskinen, Gregersen, Glad and Hernetkoski presented a four-level descriptive model in which driver behaviour was categorised into hierarchical levels. As seen in Figure A1, this model appreciates that driving behaviour is not an isolated activity and that it is connected with other aspects of life and is affected by motivational and attitudinal issues as well as individual driving skill. The lower two levels (vehicle manoeuvring and mastery of traffic situations) are concerned with drivers’ capabilities; the top two levels (driving goals and context and goals for life and skills for living) are concerned with the choices that drivers make (or factors, such as peer pressure that can influence those choices).
Figure A1. Illustration of hierarchical levels of driver behaviour (adapted from Hatakka et al, 2002)
This can be combined with the knowledge that unsafe driver behaviours can be a result of an error or a violation. The main difference between these two forms of behaviour concerns the role of motivation (intention). Errors are not driven by motivation – people

Published Project Report
TRL 49 PPR572
do not intend to make errors when driving. Errors are therefore underpinned by cognitive failures (e.g. not noticing other road users through distraction or through losing concentration). In driving, distraction can be caused by passengers, in-car devices, and the driver’s own thoughts and feelings. Violations, on the other hand, are driven by motivation (intention). Violations are deliberate deviations from “safe” driving practices (see Reason et al., 1990). According to a dominant theory about the link between attitudes and behaviour, psychological and motivational factors that influence behavioural intentions include: attitudes and intentions, perceived social pressure, perceived control over one’s own performance of the behaviour, moral norm, and anticipated regret. Over-confidence and optimism bias (the tendency to perceive oneself as being less likely than the average person to experience negative events such as road accidents) can also influence drivers to perform risky driving behaviours. These variables are located in the higher levels of the hierarchy, which cover how journey related goals and goals for life can influence driving behaviour.
A.3 Problem-behaviour theory
Problem-Behaviour Theory (PBT) is a psychosocial model that attempts to explain behavioural outcomes such as deviancy, substance use, and risky sexual behaviours (see Jessor & Jessor, 1977). According to Jessor, PBT consists of three independent but related systems of psychosocial components.
1. The personality system includes social norms, individual values, expectations, beliefs, and attitudes.
2. The perceived environmental system consists of proximal and distal social influence factors such as family and peer orientation and expectations regarding problem behaviours.
3. The behaviour system consists of problem and conventional behavioural structures that work in opposition to one another.
Examples of the problem behaviour structure include illicit drug use, tobacco use, alcohol abuse, and deviant behaviour (e.g., delinquency, precocious sexual behaviour). Jessor and colleagues postulated that these problem behaviours stem from individuals’ affirmation of independence from parents and societal influence. In contrast, conventional behaviour structures consist of behaviours oriented toward society’s traditional standards of appropriate conduct such as church attendance and high academic performance. Previous studies have shown positive associations between substance use and deviant behaviours among adolescents and young adults (Donovan & Jessor, 1985; Donovan, Jessor & Costa, 1988). This theory forms the basis of suggestions that different risky behaviours usually take place together and can be considered as risky lifestyles (Brace, Whelan, Clark & Oxley, 2009).

Published Project Report
TRL 50 PPR572
Appendix B Database development An Access database was developed to enable Thames Valley Police (TVP) Staff to enter details of the offender, the general offences and motoring offences via three data entry screens, as shown in sections B.1, B.2, and B.3. Each data entry screen is linked to a table, and each table is linked by the offender case number.
Initial attempts at data entry and liaison with TVP staff highlighted several problems with the database; this feedback enabled database refinements to be made as issues arose. Initially records were checked from all data entry staff for every 20-40 records completed, to ensure correct data recording. As those undertaking the data entry became more experienced with the system, this was extended to 200 records.
Six TVP staff were trained and undertook data entry. Initially, staff were trained by a TRL researcher, but TVP staff proficient in using the database subsequently trained other TVP staff. The average time take by each individual to complete 20 records was two hours.
B.1 Offender details
The first data entry screen, as shown in Figure B1 allows the data inputter to record general details of the offender including:
Whether an identity match was found Where the identity match was found (PNC, DVLA or both) Whether the individual has any DVLA or PNC offence history Driving licence type and entitlements (at current time and when the OTS collision
was recorded)
Figure B1. Offender Details entry screen

Published Project Report
TRL 51 PPR572
B.2 General Offences
Figure B2. General Offences Data Entry Screen
The general offences screen (Figure B2) contains details of all the offences that are linked to an individual, as described by Table B1. Offences are grouped by year and offence type, with the number of arrests and convictions for each offence and year that offence was committed being noted. Whether the offence is prior to, subsequent to or linked to the OTS collision is also noted. For each new offence and/or year a new general offence screen is completed. Each offence therefore has a new line in the general offence table.
Table B1. List of offences to be recorded under General offences
Offence Code General Offence I Violence against the person II Sexual offences III Burglary IV Robbery V Theft and handling stolen goods VI Fraud and forgery VII Criminal damage VIII Drug offences IX Other indictable (ex. motoring offences) X Other summary (ex. motoring offences) XI Indictable motoring XII Summary motoring

Published Project Report
TRL 52 PPR572
B.3 Motoring Offences
Figure B3. Motoring Offences Data Entry Screen
The data entry screen for the motoring offences is shown in B3. Similar to the general offences, motoring offences are grouped by offence type and offence year, and each new offence and/or year is entered by completing a new entry screen. Again, the offence is recorded as being prior to, subsequent to or linked to the OTS collision, and the number of arrests and convictions for each grouped offence noted. Each offence entered into the motoring offences screen is also linked to one in the general offences, as shown by Table B2.
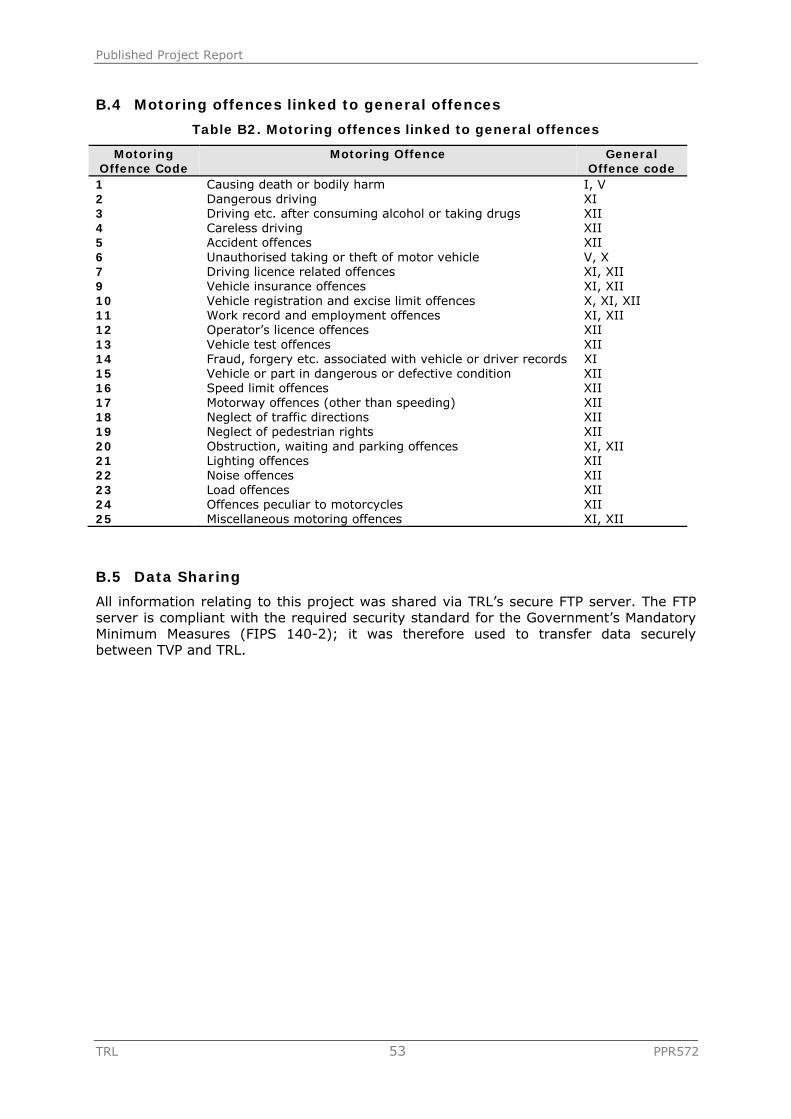
Published Project Report
TRL 53 PPR572
B.4 Motoring offences linked to general offences
Table B2. Motoring offences linked to general offences
Motoring Offence Code
Motoring Offence General Offence code
1 Causing death or bodily harm I, V 2 Dangerous driving XI 3 Driving etc. after consuming alcohol or taking drugs XII 4 Careless driving XII 5 Accident offences XII 6 Unauthorised taking or theft of motor vehicle V, X 7 Driving licence related offences XI, XII 9 Vehicle insurance offences XI, XII 10 Vehicle registration and excise limit offences X, XI, XII 11 Work record and employment offences XI, XII 12 Operator’s licence offences XII 13 Vehicle test offences XII 14 Fraud, forgery etc. associated with vehicle or driver records XI 15 Vehicle or part in dangerous or defective condition XII 16 Speed limit offences XII 17 Motorway offences (other than speeding) XII 18 Neglect of traffic directions XII 19 Neglect of pedestrian rights XII 20 Obstruction, waiting and parking offences XI, XII 21 Lighting offences XII 22 Noise offences XII 23 Load offences XII 24 Offences peculiar to motorcycles XII 25 Miscellaneous motoring offences XI, XII
B.5 Data Sharing
All information relating to this project was shared via TRL’s secure FTP server. The FTP server is compliant with the required security standard for the Government’s Mandatory Minimum Measures (FIPS 140-2); it was therefore used to transfer data securely between TVP and TRL.

Publish
ed Pro
ject Rep
ort
TRL
54
PPR
572
Ap
pen
dix
C
Co
ntrib
uto
ry F
acto
rs Tab
le
Tab
le C
3. C
on
tribu
tory
Facto
rs Tab
le
Ro
ad
En
viro
nm
en
t C
on
tribu
ted
10
1
10
2
10
3
10
4
10
5
10
6
10
7
10
8
10
9
Poor or
defective ro
ad
surface
Dep
osit o
n ro
ad
(e.g. oil, m
ud,
chip
pin
gs)
Slip
pery ro
ad
(due to
w
eather)
Inad
equate o
r m
asked sig
ns o
r ro
ad m
arkings
Defective traffic
signals
Traffic calm
ing
(e.g. sp
eed
cush
ions, ro
ad
hum
ps,
chican
es)
Tem
porary ro
ad
layout (e.g
. co
ntra flo
w)
Road
layout
(e.g. b
end, h
ill, narro
w
carriagew
ay)
Anim
al or ob
ject in
carriagew
ay
Veh
icle
defe
cts 201
202
203
204
205
206
Tyres illeg
al, defective o
r under-in
flated
Defective lig
hts
or in
dicato
rs D
efective brakes
Defective
steering o
r su
spen
sion
Defective o
r m
issing m
irror
Overlo
aded
or
poorly lo
aded
veh
icle or trailer
Inju
dicio
us
Actio
n
301
302
303
304
305
306
307
308
309
310
Diso
beyed
au
tom
atic traffic sig
nal
Diso
beyed
‘Give
Way’ o
r ‘Sto
p’
sign o
r markin
gs
Diso
beyed
double w
hite
lines
Diso
beyed
ped
estrian
crossin
g facility
Illegal tu
rn or
direction
of
travel
Exceed
ing sp
eed
limit
Travellin
g too
fast fo
r co
nditio
ns
Follow
ing to
o
close Veh
icle travellin
g alo
ng
pavem
ent
Cyclist en
tering
road
from
pavem
ent
Driv
er/
Rid
er
Erro
r or
Reactio
n
401
402
403
404
405
406
407
408
409
410
Junctio
n
oversh
oot
Junctio
n restart
(movin
g o
ff at ju
nctio
n)
Poor tu
rn o
r m
anoeu
vre Failed
to sig
nal
or m
isleadin
g
signal
Failed to
look
pro
perly
Failed to
judge
oth
er perso
n’s
path
or sp
eed
Passin
g to
close
to cyclist, h
orse,
rider or
ped
estrian
Sudden
brakin
g
Sw
erved
Loss o
f control
Imp
airm
en
t o
r d
istractio
n
501
502
503
504
505
506
507
508
509
510
Impaired
by
alcohol
Impaired
by
dru
gs (illicit o
r m
edicin
al)
Fatigue
Unco
rrected,
defective
eyesight
Illness o
r disab
ility, m
ental or
physical
Not d
isplayin
g
lights at n
ight in
poor visib
ility
Cyclist w
earing
dark clo
the at
nig
ht
Driver u
sing
mobile p
hone
Distractio
n in
veh
icle D
istraction
outsid
e vehicle
Beh
avio
ur o
r In
exp
erie
nce
601
602
603
604
605
606
607
Aggressive
drivin
g
Carless, reckless
or in
a hurry
Nervo
us,
uncertain
or
pan
ic
Drivin
g to
o slo
w
for co
ndition
s or
slow veh
icle (e.g
. tractor)
Learner o
r in
experien
ced
driver/rid
er
Inexp
erience o
f drivin
g n
the left
Unfam
iliar with
m
odel o
f vehicle
Visio
n
affe
cted
by
701
702
703
704
705
706
707
708
709
710
Station
ary or
parked
veh
icle(s)
Veg
etation
Road
layout
(e.g. b
end
win
din
g ro
ad,
hill crest)
Build
ings, ro
ad
signs, street
furn
iture
Dazzlin
g
head
lights
Dazzlin
g su
n
Rain
, sleet, sn
ow
or fog
Spray from
oth
er vehicle
Viso
r or
win
dscreen
dirty
or scratch
ed
Veh
icle blin
d
spot
Ped
estria
n
On
ly
(casu
alty
or
un
inju
red
)
801
802
803
804
805
806
807
808
809
810
Cro
ssing ro
ad
masked
by
stationary o
r parked
vehicle
Failed to
look
pro
perly
Failed to
judge
vehicle’s p
ath o
r sp
eed
Wro
ng u
se of
ped
estrian
crossin
g facility
Dan
gerou
s action
in
carriagew
ay (e.g
. playin
g)
Impaired
by
alcohol
Impaired
by
dru
gs (illicit o
r m
edicin
al)
Careless,
reckless or in
a hurry
Ped
estrian
wearin
g d
ark clo
thin
g at n
ight
Disab
ility or
illness, m
ental
or p
hysical
Sp
ecia
l co
des
901
902
903
904
999*
Sto
len veh
icle Veh
icle in co
urse
of crim
e Em
ergen
cy veh
icle on call
Veh
icle door
open
ed o
r closed
neg
ligen
tly
O
ther - sp
ecify

Published Project Report
TRL 55 PPR572
Appendix D Additional Tables Table D1. Number of Each General (Top Level) Conviction
No.
Conv.
Offence Groups (see table A5)
I II III IV V VI VII VIII IX X XI XII Total
0 1 1
1 97 7 19 7 10 65 18 40 31 35 16 415 760
2 29 2 5 2 6 21 3 11 16 14 1 96 206
3 9 3 1 9 2 6 5 8 1 40 84
4 5 1 10 4 1 4 3 12 40
5 3 1 7 1 1 5 18
6 4 1 3 1 1 6 16
7 1 1 1 1 4
8 1 2 1 4
9 2 1 1 4
10 1 1 1 3
11 1 1
12 1 1 2
15 1 1 2
23 1 1
25 1 1
Total 148 11 32 10 16 122 29 59 59 65 18 578 1147
Table A5. General offence key
I) Violence against the person VII) Criminal damage
II) Sexual offences VIII) Drug offences
III) Burglary IX) Other indictable (ex. motoring offences)
IV) Robbery X) Other summary (ex. motoring offences)
V) Theft and handling stolen goods XI) Indictable motoring
VI) Fraud and forgery XII) Summary motoring

Publish
ed Pro
ject Rep
ort
TRL
56
PPR
572
Tab
le D
2. N
um
ber o
f each
mo
torin
g co
nvictio
n
Nu
mb
er o
f
Co
nvictio
ns
Mo
torin
g O
ffen
ce G
rou
ps (se
e T
ab
le A
7)
1
2
3
4
5
6
7
9
10
1
1
13
1
4
15
1
6
17
1
8
19
2
5
99
To
tal
0
1
1
1
5
11
77
56
4
22
43
79
2
1
3
6
13
273
3
40
2
18
5
663
2
11
1
1
4
9
11
1
2
40
2
2
2
86
3
1
4
2
3
1
10
1
22
4
2
1
1
1
5
5
1
1
2
8
1
1
2
9
1
1
2
15
1
1
20
1
1
Total
5
11
91
57
5
32
57
96
2
1
4
7
16
324
3
43
2
22
7
785

Publis
hed
Pro
ject
Rep
ort
TRL
57
PP
R572
Tab
le D
3.
Mo
tori
ng
off
en
ce k
ey
1
Cau
sing d
eath
or
bodily
har
m
14
Fr
aud,
forg
ery
etc.
, as
soci
ated
with v
ehic
le o
r dri
ver
reco
rds
2
D
anger
ous
dri
ving
15
Veh
icle
or
par
t in
dan
ger
ous
or
def
ective
conditio
n
3
D
rivi
ng e
tc.
afte
r co
nsu
min
g a
lcohol or
taki
ng d
rugs
16
Spee
d lim
it o
ffen
ces
4
Car
eles
s drivi
ng
17
M
oto
rway
off
ence
s (o
ther
than
spee
din
g)
5
Acc
iden
t offen
ces
18
N
egle
ct o
f tr
affic
dir
ection
s
6
U
nau
thori
sed t
akin
g o
r th
eft
of
moto
r ve
hic
le
19
N
egle
ct o
f ped
estr
ian r
ights
7
D
rivi
ng lic
ence
rel
ated
off
ence
s 20
O
bst
ruct
ion,
wai
ting a
nd p
arki
ng o
ffen
ces
9
Veh
icle
insu
rance
offen
ces
21
Li
ghting o
ffen
ces
10
Veh
icle
reg
istr
atio
n a
nd e
xcis
e lic
ence
offen
ces
22
N
ois
e offen
ces
11
W
ork
rec
ord
and e
mplo
ymen
t offen
ces
23
Lo
ad o
ffen
ces
12
O
per
ator’s
licen
ce o
ffen
ces
24
O
ffen
ces
pec
ulia
r to
moto
rcyc
les
13
Veh
icle
tes
t offen
ces
25
M
isce
llaneo
us
moto
ring o
ffen
ces
99
Oth
er (
spec
ifie
d in n
ote
s)

Publish
ed Pro
ject Rep
ort
TRL
58
PPR
572
Tab
le D
4. L
ink b
etw
een
mo
torin
g o
ffen
ces a
nd
pre
cipita
ting
facto
r in th
e a
cciden
t
M
oto
ring
Offe
nce
Gro
up
s (see T
ab
le A
7)
To
tal
1
2
3
4
5
6
7
9
1
0
11
1
3
14
1
5
16
1
7
18
1
9
25
9
9
Pre
cipita
ting
facto
r
Failed to
Sto
p
1
2
1
1
1
1
1
23
3
3
37
Failed to
give w
ay 1
3
15
8
7
18
23
1
2
55
4
1
2
140
Failed to
avoid
ped
estrian
(ped
estrian n
ot to
blam
e)
1
1
2
5
9
Failed to
avoid
object o
r veh
icle on carriag
eway
1
1
21
13
1
5
6
14
2
49
1
4
1
119
Failure to sig
nal o
r gave
mislead
ing sig
nal
1
1
1
1
4
Loss o
f contro
l of veh
icle 1
2
42
17
1
14
30
50
1
4
2
6
74
1
12
13
2
272
Pedestrian
entered
carriag
eway w
ithout d
ue car
(driver n
ot to
blam
e)
8
2
1
1
1
1
2
9
25
Pedestrian
fell in ro
ad
1
1
1
2
1
6
Sw
erved to
avoid
object o
n
carriagew
ay
1
1
4
6
Sudden
Brakin
g
2
1
1
3
5
1
1
14
Unkn
ow
n
3
8
7
1
5
13
21
1
2
6
53
5
1
3
2
131

Published Project Report
TRL 59 PPR572
Table D5. Link between general offences and precipitating factor in the accident
Offence Groups
I II III IV V VI VII VIII IX X XI XII Total
Precipitating factor
Failed to avoid object or vehicle on carriageway 17 3 4 4 30 4 14 16 15 1 99 207
Failed to avoid pedestrian (pedestrian
not to blame) 2 2 2 1 1 3 7 18
Failed to give way 45 2 11 2 49 4 13 23 5 15 5 120 294
Failed to Stop 7 1 5 3 3 1 36 56
Failure to signal or gave misleading signal 3 3
Loss of control of vehicle 71 1 14 3 65 10 18 40 9 33 3 207 474
Pedestrian entered carriageway without due car (driver not to
blame) 12 1 1 5 1 4 3 24 51
Pedestrian fell in road 1 2 3
Sudden Braking 4 2 5 4 2 5 13 35
Swerved to avoid object on carriageway 3 2 1 7 13
Unknown 30 2 7 1 23 6 8 13 1 17 5 97 210
Failed to avoid object or vehicle on carriageway 17 3 4 4 30 4 14 16 15 1 99 207
Failed to avoid pedestrian (pedestrian
not to blame) 2 2 2 1 1 3 7 18
Failed to give way 45 2 11 2 49 4 13 23 5 15 5 120 294
Failed to Stop 7 1 5 3 3 1 36 56

Published Project Report
TRL 60 PPR572
Appendix E Shared Annex: Linking offence histories to accident causation using OTS data: the VSRC and TRL findings
Elizabeth Dodson & Julian Hill (VSRC)
Rebecca Cookson & Jenny Stannard (TRL)
E.1 Background
The Vehicle Safety Research Centre (VSRC) conducted a feasibility study in 2006-20072 to see whether it was possible to match a sample of crash involved road users, identified from the On The Spot Project (OTS), to Police National Computer (PNC) and Driver Vehicle Licensing Agency (DVLA) records.
The feasibility study was successful, and the VSRC started a follow on project in 2008, with the aim of collecting offence data for all VSRC OTS Phase 2 and 3 active road users (accidents since 29th September 2003) for whom there were sufficient personal details to match their identities with PNC and DVLA records.
Following the success of the VSRC’s project to link OTS and offence histories, TRL were commissioned to undertake similar work for OTS cases in their area (the Thames Valley region), and began data collection in August 2009. Each centre reported individually, to provide an initial overview of the convictions identified, their frequency and how they may be linked to both road user data and collision causation data.
All findings within the Offence Histories study are related to active road users (ARUs) involved in collisions within the Nottinghamshire or Thames Valley regions. The data and findings presented here may not be nationally representative and should not be treated as such. This work demonstrates a methodology for linking collision data and offence data. It is recommended that all findings are reviewed in this context. Further work may be possible in the future to link the results from the two OTS regions, which were chosen, in combination, to be broadly representative of the national road collision data. This shared annex makes some initial broad comparisons between these two datasets, then details some of the key findings from both reports.
2 Dodson, E. & Hill, J. (2007). On The Spot accident data collection Phase II: Offence histories feasibility report. Unpublished study for the Department for Transport (PPAD 9/31/120).

Published Project Report
TRL 61 PPR572
E.2 Core Data and Results
This section provides a summary of data collection and key results from the draft VSRC and TRL Offence History reports. Further work is recommended to explore the regional differences and the potential to combine these results.
The VSRC and TRL submitted 4,639 data requests in total. The breakdown of these requests is illustrated in Table x-1:
Table x-1: Offence history data requests as a percentage of the total OTS Phase 2 & 3 active road users
Research Centre
Total Active Road Users
Offence History Data Requests Submitted
Insufficient Identity Data to Complete
Request Form
VSRC 2882 (100%) 2530 (88%) 352 (12%)
TRL 3041 (100%) 2109 (69%) 932 (31%)
The VSRC submitted a total of 2,530 data requests, of which 2,244 had their identity confirmed by the project data coders at Nottinghamshire police. As a proportion of the data requests sent, this gave an ID matching rate of 89%.
TRL submitted a total of 2,109 data requests, of which 1,845 had their identity confirmed by the project data coders at Thames Valley police. As a proportion of the data requests sent, this gave an ID matching rate of 87%.
Identity matches were based on the name and address of the road user being confirmed on any of the police accessible databases (PNC, DVLA, Voters).
The breakdown of the type of match obtained for these active road users is shown in Table x-2.
Table x-2. Breakdown of level of matching for the active road users
Research Centre
All ARUs DVLA & PNC Match
DVLA only Match
PNC only Match
Voters only Match
No identity match made
VSRC 2882 601 1547 14 82 638
TRL 3041 368 1451 11 15 1196
Within the VSRC data, DVLA and PNC matches were found for 601 of the active road users; the majority (69%) of the matched active road users were matched with DVLA data only.
Within the TRL data, DVLA and PNC matches were found for 368 of the active road users; the majority (79%) of the matched active road users were matched with DVLA data only.
The breakdown of the matched active road users with respect to offence history presence and data source is shown in Table x-3.

Published Project Report
TRL 62 PPR572
Table x-3. Number of Matching ARUs with offence histories
Research Centre
Number of matched
ARUs
DVLA & PNC DVLA only PNC only No Offence History
VSRC 2244 364 434 239 1207
TRL 1845 82 479 312 972
Within the VSRC data 46% of the identity matched active road users were found to have an offence record (n=1037). By comparison, within the TRL data 47% of the identity matched active road users were found to have an offence record (n=873).
The most common offence type within both datasets was summary motoring. The VSRC found summary motoring offence records for 826 ARUs (37% of all ID matched, 80% of all identified offenders). TRL found summary motoring offence records for 578 ARUs (31% of all ID matched, 66% of identified offenders)
The next most frequently identified offence group in both datasets were violence against the person, followed by theft and handling stolen goods. Within the VSRC data, these were associated with 275 and 210 of the active road users respectively. Within the TRL data these were associated with 148 and 122 of the active road users respectively.
Both datasets showed speed limit offences to be the most commonly recorded motoring conviction. The VSRC data included speed offence records for 493 ARUs (22% of all ID matched), by comparison the TRL data included speed offence records for 324 ARUs (18%).
The next most common motoring offences in both datasets were ‘driving etc. after consuming alcohol or taking drugs’ (VSRC 150 ARUs: 7% of all ID matched, TRL 91 ARUs: 5% of all ID matched), and ‘vehicle insurance offences’ (VSRC 144 ARUs: 6% of all ID matched, TRL 96 ARUs: 5% of all ID matched).
Since all road users in this study were involved in a collision, investigation of links between offending and road traffic collisions divided the sample into two groups. This division was based on whether or not each individual was attributed with the precipitating factor by the OTS team and was therefore considered predominantly “at fault” or not in the collision.
Tables x-4 and x-5 show these two groups split by the presence of DVLA offences and matches.
Table x-4: Number of at fault and not at fault drivers in the collision linked with presence of DVLA offence history (VSRC Data)
DVLA offence history
No DVLA offence history
No DVLA Match
Total ID Matched
% DVLA OH
Fault (precipitating road user) 479 669 52 1200 40%
Not Fault (not precipitating road user) 319 679 46 1044 31%
2<0.01
Table x-4 shows the VSRC data, where of the active road users who were considered to be at fault in the accident, 40% were found to have an offence history compared to 31%

Published Project Report
TRL 63 PPR572
of those not at fault. Table x-5 shows the equivalent TRL data to have identical percentages. Using a Chi square test between presence of DVLA offence history and No DVLA offence history or no DVLA match, evidence was found of a significant difference in both datasets.
Table x-5: Number of at fault and not at fault drivers in the collision linked with presence of DVLA offence history (TRL Data)
DVLA offence history
No DVLA offence history
No DVLA Match
Total ID Matched
% DVLA OH
Fault (precipitating road user) 552 826 11 1389 40%
Not Fault (not precipitating road user) 143 306 5 454 31%
2<0.01
Tables x-6 and x-7 show whether the road user was considered to be predominantly at fault or not in the collision and whether they had a general (including motoring) offence linked to them for the PNC data.
Table x-6: Number of at fault and not at fault drivers in the collision linked with presence of PNC offence history (VSRC Data)
PNC OH Yes
PNC OH No
Total ID Matched
% PNC OH Found
Fault (precipitating road user) 409 791 1200 34%
Not Fault (not precipitating road user) 194 850 1044 19%
2<0.01
These results also showed a higher percentage of offences found for those who were recorded as being at fault for the accident and again, Chi square tests showed these differences to be significant in both datasets.

Published Project Report
TRL 64 PPR572
Table x-7: Number of at fault and not at fault drivers in the collision linked with presence of PNC offence history (TRL Data)
PNC OH Yes
PNC OH No
Total ID Matched
% PNC OH Found
Fault (precipitating road user) 321 1068 1389 23%
Not Fault (not precipitating road user) 57 397 454 13%
2<0.01
Table x-8 develops this further to correlate fault and offending with gender, comparing the two regions and data sources. The results from the two separate datasets are closely aligned across all fields.
Table x-8. Comparison of precipitating active road user by gender between the Thames Valley and Nottinghamshire data
Offence data source Precipitating active
road user
Percentage of offenders in group
Nottinghamshire Thames Valley
Male Female Male Female
DVLA Yes 43 31 47 24
No 35 19 37 21
PNC Yes 41 14 42 11
No 24 5 20 5
Looking at age and the identification of offence histories, both the DVLA (Table x-9) and PNC (Table x-10) data show peaks among younger road users. However there are many complexities in the age data – including the fact that some older offences may not be retained on the police databases (potentially driving down recorded offence levels for older road users who offended in their youth), and some younger people (particularly children) may be over-represented as only small numbers were identity matched, and that match in some cases was due solely to the presence of an offence record.

Published Project Report
TRL 65 PPR572
Table x-9: Presence of DVLA offence histories for identity matched active road users, by age group
Age Group VSRC
% DVLA Offence History Found
TRL
% DVLA Offence History Found
Child 24% 43%
17-19 35% 35%
20-24 39% 46%
25-29 42% 43%
30-34 39% 41%
35-39 39% 37%
40-44 38% 36%
45-49 36% 42%
50-54 32% 31%
55-59 30% 28%
60-64 31% 23%
65+ 12% 27%
Unknown 43% 39%
Total 36% 38%

Published Project Report
TRL 66 PPR572
Table x-10: Presence of PNC histories for identity matched active road users, by age group
Age Group VSRC
% PNC Offence History Found
TRL
% PNC Offence History Found
Child 73% 38%
17-19 40% 25%
20-24 34% 26%
25-29 29% 23%
30-34 28% 22%
35-39 27% 19%
40-44 31% 22%
45-49 21% 23%
50-54 14% 14%
55-59 14% 13%
60-64 18% 10%
65+ 7% 9%
Unknown 30% 17%
Total 27% 20%
Tables x-11 and x-12 compare the regional results by road user type for DVLA and PNC offence history data.
Table x-11: Presence of DVLA offence histories for identity matched active road users, by road user type
Road User Type VSRC % DVLA Offence History Found
TRL % DVLA Offence History
Found Car Driver 35% 36%
LGV Driver 54% 57%
HGV Driver 40% 62%
Bus Driver 39% 40%
Pedestrian 14% 28%
Cyclist 8% 24%
Motorcyclist 39% 38%
Other 17% -

Published Project Report
TRL 67 PPR572
Total 36% 38%
Table x-12: Presence of PNC offence histories for identity matched active road users, by road user type
Road User Type VSRC % PNC Offence History Found
TRL % PNC Offence History
Found Car Driver 24% 18%
LGV Driver 38% 31%
HGV Driver 36% 48%
Bus Driver 26% 20%
Pedestrian 32% 28%
Cyclist 44% 24%
Motorcyclist 42% 21%
Other 17% 0%
Total 27% 20%
HGV and LGV drivers were the most frequent offenders in the TRL Thames Valley region, accounting for 48% and 31% of the offenders respectively for the PNC data and 62% and 57% for the DVLA data. Within the VSRC Nottinghamshire region HGV (40%) and LGV (54%) drivers were also the most frequently identified DVLA offenders. However, in the PNC data, the most frequent road user type among the offenders was cyclists (44%) and motorcyclists (42%), with HGV and LGV drivers following these (36% and 38% respectively).
The VSRC and TRL research reports cover many more findings than are compared in this brief annex. Each team produced a core of comparable tables and figures, but also completed their own individual exploration of their regional datasets. The next section illustrates how the figures and tables relate to each other and where data was presented by one research team only.

Published Project Report
TRL 68 PPR572
E.3 Comparison of Figures and Tables Included in the Separate Reports
The following tables show how the tables and figures in the two independent reports relate to each other, to identify where it is possible to compare the separate results.
Table x-13 Comparison of equivalent VSRC and TRL figures
VSRC Figures
TRL Figures
1 Data sharing methodology for VSRC and Nottinghamshire Police
2-1
2-2
Methodology Part A
Methodology Part B
2 Age distribution of all VSRC Phase 2 and 3 active road users compared to the identity matched sample
4-1 Age distribution of all Active Road Users compared to the identity matched sample
3 Gender distribution of all VSRC Phase 2 and 3 active road users compared to the identity matched sample
4 Road user type distribution of all VSRC Phase 2 and 3 active road users except car drivers, compared to the identity matched sample
5 Distribution of known IMD deprivation ranks for ID matched VSRC OTS Phase 2 & 3 active road Users (n=2113)
6 Deprivation and number of convictions for all ID matched active road users (n=2244)
7 Deprivation levels of road users with identified summary motoring convictions (including fixed penalties) (n=826)
8 Gender and deprivation (n=2244)
9 Age and deprivation (ID matched, known age n=2199)
10 Age and deprivation reconfigured (ID matched, known age n=2199)
11 IMD quintiles by road user type (n=2244)
12 IMD quintiles by road user type (percentages within type) (n=2244)
13 Fault in terms of precipitating factor for different data groups
See tables 4-7 and 4-8
14 Fault in terms of precipitating factor for different data groups (percentages within each group)
15 Comparing the percentage of identity matched precipitating (n=1200) and not-precipitating (n=1044) road users

Published Project Report
TRL 69 PPR572
with any conviction for each offence type
16 Comparing the percentage of identity matched precipitating (n=1200) and not-precipitating (n=1044) road users with any conviction for each common motoring offence type (excluding all <1%)
17 Collision type for all precipitating road users (n=1623)
4-2 Collision type for all precipitating road users
18 Most common ‘definite’ and ‘probable’ precipitating factors in VSRC OTS Phase 2 and 3 collisions for all precipitating road users (n=1623)
4-3 Most common precipitating factors (precipitating only n=1389)
19 Most common ‘very likely’ Contributory Factors 2005 for all precipitating road users (n=1623)
4-4 Most common ‘very likely’ Contributory Factors 2005 (precipitating only n=762)
20 Road user type and any known history of a speed offence
21 Most common ‘very likely’ Contributory Factors 2005 for precipitating road users with and without at least one identified speeding conviction
22 Comparison of collision types for ID matched precipitating road users with and without identified speeding offences
23 Comparison of most common ‘definite’ and ‘probable’ precipitating factors for ID matched precipitating road users with and without identified speeding offences
24 Total driving licence/vehicle insurance offences
25 Distribution across the age range of ID matched road users with and without identified driving licence/vehicle insurance offence histories
26 Most common ‘very likely’ Contributory Factors 2005 for precipitating road users with and without at least one identified licence and or insurance conviction
27 Comparison of ‘probable’ and ‘definite’ precipitating factors for ID matched precipitating road users with and without identified licence and/or insurance offences
28 Comparison of collision types for ID matched precipitating road users with

Published Project Report
TRL 70 PPR572
and without identified licence and/or insurance offences
29 Road user type and fault distribution of people with ≥6 identified motoring offences (n=66)
30 Gender and fault distribution of road users with ≥6 identified motoring offences (n=66)
31 Age and fault distribution of road users with ≥6 identified motoring offences (n=66)
32 Collision severity and fault distribution of road users with ≥6 identified motoring offences (n=66)
33 Deprivation and fault distribution of road users with ≥6 identified motoring offences (n=66)

Published Project Report
TRL 71 PPR572
Table x-14 Comparison of equivalent VSRC and TRL tables
VSRC Tables
TRL Tables
1 Top level offence codes B1 List of offences to be recorded under general offences
2 Motoring offence codes B2 Motoring offences linked to general offences
3 Source of identity data 4-1 Breakdown of level of matching for the Active Road Users
4 Source of offence history data 4-2 Number of Matching ARUs with offence histories
5 Number of active road users with any top level conviction by type
D1 Number of Each General (Top Level) Conviction
6 Number of active road users with any motoring conviction by type
D2 Number of each motoring conviction
7 Presence of offence histories for identity matched active road users, by age group
8 Presence of PNC histories for identity matched active road users, by age group
4-4 Presence of PNC histories for identity matched active road users, by age group
9 Presence of DVLA histories for identity matched active road users, by age group
4-3 Presence of DVLA offence histories for identity matched active road users, by age group
10 Presence of offence histories of identity matched active road users, by gender
11 Presence of PNC offence histories for identity matched active road users, by gender
4-6 Presence of PNC offence histories for identity matched active road users, by gender
12 Presence of DVLA offence histories for identity matched active road users, by gender
4-5 Presence of DVLA offence histories for identity matched active road users, by gender
13 Presence of offence histories for identity matched active road users, by road user type
4-13 Presence of offence histories for identity matched active road users, by road user type
14 PNC histories of identity matched active road users
4-14 PNC histories of identity matched active road users
15 Presence of DVLA histories for identity matched active road users, by road user type
16 Violence against the person convictions for ID matched active road users
17 Distribution of IMD deprivation ranks for all VSRC OTS Phase 2 & 3 active

Published Project Report
TRL 72 PPR572
road users
18 Distribution of IMD deprivation ranks for ID matched VSRC OTS Phase 2 & 3 active road users
19 Number of identity matched active road users, by type
20 Presence of offence histories for identity matched active road users, by severity
21 PNC histories of identity matched active road users, by severity
22 Presence of DVLA histories for identity matched active road users, by severity
23 Accident severity and presence of any top level offences, by category (ID matched road users)
4-11 Accident severity and presence of any top level offences, by category
24 Accident severity and presence of any motoring offences, by category
4-12 Accident severity and presence of any motoring offences, by category
25 Presence of offence histories for identity matched active road users, by gender and fault (attribution of precipitating factor)
26 Presence of PNC offence histories for identity matched active road users, by gender and fault (attribution of precipitating factor)
4-10 Presence of PNC offence histories for identity matched active road users, by gender and fault (attribution of precipitating factor)
27 Presence of DVLA offence histories of identity matched active road users, by gender and fault (attribution of precipitating factor)
4-9 Presence of DVLA offence histories for identity matched active road users, by gender and fault (attribution of precipitating factor)
See Figure 13 4-7 Number of at fault and not at fault drivers in the collision linked with presence of DVLA offence history
See Figure 13 4-8 Number of at fault and not at fault drivers in the collision linked with presence of PNC offence history
28 Relationship between speed factors for all precipitating road users
29 Relationship between OTS Causation System variables “In a Hurry” and “Excessive Speed” for all precipitating road users
30 Road users with prior, linked and subsequent speeding convictions – ID matched only
31 Cross tabulation of total prior and subsequent speeding convictions – ID

Published Project Report
TRL 73 PPR572
matched only
32 Relationship between speed limit offences and (very likely) exceeding speed limit contributory factor (p=0.766)
33 Relationship between speed limit offences and (very likely) too fast for conditions contributory factor (p=0.207)
34 Relationship between accident variable “In a Hurry” and speed limit offences
35 Relationship between accident variable “Excessive Speed” and speed limit offences
4-28 Exceeding the speed limit or travelling too fast for the conditions as a contributory factor and presence of offence history
4-29 Exceeding the speed limit or travelling too fast for the conditions as a contributory factor and presence of offence code I (violence against the person)
4-30 Exceeding the speed limit or travelling too fast for the conditions as a contributory factor and presence of offence codes III, IV or V (burglary, robbery or theft and handling stolen goods)
4-31 Exceeding the speed limit or travelling too fast for the conditions as a contributory factor and presence of offence code VII (criminal damage)
4-32 Exceeding the speed limit or travelling too fast for the conditions as a contributory factor and presence of offence code VIII (drugs offences)
36 Relationship between vehicle insurance and driving licence offences
37 Relationship between vehicle insurance and driving licence offences for precipitating and non-precipitating road users
38 Comparison of ‘Impairment through alcohol’ contributory factor for sample group and identified licence/insurance offenders
4-15 Presence of offence code VIII (drugs

Published Project Report
TRL 74 PPR572
offences) and fault of active road user
4-16 Presence of offence code 3 (driving etc. after consuming alcohol or taking drugs) and fault of driver
4-17 Presence of offence code I (violence against the person) and fault of driver
4-18 Drink or drug driving as a contributory factor and presence of offence history
4-19 Drink or drug driving as a contributory factor and presence of offence code I (violence against the person)
4-20 Drink or drug driving as a contributory factor and presence of offence codes III, IV or V (burglary, robbery, theft and handling stolen goods)
4-21 Drink or drug driving as a contributory factor and presence of offence code VII (criminal damage)
4-22 Drink or drug driving as a contributory factor and presence of offence code VIII (drug offences)
4-23 Aggressive driving or careless, reckless or in a hurry as a contributory factor and presence of offence history
4-24 Aggressive driving or careless, reckless or in a hurry as a contributory factor and presence of offence code I (violence against the person)
4-25 Aggressive driving or careless, reckless or in a hurry as a contributory factor and presence of offence codes III, IV or V (burglary, robbery pr theft and handling stolen goods)
4-26 Aggressive driving or careless, reckless or in a hurry as a contributory factor and presence of offence code VII (criminal damage)
4-27 Aggressive driving or careless, reckless or in a hurry as a contributory factor and presence of offence code VIII (drugs offences)
39 Cross-tabulation between conviction numbers for motoring and non-motoring offences
40 Relationship between top level offence history and number of

Published Project Report
TRL 75 PPR572
motoring convictions
41 Cross-tabulation between number of identified summary motoring convictions and number of identified violence against the person convictions
42 Relationship between motoring offence history and number of motoring convictions
43 National data for top level offences 1999-2008 combined (MoJ data – England and Wales)
44 National data for motoring offences 1999-2008 combined (MoJ data – England and Wales)
45 National data for top level offences – number of previous same category offences (over 10 years) for offenders convicted in 2008 (MoJ data – England and Wales)
46 National data for motoring offences – number of previous same category offences (over 10 years) for offenders convicted in 2008 (MoJ data – England and Wales)
47 Number of Offenders aged 18 or over - National data for top level offences (MoJ data – England and Wales)
48 Number of Offenders – OTS ID Matched ARU data for top level offences
4-33 Comparison of the TRL sample with national data for general offences
49 Number of Offenders aged 18 or over - National data for motoring offences (MoJ data – England and Wales)
50 Number of Offenders – OTS ID Matched ARU data for motoring offences
4-34 Comparison of the TRL sample with national data for motoring offences
Table 4-1. Breakdown of level of matching for the Active Road Users ........................ 18
Table 4-2. Number of Matching ARUs with offence histories ...................................... 18
Table 4-3: Presence of DVLA offence histories for identity matched active road users, by age group ................................................................................................... 20
Table 4-4: Presence of PNC histories for identity matched active road users, by age group ......................................................................................................... 21
Table 4-5: Presence of DVLA offence histories for identity matched active road users, by gender ........................................................................................................ 21
Table 4-6: Presence of PNC offence histories for identity matched active road users, by gender ........................................................................................................ 22

Published Project Report
TRL 76 PPR572
Table 4-7: Number of at fault and not at fault drivers in the collision linked with presence of DVLA offence history ................................................................................. 22
Table 4-8: Number of at fault and not at fault drivers in the collision linked with presence of PNC offence history ................................................................................... 23
Table 4-9: Presence of DVLA offence histories for identity matched active road users, by gender and fault (attribution of precipitating factor) .......................................... 23
Table 4-10: Presence of PNC offence histories for identity matched active road users, by gender and fault (attribution of precipitating factor) .......................................... 23
Table 4-11: Accident severity and presence of any top level offences, by category ...... 24
Table 4-12: Accident severity and presence of any motoring offences, by category ..... 25
Table 4-13: Presence of offence histories for identity matched active road users, by road user type .................................................................................................... 26
Table 4-14: PNC histories of identity matched active road users ............................... 26
Table 4-15: Presence of offence code VIII (drugs offences) and fault of active road user ................................................................................................................. 29
Table 4-16: Presence of offence code 3 (driving etc. after consuming alcohol or taking drugs) and fault of driver ............................................................................... 30
Table 4-17: Presence of offence code I (violence against the person) and fault of driver ................................................................................................................. 30
Table 4-18: Drink or drug driving as a contributory factor and presence of offence history ................................................................................................................. 31
Table 4-19: Drink or drug driving as a contributory factor and presence of offence code I (violence against the person) ......................................................................... 31
Table 4-20: Drink or drug driving as a contributory factor and presence of offence codes III, IV or V (burglary, robbery, theft and handling stolen goods) ......................... 31
Table 4-21: Drink or drug driving as a contributory factor and presence of offence code VII (criminal damage) ................................................................................... 32
Table 4-22: Drink or drug driving as a contributory factor and presence of offence code VIII (drug offences) ...................................................................................... 32
Table 4-23: Aggressive driving or careless, reckless or in a hurry as a contributory factor and presence of offence history ...................................................................... 33
Table 4-24: Aggressive driving or careless, reckless or in a hurry as a contributory factor and presence of offence code I (violence against the person) .............................. 33
Table 4-25: Aggressive driving or careless, reckless or in a hurry as a contributory factor and presence of offence codes III, IV or V (burglary, robbery pr theft and handling stolen goods) ............................................................................................... 34
Table 4-26: Aggressive driving or careless, reckless or in a hurry as a contributory factor and presence of offence code VII (criminal damage) .......................................... 34
Table 4-27: Aggressive driving or careless, reckless or in a hurry as a contributory factor and presence of offence code VIII (drugs offences) ........................................... 34
Table 4-28: Exceeding the speed limit or travelling too fast for the conditions as a contributory factor and presence of offence history ........................................... 35
Table 4-29: Exceeding the speed limit or travelling too fast for the conditions as a contributory factor and presence of offence code I (violence against the person) ... 35

Published Project Report
TRL 77 PPR572
Table 4-30: Exceeding the speed limit or travelling too fast for the conditions as a contributory factor and presence of offence codes III, IV or V (burglary, robbery or theft and handling stolen goods) ..................................................................... 36
Table 4-31: Exceeding the speed limit or travelling too fast for the conditions as a contributory factor and presence of offence code VII (criminal damage) ............... 36
Table 4-32: Exceeding the speed limit or travelling too fast for the conditions as a contributory factor and presence of offence code VIII (drugs offences) ................. 37
Table 4-33: Comparison of the TRL sample with national data for general offences ...... 38
Table 4-34: Comparison of the TRL sample with national data for motoring offences .... 39

Published Project Report
TRL 78 PPR572
E.4 Discussion Points
The VSRC and TRL data both showed that males were more likely to have offence histories than females; this applied to both PNC and DVLA offences. Offending appeared to be concentrated among younger age groups, particularly for PNC records, although further research is required to understand this finding, as there are a number of possible explanations that reflect the complexity of collecting and analysing these data.
The highest proportion of identified DVLA offence histories was within the LGV (van) and HGV driver groups for both regions. However there were clear differences in the highest offending groups when looking at the PNC data, with cyclists and motorcyclists featuring more heavily in the VSRC than the TRL results. Further work is recommended to analyse road user groups in more detail, in particular those who can be identified as driving for work. Also further work is recommended to investigate differences in the peak road user types with PNC records, in particular the regional impact of age and deprivation levels.
The VSRC data showed that the highest proportion of road users with offence records were found in the fatal collisions group, with a relatively even spread between all other collision injury-severities. The peak for the fatal collisions group was seen in the PNC data, but not in the DVLA data. Looking at the cases where injury severity was known, there were proportional peaks within the Killed or Seriously Injured (KSI) groups for many of the more serious offences. Overall though, the largest offence group - summary motoring - had a relatively even spread, which was especially visible for speed limit offences (the main summary motoring conviction). Further work is recommended to consider the impact of linked offences on these figures (i.e. convictions resulting directly from the collision).
The TRL data focused on at-fault drivers only with regards to severity, where indictable motoring offences were found to be the general offence type with which the highest proportion of fatal accidents were associated, and this was also the case for serious accidents. When looking specifically at motoring offences, driving licence-related and vehicle insurance offences were found to have the highest proportion of KSI-involved precipitating road users.
Initial exploration of the VSRC and TRL OTS offence data supported the theory that people who take risks by offending, may take greater risks as drivers, as evidenced by fault within the collision causation data. There was a clear proportional increase in collision fault (road users defined as precipitating) among those with offence histories, particularly PNC (Police National Computer) offence histories.
The VSRC and TRL data showed that for every top level offence category (e.g. violence against the person, criminal damage, summary motoring), a proportionately higher percentage of road users within the precipitating group (compared to the non-precipitating group) had at least one offence (with the sole exception of ‘other indictable’ – for which there was no difference). For every motoring offence category, a proportionately higher percentage of road users within the precipitating group (compared to the non-precipitating group) had at least one offence although the difference was comparatively small for speed limit and neglect of traffic direction offences. These tend to be camera based fixed penalties (neglect of traffic directions is commonly a traffic light offence) and having at least one instance of either of these offences on a road user’s record, did not appear to increase the likelihood of being at fault in an accident.
Both teams conducted an initial exploratory analysis of links between specific offence types and causation factors. This limited analysis focused on potential links suggested by the individual teams. TRL reported on these analyses more extensively than the VSRC but identified few significant results. Specifically, TRL identified a significant difference between the presence of an offence code relating to drug offences and the presence of drink or drug driving as a contributory factor where the offence could have been obtained prior to, linked, or subsequent to the collision. Contrary to expected. the

Published Project Report
TRL 79 PPR572
presence of drug offences was more likely where there was no presence of contributory factors relating to drink or drug driving linked to that ARU. However, the small sample size could be a factor in these results, and should be borne in mind with all of the findings of these reports. A significant difference was also found between contributory factors relating to exceeding the speed limit or travelling too fast for the conditions and the presence of an offence for violence against the person. Finally, TRL reported that active road users who had a violence against the person offence were more likely to be at fault in the collision than those where no such offence was found. This supports previous research by Bina, Graziano & Bonino (2006)3.
Data from both establishments showed that speed limit offenders (with offences linked to the collision excluded) were more likely to have caused a collision attributed with the OTS causation system factor excessive speed, compared to those without identified speed limit offences. Otherwise there were only minimal differences between road users with and without speed offence records. Exploration of precipitating factors found minimal differences in collision causation between those with and without licence/insurance offences. However there were stronger relationships within the factors contributing to the causes of accidents, such as impairment through alcohol. It is recommended that these are explored further in future analysis.
The VSRC conducted additional analysis to look at multiple offending. Most road users with one to five motoring convictions had no identified non-motoring convictions (68%). Road users with six or more motoring convictions were more likely to have other identified non-motoring convictions than none at all. Road users with any non-motoring convictions were more likely to have at least 1 identified motoring conviction than to have none. For every top level offence, there was an increase in the percentage of those convicted as the number of motoring offences increased. This increase was particularly notable within the six or more motoring convictions group (n=66). Those with one to five motoring convictions were most likely to have speed limit convictions. Those with six or more motoring convictions were most likely to have vehicle insurance convictions. The typical member of the six or more motoring convictions group was young, male and from a deprived (1st IMD quintile) area. This additional work was not replicated by the TRL team.
The VSRC worked with the Ministry of Justice to explore how national data could be used in the Offence Histories project. It is important to understand how well the sample of OTS offence histories represents the national data, and this can only be done if the data (OTS and national) can be made compatible. The national data comparison was challenging, especially as published data tends to count offences rather than offenders, but a bespoke dataset was collated by the Ministry of Justice to enable a first examination of the national and OTS offence history datasets together. This national dataset was shared with TRL and both establishments carried out some high level comparisons.
For nearly all offence types (motoring and non-motoring) with available national data, the proportion of OTS road users with an offence identified was higher, much higher in many cases, than the national data for the period of 1999 to 2008. This was shown in analyses by both research centres. However, the comparison between OTS and the national figures highlighted a lack of commonality between the datasets, especially regarding offences that were not dealt with by the courts, which were not included in the available national data. Further work on harmonization of these datasets is recommended alongside the exploration of additional national data availability. It is also suggested that Offence Histories results from both the VSRC and TRL study regions should be combined and analysis conducted on the extent to which this collective data is nationally representative.
3 Bina, M., Graziano, F., & Bonino, S. (2006). Risky driving and lifestyles in adolescence. Accident
Analysis and Prevention 38 (3) 472-481.

Published Project Report
TRL 80 PPR572
The VSRC also mapped postcode based deprivation data into their offence histories dataset. Overall the IMD (Index of Multiple Deprivation) distribution was not an even spread but was skewed towards greater levels of deprivation, this being particularly apparent when focusing on the at fault road users (those identified as the precipitating road user in an OTS investigated collision). Road users with six or more convictions (motoring and/or non-motoring) were identified mostly within the 1st quintile of deprivation (the most deprived group), with steadily decreasing numbers across the quintiles. Road users with one to five convictions did not show the same linear relationship with deprivation although the peak was still within the 1st quintile; the next greatest number was within the fourth quintile, which is the second least deprived group. It is likely that this reflects the large number of summary motoring convictions (including fixed penalties) which could be found across the sample. Road users with no identified convictions showed a different pattern of deprivation again with peaks in the average 3rd quintile and the least deprived 5th quintile. This additional work was not replicated by the TRL team.

Published Project Report
TRL 81 PPR572
E.5 Overall Summary
The offence histories project successfully demonstrated a way to link in-depth data on the causes of collisions with data on the offence histories of the active road users involved. The project reports each demonstrated a useful set of initial findings and the potential for further use of this data.
It should however be re-emphasized at this point that all findings within the study are related to active road users involved in collisions within the Nottinghamshire and Thames Valley regions. The data and findings presented may not be nationally representative and should not be treated as such. This work demonstrates a methodology for linking collision data and offence data, and the depth and potential of the new data now available for analysis once it has been fully validated against other OTS and national sources of data. It is recommended that all findings are reviewed in this context.
Further work may be possible in the future to link the VSRC and TRL results. Together, the Nottinghamshire and Thames Valley regions contribute to the full OTS sample plan which has been designed to provide in-depth accident data that is broadly representative of the national picture. Future work could very usefully combine offence history data with the accident data for both OTS regions which might in turn be compared with suitably prepared national data. In that way it would be possible to understand better this in-depth data, its strengths and limitations, and the national implications.
While the reports were primarily intended to demonstrate the depth of new data now available for further validation, the data presented do provide useful indications for further work in this area, highlighting issues such as:
Peaks in offending amongst young collision involved road users
Links between deprivation and precipitating a road traffic collision
The relationship between deprivation and driving without a licence and/or insurance
Offending among people driving for work
Identification of offending sub-groups within specific road users types
Differences in offending between road users involved in KSI collisions, compared to slight and non-injury
Gender differences in the link between offending and precipitating a road traffic collision
Differences in offence types between road users with different levels of repeat offending
Links between specific offence types and specific precipitating factors
Potential over-representation of offending amongst collision involved road users, compared to the national data


TRL Crowthorne House, Nine Mile Ride Wokingham, Berkshire RG40 3GAUnited Kingdom
T: +44 (0) 1344 773131 F: +44 (0) 1344 770356E: [email protected] W: www.trl.co.uk
ISSN 0968-4093
Price code: 4X
Published by IHS Willoughby Road, Bracknell Berkshire RG12 8FB United Kingdom
T: +44 (0) 1344 328038 F: +44 (0) 1344 328005E: [email protected] W: http://emeastore.ihs.com PP
R5
72
Linking offence histories to accident causation using OTS data
This research project explores the links between offence histories and accident involvement of over 2000 active road users (ARUs) whose accident data were collected by TRL On The Spot (OTS) researchers between October 2003 and March 2010. The first part of the research matched ARUs from the OTS database onto the DVLA, PNC or Voters’ databases. Matches were found for 87% of ARUs, with 47% of these having a previous offence on either the DVLA or PNC database (or both). The most common general offence type found was for summary motoring and the most common motoring offence type was for speed limit offences. Of the matched ARUs, 40% who were considered to be at fault in the OTS recorded accident were found to have an offence history compared to 31% of those who were not considered to be at fault. Similarly, those ARUs who had drink and drug driving offences were more likely to be at fault in the accident, as were those who had a drugs related general offence. This suggests that more work could be done to target individuals who engage in drink and/or drug driving, perhaps through Think! campaigns. HGV drivers had the highest percentage of both DVLA and PNC offences, followed by LGV drivers. The results related to road user type suggest that work could be done with fleet managers from companies to monitor and manage offence histories of their HGV and LGV drivers. Examples of ways in which this could be done might include advising on whether adequate checks are made at the recruitment stage and setting up a system for regular licence checking. Comparison of the results in the Thames Valley region to a parallel report written by VSRC on the Nottinghamshire region generally found similar trends in offending.
Other titles from this subject area
INS005 How can we produce safer new drivers? S Helman, G B Grayson and A M Parkes. 2010
TRL673 Monitoring progress towards the 2010 casualty reduction target – 2008 data. J Broughton and J Knowles. 2010
PPR522 Cross-modal safety: risk and public perceptions – phase 2 report. D Lynam, J Kennedy, S Helman and T Taig. 2010
PPR513 Linking accidents in national statistics to in-depth accident data. D C Richards, R E Cookson and R W Cuerden. 2010
PPR498 Further analyses of driver licence records from DVLA. J Broughton and B Lawton. 2010


