41


Darla Inglis, Ph.D. www.lowimpactdevelopment.org
Linking Stormwater and Groundwater Management: the role of Low Impact
Development
EPA Region 9Western States Source Water and Ground Water Protection Forum Asilomar Conference Grounds, Pacific Grove, CA May 5-7, 2009

The Mechanistic Model is how we address environmental issues
Need to integrate into a Watershed Model
stormwater wastewatergroundwaterwater supply
energyclimate change
& LID
What take home or thought provoking messages do you want the audience to get?
An increasingly “sustainable watershed” perspective of water resource management is moving us from an issue specific approach toward a broader context of risks, benefits, and consequently, appropriate solutions.
This will necessitate an understanding (and coordination!) of related water resource management disciplines including regulatory, technical and policy considerations.

Presentation Outline:
1. Evolution of stormwater management and the role of LID
2. Pollutant fate in stormwater management systems and risk to groundwater resources
3. Solutions to improve LID use for water resource management

Evolution of Stormwater Management and the Role of LID
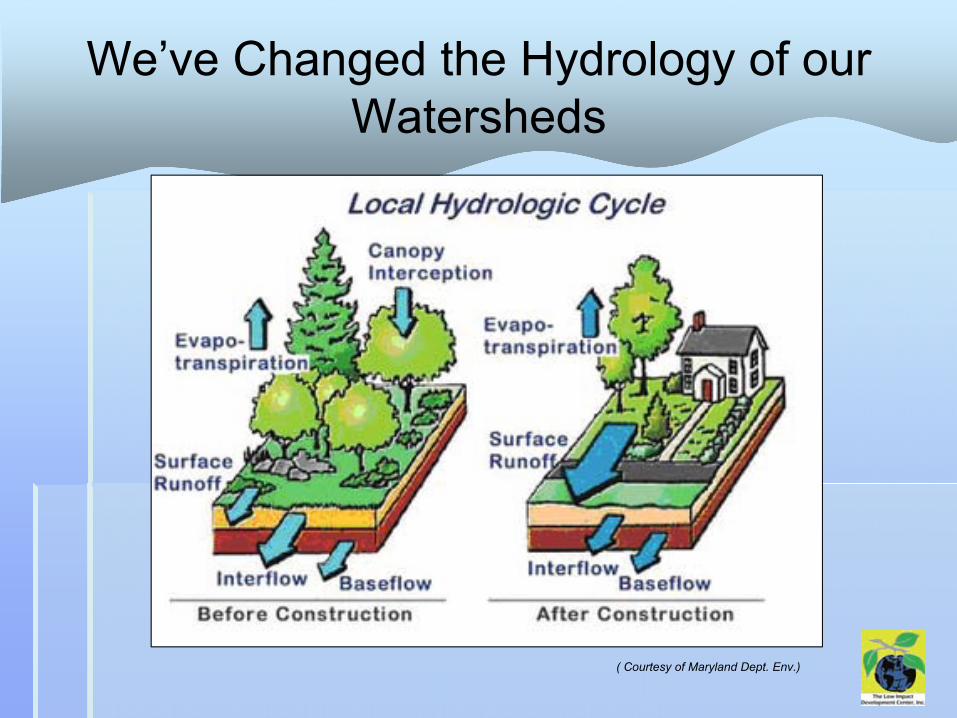
We’ve Changed the Hydrology of our Watersheds
( Courtesy of Maryland Dept. Env.)

This urban hydrology has negative impacts to public health, property, and the environment.
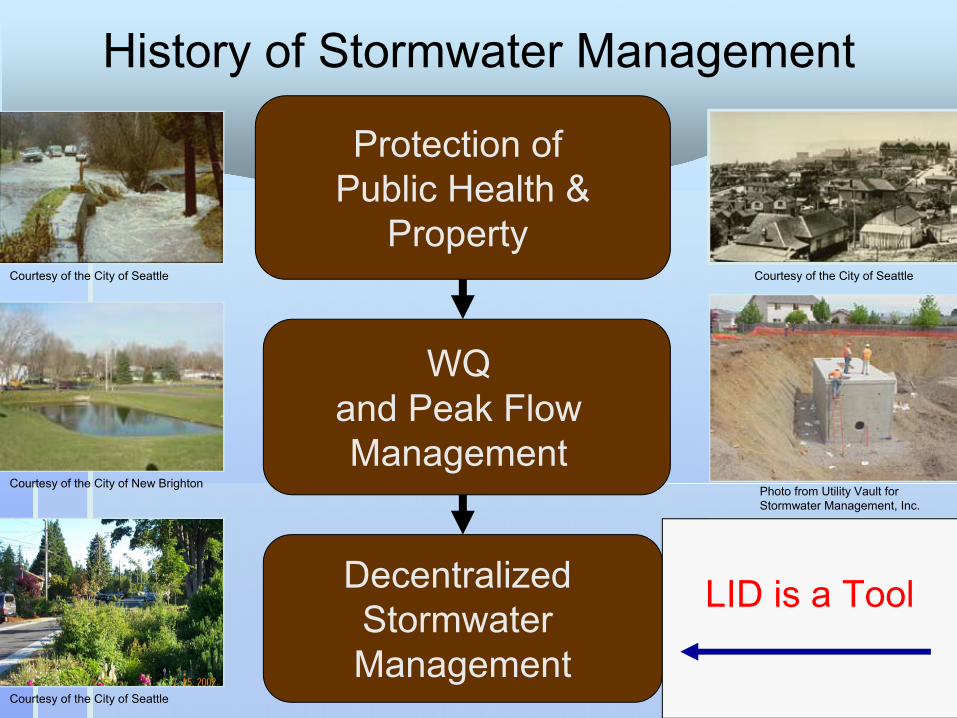
Protection of Public Health &
Property
DecentralizedStormwaterManagement
WQand Peak Flow Management
History of Stormwater Management
Courtesy of the City of Seattle
Courtesy of the City of Seattle
Courtesy of the City of Seattle
Photo from Utility Vault for Stormwater Management, Inc.
Courtesy of the City of New Brighton
LID is a Tool

What is LID?
LID is an approach that ….
…mimics the predevelopment site hydrology
by using:
site planning (nonstructural) and
management practices (structural)
that store, infiltrate, evaporate, and detain runoff. WQ treatment objectives can also be addressed.

What does it mean to “mimic the predevelopment hydrograph?”
Courtesy Carlton College, MN
must address peak, duration, & volume

Examples of LID Strategies and BMPs
Non-structural
-Minimize Impervious Surface
Structural
-Porous pavements
-Bioretention
-Downspout disconnection
-Cisterns
-Green roofs

Non-structural LID Example: Minimize Impervious Areas
1) alternative roadway layout
53.32acres of publicstreet
82.35acres ofpublicstreet
35%difference!

LID Structural Practices: Permeable Paving
What is it?A porous surface that allows rainwater to percolate down into the ground instead of running off.
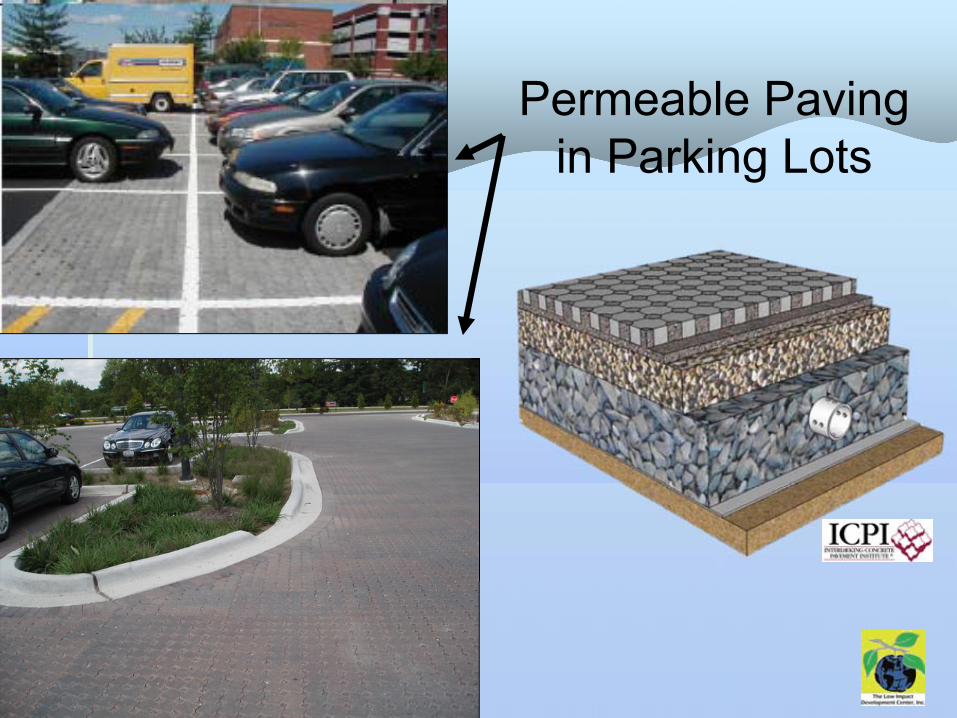
Permeable Paving in Parking Lots

rain gardens
.
LID Structural Practices: Bioretention
LID stormwater volume and water quality design with a depressed shape, appropriate vegetation, and amended soils.
curb bulb extension
planting strip

LID Techniques: Bioswales
BEFORE LID: BIOSWALE AFTER

Parking lot bioswale
Street right-of-way bioswale
More LID bioretentiondesigns

Perforated UnderdrainGravel Layer
Impermeable Liner*
Bioretention Soil MixMulch LayerNative PlantingsOverflow Weir to Storm Sewer
Geotextile
Components of a Bioretention System
Pollutant fate in stormwater management systems and risk to groundwater
resources
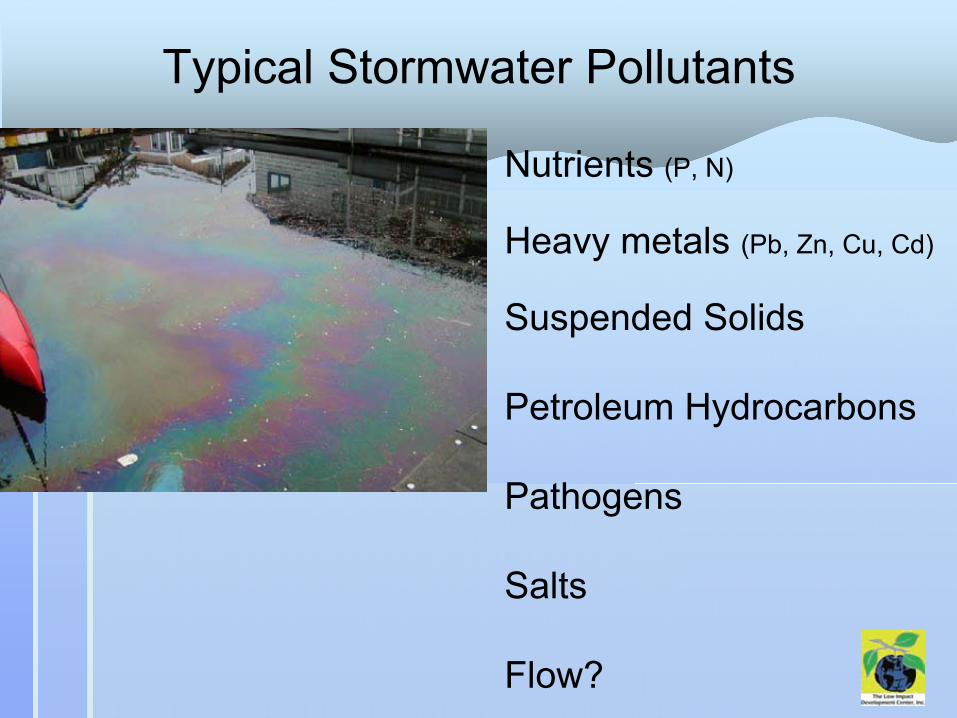
Nutrients (P, N)
Heavy metals (Pb, Zn, Cu, Cd)
Suspended Solids
Petroleum Hydrocarbons
Pathogens
Salts
Flow?
Typical Stormwater Pollutants

Pollutant Fate in an LID System
-Sedimentation -Degradation-Filtration -Plant Uptake-Adsorption -Volatilization-Redox -Pass through
-subsurface/groundwater contamination
StormwaterIn
StormwaterOut
LID Infiltrative Systems: Design and Maintenance Considerations for
Groundwater Protection
Factors:
-Location of LID facility in the watershed-Pollutant type and concentration-Underlying Soil type -LID facility design-LID facility operation and maintenance

Groundwater Considerations When Using LID
Location of the LID facility in the Watershed
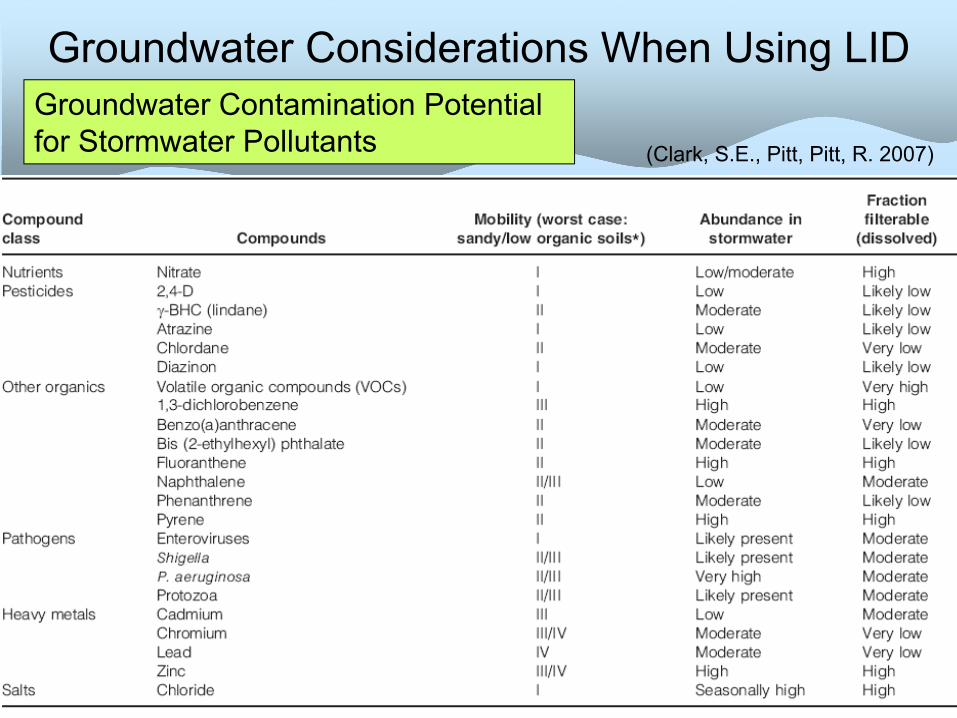
(Clark, S.E., Pitt, Pitt, R. 2007)
Groundwater Contamination Potentialfor Stormwater Pollutants
Groundwater Considerations When Using LID

Groundwater Considerations When Using LID
Underlying Soil Conditions
Jeff Fowler, City of Seattle
City of Seattle Infiltration PotentialMap
Looked at:
Surface and underlying soilSoil layeringDepth to groundwaterSteep slopes

Groundwater Considerations When Using LID
LID Facility Design
Include design elements to enhance treatment and minimize groundwater/soil contamination
Courtesy of Seattle Public Utilities
Groundwater Considerations When Using LID
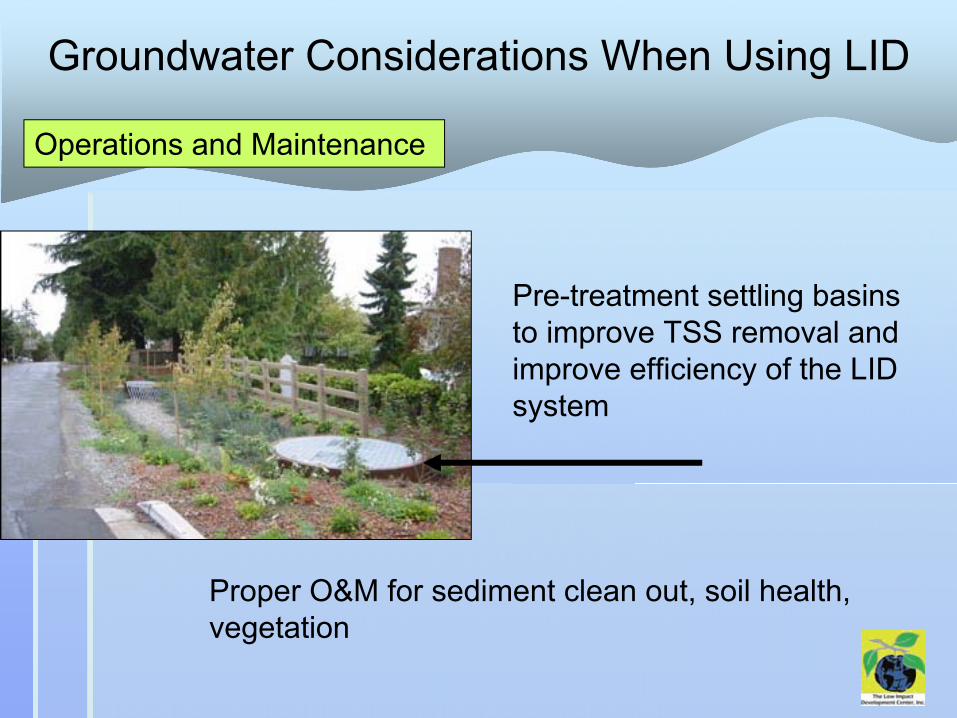
Operations and Maintenance
Proper O&M for sediment clean out, soil health,vegetation
Pre-treatment settling basinsto improve TSS removal andimprove efficiency of the LID system
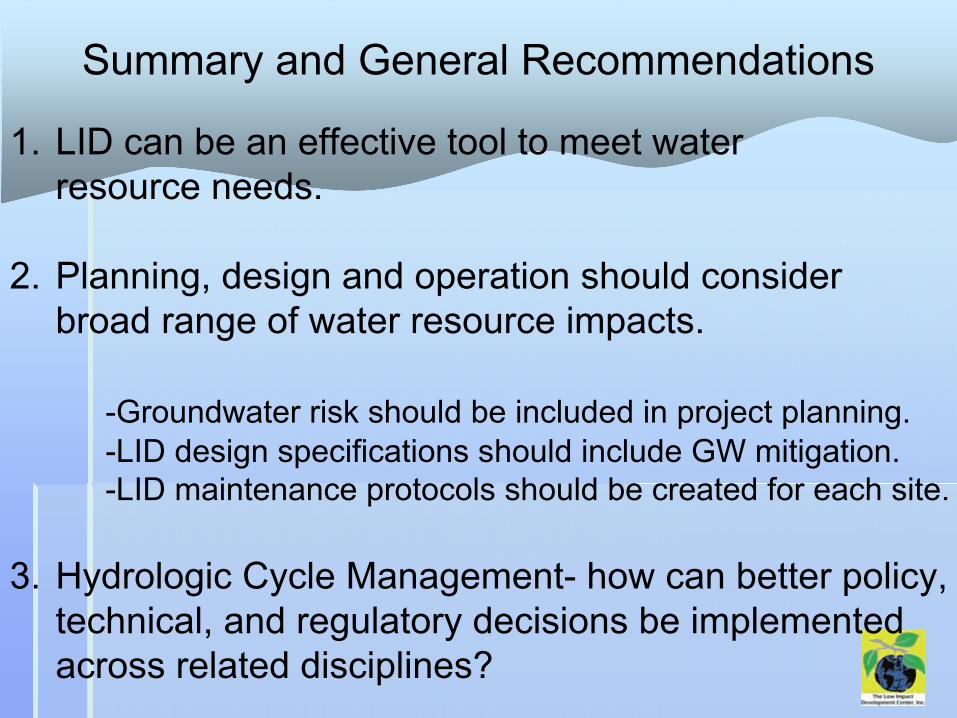
Summary and General Recommendations
1. LID can be an effective tool to meet water resource needs.
2. Planning, design and operation should consider broad range of water resource impacts.
-Groundwater risk should be included in project planning. -LID design specifications should include GW mitigation. -LID maintenance protocols should be created for each site.
3. Hydrologic Cycle Management- how can better policy, technical, and regulatory decisions be implemented across related disciplines?

Presentation References:
Clark, S.E., Pitt, R. 2007. “Influencing factors and a proposed evaluation methodologyfor predicting groundwater contamination potential from stormwater infiltration practices.”Water Environment Research, 79, 29-36.
Weiss, P.T., LeFevre, G., Gulliver, J.S. 2008. “Contamination of soil and groundwater due to stormwater infiltration practices.” Project Report No.515. University of Minnesota Stormwater Assessment Project. http://www.safl.umn.edu

U.S. Water Supply
Universal access to potable water.
World’s highest per capita use – approximately twice that of Europe.
Cost of water is among the lowest in the world.
Average cost nationally approximately $2 per 1,000 gallons

U.S. Water Supply
Population growth & development increasing demand.
Sustained droughts in Southeast & Southwest.
Climate change may decrease snowpack.
Water managers in 36 states anticipate water shortages by 2020.
Prettyboy Reservoir, Maryland during 2002 drought. Photo courtesy of National Weather Service.

Domestic Water UseTypical Domestic Daily per Capita Water Use. Use Gallons per Capita % of Daily Total
Potable indoor uses Showers Dishwashers Baths Faucets Other uses, leaks
11.61.01.210.911.1
7.0%0.6%0.8%6.6%6.7%
Subtotal 35.8 21.7% Non-potable indoor uses Clothes washers Toilets
15.018.5
9.1%11.2%
Subtotal 33.5 20.3% Outdoor uses 95.7 58.0%
American Waterworks Association Research Foundation (AWWARF), Residential End Uses of Water, Denver, CO, AWWARF, 1999.
The Link Between Water Supply & Energy Use
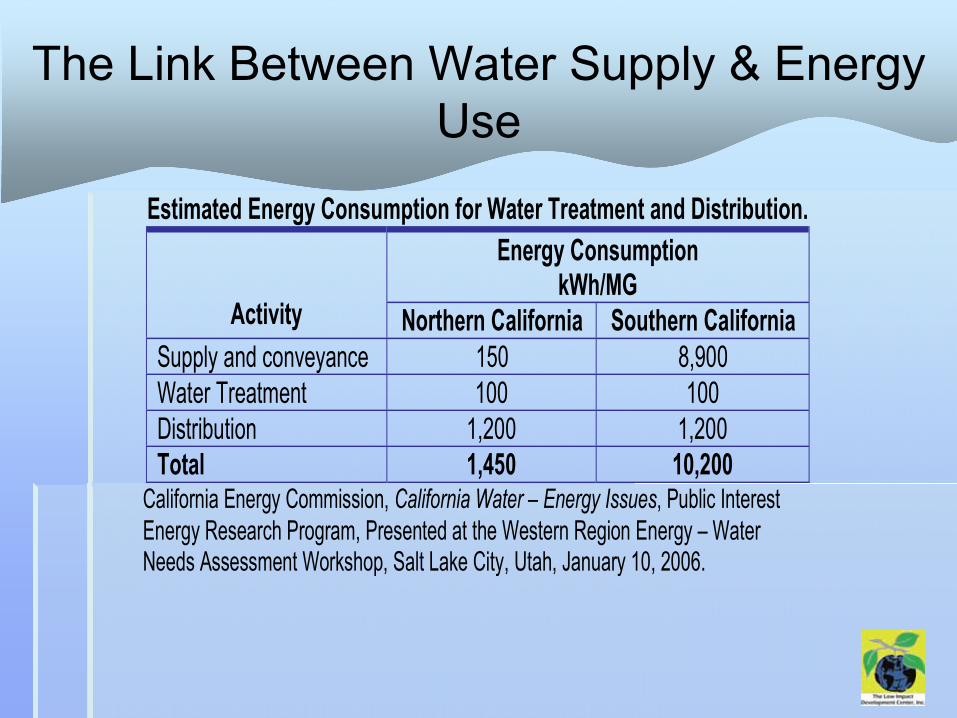
Estimated Energy Consumption for Water Treatment and Distribution. Energy Consumption
kWh/MG Activity Northern California Southern California
Supply and conveyance 150 8,900 Water Treatment 100 100Distribution 1,200 1,200 Total 1,450 10,200
California Energy Commission, California Water – Energy Issues, Public Interest Energy Research Program, Presented at the Western Region Energy – Water Needs Assessment Workshop, Salt Lake City, Utah, January 10, 2006.
Reducing water demand 10% could save 293 billion kWh of electricity each year.
Energy costs account for 80% of typical water bill.
7 to 8% of national energy consumption tied to treating and distributing water.
Michael Nicklas, Rainwater, High Performance Buildings, Summer 2008.G. Tracy Mehan, Energy, Climate Change, and Sustainable Water Management, Environment Reporter, 2007.
Facts Related to Water Supply

The Link Between Water Supply & CO2Emissions
Carbon Dioxide Emissions from Electric Power Generation.
Fuel Type CO2 Output Rate
lbs CO2/kWh
CO2 Output per MG Water Delivered (x 1,450 kWh)
Northern CA
CO2 Output per MG Water Delivered (x 10,200 kWh)
Southern CA Coal 2.117 3,070 lbs 21,600 lbs Petroleum 1.915 2,775 lbs 19,500 lbs Natural gas 1.314 1,905 lbs 13,400 lbs
U.S. Department of Energy and U.S. EPA, Carbon Dioxide Emissions from the Generation of Electric Power in the United States, July 2000.

Are we looking at
these issues correctly?

Rainwater Harvesting to Address Water Supply Issues:
Beyond Stormwater Management
Chicago Center for Green Technology. Photo courtesy of Farr Associates.

Chesapeake Bay Foundation HQ
Rainwater collected in 3 exposed cisterns.
Captured water used for bathroom, sinks, gear washing, irrigation, fire suppression, and laundry.
90% decrease in potable water use.
73% of water used in building from cistern system.
Philip Merrill Building cisterns. Photo: Chesapeake Bay Foundation.

NRDC – Santa Monica, CA
Cisterns installed beneath planting beds.
Collected rainwater is added to graywater collection system and used for toilet flushing and irrigation.
Building uses duel-flush toilets, waterless urinals, and drought-tolerant plants.
60% reduction in potable water demand.
Cisterns at NRDC Santa Monica, Office

Stephen Epler Hall – Portland, OR62,500 sf mixed-use student housing.
Roof runoff is diverted to river rock “splash blocks” in public plaza and then to planter boxes.
Effluent from planter boxes collected in underground cisterns.
UV used to treat water prior to use.
Saves over 100,000 gallons of potable water each year.
Epler Hall, PSU.


![1B Gray.pptx [Read-Only] - Managing Stormwater in Washington · Managing Difficult Pollutants: PAHs, PCBs, and Other Trace Organics ... – Groundwater quality and soil contamination](https://static.documents.pub/doc/80x56/5f9b7025353db75ff0117bc9/1b-graypptx-read-only-managing-stormwater-in-washington-managing-difficult.jpg)