LINKING STREAM HEALTH AND LAND USE IN THE UNIVERSITY OF DELAWARE EXPERIMENTAL WATERSHED by Tara L. Harrell A thesis submitted to the Faculty of the University of Delaware in partial fulfillment of the requirements for the degree of Bachelor of Science in Natural Resource Management with Distinction. Spring 2002 Copyright 2002 Tara L. Harrell All Rights Reserved
Transcript
LINKING STREAM HEALTH AND
LAND USE IN THE
UNIVERSITY OF DELAWARE
EXPERIMENTAL WATERSHED
by
Tara L. Harrell
A thesis submitted to the Faculty of the University of Delaware in partial fulfillment of the requirements for the degree of Bachelor of Science in
Natural Resource Management with Distinction.
Spring 2002
Copyright 2002 Tara L. Harrell All Rights Reserved
LINKING STREAM HEALTH AND
LAND USE IN THE
UNIVERSITY OF DELAWARE
EXPERIMENTAL WATERSHED
by
Tara L. Harrell
Approved:____________________________________________________ Gerald Kauffman, P.E. Advisor in charge of the thesis on behalf of the Advisory Committee Approved:____________________________________________________ Steven Hastings, Ph.D. Professor in charge of the thesis on behalf of the Advisory Committee Approved:____________________________________________________ Joshua Duke, Ph.D.
Committee member from the Department of Food and Resource Economics
Approved:____________________________________________________ Karen A. Curtis, Ph.D. Committee member from the Board of Senior Thesis Readers Approved:____________________________________________________ Linda Gottfredson, Ph.D.
Chair of the University Committee on Student and Faculty Honors
ii
Acknowledgements
This research report was prepared by Tara Harrell to fulfill the requirements of
the University Committee on Student and Faculty Honors for Senior Theses, as well as
the Undergraduate Internships in Water Resources program funded by the Delaware
Water Resources Center (DWRC). Many thanks goes to Dr. Tom Sims and Amy Boyd
of the DWRC for their organization and leadership in developing this program to provide
opportunities for undergraduate research. Bernard Dworsky was successful in securing
matching funding for the project. Gerald Kauffman created the concept of the
Experimental Watershed and was instrumental in directing the research to its current
status as Project Advisor. Justin Bower, Martha Corrozi, Arthur Jenkins and Kevin
Vonck, Graduate Research Assistants, provided many hours in the field collecting data
for the Experimental Watershed. Special thanks to Bob Penter and Nigel Bradly from the
New Zealand National Institute of Water and Atmospheric Research for providing the
Water Resources Agency with a Stream Health Monitoring and Assessment Kit. We
hope the University of Delaware Experimental Watershed continues to be an on-campus
education and research site for faculty, staff, students and the community.
iii
Table of Contents LIST OF FIGURES…………………………………………………………… v LIST OF TABLES……………………………………………………………. vi GLOSSARY....................................................................................................... vii ABSTRACT………………………………………………………………….. viii Chapter 1 BACKGROUND AND JUSTIFICATION…………………………… 1 Introduction………………………………………………………. 1 Description.………………………………………………………. 2 Previous Research………………………………………………... 3 2 OBJECTIVES………………………………………………………....... 10 3 EXPERIMENTAL METHODOLOGY……………………………… 14
Sampling Sites…………………………………………………… 14 Chemical Tests…………………………………………………… 16
1.1 Delaware River Basin………………………………………………. 7 1.2 White Clay Creek Watershed……………………………….………. 8 1.3 The University of Delaware Experimental Watershed over a
Campus Map.........................................................................……. 9 3.1 University of Delaware Experimental Watershed
(with Sampling Stations)…………………………….... 15 3.2 Newark Area Orthographic Photograph…………………………… 23 4.1 A Comparison of the Total Score of the Coastal Plain Sampling
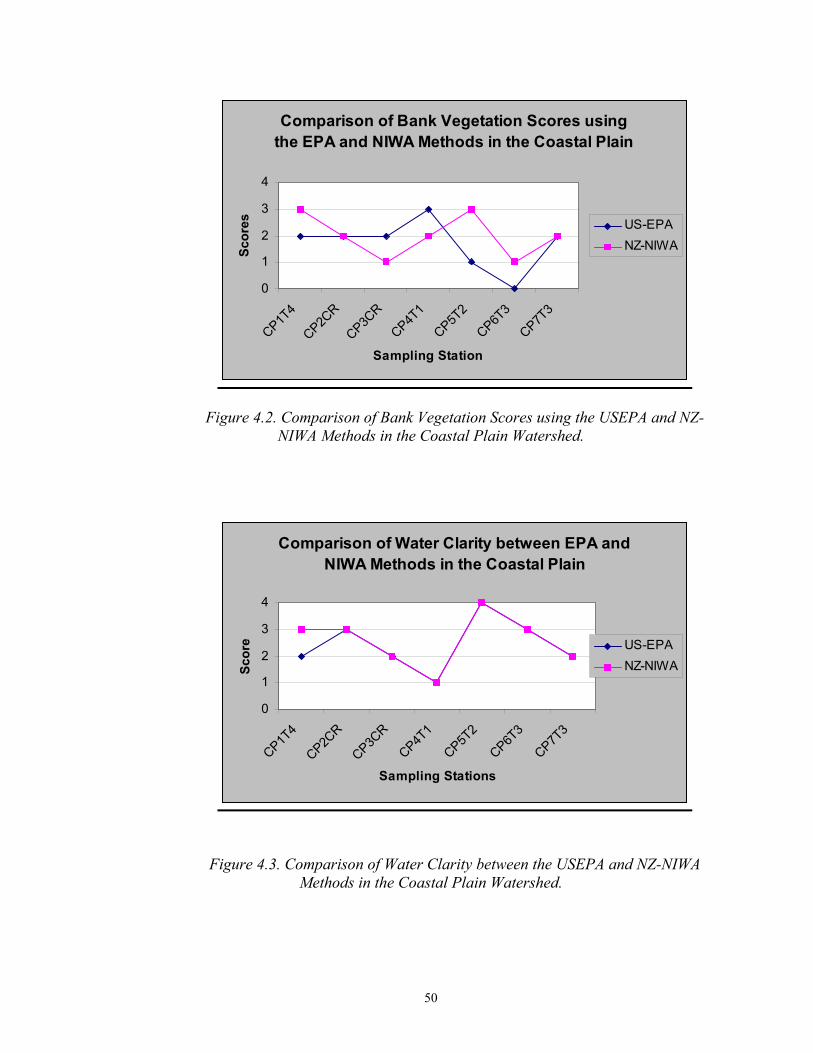
Sites between the USEPA and NZ-NIWA Method….. 45 4.2 Comparison of Bank Vegetation Scores using the USEPA and
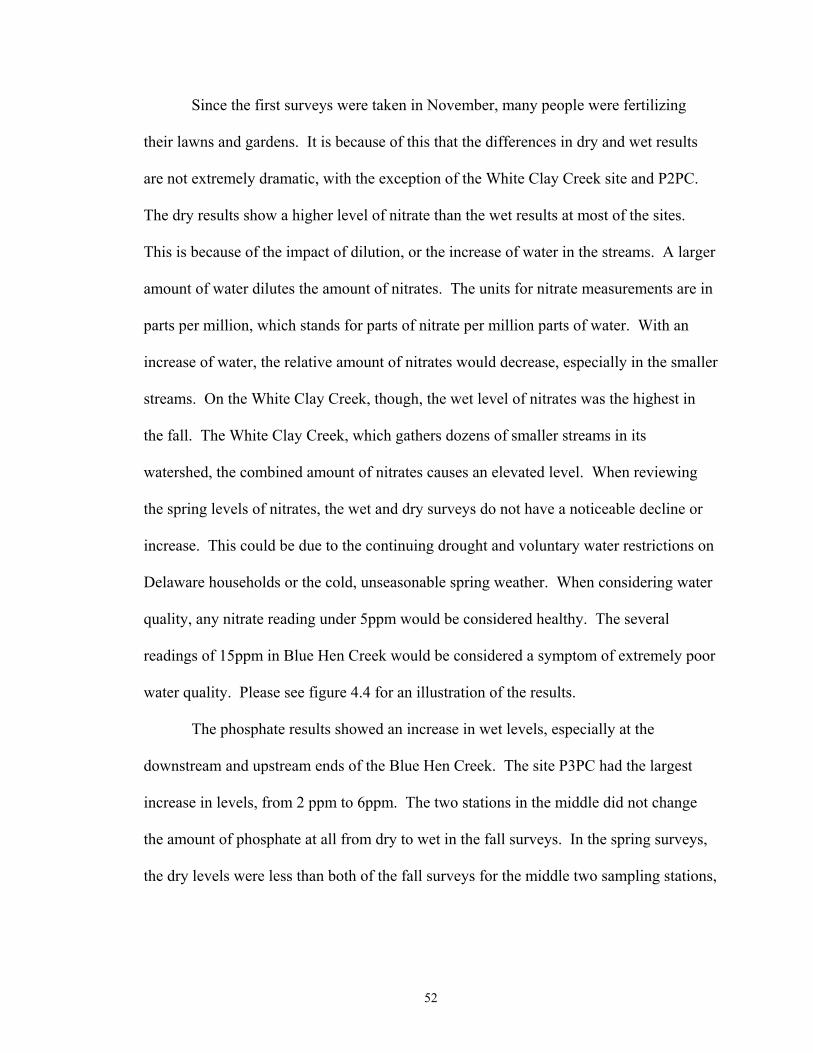
NZNIWA Methods in the Coastal Plain…………….. 50 4.3 Comparison of Water Clarity between USEPA and NZNIWA
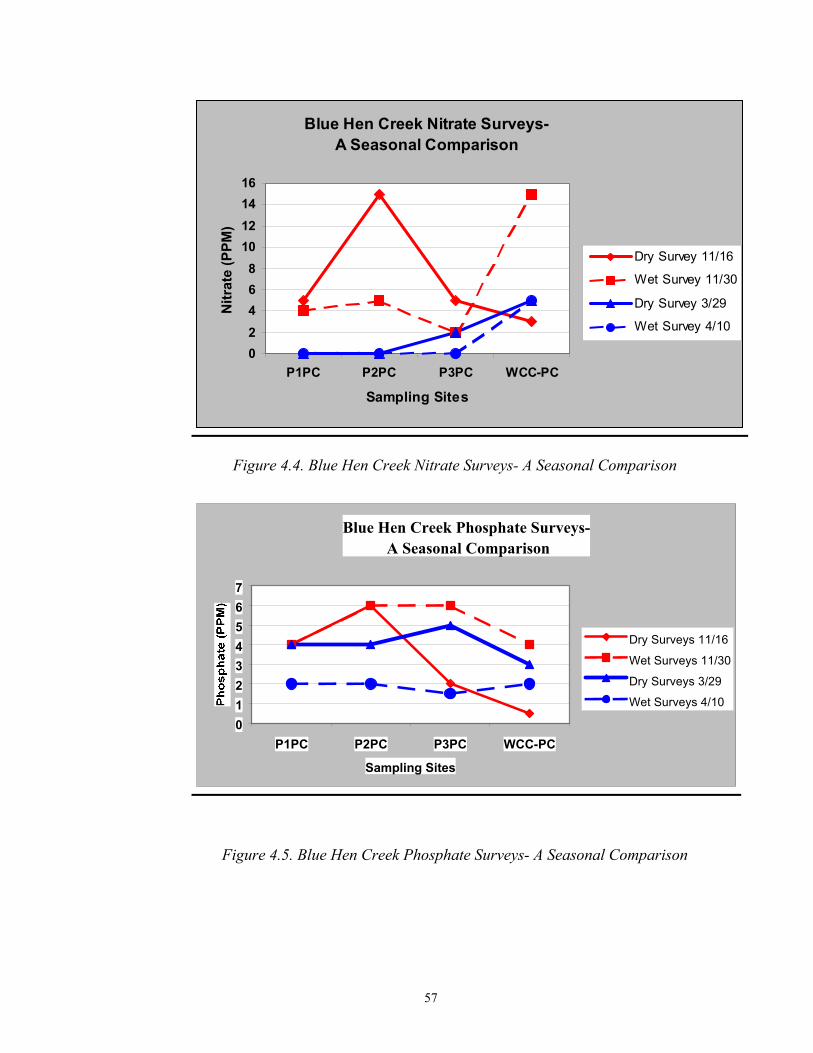
Methods in the Coastal Plain………………………... 50 4.4 Blue Hen Creek Nitrate Surveys- A Seasonal Comparison……… 57 4.5 Blue Hen Creek Phosphate Surveys- A Seasonal Comparison….. 57 4.6 Fairfield Run Nitrate Surveys- A Seasonal Comparison………… 58 4.7 Fairfield Run Phosphate Surveys- A Seasonal Comparison…….. 58 4.8 Snowfall’s Effect on Chloride Levels in the Piedmont Watershed. 60 4.9 A GIS Layout of the UD Experimental Watershed Land Uses….. 61
v
List of Tables 1.1 Piedmont Watershed Report Card for 2001………………………… 6 3.1 Use of Sampling Stations in the UD Experimental Watershed…….. 16
3.2 Water Quality Grading by Parameter………………………………. 17 3.3 USEPA Rapid Bioassessment Protocol Grading by Parameter……. 19 3.4 NZ-NIWA Stream Health Monitoring Assessment Kit Parameters.. 20 3.5 Land Use Grade Equations………………………………………… 24 3.6 Impervious Cover Factors of Land Uses………………………….. 25 3.7 Impervious Cover Rating Scale…………………………………… 26 3.8 Grading Scheme for the Watershed Report Card…………………. 27
4.5 Comparison of the Watershed’s Habitat Assessment Data by Parameter……………………………………….............. 40
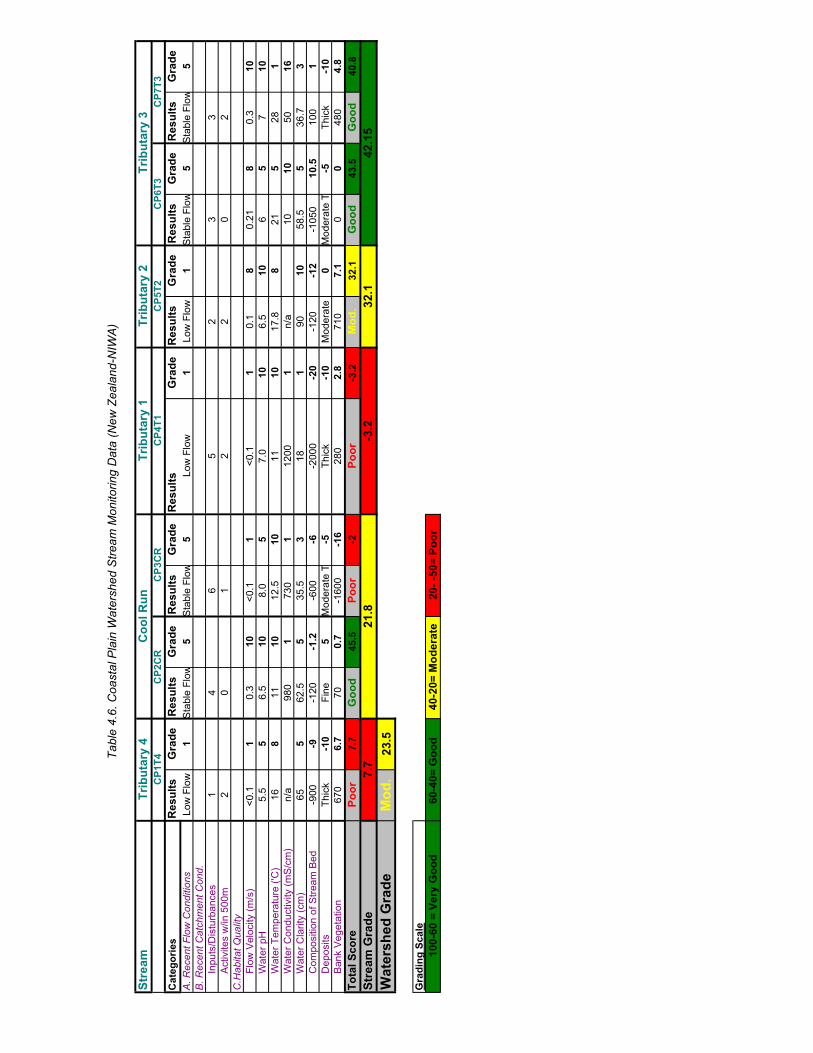
4.6 Coastal Plain Watershed NIWA Stream Monitoring Data………… 42 4.7 A Comparison of the Total Score of the Coastal Plain Sampling
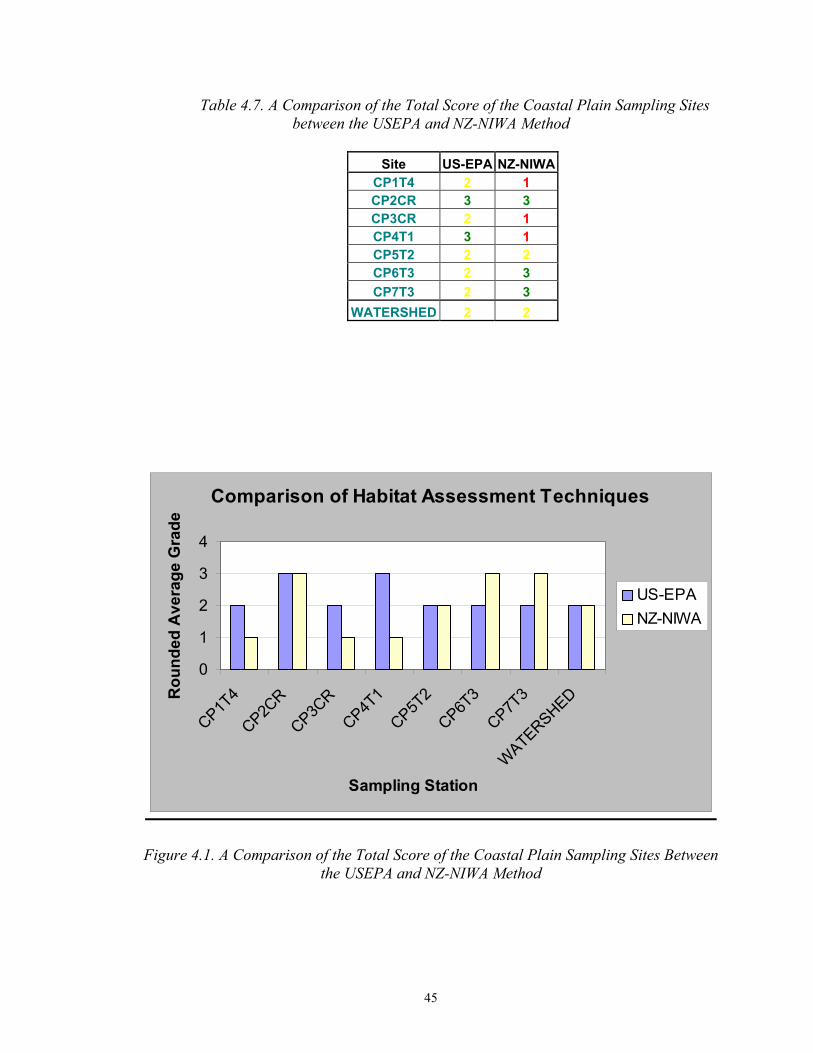
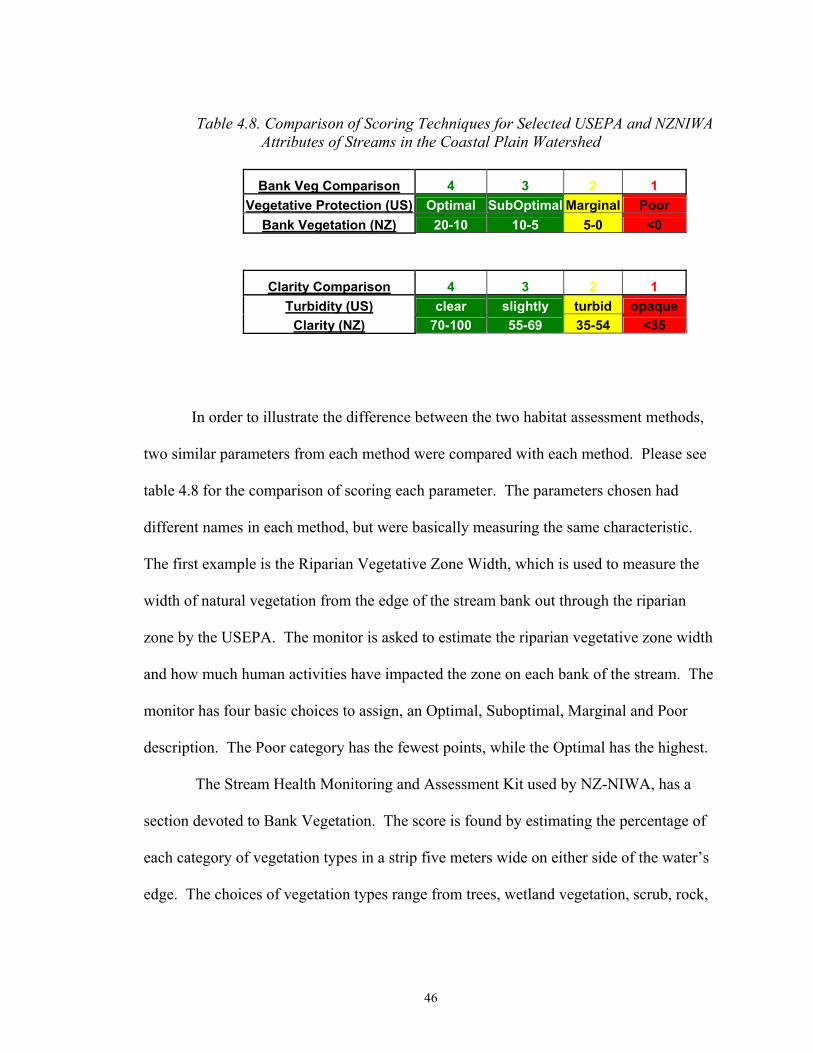
Sites between the USEPA and NZ-NIWA Method….…. 45 4.8 Comparison of Scoring Techniques for Selected USEPA and
NZNIWA Attributes of Streams in the Coastal Plain Watershed............................................…. 46
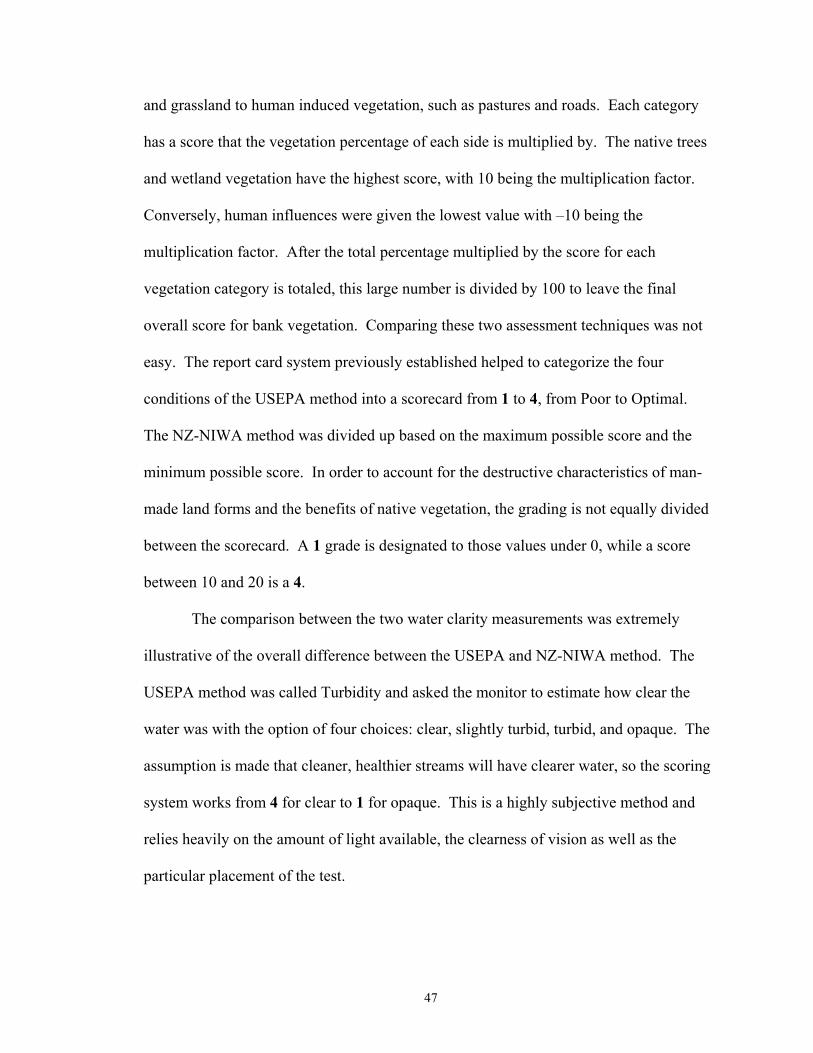
4.9 Comparison of Data Results for the Coastal Plain Streams using USEPA and NZNIWA Methods of Grading……. 49
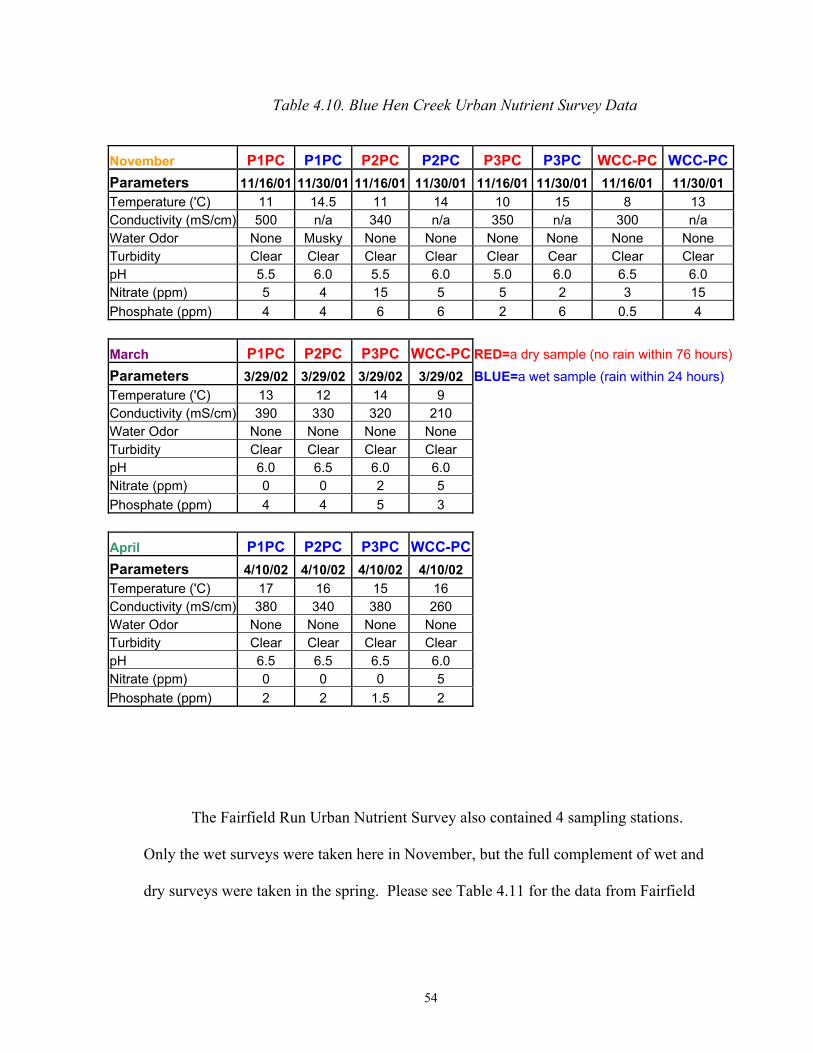
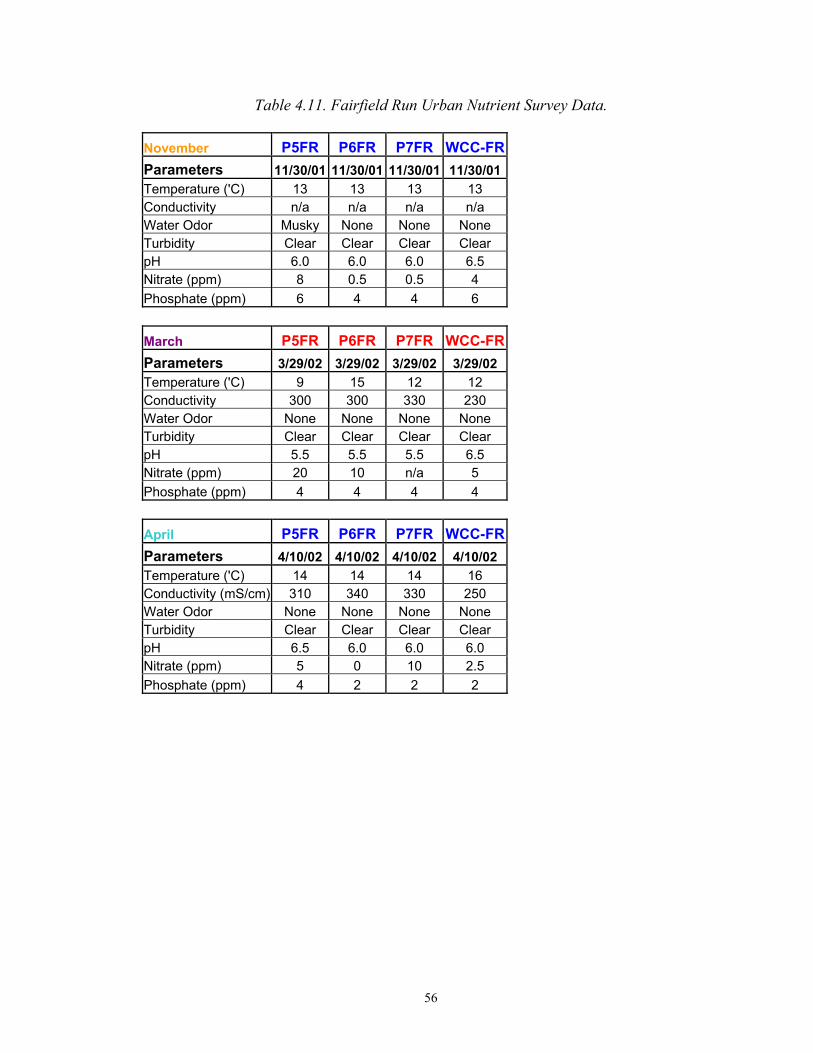
4.10 Blue Hen Creek Urban Nutrient Survey Data…………………… 53 4.11 Fairfield Run Urban Nutrient Survey Data……………………… 56 4.12 Land Use Data for the Piedmont Watershed…………………….. 63 4.13 Land Use Data for the Coastal Plain Watershed…………………. 65 4.14 Impervious Cover Data for the Piedmont Watershed……………. 67 4.15 Impervious Cover Data for the Coastal Plain Watershed………… 69 4.16 Piedmont Watershed Report Card Results for 2001…………….. 71 4.17 Overall Piedmont Watershed Report Card for 2002……………... 72 4.18 Summary Coastal Plain Watershed Report Card for 2001……… 73 4.19 Overall Coastal Plain Watershed Report Card for 2002………… 74
vi
Glossary Watershed – the sum of all land areas contributing runoff or drainage to a singular watercourse (Reimold, 7) Riparian Buffers – vegetative buffers between the stream and the surrounding land use which aid in filtration, and dispersal of water flow; comprised of 3 zones
1) unmanaged forest of trees and shrubs to provide shade and habitat 2) managed forest maintained by land owner 3) tract of open land between managed forest and current land use
Impervious Surfaces – hard, packed land use which prevents the recharge of precipitation into ground water GIS – Geographic Information Systems – a computer program which allows the user to analyze maps and highlight important information relating to the subject of interest GPS – Global Positioning Systems – A satellite- conferencing hand-held unit which displays the exact Latitude and Longitude of the unit Wild and Scenic River Legislation – federal legislation recognizing and protecting rivers of ecological importance (1968)
vii
Abstract
Student researchers of the University of Delaware Water Resources Agency
(UDWRA) have delineated an experimental watershed through the University of
Delaware campus, which includes both the northern Piedmont Plateau and the southern
Coastal Plain. The purpose of this project is to continue to research the link between
stream health and certain types of land use and update the watershed report card for the
Piedmont Plateau and the Coast Plain while exploring different methods and procedures.
The land use in these areas is rapidly changing, and the amount of impervious services,
such as roads and driveways, is increasing. A negative relationship between land use and
stream health was found in the Piedmont Plateau, and a report card for establishing a
user-friendly way of tracking watershed health through the years was developed. Stream
sampling and chemical surveys were completed at each of the sampling stations through
the watershed. The New Zealand National Institute of Water and Atmospheric Research
(NZ-NIWA) donated a Stream Health Monitoring and Assessment Kit for research. The
Overall Watershed Health Grade of the Piedmont Watershed was a C+, which has fallen
from a B- in 2001. The stream in this watershed with the highest percentage of
impervious cover had the lowest stream quality, in agreement with the hypothesis of this
report. The Coastal Plain in 2002 received an Overall Watershed Report Card Grade of
C, which is another decrease in total watershed health. The Coastal Plain Watershed
received a C+ in 2001. Tributary 3, which had the lowest percentage of impervious
viii
ix
cover, had the highest water quality grade. The stream with the lowest overall grade had
the highest amount of negatively impacting land uses and highest percentage of
impervious cover. Future researchers will be able to update and modify the Experimental
Watershed Report Card to monitor temporal changes in the surrounding land.
Chapter 1
BACKGROUND AND JUSTIFICATION
Introduction
A watershed can be defined as the geographic area of land which contributes
runoff or drainage into a specific body of water (Reimold, 1998). Watersheds connect
waterways to their natural counterpart, the land. The land, its uses and its features affect
the water flowing over them. Human use of the land changes the natural land features
and the natural adaptations that have evolved to protect the quality of the water. The
quality of the water is important because of its use as a drinking water source and a
recreational area. Surface water and ground water are used as drinking water sources, but
ground water is not as susceptible to contamination because of the filtration
characteristics of soil.
The entire United States can be broken down into individual watersheds ranging
in size from hundreds of thousands of square miles, such as the Mississippi-Missouri
River System, to a few thousand square miles such as the Delaware River Basin, to just a
few square miles for small streams and creeks, such as the White Clay Creek. Although
the larger bodies of water may seem more significant, it is the compact watersheds where
research can be focused.
Land use planning has been identified by the United States Environmental
Protection Agency as perhaps the most important watershed protection tool (USEPA,
2000). Impervious surfaces can be defined as surfaces which do not allow water to
1
recharge into the groundwater or soils, the process also known as infiltration. Some
examples of impervious surfaces include roofs, roadways, sidewalks and parking lots.
An increase in impervious surfaces is detrimental to stream health because it increases
the amount of water that runs off the land into the stream. The stream has increased
erosion and flooding due to the increase of flow. The runoff is usually higher in
temperature, which degrades the aquatic biota, decreases the dissolved oxygen and
increases algal blooms. In areas of natural landscape, precipitation is allowed to infiltrate
the soil and recharge into the groundwater, thereby renewing water resources.
Impervious surfaces prevent this cycle and so impair the surface and ground water
resources humans require for existence (Center for Watershed Protection, 2000).
Description
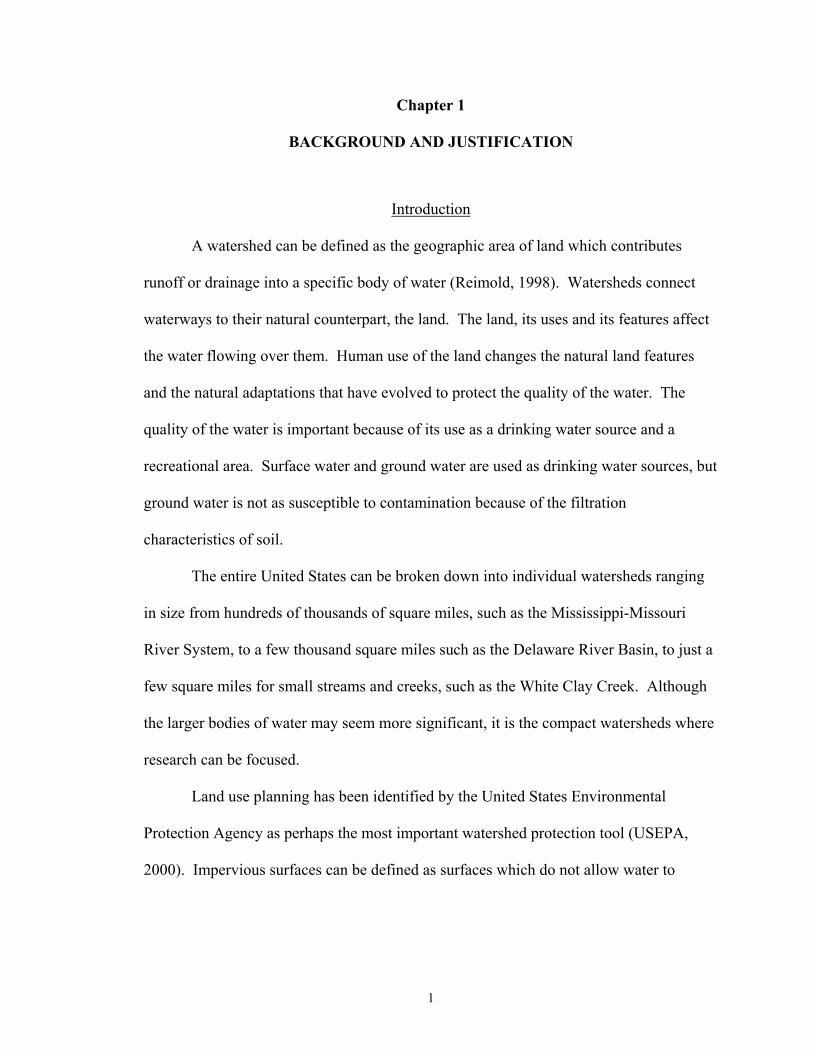
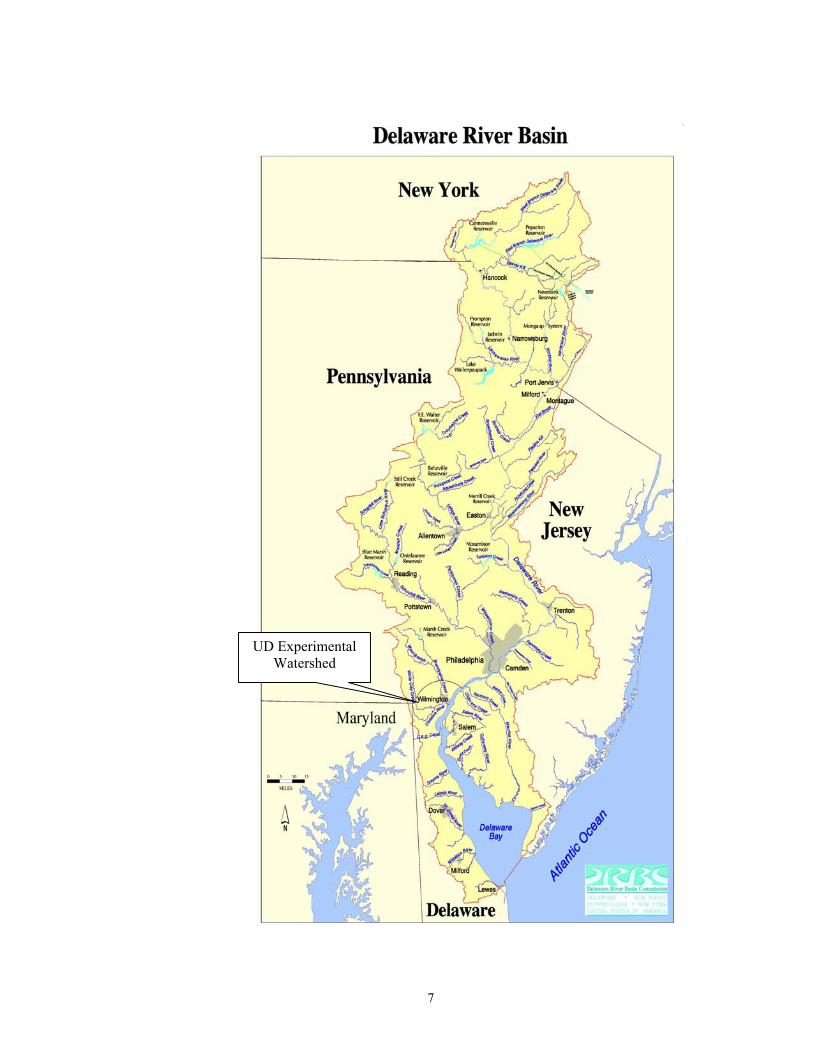
The land area of the State of Delaware primarily drains into the Delaware Bay or
the Chesapeake Bay, by way of either the Delaware River or smaller streams which flow
into the Bay (Figure 1.1). The Newark Area primarily drains into the White Clay Creek
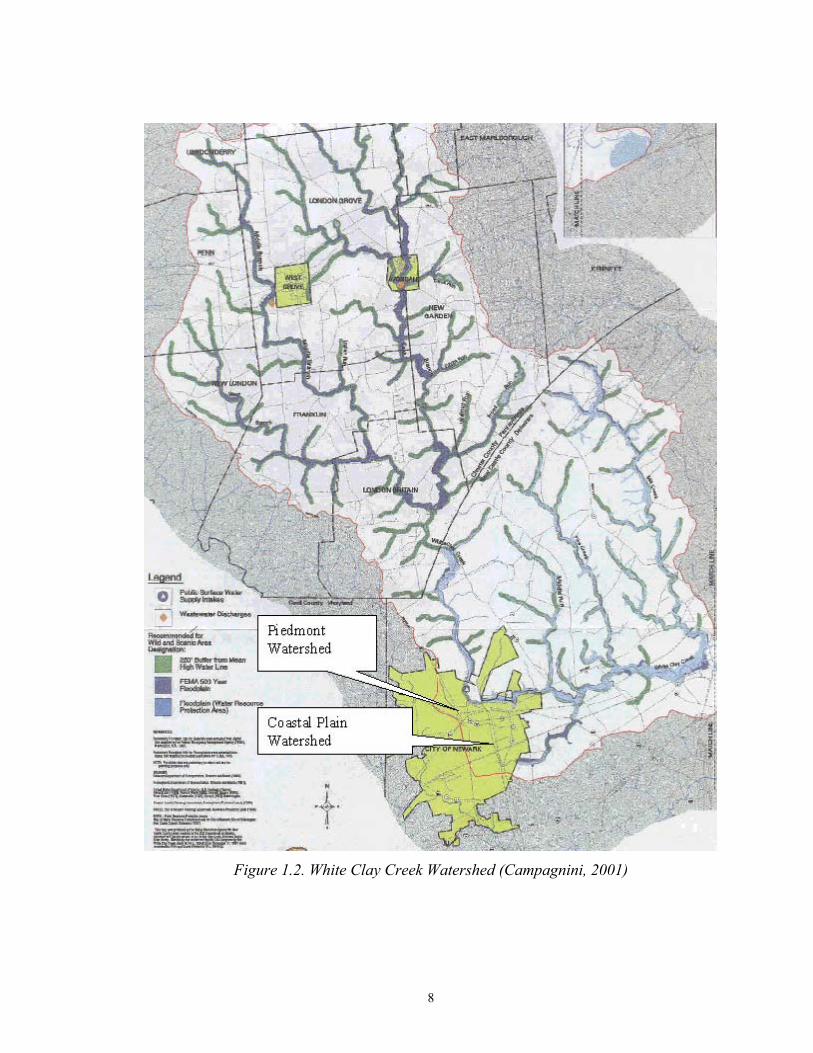
which is within the Delaware River Watershed. The White Clay Creek Watershed
encompasses two states, two counties and three cities. It drains 69,000 acres in southeast
Pennsylvania and northwestern Delaware. Ninety-five thousand people live within the
boundaries of the watershed but another hundred thousand live in close proximity
(WCWA,1998). It is located in an area of rampant development, where the clash of
agricultural tradition and suburbanization has led to land use disputes and regulation.
Because of the precarious location of the watershed and its remarkable pristine condition,
2
former President Clinton signed legislation designating the White Clay Creek as
Delaware’s first Wild and Scenic River (USNPS, 2001). This official federal legislation
protects the watershed from development and recognizes its beauty.
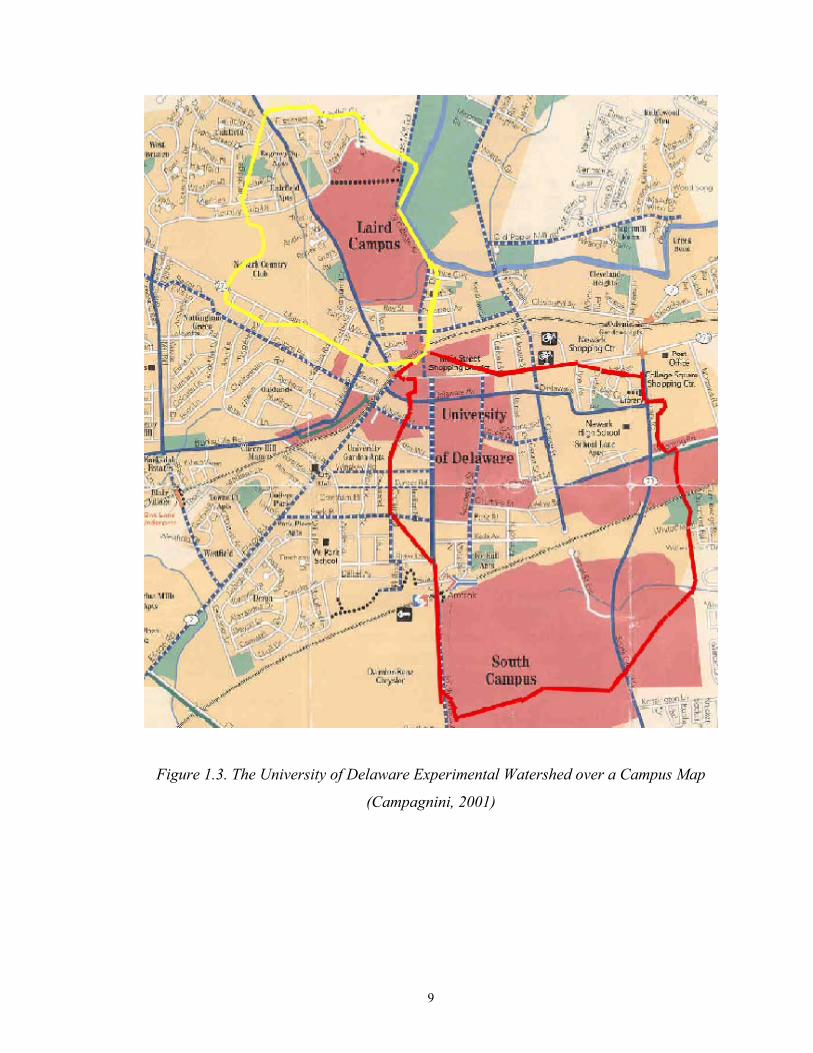
The City of Newark community is a good example of a typical area in the
watershed in terms of its growth and development. Because the city is uniquely situated
on the fall line between the Piedmont Plateau and the Coastal Plain, Newark contributes
an interesting case to the study of watersheds (Figures 1.2 and 1.3).
Previous Research
In 2001, student researchers of the UDWRA, funded by the Delaware Water
Resources Center with a grant from the US Department of the Interior, delineated an
experimental watershed through the campus of the University of Delaware (Campagnini,
2001). This was the first research of its kind at the University of Delaware. This initial
research of the Piedmont Watershed resulted in the correlation of impervious surfaces
with impaired stream health. In the prepared report, the stream with the highest stream
health grade was the Lost Stream, with a B rating (on a scale from A= excellent, to F=
poor). This grade incorporates the water quality, land use, impervious cover, and habitat
analysis. The Lost Stream flows through the White Clay Creek State Park. Most of its
sub-watershed is open space and forested. It had the best water quality and the highest
habitat assessment rating. Conversely, Blue Hen Creek (the Pencader Creek) had the
lowest stream health grade. This stream, which flows through the University of
Delaware campus, had the highest percentage of impervious surfaces and the poorest
3
water quality and habitat assessment rating. The overall Final Grade for the Piedmont
Experimental Watershed was a B-, a good rating (Campagnini, 2001).
The conclusions of the preliminary Experimental Watershed report included the
applicability to the Coastal Plain area of the Watershed. The Coastal Plain area of the
UD campus has very different geography and land uses. It provides another example of
the effects of land use on stream health. It also called for the continuation of the
Watershed Report Card project in order to monitor stream health in the Experimental
Watershed. Both of these suggestions have been taken into account to form the basis of
this report.
The conclusions of the previous report were used to form the basis for this
research. The prior research formed the basis for the watershed as an on-campus
education and research tool for the University community. It will be available to serve as
a classroom tool for future UD classes as well as a training ground for local educators to
enhance their curriculum. The Watershed Mapping Process is easily taught to other
professionals and educators in order to delineate watersheds in college and high school
campuses. The relationship of Watershed Health to Land Use was found to be one of
negative impact. For instance, the Lost Stream watershed with the largest areas of forest
and open space, and lowest imperviousness, had a grade of B (good), while the
watersheds with higher levels of impervious cover, such as Blue Hen Creek (formerly
Pencader Creek), had a grade of C (fair). The Watershed Report Card is a user-friendly
tool that will be able to track the health of the Experimental Watershed now and in
semesters to come. The use of a standardized grading unit makes the report card more
4
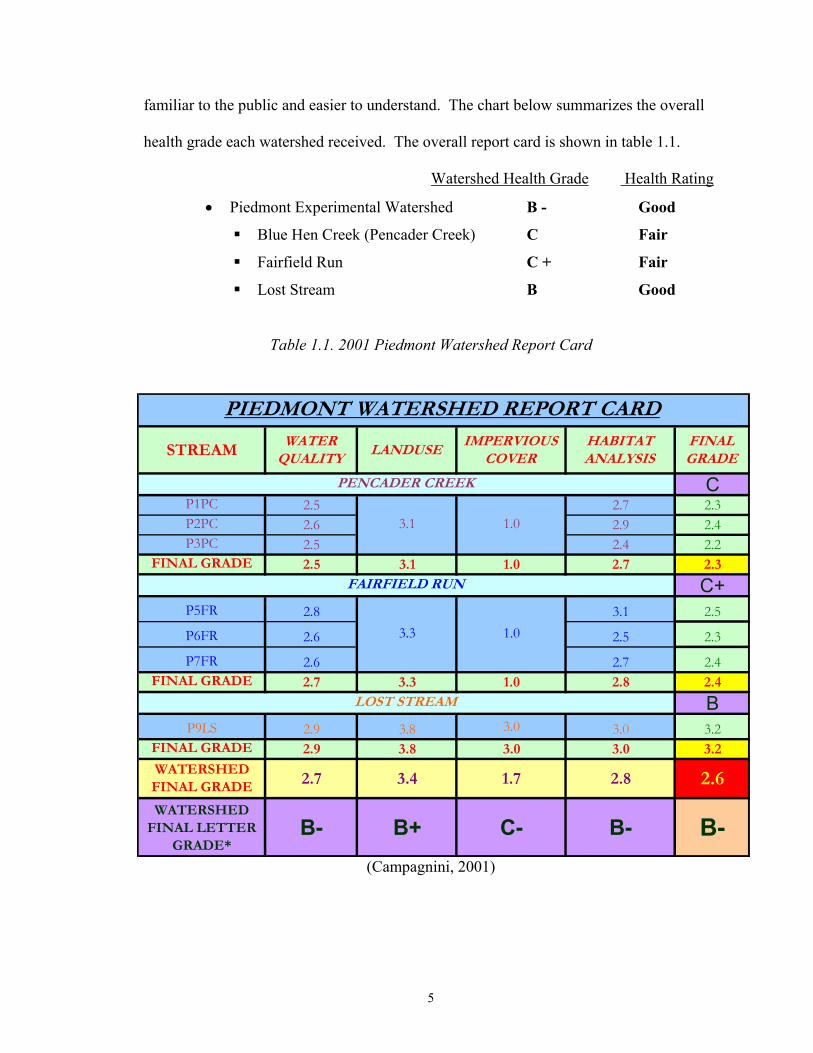
familiar to the public and easier to understand. The chart below summarizes the overall
health grade each watershed received. The overall report card is shown in table 1.1.
Watershed Health Grade Health Rating
Piedmont Experimental Watershed B - Good •
Blue Hen Creek (Pencader Creek) C Fair
Fairfield Run C + Fair
Lost Stream B Good
Table 1.1. 2001 Piedmont Watershed Report Card
P1PC 2.5 2.7P2PC 2.6 2.9P3PC 2.5 2.4
P5FR 2.8 3.1
P6FR 2.6 2.5
P7FR 2.6 2.7
2.7 3.4 1.7 2.8 2.6
3.3
PIEDMONT WATERSHED REPORT CARD
FAIRFIELD RUN
PENCADER CREEK
1.0
1.0
3.1
STREAM WATER
QUALITYLANDUSE
IMPERVIOUS COVER
HABITAT ANALYSIS
FINAL GRADE
FINAL GRADE 2.5 3.1 1.0 2.7 2.3
FINAL GRADE 2.7 3.3 1.0 2.8 2.4
FINAL GRADE 2.9 3.8 3.0 3.0 3.2
WATERSHED FINAL GRADE
C
C+
B
WATERSHED FINAL LETTER
GRADE*B- B+ C- B- B-
2.32.42.2
2.5
2.3
2.4
3.2P9LS 2.9 3.8 3.0 3.0
LOST STREAM
(Campagnini, 2001)
5
Figure 1.1. The Delaware River Basin
6
Figure1-3
The White Clay Creek Watershed
UD Experimental
Watershed
7
Figure 1.2. White Clay Creek Watershed (Campagnini, 2001)
8
Figure 1.3. The University of Delaware Experimental Watershed over a Campus Map
(Campagnini, 2001)
9
Chapter 2
RESEARCH OBJECTIVES
The goal of this research was to explore the link between land use, stream water
quality and watershed health in the UD Experimental Watershed. In order to explore the
link between water quality and land use, field inventories were conducted to update the
existing watershed data. The inventories included locating 14 sampling positions with
the Global Positioning System (GPS) and collecting data from water quality tests.
Stream habitats and riparian buffers were also surveyed using the USEPA Rapid Stream
Bioassessment procedure as well as a land survey. The University of Delaware Water
Resources Agency (UDWRA) was fortunate enough to have contacts in New Zealand.
The National Institute of Water and Atmospheric Research (NZ-NIWA) donated a
Stream Health Monitoring and Assessment Kit to the WRA. A comparison between the
two habitat assessment procedures illustrated the differences and perhaps calls for a
modification of the current UD Experimental Watershed assessment technique. The NZ-
NIWA assessment seems to be easier to come up with an actual quantitative value to
compare the different areas’ habitat quality. It may also be quicker to use (Biggs,1999).
Urban nutrient surveys were conducted in streams with predominately commercial and
residential land uses. This was done in September, November and February after
precipitation events from storm water outfalls. The next task was to conduct chloride
samples during the winter months to quantify the effect of road salt on streams in the
Experimental Watershed.
10
The fifth task built upon the Watershed Report Card, which was created and
implemented in the Fall of 2000. The data collected was compared to the previous data
to analyze trends in land use and changes in stream health. In order to sample the streams
and analyze stream health changes in areas, GIS was used to plot the exact location of
sampling stations.
The last task, which was completed in order to fulfill the requirements of the
Degree with Distinction, is the writing of the Senior Thesis. The methods of the study,
the results and the corresponding conclusions will be discussed. Also included will be
graphs, maps and charts to better illustrate the findings. Enclosed is a list of the task
accomplished.
Task 1. Conducted Field Inventories – Conducted a series of field inventories to
update the following databases within the Piedmont and Coastal Plain Experimental
Watersheds:
GPS Sampling Stations – With a Global Positioning System,
located 14 sampling stations by latitude and longitude.
•
•
•
Stream Quality – Assessed the links between land use and water
quality, collect in-stream data for alkalinity, ammonia, chlorides,
updated the UD Experimental Watershed base mapping using polygon or buffer
techniques to include coverage of impervious cover, stream chemistry, riparian habitat,
and watershed health. The location of sampling stations was plotted by latitude and
longitude.
Task 6. Recorded Results – The advisor will supervise the student’s project and
assist in the preparation of a thesis. This will summarize the research project and will be
submitted to the Undergraduate Research Center by May 24, 2002.
13
Chapter 3
EXPERIMENTAL METHODOLOGY
Sampling Stations
The previous researchers designated sampling sites based on criteria of
accessibility, landmarks such as roads and location in relation to upstream land uses
(Campagnini, 2001). The goal was to have the sampling sites on each stream represent
the stream as a whole. The sampling sites are labeled as “Watershed, site number,
Tributary Name” (for example- Piedmont, 1, Pencader Creek = P1PC). The original
research designated seven sampling stations covering each stream of the Piedmont and
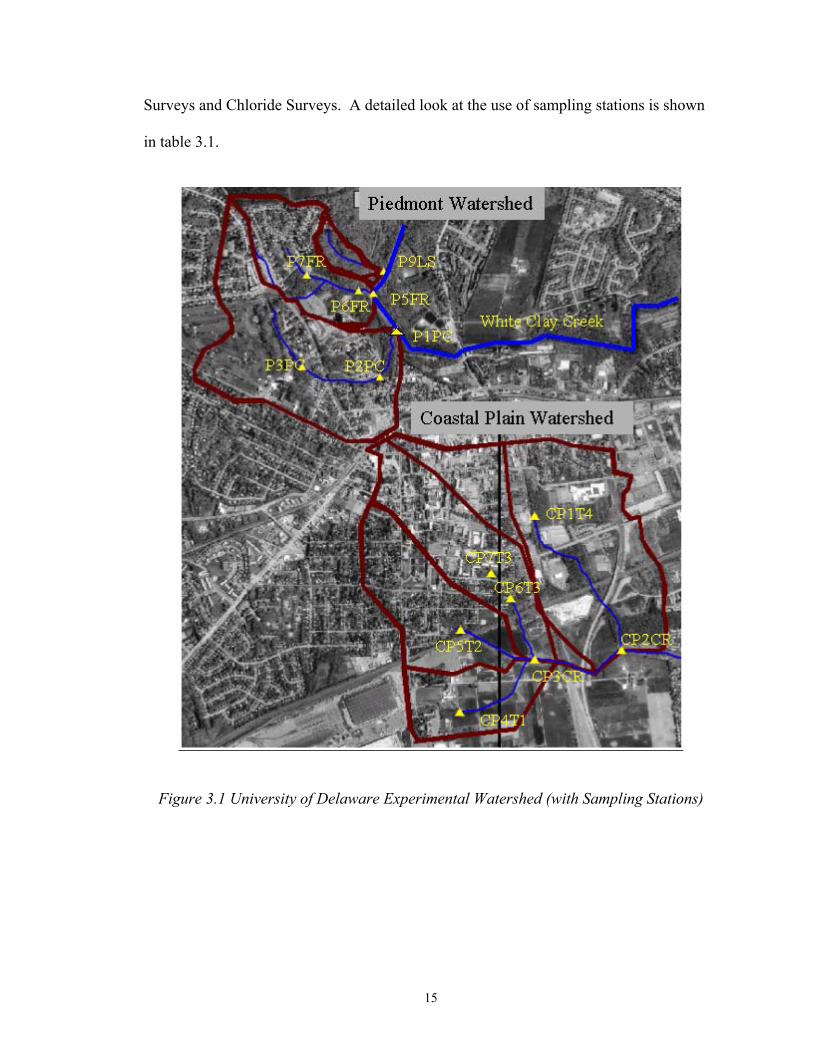
Coastal Plain Watersheds. In figure 3.1, these stations are represented with yellow
triangles. The watershed basins in this figure are outlined in brown. Due to the unusual
drought conditions of the fall of 2001, the intermittent stream, known as the Lost Stream
(P9LS) by the researchers, did not have a large enough flow to be sampled. The US
National Weather Service recorded the least amount of rainfall at the Wilmington Airport
in recorded history from July to December 2001. The Governor of Delaware, Ruth Ann
Minner, enacted voluntary water restrictions on March 25, 2002 due to the low rainfall
(USNWS, 2002). This weather anomaly brought the total number of sampling stations in
the Piedmont region to six. The entrance of the Piedmont Streams into White Clay Creek
was also surveyed for the Urban Nutrient and Chloride Surveys. These sites were used
for Stream Health Assessments using the USEPA and NZ-NIWA, Urban Nutrient
14
Surveys and Chloride Surveys. A detailed look at the use of sampling stations is shown
in table 3.1.
Figure 3.1 University of Delaware Experimental Watershed (with Sampling Stations)
15
Table 3.1. The Use of Sampling Stations in the UD Experimental Watershed for the Use
of Assessing Watershed Health.
Sampling Sites USEPA NZNIWA Urban Nutrient Chloride P1PC X X X P2PC X X X P3PC X X X WCC-PC X X P5FR X X P6FR X X P7FR X X X WCC-FR X CP1T4 X X CP2CR X X CP3CR X X CP4T1 X X CP5T2 X X CP6T3 X X CP7T3 X X
Chemical Water Quality Tests
Chemical Water Quality is important because it establishes the basic health of the
water itself. Aquatic plants, microorganisms and microorganisms depend on the
chemical properties of water to survive. Too much or not enough of any one chemical
would be enough to change the ecology of the aquatic environment and stress the
indigenous species (USEPA, 1999)
16
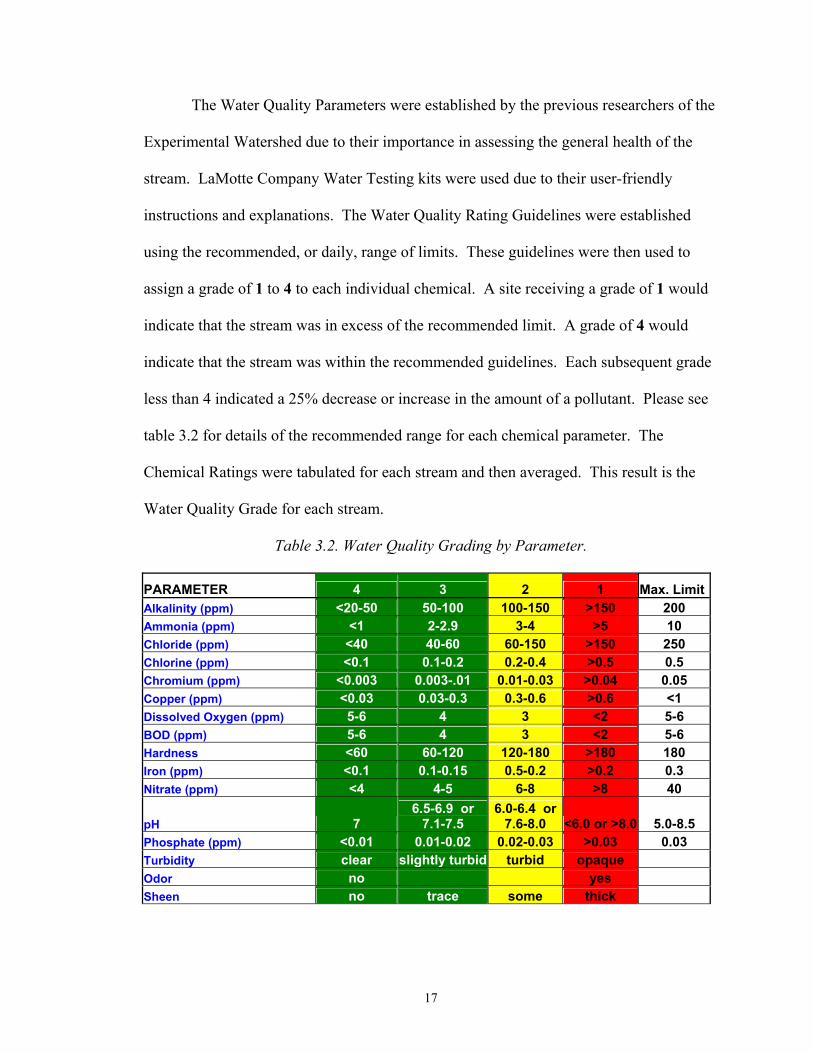
The Water Quality Parameters were established by the previous researchers of the
Experimental Watershed due to their importance in assessing the general health of the
stream. LaMotte Company Water Testing kits were used due to their user-friendly
instructions and explanations. The Water Quality Rating Guidelines were established
using the recommended, or daily, range of limits. These guidelines were then used to
assign a grade of 1 to 4 to each individual chemical. A site receiving a grade of 1 would
indicate that the stream was in excess of the recommended limit. A grade of 4 would
indicate that the stream was within the recommended guidelines. Each subsequent grade
less than 4 indicated a 25% decrease or increase in the amount of a pollutant. Please see
table 3.2 for details of the recommended range for each chemical parameter. The
Chemical Ratings were tabulated for each stream and then averaged. This result is the
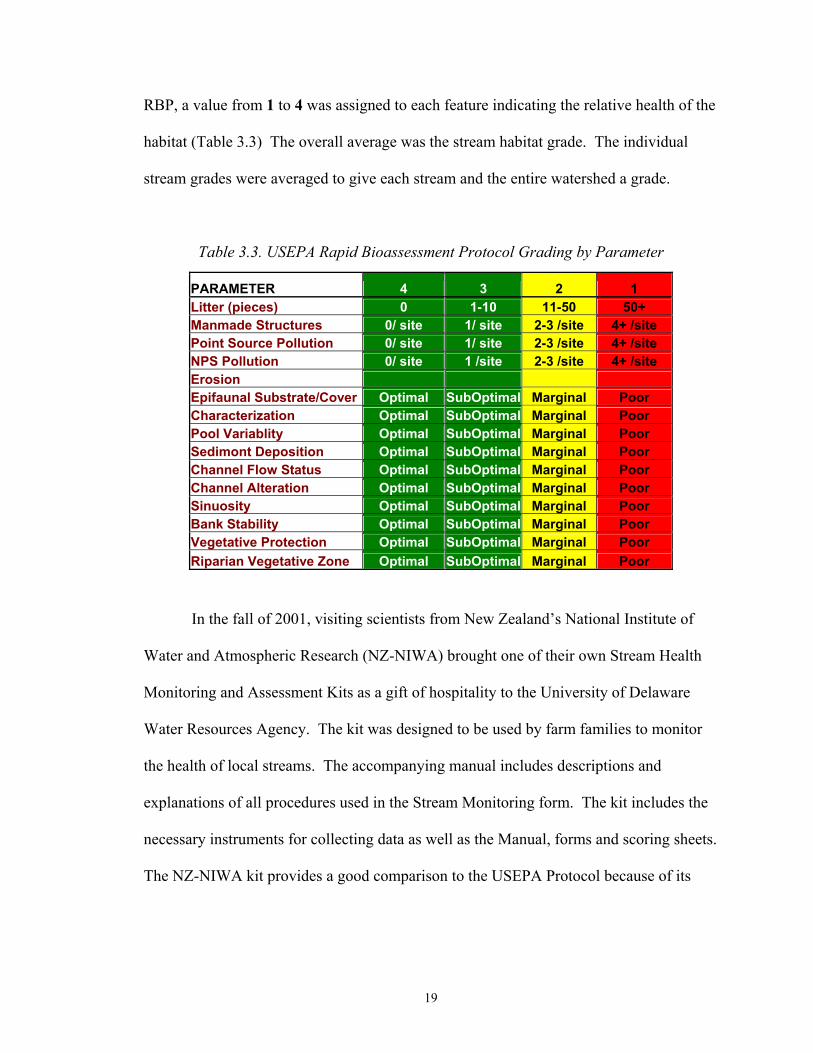
In the fall of 2001, visiting scientists from New Zealand’s National Institute of
Water and Atmospheric Research (NZ-NIWA) brought one of their own Stream Health
Monitoring and Assessment Kits as a gift of hospitality to the University of Delaware
Water Resources Agency. The kit was designed to be used by farm families to monitor
the health of local streams. The accompanying manual includes descriptions and
explanations of all procedures used in the Stream Monitoring form. The kit includes the
necessary instruments for collecting data as well as the Manual, forms and scoring sheets.
The NZ-NIWA kit provides a good comparison to the USEPA Protocol because of its
19
ease of use. It was designed to be used by laymen to record and report data and so is
extremely quantitative. Every parameter has a standard to which a value is assigned. At
the end of the form, the values are added together and compared to a graph in order to
assign a classification to the overall health of the stream (Biggs, 2001). Below, table 3.4
illustrates the different parameters the NZ-NIWA SHMAK examined.
Table 3.4. NZ-NIWA Stream Health Monitoring and Assessment Kit Parameters
Categories A. Recent Flow Conditions B. Recent Catchment Cond. Inputs/Disturbances Activites w/in 500m C.Habitat Quality Flow Velocity (m/s) Water pH Water Temperature ('C) Water Conductivity (mS/cm) Water Clarity (cm) Composition of Stream Bed Deposits Bank Vegetation
Urban Nutrient Surveys
The impact of fertilizer runoff affects Stream Health by damaging the water
quality and impairing aquatic life habitat. In order to quantify the amount of nitrogen and
phosphorus entering streams through the year, urban nutrient surveys were conducted. In
order to compare comprehensive data, surveys were taken in November, March and
April. In this way, seasonal variations can be compared. The streams of Blue Hen Creek
Creek and Fairfield Run were used because of the high amount of drainage from
20
commercial and residential land uses. Surveys were conducted after precipitation events
and after a dry period in order to establish “normal” levels. The data was entered into a
Microsoft Excel worksheet by month and stream. Nitrogen and phosphorus levels were
tested as well as characteristic data to establish the overall condition of the stream, such
as temperature, stream flow, turbidity and pH. Nutrients such as Nitrate and Phosphorus
are commonly used in household fertilizers. Nitrogen also can be found in decaying
organic matter as well as human and animal waste. Most of the Phosphorus in water
comes from detergents. When nutrient levels are high, excessive plant and algae growth
creates water quality problems in bodies of water (Campbell, 1992). This procedure is
designed to be a “first-generation” attempt to quantify nutrient loading from typical New
Castle County suburban land uses. Please see the Exhibits for an example survey.
Chloride Surveys
Road salting is a common practice during the winter months in order to treat icy
and snowy roadways. High Chloride concentration in streams can poison aquatic life,
just as a freshwater fish cannot live in a marine environment. Data was collected from
Blue Hen Creek because of the major, state-owned Route 896 in its watershed, as well as
the high acreage of University-owned land. In the original research proposal, the
methodology prescribed “frequent” chloride sampling before and after snowmelt, in order
to establish normal and elevated levels. Because of the unusual and mild weather this
winter season, the chloride surveys will not be an important factor in the evaluation of
stream quality. Surveys were only able to be taken after one frozen precipitation event.
21
A specific conductivity meter was used during the snowfall and snowmelt portions of the
survey in order to test the viability of this method in the future. A conductivity and
chloride relationship has been established by the United Water of Delaware Company,
who kindly lent their Specific Conductance/ Chloride Concentration Correlation Chart to
the UD Water Resources Agency.
GIS Analysis
The previous researchers of the UDWRA delineated the University of Delaware
Experimental Watershed using Geographic Information Systems (GIS) Arc-View
software. Using aerial photographs and data from the Delaware Geological Survey and
the Delaware Department of Transportation, they were able to build a working map
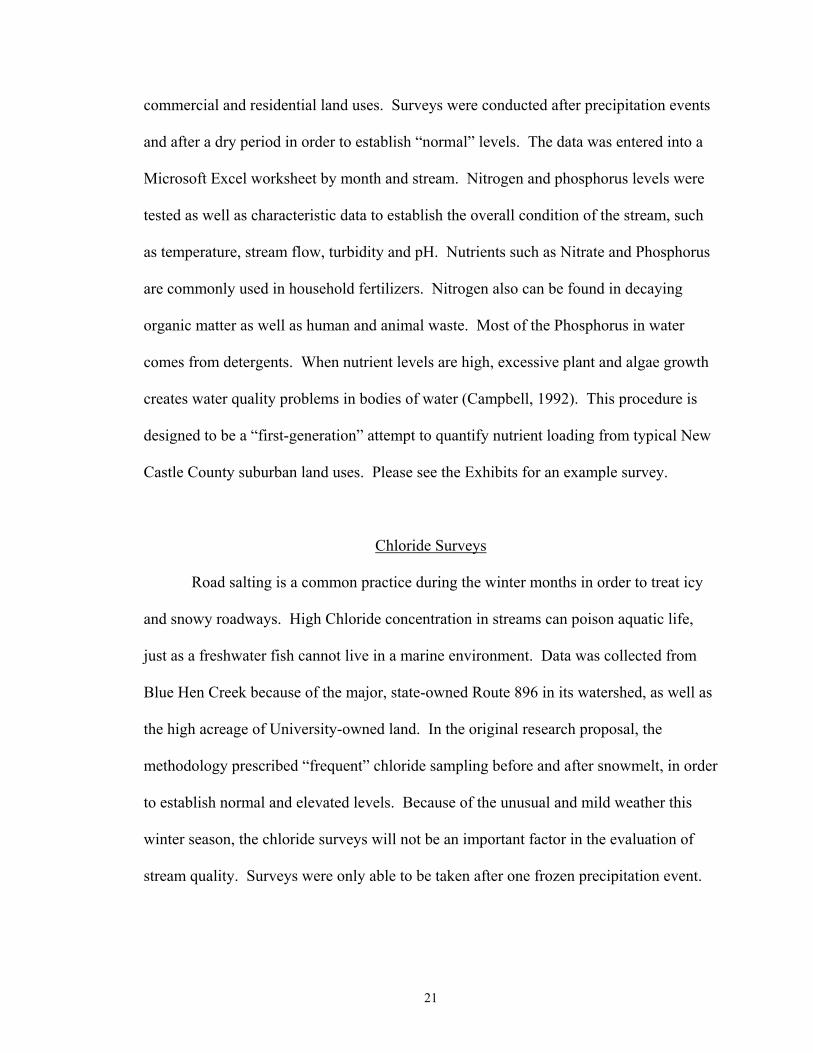
including streams, roads, topography and railroads. Below, figure 3.2 is an orthographic
photograph of the Newark area. After using field reconnaissance methods and GIS
mapping techniques, the researchers were able to delineate an Experimental Watershed,
and choose sampling stations based on proximity to points of interest and accessibility
(Campagnini, 2001).
22
Figure 3.2. Newark Area Orthographic Photograph
Land use greatly impacts water quality. It is an essential indicator of the type and
quantity of runoff that is destined for a stream. Generally, watersheds with low impact
land uses such as protected open space and forests experience a higher water quality.
Watersheds with a large amount of industrial and agricultural land uses usually
experience lower water quality (Campagnini, 2001). A land use GIS file was obtained
from the Delaware Department of Transportation and was used to establish base land
uses in the Experimental Watershed. Land uses in the UD Experimental Watershed were
23
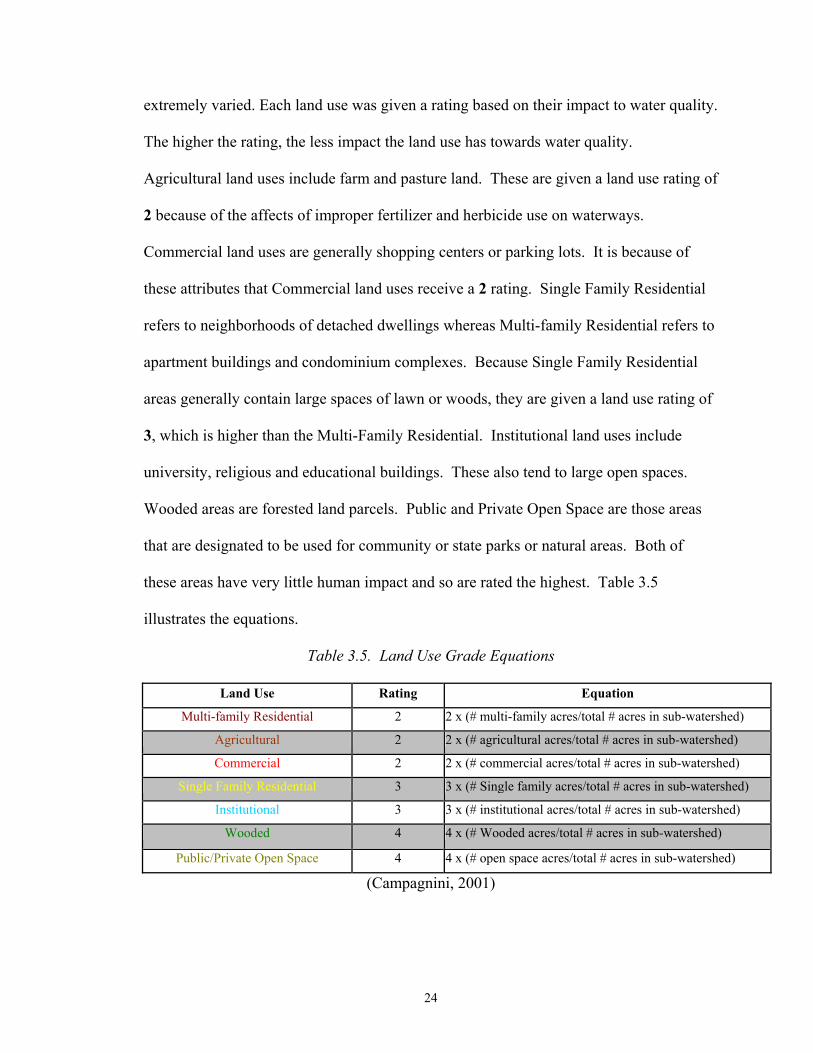
extremely varied. Each land use was given a rating based on their impact to water quality.
The higher the rating, the less impact the land use has towards water quality.
Agricultural land uses include farm and pasture land. These are given a land use rating of
2 because of the affects of improper fertilizer and herbicide use on waterways.
Commercial land uses are generally shopping centers or parking lots. It is because of
these attributes that Commercial land uses receive a 2 rating. Single Family Residential
refers to neighborhoods of detached dwellings whereas Multi-family Residential refers to
apartment buildings and condominium complexes. Because Single Family Residential
areas generally contain large spaces of lawn or woods, they are given a land use rating of
3, which is higher than the Multi-Family Residential. Institutional land uses include
university, religious and educational buildings. These also tend to large open spaces.
Wooded areas are forested land parcels. Public and Private Open Space are those areas
that are designated to be used for community or state parks or natural areas. Both of
these areas have very little human impact and so are rated the highest. Table 3.5
illustrates the equations.
Table 3.5. Land Use Grade Equations
Land Use Rating Equation Multi-family Residential 2 2 x (# multi-family acres/total # acres in sub-watershed)
Agricultural 2 2 x (# agricultural acres/total # acres in sub-watershed) Commercial 2 2 x (# commercial acres/total # acres in sub-watershed)
Single Family Residential 3 3 x (# Single family acres/total # acres in sub-watershed) Institutional 3 3 x (# institutional acres/total # acres in sub-watershed)
Wooded 4 4 x (# Wooded acres/total # acres in sub-watershed) Public/Private Open Space 4 4 x (# open space acres/total # acres in sub-watershed)
(Campagnini, 2001)
24
Impervious Cover can be defined as the amount of pavement, concrete and other
materials that do not allow precipitation to recharge into the groundwater. This creates
runoff from the impervious surfaces into sewer systems, drainage ponds and natural
streams and ponds. Each land use is assigned an impervious cover percentage factor due
to the amount of impervious cover each land use generally has. The number of acres for
each land use is multiplied by the percentage factor. All of these values are summed and
then divided by the amount of total acres in the watershed to arrive at the percentage of
imperviousness. Table 3.6 shows the factors of the land uses of the watershed.
Table 3.6. Impervious Cover Factors of Land Uses
Land Use Impervious Factor (%)
Commercial 85 Multi-Family Residential 65 Institutional 55 Single Family Residential 30 Wooded 0 Agricultural 0 Public/Private Open Space 0
(Campagnini, 2001)
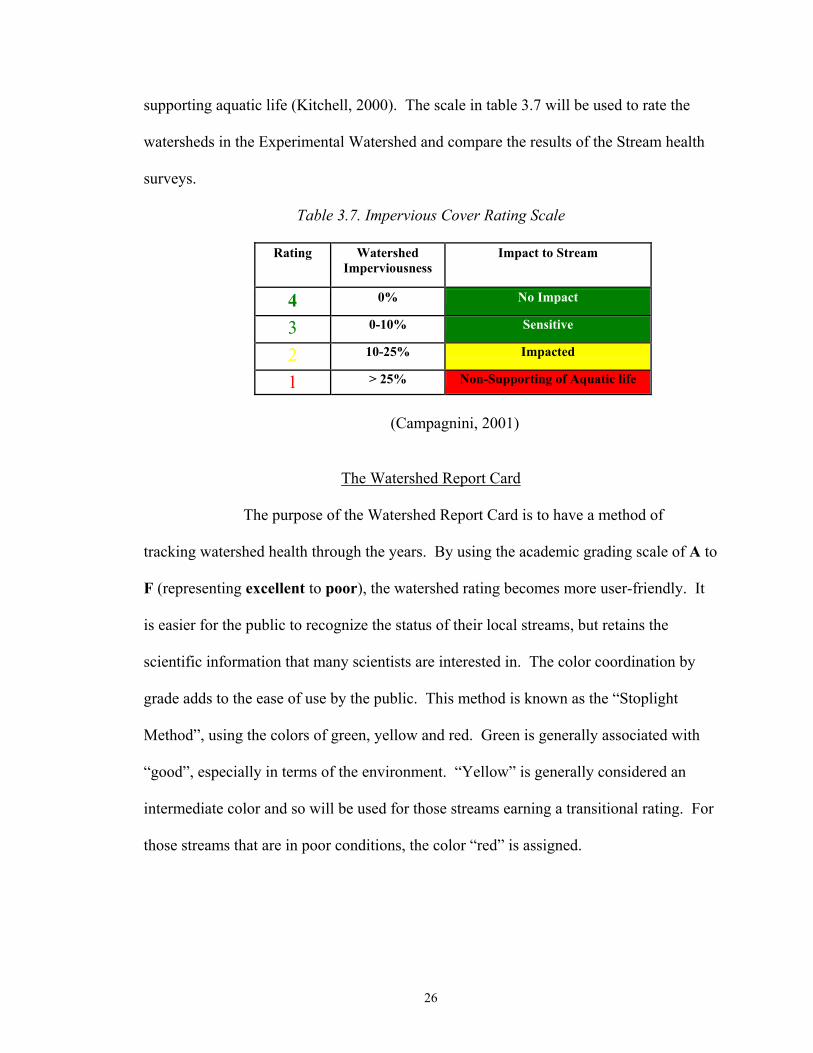
Anne Kitchell of the University of Delaware College of Marine Studies
collaborated with the Water Resources Agency for her graduate research on the impacts
of imperviousness on a watershed. The findings produced a scale of water quality to
imperviousness cover percentage of the watershed. Watersheds with less than 10 percent
impervious cover are generally extremely sensitive. The average water quality is very
good. Watersheds with more than 25 percent imperviousness are not capable of
25
supporting aquatic life (Kitchell, 2000). The scale in table 3.7 will be used to rate the
watersheds in the Experimental Watershed and compare the results of the Stream health
surveys.
Table 3.7. Impervious Cover Rating Scale
Rating Watershed Imperviousness
Impact to Stream
4 0% No Impact
3 0-10% Sensitive
2 10-25% Impacted
1 > 25% Non-Supporting of Aquatic life
(Campagnini, 2001)
The Watershed Report Card
The purpose of the Watershed Report Card is to have a method of
tracking watershed health through the years. By using the academic grading scale of A to
F (representing excellent to poor), the watershed rating becomes more user-friendly. It
is easier for the public to recognize the status of their local streams, but retains the
scientific information that many scientists are interested in. The color coordination by
grade adds to the ease of use by the public. This method is known as the “Stoplight
Method”, using the colors of green, yellow and red. Green is generally associated with
“good”, especially in terms of the environment. “Yellow” is generally considered an
intermediate color and so will be used for those streams earning a transitional rating. For
those streams that are in poor conditions, the color “red” is assigned.
26
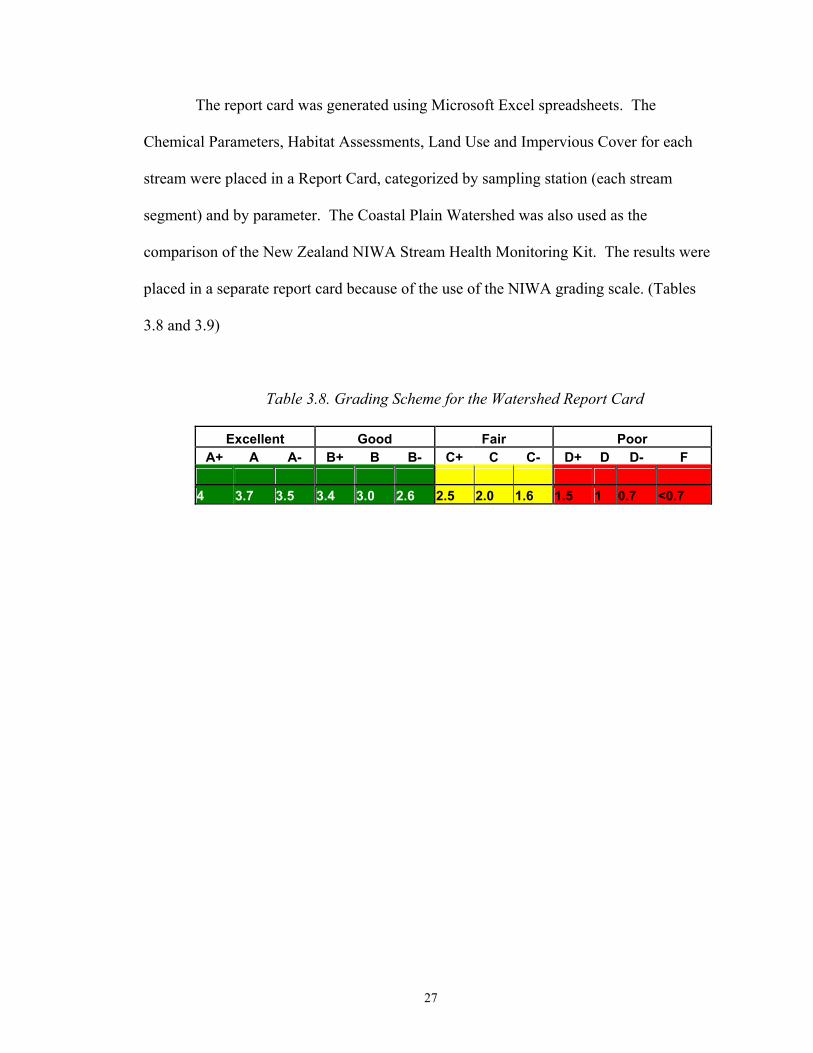
The report card was generated using Microsoft Excel spreadsheets. The
Chemical Parameters, Habitat Assessments, Land Use and Impervious Cover for each
stream were placed in a Report Card, categorized by sampling station (each stream
segment) and by parameter. The Coastal Plain Watershed was also used as the
comparison of the New Zealand NIWA Stream Health Monitoring Kit. The results were
placed in a separate report card because of the use of the NIWA grading scale. (Tables
3.8 and 3.9)
Table 3.8. Grading Scheme for the Watershed Report Card
Excellent Good Fair Poor A+ A A- B+ B B- C+ C C- D+ D D- F
4 3.7 3.5 3.4 3.0 2.6 2.5 2.0 1.6 1.5 1 0.7 <0.7
27
Chapter 4
RESULTS AND DISCUSSION
Chemical Tests
In the analysis of water quality, 17 different chemical tests were used; alkalinity
(the ability of water to neutralize acids), ammonia, chloride, chlorine, chromium, copper,
dissolved oxygen (DO), BOD (biological oxygen demand), hardness, iron, nitrate,
phosphate, pH, turbidity (clarity), odor, sheen and hydrocarbons. The hydrocarbon kit
did not work properly, and the test was not used in the majority of the research.
Piedmont Watershed
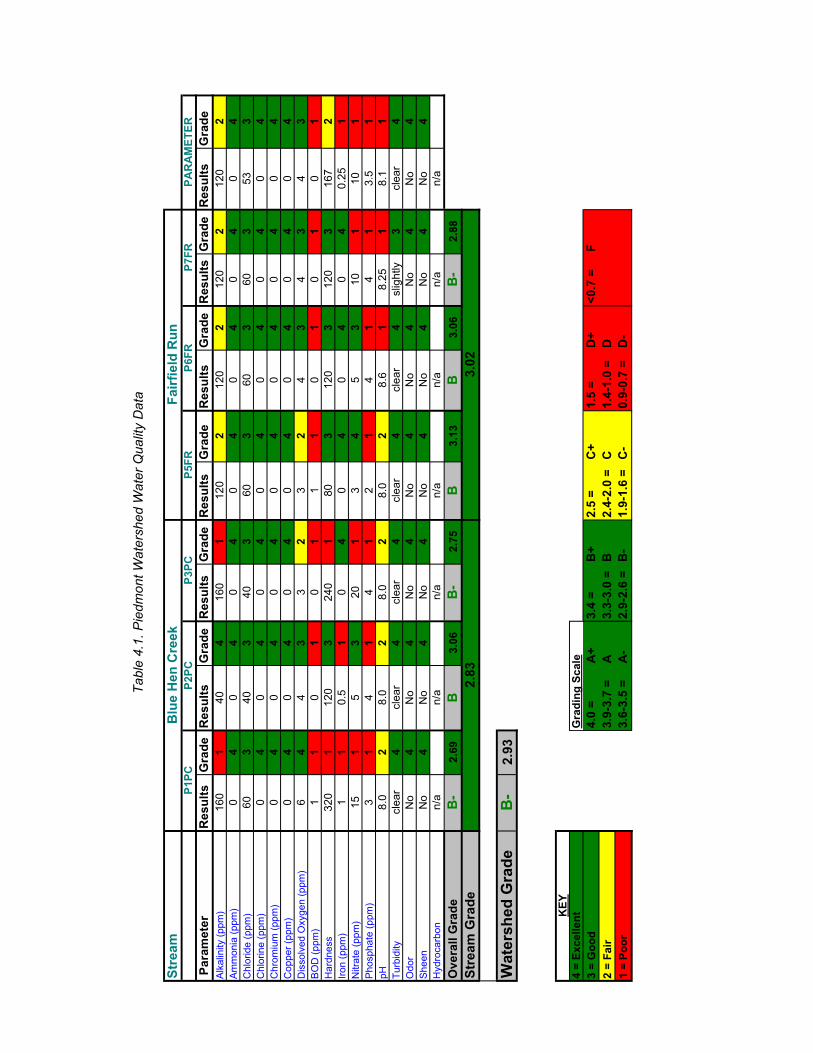
Each sampling station in the Piedmont watershed received a grade in the B range.
Fairfield Run had a slightly higher average score with a B (3.02), than Blue Hen Creek
did with a B- (2.83). The entire watershed earned a grade of a high B- (good), with an
average of 2.93. This grade is comparatively good. The basic land uses of the watershed
are residential and institutional (UD). Blue Hen Creek runs through the Laird Campus of
the University of Delaware and so may be more degraded. Fairfield Run is primarily
forested though it does have its headwaters in the Fairfield Golf Course. This accounts
for the poor grade received by the entire watershed in the nitrate and phosphate tests.
Residential areas usually contain large areas of fertilized lawn or gardens. Some of the
fertilizers, composed primarily of organic material, will eventually run off into the local
streams and negatively affects the water quality. The watershed also received poor
ratings for biological oxygen demand, which was extremely low. This could be because
28
of the very low amount of biota living in the streams. The pH of both streams was a bit
high as well. This could be due to alkaline soils in the land surrounding the streams
(Campbell, 1992). Please see table 4.1 for the Water Quality Data of the Piedmont
Watershed.
29
Tabl
e 4.
1. P
iedm
ont W
ater
shed
Wat
er Q
ualit
y D
ata
Stre
am
Par
amet
erR
esul
tsG
rade
Res
ults
Gra
deR
esul
tsG
rade
Res
ults
Gra
deR
esul
tsG
rade
Res
ults
Gra
deR
esul
tsG
rade
Alk
alin
ity (p
pm)
160
140
416
01
120
212
02
120
212
02
Am
mon
ia (p
pm)
04
04
04
04
04
04
04
Chl
orid
e (p
pm)
603
403
403
603
603
603
533
Chl
orin
e (p
pm)
04
04
04
04
04
04
04
Chr
omiu
m (p
pm)
04
04
04
04
04
04
04
Cop
per (
ppm
)0
40
40
40
40
40
40
4D
isso
lved
Oxy
gen
(ppm
)6
44
33
23
24
34
34
3B
OD
(ppm
)1
10
10
11
10
10
10
1H
ardn
ess
320
112
03
240
180
312
03
120
316
72
Iron
(ppm
)1
10.
51
04
04
04
04
0.25
1N
itrat
e (p
pm)
151
53
201
34
53
101
101
Pho
spha
te (p
pm)
31
41
41
21
41
41
3.5
1pH
8.
02
8.0
28.
02
8.0
28.
61
8.25
18.
11
Turb
idity
clea
r4
clea
r4
clea
r4
clea
r4
clea
r4
slig
htly
3cl
ear
4O
dor
No
4N
o4
No
4N
o4
No
4N
o4
No
4S
heen
No
4N
o4
No
4N
o4
No
4N
o4
No
4H
ydro
carb
onn/
an/
an/
an/
an/
an/
an/
aO
vera
ll G
rade
B-
2.69
B3.
06B
-2.
75B
3.13
B3.
06B
-2.
88St
ream
Gra
de
Wat
ersh
ed G
rade
B-
2.93
KEY
4 =
Exce
llent
Gra
ding
Sca
le3
= G
ood
4.0
= A
+3.
4 =
B+
2.5
=C
+1.
5 =
D+
<0.7
=F
2 =
Fair
3.9-
3.7
=A
3.3-
3.0
=B
2.4-
2.0
=C
1.4-
1.0
=D
1 =
Poor
3.6-
3.5
=A
-2.
9-2.
6 =
B-
1.9-
1.6
=C
-0.
9-0.
7 =
D-
Blu
e H
en C
reek
Fairf
ield
Run
P1PC
P2PC
P3PC
P5FR
P6FR
P7FR
2.83
3.02
PAR
AM
ETER
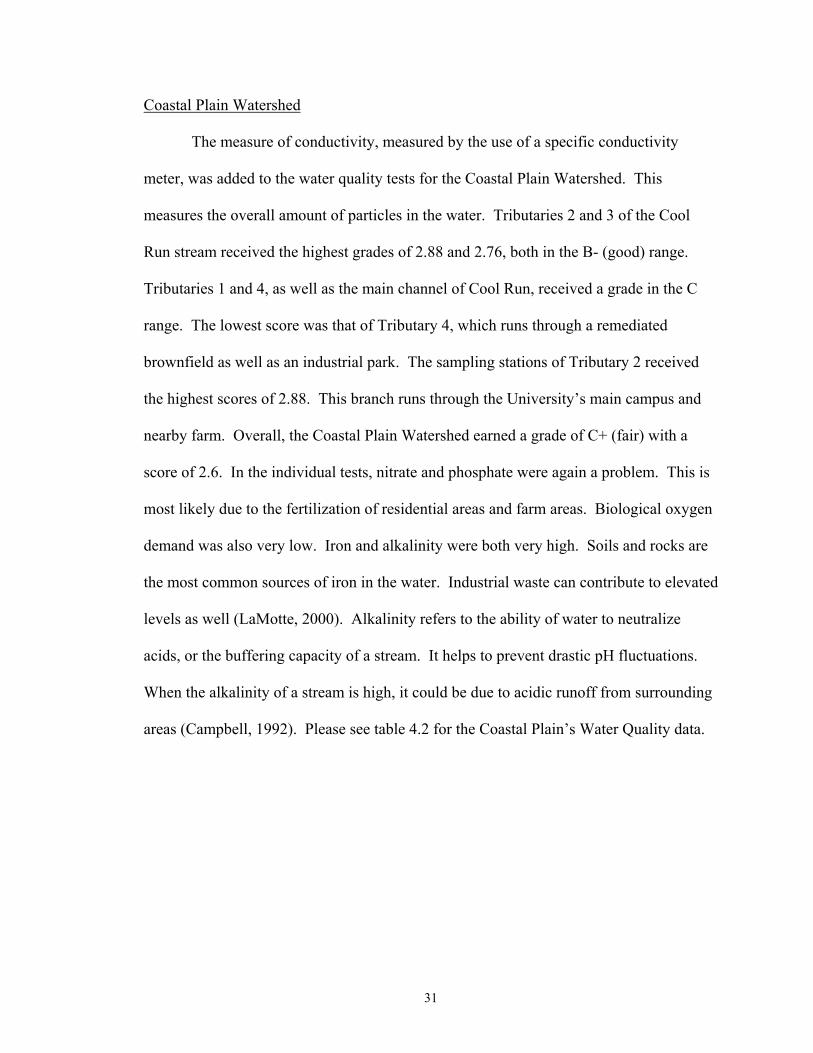
Coastal Plain Watershed
The measure of conductivity, measured by the use of a specific conductivity
meter, was added to the water quality tests for the Coastal Plain Watershed. This
measures the overall amount of particles in the water. Tributaries 2 and 3 of the Cool
Run stream received the highest grades of 2.88 and 2.76, both in the B- (good) range.
Tributaries 1 and 4, as well as the main channel of Cool Run, received a grade in the C
range. The lowest score was that of Tributary 4, which runs through a remediated
brownfield as well as an industrial park. The sampling stations of Tributary 2 received
the highest scores of 2.88. This branch runs through the University’s main campus and
nearby farm. Overall, the Coastal Plain Watershed earned a grade of C+ (fair) with a
score of 2.6. In the individual tests, nitrate and phosphate were again a problem. This is
most likely due to the fertilization of residential areas and farm areas. Biological oxygen
demand was also very low. Iron and alkalinity were both very high. Soils and rocks are
the most common sources of iron in the water. Industrial waste can contribute to elevated
levels as well (LaMotte, 2000). Alkalinity refers to the ability of water to neutralize
acids, or the buffering capacity of a stream. It helps to prevent drastic pH fluctuations.
When the alkalinity of a stream is high, it could be due to acidic runoff from surrounding
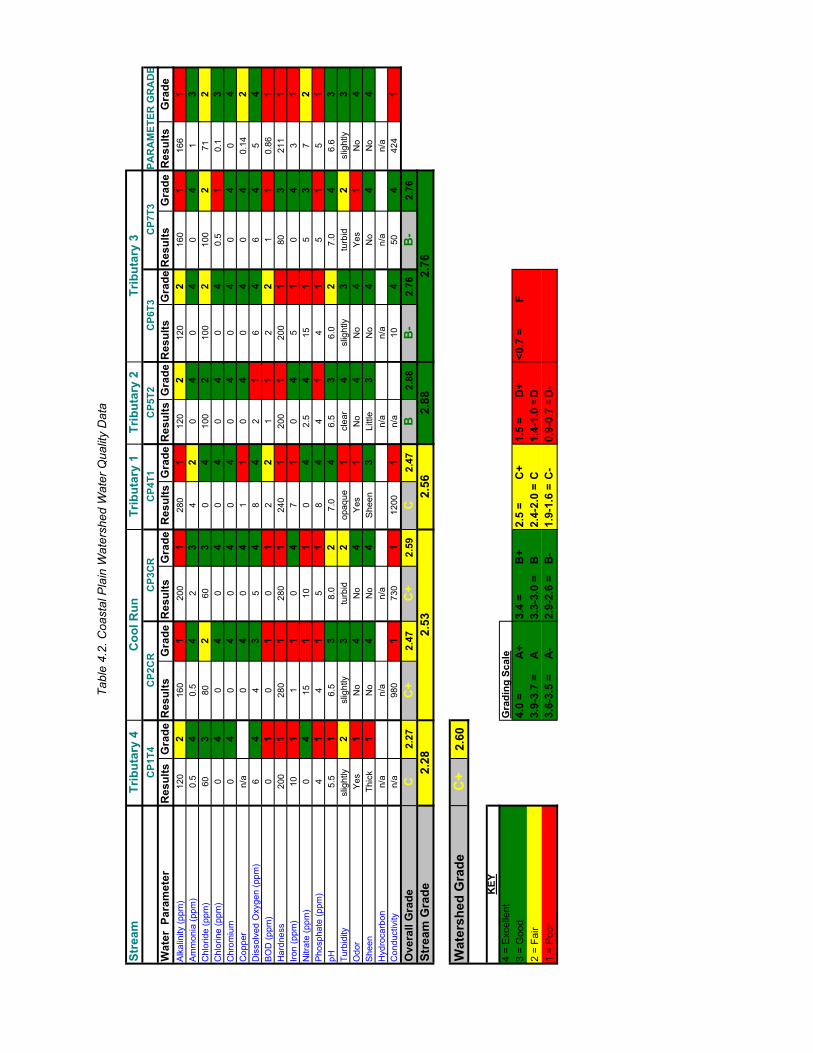
areas (Campbell, 1992). Please see table 4.2 for the Coastal Plain’s Water Quality data.
31
Table 4.2. Coastal Plain Watershed Water Quality Data
32
Tabl
e 4.
2. C
oast
al P
lain
Wat
ersh
ed W
ater
Qua
lity
Dat
a
Stre
am
Wat
er P
aram
eter
Res
ults
Gra
deR
esul
tsG
rade
Res
ults
Gra
deR
esul
tsG
rade
Res
ults
Gra
deR
esul
tsG
rade
Res
ults
Gra
deR
esul
tsG
rade
Alk
alin
ity (p
pm)
120
216
01
200
128
01
120
212
02
160
116
61
Am
mon
ia (p
pm)
0.5
40.
54
23
42
04
04
04
13
Chl
orid
e (p
pm)
603
802
603
04
100
210
02
100
271
2C
hlor
ine
(ppm
)0
40
40
40
40
40
40.
51
0.1
3C
hrom
ium
04
04
04
04
04
04
04
04
Cop
per
n/a
04
04
11
04
04
04
0.14
2D
isso
lved
Oxy
gen
(ppm
)6
44
35
48
42
16
46
45
4B
OD
(ppm
)0
10
10
12
21
12
21
10.
861
Har
dnes
s 20
01
280
128
01
240
120
01
200
180
321
11
Iron
(ppm
)10
11
10
47
10
45
10
43
1N
itrat
e (p
pm)
04
151
101
04
2.5
415
15
37
2P
hosp
hate
(ppm
)4
14
15
18
44
14
15
15
1pH
5.
51
6.5
38.
02
7.0
46.
53
6.0
27.
04
6.6
3Tu
rbid
itysl
ight
ly
2sl
ight
ly3
turb
id2
opaq
ue1
clea
r4
slig
htly
3tu
rbid
2sl
ight
ly3
Odo
rY
es1
No
4N
o4
Yes
1N
o4
No
4Y
es1
No
4S
heen
Thic
k1
No
4N
o4
She
en3
Littl
e3
No
4N
o4
No
4H
ydro
carb
onn/
an/
an/
an/
an/
an/
an/
aC
ondu
ctiv
ityn/
a98
01
730
112
001
n/a
104
504
424
1O
vera
ll G
rade
C2.
27C
+2.
47C
+2.
59C
2.47
B2.
88B
-2.
76B
-2.
76St
ream
Gra
de
Wat
ersh
ed G
rade
C+
2.60
KEY
4 =
Exc
elle
ntG
radi
ng S
cale
3 =
Goo
d4.
0 =
A+
3.4
=B
+2.
5 =
C+
1.5
=D
+<0
.7 =
F2
= Fa
ir3.
9-3.
7 =
A3.
3-3.
0 =
B2.
4-2.
0 =
C1.
4-1.
0 =D
1 =
Poo
r3.
6-3.
5 =
A-
2.9-
2.6
=B
-1.
9-1.
6 =
C-
0.9-
0.7
=D-
Trib
utar
y 4
Coo
l Run
Trib
utar
y 1
Trib
utar
y 2
CP7
T3PA
RA
MET
ER G
RA
DE
CP5
T2Tr
ibut
ary
3
2.56
2.88
2.76
CP1
T4C
P2C
RC
P3C
R
2.53
2.28
CP4
T1C
P6T3
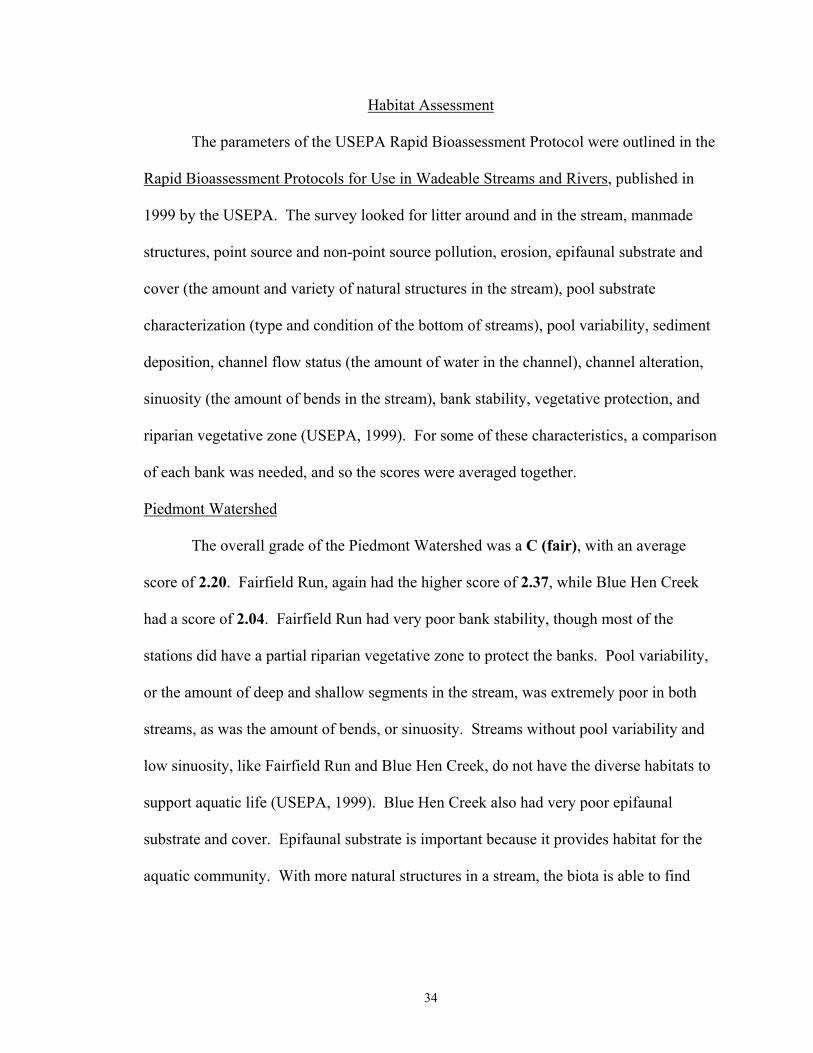
Habitat Assessment
The parameters of the USEPA Rapid Bioassessment Protocol were outlined in the
Rapid Bioassessment Protocols for Use in Wadeable Streams and Rivers, published in
1999 by the USEPA. The survey looked for litter around and in the stream, manmade
structures, point source and non-point source pollution, erosion, epifaunal substrate and
cover (the amount and variety of natural structures in the stream), pool substrate
characterization (type and condition of the bottom of streams), pool variability, sediment
deposition, channel flow status (the amount of water in the channel), channel alteration,
sinuosity (the amount of bends in the stream), bank stability, vegetative protection, and
riparian vegetative zone (USEPA, 1999). For some of these characteristics, a comparison
of each bank was needed, and so the scores were averaged together.
Piedmont Watershed
The overall grade of the Piedmont Watershed was a C (fair), with an average
score of 2.20. Fairfield Run, again had the higher score of 2.37, while Blue Hen Creek
had a score of 2.04. Fairfield Run had very poor bank stability, though most of the
stations did have a partial riparian vegetative zone to protect the banks. Pool variability,
or the amount of deep and shallow segments in the stream, was extremely poor in both
streams, as was the amount of bends, or sinuosity. Streams without pool variability and
low sinuosity, like Fairfield Run and Blue Hen Creek, do not have the diverse habitats to
support aquatic life (USEPA, 1999). Blue Hen Creek also had very poor epifaunal
substrate and cover. Epifaunal substrate is important because it provides habitat for the
aquatic community. With more natural structures in a stream, the biota is able to find
34
refuge and feeding areas, as well as spawning sites. Please see table 4.3 for the Habitat
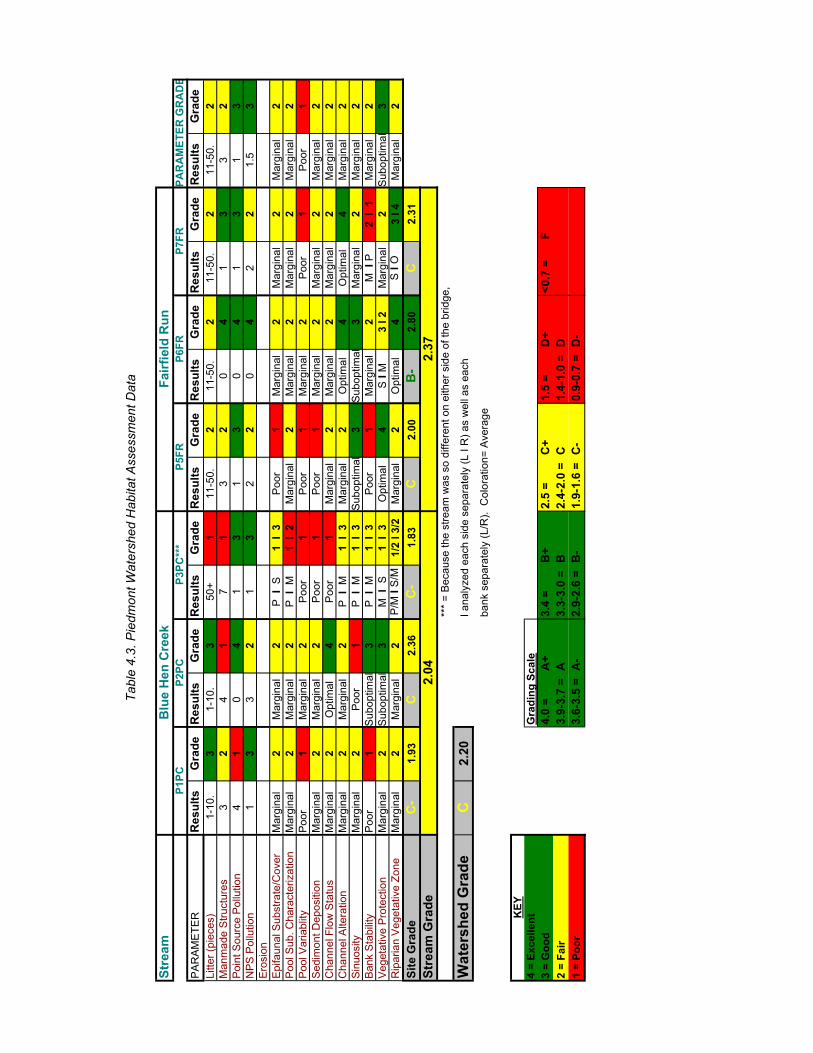
Assessment Data of the Piedmont Watershed.
35
Tabl
e 4.
3. P
iedm
ont W
ater
shed
Hab
itat A
sses
smen
t Dat
a
Stre
am
PA
RA
ME
TER
Res
ults
Gra
deR
esul
tsG
rade
Res
ults
Gra
deR
esul
tsG
rade
Res
ults
Gra
deR
esul
tsG
rade
Res
ults
Gra
deLi
tter (
piec
es)
1-10
.3
1-10
.3
50+
111
-50.
211
-50.
211
-50.
211
-50.
2M
anm
ade
Stru
ctur
es3
24
17
13
20
41
33
2P
oint
Sou
rce
Pol
lutio
n4
10
41
31
30
41
31
3N
PS
Pol
lutio
n1
33
21
32
20
42
21.
53
Ero
sion
Epi
faun
al S
ubst
rate
/Cov
erM
argi
nal
2M
argi
nal
2P
I S
1 I
3P
oor
1M
argi
nal
2M
argi
nal
2M
argi
nal
2P
ool S
ub. C
hara
cter
izat
ion
Mar
gina
l2
Mar
gina
l2
P I
M1
I 2
Mar
gina
l2
Mar
gina
l2
Mar
gina
l2
Mar
gina
l2
Poo
l Var
iabl
ityP
oor
1M
argi
nal
2P
oor
1P
oor
1M
argi
nal
2P
oor
1P
oor
1S
edim
ont D
epos
ition
Mar
gina
l2
Mar
gina
l2
Poo
r1
Poo
r1
Mar
gina
l2
Mar
gina
l2
Mar
gina
l2
Cha
nnel
Flo
w S
tatu
sM
argi
nal
2O
ptim
al4
Poo
r1
Mar
gina
l2
Mar
gina
l2
Mar
gina
l2
Mar
gina
l2
Cha
nnel
Alte
ratio
nM
argi
nal
2M
argi
nal
2P
I M
1 I
3M
argi
nal
2O
ptim
al4
Opt
imal
4M
argi
nal
2S
inuo
sity
Mar
gina
l2
Poo
r1
P I
M1
I 3
Sub
optim
al3
Sub
optim
al3
Mar
gina
l2
Mar
gina
l2
Ban
k S
tabi
lity
Poo
r1
Sub
optim
al3
P I
M1
I 3
Poo
r1
Mar
gina
l2
M I
P2
I 1
Mar
gina
l2
Veg
etat
ive
Pro
tect
ion
Mar
gina
l2
Sub
optim
al3
M I
S1
I 3
Opt
imal
4S
I M
3 I 2
Mar
gina
l2
Sub
optim
al3
Rip
aria
n V
eget
ativ
e Zo
neM
argi
nal
2M
argi
nal
2P
/M I
S/M
1/2
I 3/2
Mar
gina
l2
Opt
imal
4S
I O
3 I 4
Mar
gina
l2
Site
Gra
deC
-1.
93C
2.36
C-
1.83
C2.
00B
-2.
80C
2.31
Stre
am G
rade
***
= B
ecau
se th
e st
ream
was
so
diffe
rent
on
eith
er s
ide
of th
e br
idge
,
Wat
ersh
ed G
rade
C2.
20I a
naly
zed
each
sid
e se
para
tely
(L I
R) a
s w
ell a
s ea
ch
bank
sep
arat
ely
(L/R
). C
olor
atio
n= A
vera
ge
KE Y
4 =
Exce
llent
Gra
ding
Sca
le3
= G
ood
4.0
= A
+3.
4 =
B+
2.5
=C
+1.
5 =
D+
<0.7
=F
2 =
Fair
3.9-
3.7
=A
3.3-
3.0
=B
2.4-
2.0
=C
1.4-
1.0
=D
1 =
Poor
3.6-
3.5
=A
-2.
9-2.
6 =
B-
1.9-
1.6
=C
-0.
9-0.
7 =
D-
PAR
AM
ETER
GR
AD
E
2.04
2.37
P1PC
P2PC
P3PC
***
P5FR
Blu
e H
en C
reek
Fairf
ield
Run
P6FR
P7FR
Coastal Plain Watershed
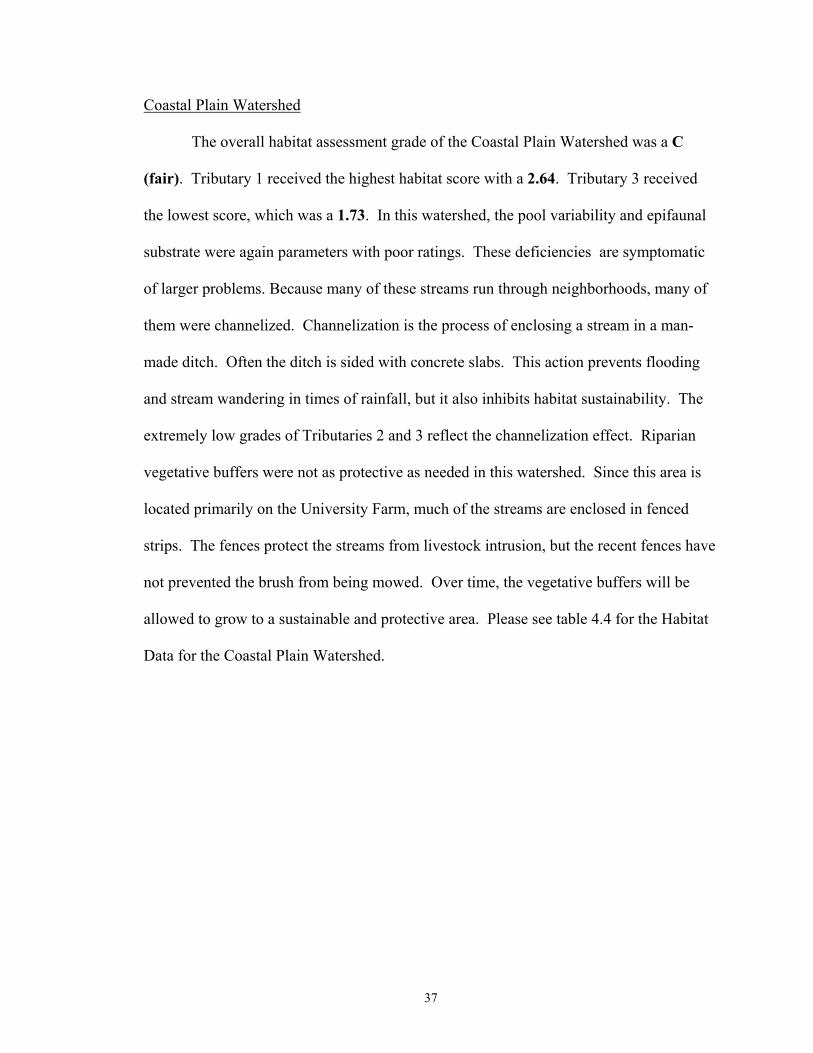
The overall habitat assessment grade of the Coastal Plain Watershed was a C
(fair). Tributary 1 received the highest habitat score with a 2.64. Tributary 3 received
the lowest score, which was a 1.73. In this watershed, the pool variability and epifaunal
substrate were again parameters with poor ratings. These deficiencies are symptomatic
of larger problems. Because many of these streams run through neighborhoods, many of
them were channelized. Channelization is the process of enclosing a stream in a man-
made ditch. Often the ditch is sided with concrete slabs. This action prevents flooding
and stream wandering in times of rainfall, but it also inhibits habitat sustainability. The
extremely low grades of Tributaries 2 and 3 reflect the channelization effect. Riparian
vegetative buffers were not as protective as needed in this watershed. Since this area is
located primarily on the University Farm, much of the streams are enclosed in fenced
strips. The fences protect the streams from livestock intrusion, but the recent fences have
not prevented the brush from being mowed. Over time, the vegetative buffers will be
allowed to grow to a sustainable and protective area. Please see table 4.4 for the Habitat
Data for the Coastal Plain Watershed.
37
Tabl
e 4.
4. C
oast
al P
lain
Wat
ersh
ed H
abita
t Ass
essm
ent D
ata
(EP
A)
Stre
am
PAR
AM
ETER
Res
ults
Gra
deR
esul
tsG
rade
Res
ults
Gra
deR
esul
tsG
rade
Res
ults
Gra
deR
esul
tsG
rade
Res
ults
Gra
deR
esul
tsG
rade
Litte
r (pi
eces
)1-
10.
30
41-
10.
30
411
-50.
21-
10.
31-
10.
31-
10.
3M
anm
ade
Stru
ctur
es2
20
42
21
33
22
21
32
2P
oint
Sou
rce
Pol
lutio
n2
20
40
40
41
30
42
20.
73
NP
S P
ollu
tion
04
32
32
32
13
22
22
22
Ero
sion
Epi
faun
al S
ubst
./Cov
erP
oor
1S
ub.
3P
oor
1P
oor
1P
oor
1P
oor
1M
argi
nal
2P
oor
1P
ool S
ub. C
hara
cter
.M
argi
nal
2S
ub.
3M
argi
nal
2M
argi
nal
2M
argi
nal
2M
argi
nal
2S
ub.
3M
argi
nal
2P
ool V
aria
blity
Poo
r1
Poo
r1
Sub
.3
Mar
gina
l2
Poo
r1
Poo
r1
Poo
r1
Poo
r1
Sed
imon
t Dep
ositi
onP
oor
1S
ub.
3P
oor
1M
argi
nal
2M
argi
nal
2P
oor
1M
argi
nal
2M
argi
nal
2C
hann
el F
low
Sta
tus
Poo
r1
Sub
.3
Sub
.3
Poo
r1
Mar
gina
l2
Poo
r1
Sub
.3
Mar
gina
l2
Cha
nnel
Alte
ratio
nM
argi
nal
2O
ptim
al4
Mar
gina
l2
Opt
imal
4M
argi
nal
2P
oor
1S
ub.
3M
argi
nal
2S
inuo
sity
Poo
r1
Mar
gina
l2
Mar
gina
l2
Sub
.3
Mar
gina
l2
Poo
r1
Mar
gina
l2
Mar
gina
l2
Ban
k S
tabi
lity
M I
P2
I 1S
I P
3 I 1
Poo
r1
Opt
imal
4M
argi
nal
2n/
a*S
ub.
3M
argi
nal
2V
eget
ativ
e P
rote
ctio
nM
argi
nal
2O
I P
4 I 1
Mar
gina
l2
Sub
.3
Poo
r1
n/a*
Mar
gina
l2
Mar
gina
l2
Rip
aria
n V
eg. Z
one
Mar
gina
l2
S I
P3
I 1P
oor
1M
argi
nal
2P
oor
1n/
a*M
argi
nal
2M
argi
nal
2Si
te G
rade
C-
1.80
B-
2.71
C
2.07
B-
2.64
C-
1.86
C-
1.73
C
2.36
Stre
am G
rade
Wat
ersh
ed G
rade
C2.
71*=
Bec
ause
this
stre
am w
as c
hann
eliz
ed, t
he b
anks
con
sist
ed o
f sha
rply
slo
ping
sla
bs o
f Con
cret
e.
Ther
efor
e, I
coul
d no
t des
crib
e th
ese
para
met
ers.
KEY
4 =
Exce
llent
Gra
ding
Sca
le3
= G
ood
4.0
= A
+3.
4 =
B+
2.5
=C
+1.
5 =
D+
<0.7
=F
2 =
Fair
3.9-
3.7
=A
3.3-
3.0
=B
2.4-
2.0
=C
1.4-
1.0
=D
1 =
Poor
3.6-
3.5
=A
-2.
9-2.
6 =
B-
1.9-
1.6
=C
-0.
9-0.
7 =
D-
Trib
utar
y 4
Coo
l Run
PAR
AM
ETER
1.80
2.39
2.64
1.86
2.04
Trib
utar
y 1
Trib
utar
y 2
Trib
utar
y 3
CP1
T4C
P2C
RC
P3C
RC
P4T1
CP5
T2C
P6T3
CP7
T3
A Comparison
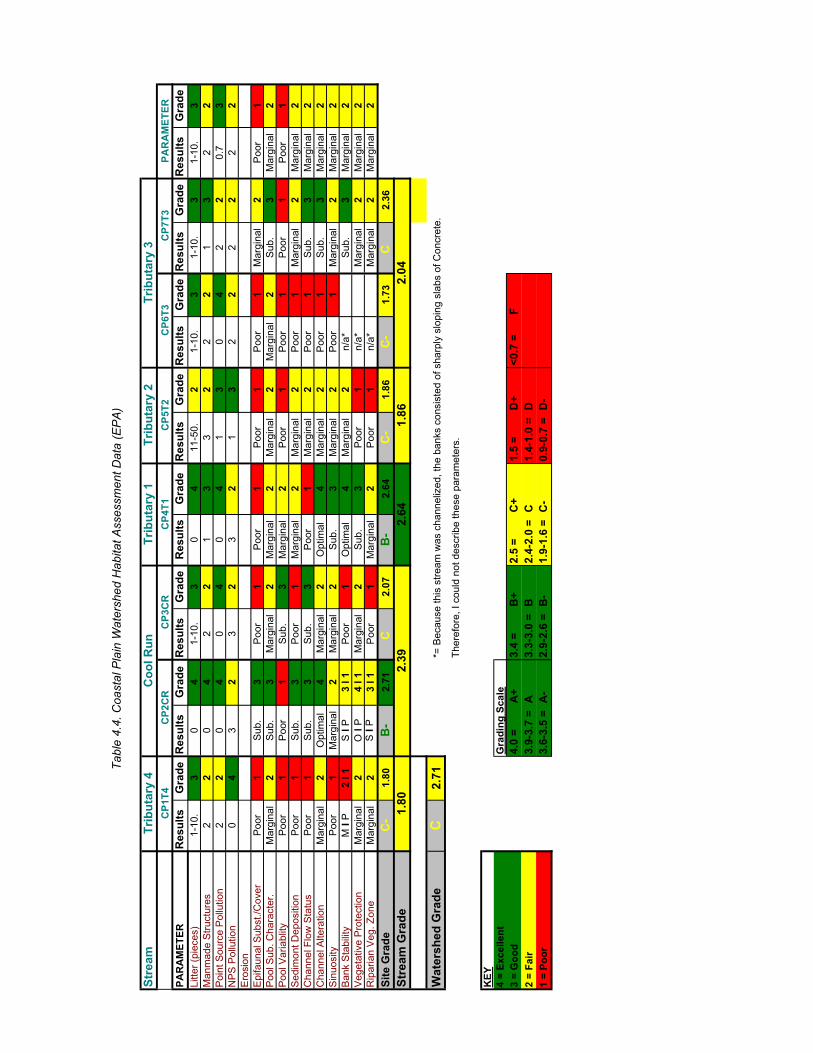
When comparing the two Watersheds, they share many of the same problems.
Table 4.5 illustrates the grades by parameter. For instance, the streams in both
watersheds only received a marginal grade in sediment deposition, channel flow status,
sinuosity, bank stability and riparian vegetative zone. This indicates the streams are
extremely susceptible to erosion. Without adequate vegetative zones, the banks cannot
remain stable during a period of heavy flow. This causes the stream to have large
deposits of sediment and stretches of heavily eroded bank. Pool variability in both
watersheds was given a poor rating. This is probably also due to the extreme erosion and
consequent sediment deposition. This sediment will fill in the natural deeper and
shallower areas (known as pools and riffles), and the stream is less adequate to sustain
aquatic life (USEPA, 1999). Both streams did score well on the point source pollution
parameter, though there were a number of non-point source pollution influences in both
watersheds.
39
Table 4.5. Comparison of the Watershed’s Habitat Assessment Data by Parameter
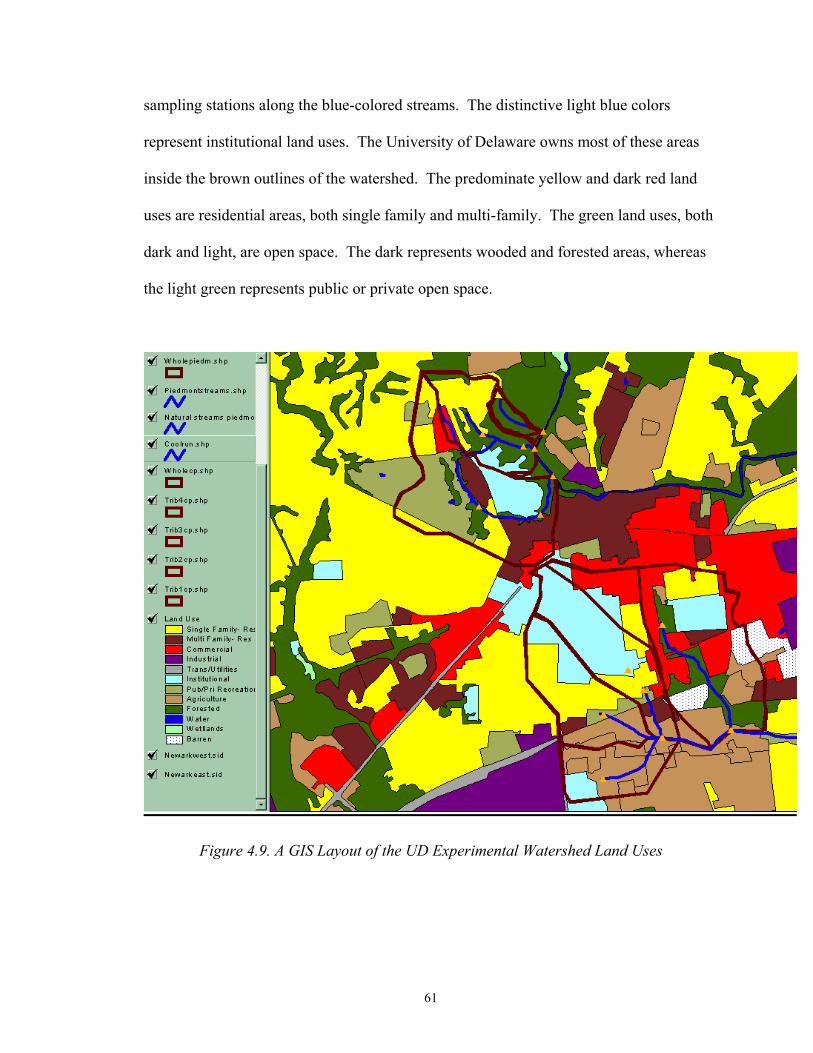
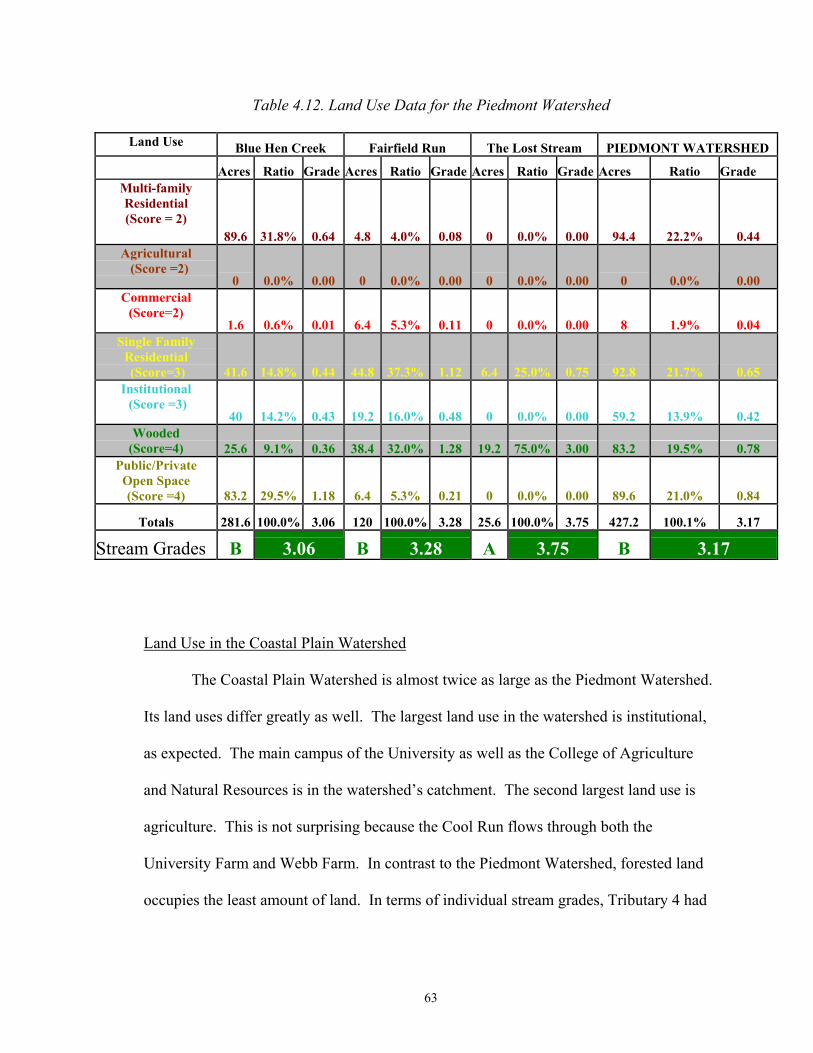
The Coastal Plain Watershed is almost twice as large as the Piedmont Watershed.
Its land uses differ greatly as well. The largest land use in the watershed is institutional,
as expected. The main campus of the University as well as the College of Agriculture
and Natural Resources is in the watershed’s catchment. The second largest land use is
agriculture. This is not surprising because the Cool Run flows through both the
University Farm and Webb Farm. In contrast to the Piedmont Watershed, forested land
occupies the least amount of land. In terms of individual stream grades, Tributary 4 had
63
the lowest grade with a 2.61. This is barely considered a B-. This stream’s basin
includes a former brownfield, a previously industrial, now barren site and a residential
area. The stream with the majority of “good” land uses was Tributary 1, with a grade of
3.09. This stream also had the smallest land area, though it did include some of the
College of Agriculture and Natural Resources’ buildings. It had a very small amount of
commercial or residential land uses. The overall Watershed grade was a B- with a 2.80
(Table 4.13).
64
65
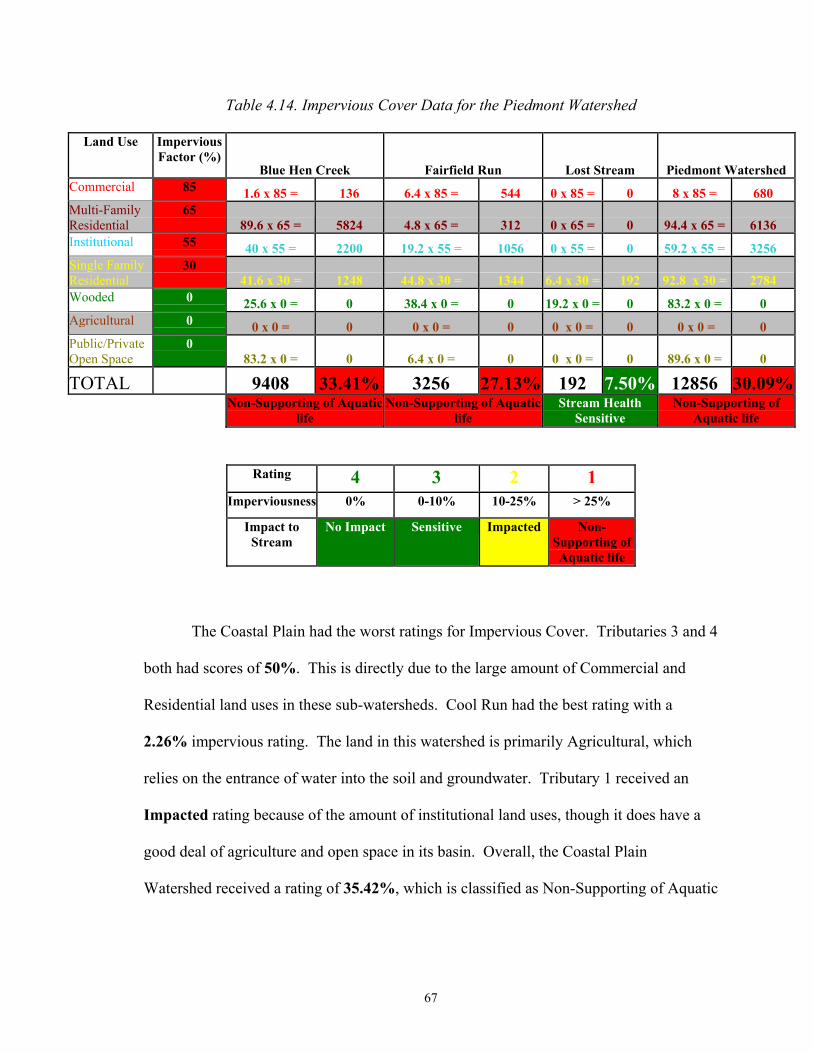
Impervious Cover Data
The results of the Land Use Survey were used to determine Impervious Cover
Data as well. Impervious Cover was determined using Table 3.6 Impervious Cover
Factors. The Impervious Factor percentage was multiplied by the amount of each land
use in the sub-watershed. The Impervious Factors for each stream sub-watershed were
totaled and divided by the total acreage. This gave the total Watershed Impervious
Percentage, which was compared to table 3.7, Impervious Cover Rating Scale. The data
was put into an Excel spreadsheet.
The Piedmont Watershed had an overall rating of Poor for the Impervious
Cover Survey. The percentage of impervious cover for the entire watershed was 30.09%.
This falls above the 25 percentage cutoff for Impacted Stream Health, and is officially
Non-Supporting of Aquatic Life. Both the Blue Hen Creek and Fairfield Run had Non-
Supporting health ratings as well. The Lost Stream had a sensitive rating. By referring
back to table 4.12, the Land Use Data, it is easy to see the causes of these ratings. Blue
Hen Creek and Fairfield Run both have high amounts of multi-family residential and
institutional land uses, which have very high impervious cover percentages. The Lost
Stream has extraordinary percentages of forested land, which is extremely pervious.
table 4.14 demonstrates the Impervious Cover results.
66
Table 4.14. Impervious Cover Data for the Piedmont Watershed
Land Use Impervious Factor (%)
Blue Hen Creek Fairfield Run Lost Stream Piedmont Watershed Commercial 85 1.6 x 85 = 136 6.4 x 85 = 544 0 x 85 = 0 8 x 85 = 680 Multi-Family Residential
65 89.6 x 65 = 5824 4.8 x 65 = 312 0 x 65 = 0 94.4 x 65 = 6136
Institutional 55 40 x 55 = 2200 19.2 x 55 = 1056 0 x 55 = 0 59.2 x 55 = 3256 Single Family Residential
30 41.6 x 30 = 1248 44.8 x 30 = 1344 6.4 x 30 = 192 92.8 x 30 = 2784
Wooded 0 25.6 x 0 = 0 38.4 x 0 = 0 19.2 x 0 = 0 83.2 x 0 = 0 Agricultural 0 0 x 0 = 0 0 x 0 = 0 0 x 0 = 0 0 x 0 = 0 Public/Private Open Space
0 83.2 x 0 = 0 6.4 x 0 = 0 0 x 0 = 0 89.6 x 0 = 0
TOTAL 9408 33.41% 3256 27.13% 192 7.50% 12856 30.09%
Non-Supporting of Aquatic
life Non-Supporting of Aquatic
life Stream Health
Sensitive Non-Supporting of
Aquatic life
Rating 4 3 2 1
Imperviousness 0% 0-10% 10-25% > 25% Impact to
Stream No Impact Sensitive Impacted Non-
Supporting of Aquatic life
The Coastal Plain had the worst ratings for Impervious Cover. Tributaries 3 and 4
both had scores of 50%. This is directly due to the large amount of Commercial and
Residential land uses in these sub-watersheds. Cool Run had the best rating with a
2.26% impervious rating. The land in this watershed is primarily Agricultural, which
relies on the entrance of water into the soil and groundwater. Tributary 1 received an
Impacted rating because of the amount of institutional land uses, though it does have a
good deal of agriculture and open space in its basin. Overall, the Coastal Plain
Watershed received a rating of 35.42%, which is classified as Non-Supporting of Aquatic
67
Life. Most of the Impervious Cover percentage came from commercial land uses. Table
4.15 demonstrates the details of the Impervious Cover Survey.
68
69
Comparison of Watershed Report Cards
In Jennifer Campagnini’s report Development of the University of Delaware
Experimental Watershed Project, a proposal for the continuation of the Watershed Report
Card was made. This report has been completed with that goal in sight. With the
completion of the four parameters; Water Quality, Habitat Analysis, Land Use and
Impervious Cover, the report card can be completed and compared to the previous one.
Of course, some variation will exist due to the unusual weather conditions of this fall and
winter. That is out of the control of the researchers, and hopefully, in the continuation of
the project, the outlying years will be absorbed by the overall average (Campagnini,
2001).
In the year 2001, the Overall Watershed Health Grade of the Piedmont Watershed
was a B-. Each stream in the watershed received no lower than a C for total health. The
weakest parameter overall was Impervious Cover, with a C- grade. Land Use had the
highest grade with a B. Water Quality and Habitat Analysis both received B- grades.
Please see table 4.16 (Campagnini, 2001).
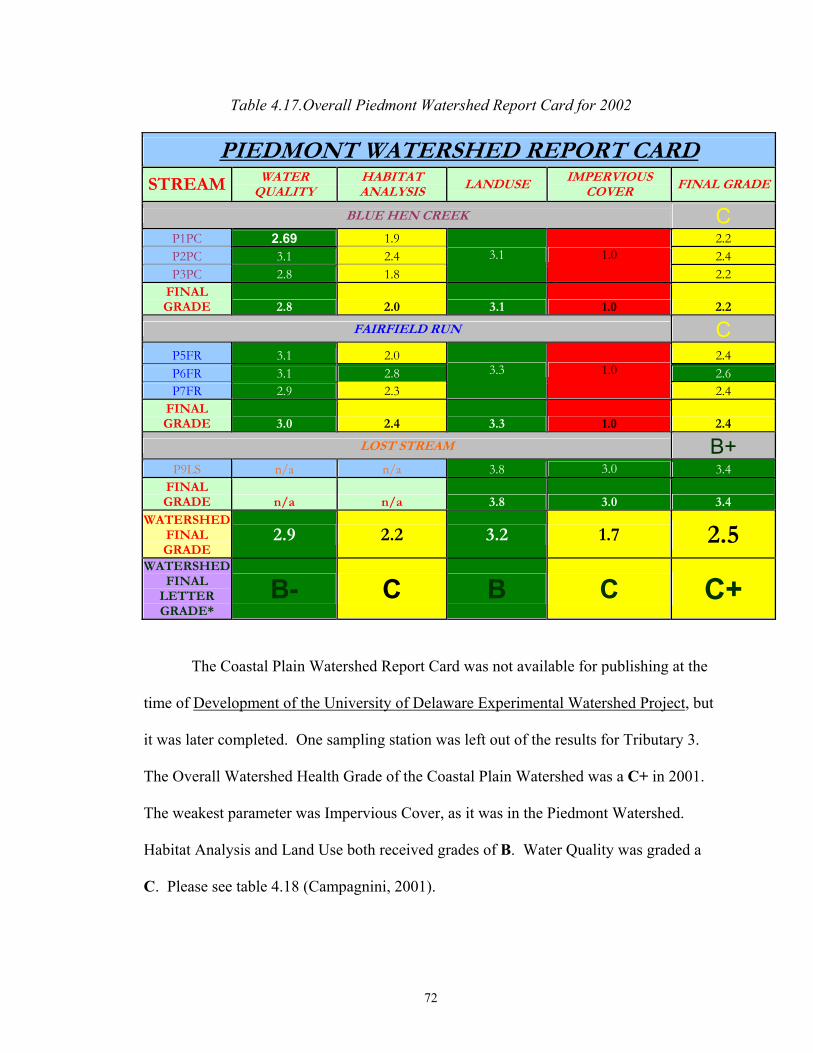
The year of 2002 brought about changes for the Piedmont Watershed. The
Overall Watershed Health Grade of the Piedmont Watershed was a C+. The lowest
individual Stream Health Grade was a C, but both the Blue Hen Creek and Fairfield Run
received this grade. Blue Hen Creek had the lowest score for land use as well as water
quality and habitat assessment. The Lost Stream was not able to be tested for Water
Quality or Habitat Assessment, so its grade is not reflective of its overall condition.
70
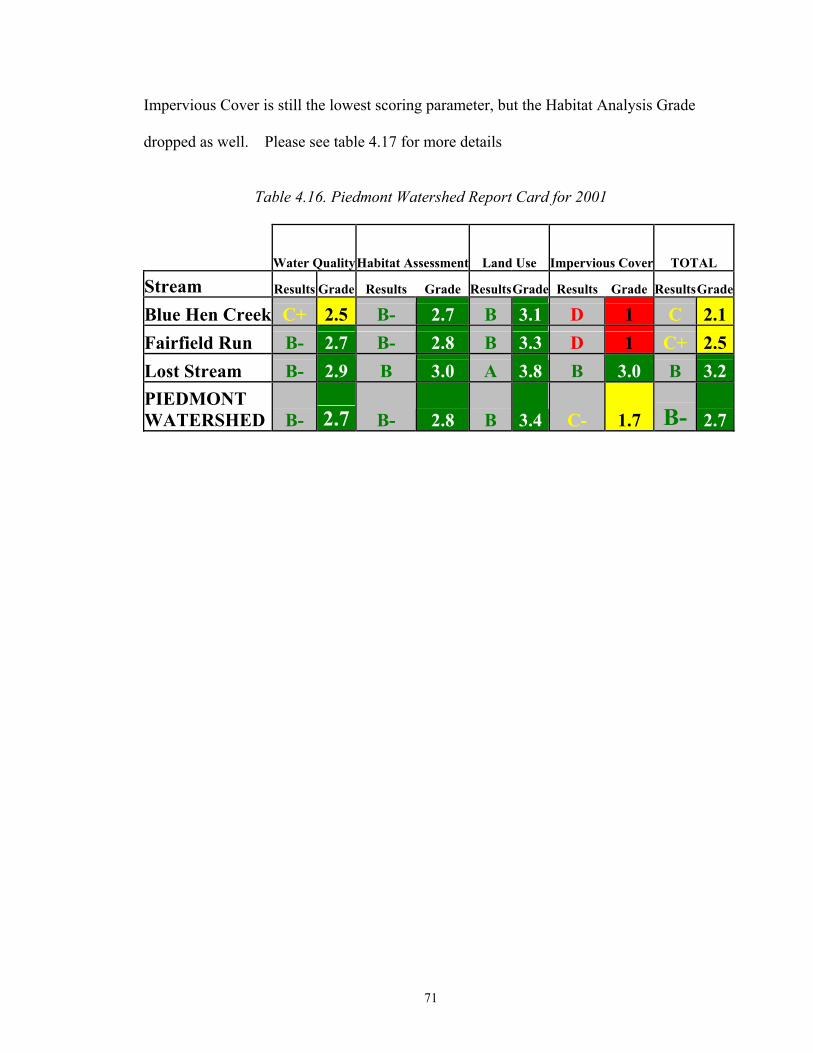
Impervious Cover is still the lowest scoring parameter, but the Habitat Analysis Grade
dropped as well. Please see table 4.17 for more details
Table 4.16. Piedmont Watershed Report Card for 2001
Water QualityHabitat Assessment Land Use Impervious Cover TOTAL Stream Results Grade Results Grade ResultsGrade Results Grade ResultsGrade
Blue Hen Creek C+ 2.5 B- 2.7 B 3.1 D 1 C 2.1Fairfield Run B- 2.7 B- 2.8 B 3.3 D 1 C+ 2.5Lost Stream B- 2.9 B 3.0 A 3.8 B 3.0 B 3.2PIEDMONT WATERSHED B- 2.7 B- 2.8 B 3.4 C- 1.7 B- 2.7
71
Table 4.17.Overall Piedmont Watershed Report Card for 2002
PIEDMONT WATERSHED REPORT CARD STREAM WATER
QUALITY HABITAT ANALYSIS LANDUSE IMPERVIOUS
COVER FINAL GRADE
BLUE HEN CREEK C P1PC 2.69 1.9 2.2 P2PC 3.1 2.4 2.4 P3PC 2.8 1.8
3.1 1.0 2.2
FINAL GRADE 2.8 2.0 3.1 1.0 2.2
FAIRFIELD RUN C P5FR 3.1 2.0 2.4 P6FR 3.1 2.8 2.6 P7FR 2.9 2.3
3.3 1.0 2.4
FINAL GRADE 3.0 2.4 3.3 1.0 2.4
LOST STREAM B+ P9LS n/a n/a 3.8 3.0 3.4
FINAL GRADE n/a n/a 3.8 3.0 3.4
WATERSHED FINAL GRADE
2.9 2.2 3.2 1.7 2.5 WATERSHED
FINAL LETTER GRADE*
B- C B C C+
The Coastal Plain Watershed Report Card was not available for publishing at the
time of Development of the University of Delaware Experimental Watershed Project, but
it was later completed. One sampling station was left out of the results for Tributary 3.
The Overall Watershed Health Grade of the Coastal Plain Watershed was a C+ in 2001.
The weakest parameter was Impervious Cover, as it was in the Piedmont Watershed.
Habitat Analysis and Land Use both received grades of B. Water Quality was graded a
C. Please see table 4.18 (Campagnini, 2001).
72
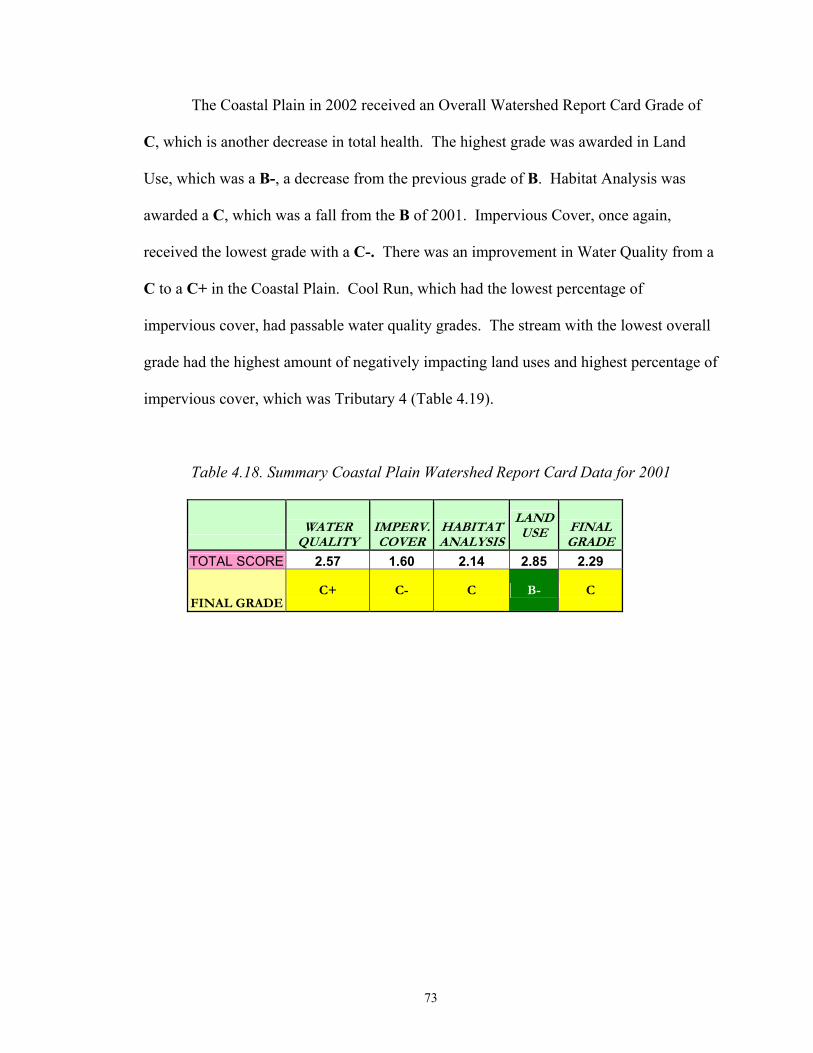
The Coastal Plain in 2002 received an Overall Watershed Report Card Grade of
C, which is another decrease in total health. The highest grade was awarded in Land
Use, which was a B-, a decrease from the previous grade of B. Habitat Analysis was
awarded a C, which was a fall from the B of 2001. Impervious Cover, once again,
received the lowest grade with a C-. There was an improvement in Water Quality from a
C to a C+ in the Coastal Plain. Cool Run, which had the lowest percentage of
impervious cover, had passable water quality grades. The stream with the lowest overall
grade had the highest amount of negatively impacting land uses and highest percentage of
impervious cover, which was Tributary 4 (Table 4.19).
Table 4.18. Summary Coastal Plain Watershed Report Card Data for 2001
WATER
QUALITY IMPERV. COVER
HABITAT ANALYSIS
LAND USE FINAL
GRADE
TOTAL SCORE 2.57 1.60 2.14 2.85 2.29
FINAL GRADE C+ C- C B- C
73
Table 4.19. Overall Coastal Plain Watershed Report Card For 2002
COASTAL PLAIN WATERSHED
STREAM WATER
QUALITYIMPERV. COVER
HABITAT ANALYSIS
LAND USE FINAL GRADE
TRIBUTARY 4 C
CP1T4 2.27 1.00 1.80 3.09 2.04
COOL RUN B-
CP2CR 2.47 2.71 2.77
CP3CR 2.59
3.00
2.07
2.90
2.64
TRIBUTARY 1 C+
CP4T1 2.47
2.00
2.64
2.96
2.52
TRIBUTARY 2 C
CP5T2 2.88 1.00 1.86 2.61 2.09
TRIBUTARY 3 C
CP6T3 2.76 1.73 2.05
CP7T3 2.76
1.00
2.36
2.69
2.20
TOTAL SCORE
2.57 1.60 2.14 2.85 2.29
FINAL GRADE
C+ C- C B- C
74
Chapter 5
CONCLUSIONS AND IMPLICATIONS
The results of this research indicate that there is a link between land use, stream
water quality, and watershed health at the University of Delaware Experimental
Watershed. The watersheds with higher levels of urban and suburban and built land uses
have lower watershed grades than the watersheds with higher amounts of forested and
open space. The watershed report card grading system developed here for the University
of Delaware Experimental Watershed may have applications to other watersheds in the
Piedmont and Coastal Plain regions of the Northeastern and Mid-Atlantic USA.
Conclusions/Implications
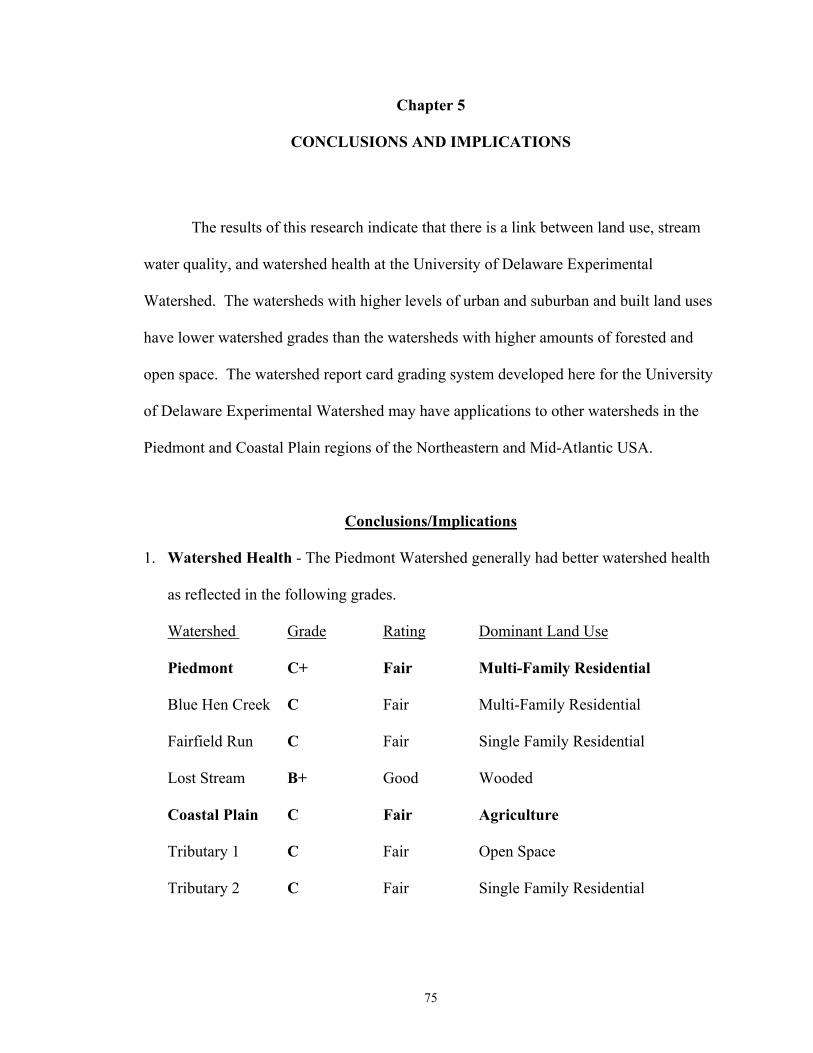
1. Watershed Health - The Piedmont Watershed generally had better watershed health
as reflected in the following grades.
Watershed Grade Rating Dominant Land Use
Piedmont C+ Fair Multi-Family Residential
Blue Hen Creek C Fair Multi-Family Residential
Fairfield Run C Fair Single Family Residential
Lost Stream B+ Good Wooded
Coastal Plain C Fair Agriculture
Tributary 1 C Fair Open Space
Tributary 2 C Fair Single Family Residential
75
Tributary 3 B- Good Institutional
Tributary 4 C Fair Commercial
Cool Run C Fair Agriculture
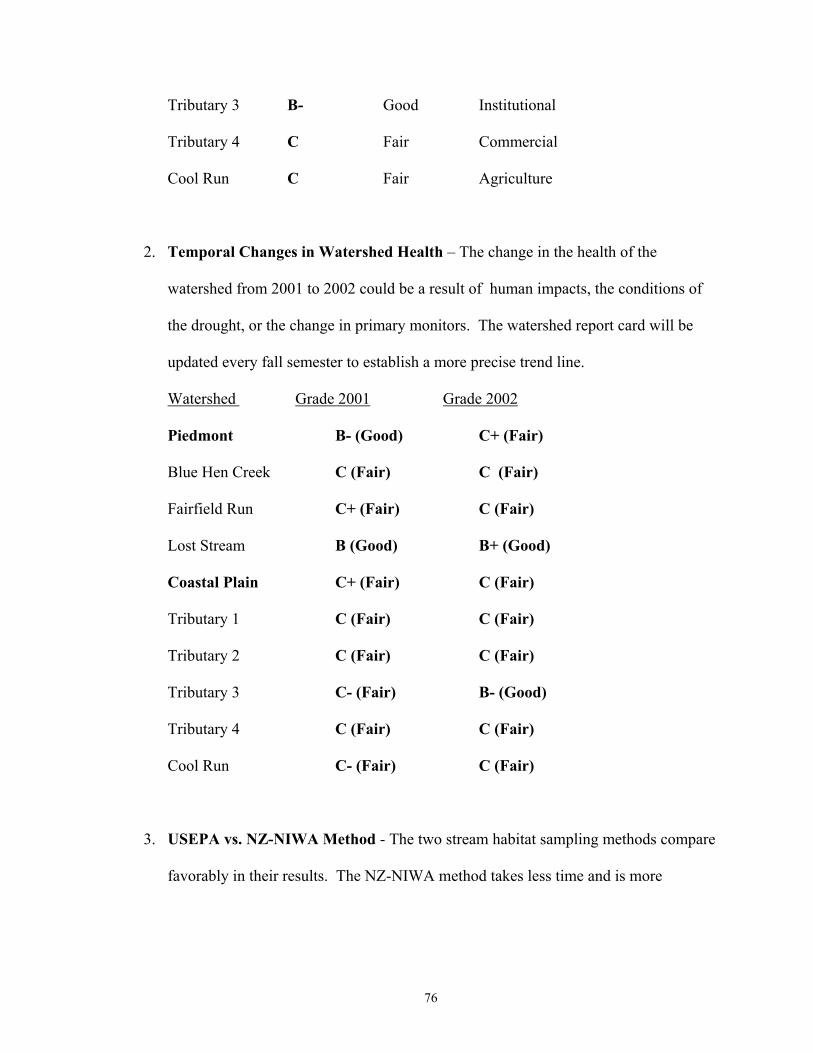
2. Temporal Changes in Watershed Health – The change in the health of the
watershed from 2001 to 2002 could be a result of human impacts, the conditions of
the drought, or the change in primary monitors. The watershed report card will be
updated every fall semester to establish a more precise trend line.
Watershed Grade 2001 Grade 2002
Piedmont B- (Good) C+ (Fair)
Blue Hen Creek C (Fair) C (Fair)
Fairfield Run C+ (Fair) C (Fair)
Lost Stream B (Good) B+ (Good)
Coastal Plain C+ (Fair) C (Fair)
Tributary 1 C (Fair) C (Fair)
Tributary 2 C (Fair) C (Fair)
Tributary 3 C- (Fair) B- (Good)
Tributary 4 C (Fair) C (Fair)
Cool Run C- (Fair) C (Fair)
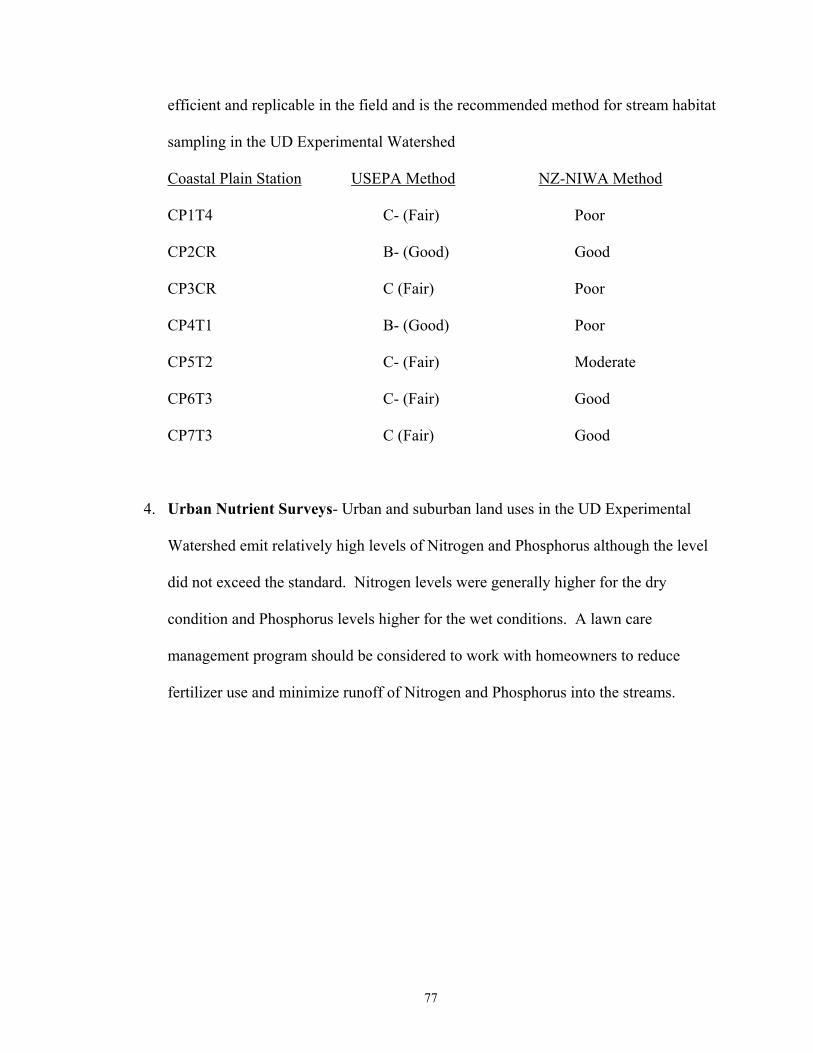
3. USEPA vs. NZ-NIWA Method - The two stream habitat sampling methods compare
favorably in their results. The NZ-NIWA method takes less time and is more
76
efficient and replicable in the field and is the recommended method for stream habitat
sampling in the UD Experimental Watershed
Coastal Plain Station USEPA Method NZ-NIWA Method
CP1T4 C- (Fair) Poor
CP2CR B- (Good) Good
CP3CR C (Fair) Poor
CP4T1 B- (Good) Poor
CP5T2 C- (Fair) Moderate
CP6T3 C- (Fair) Good
CP7T3 C (Fair) Good
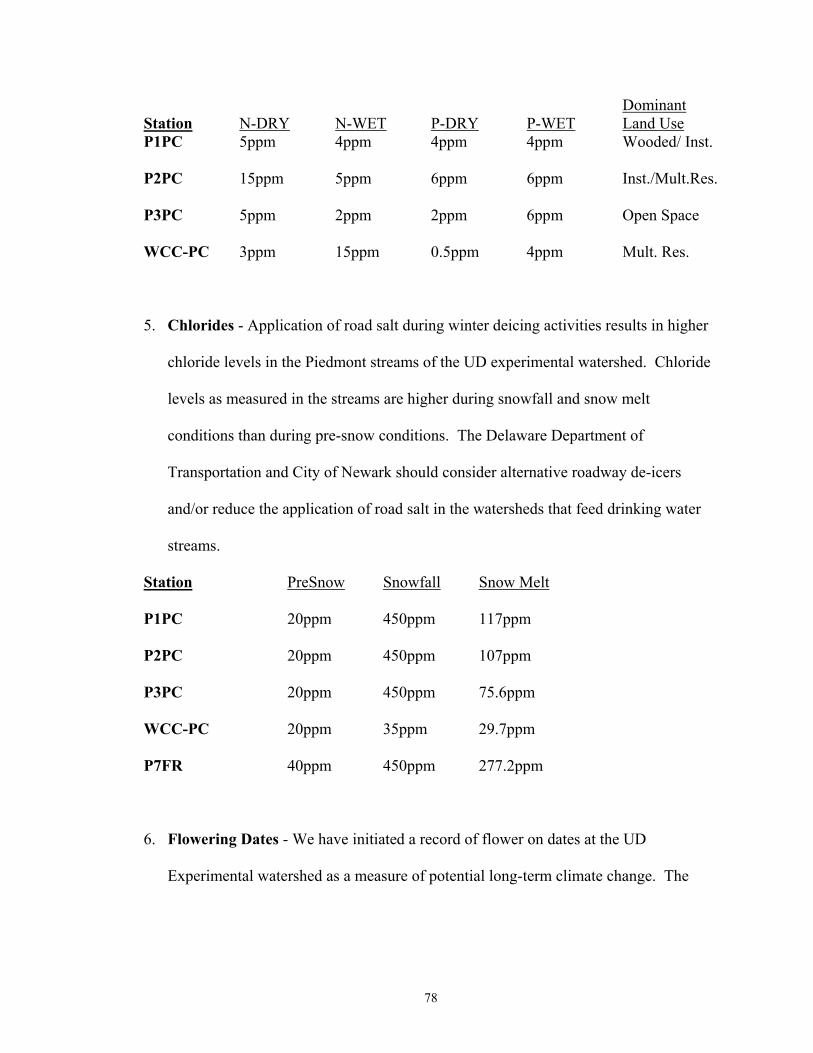
4. Urban Nutrient Surveys- Urban and suburban land uses in the UD Experimental
Watershed emit relatively high levels of Nitrogen and Phosphorus although the level
did not exceed the standard. Nitrogen levels were generally higher for the dry
condition and Phosphorus levels higher for the wet conditions. A lawn care
management program should be considered to work with homeowners to reduce
fertilizer use and minimize runoff of Nitrogen and Phosphorus into the streams.
77
Dominant Station N-DRY N-WET P-DRY P-WET Land Use P1PC 5ppm 4ppm 4ppm 4ppm Wooded/ Inst.
P2PC 15ppm 5ppm 6ppm 6ppm Inst./Mult.Res.
P3PC 5ppm 2ppm 2ppm 6ppm Open Space
WCC-PC 3ppm 15ppm 0.5ppm 4ppm Mult. Res.
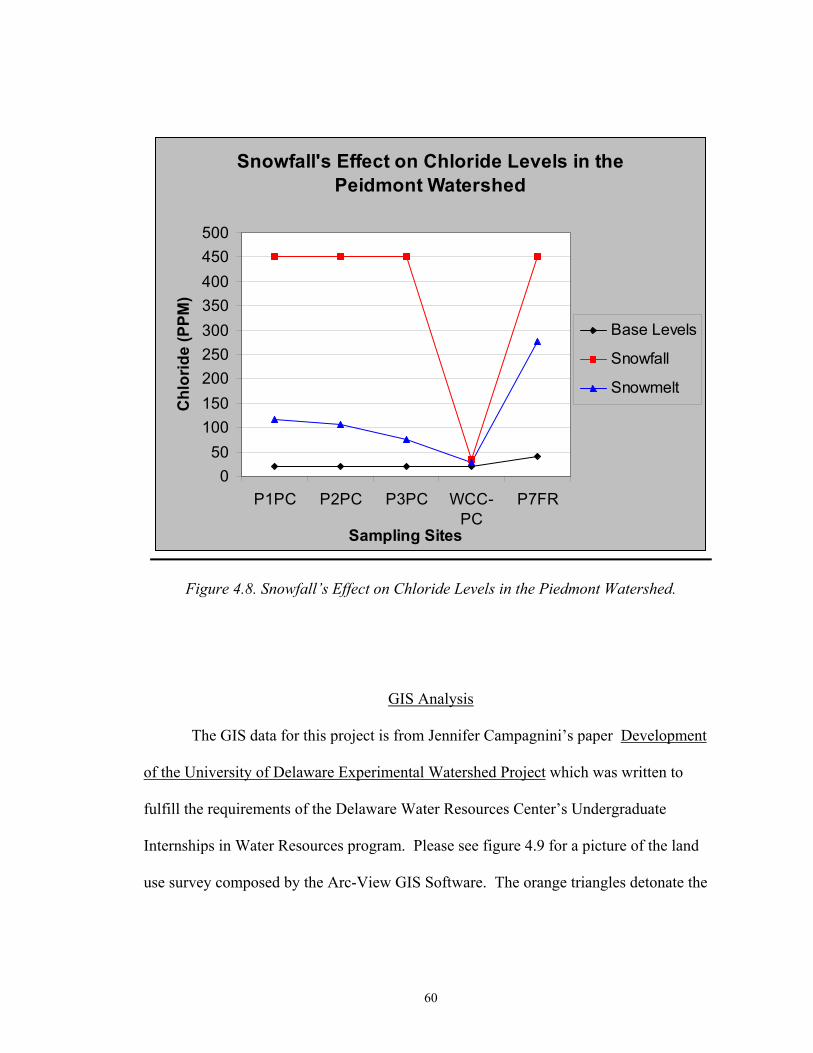
5. Chlorides - Application of road salt during winter deicing activities results in higher
chloride levels in the Piedmont streams of the UD experimental watershed. Chloride
levels as measured in the streams are higher during snowfall and snow melt
conditions than during pre-snow conditions. The Delaware Department of
Transportation and City of Newark should consider alternative roadway de-icers
and/or reduce the application of road salt in the watersheds that feed drinking water
streams.
Station PreSnow Snowfall Snow Melt
P1PC 20ppm 450ppm 117ppm
P2PC 20ppm 450ppm 107ppm
P3PC 20ppm 450ppm 75.6ppm
WCC-PC 20ppm 35ppm 29.7ppm
P7FR 40ppm 450ppm 277.2ppm
6. Flowering Dates - We have initiated a record of flower on dates at the UD
Experimental watershed as a measure of potential long-term climate change. The
78
dates of flower on during 2002 were 2 to 4 weeks earlier than in 2001 possibly due to
the unseasonably warm winter of 2002 and the drought conditions.
Location Flower On 2001 Flower On 2002
Crocuses (Park Place/College Avenue) Feb 27 Feb 21
Crab grass (UDWRA Building) Mar 19 Mar 9
Forsynthia (DGS Building) Apr 3 Mar 5
Cherry Tree (Main St. Parking) Apr 5 Mar 10
Daffodil (DGS Building) Apr 3 Mar 13
Pear Trees (Main St) Apr 10 Mar 26
Azaleas (Academy Street) Apr 10
Dogwood (Penny Hall) Apr 24
Rhododendrum (Allison Hall) May 12
7. Recommendations for the Future -- Though the streams in the Piedmont Watershed
have been named, there are still 4 tributaries of the Cool Run in the Coastal Plain that
have not yet been named. This could provide a method of recognition for the
Experimental Watershed. To expand public outreach, plans are currently underway
with the UD Facilities Management Department to erect signs to educate the faculty,
students, and community about watersheds and implications of land use. The
placement of these signs would be along highly trafficked walkways and roads on the
University Campus. Many stream health experts recommend using biological
79
indicators in stream assessment. These include macro-invertebrates, insect larvae,
amphibians, and fish. The researchers would educate themselves about these topics
and use them as a separate parameter for stream health. Both NZNIWA and USEPA
have programs to incorporate these into a stream health assessment.
Bioassessment Protocols for Use in Streams and Wadeable Rivers, 2nd Edition. USEPA 841-B-99-002, Pp. (2-1) - (6-22).
Biggs, B., Kilroy, C., and Mulcock, C., 2001. New Zealand Stream Health Monitoring and Assessment Kit Stream Monitoring Manual. National Institute of Water and Atmospheric Research (NZ-NIWA), Pp. 1.1-3.11.
Campagnini, J. and Kauffman, G. 2001 Development of the University of Delaware Experimental Watershed Project. University of Delaware, Pp. 1-31.
Campbell, G. and Wildberger, S., 1992. The Monitor’s Handbook. LaMotte Company, Pp. 28-53.
Center for Watershed Protection, 2000. Presentation: “Eight Tools of Watershed Protection” at the Watershed Academy 2000, USEPA, Office of Water. http://www.epa.gov/owow/watershed/wacademy/acad2000/protection.
Kitchell, A.C., 2000. Managing Impervious Surfaces in Coastal Watersheds. University of Delaware, Pp. 26-46.
Reimold, R.J., 1998. Watershed Management: Practice,Policies, and Coordination. Pp.1-9.
US National Park Service, 2000. Wild and Scenic River Designation- White Clay Creek. http://www.nps.gov/rivers/wsr-white-clay.html.
US National Weather Service, 2002. Drought Warning for the State of Delaware.
White Clay Watershed Association,1998, About the Watershed. http://mercury.ccil.org/~wcwa/thewatershed.html