67
Linking Visual Landscape Linking Visual Landscape Inventory Inventory to Forest Landscape to Forest Landscape Planning & Operations Planning & Operations Paul Picard, Paul Picard, MFR MFR
| Date post: | 19-Dec-2015 |
| Category: |
Documents |
| View: | 217 times |
| Download: | 0 times |
Linking Visual Landscape InventoryLinking Visual Landscape Inventoryto Forest Landscape Planning & to Forest Landscape Planning &
OperationsOperations
Paul Picard, MFRPaul Picard, MFR
Lecture outlineLecture outlineOverview of VLI & examples of uses in design
Beyond VLI: rvqc, EVQOs, etc.
How VLI information is accessed online.
Other VLI uses: in Timber Supply Analyses, planning, etc
Visual values monitoring in FRPA: C&E, FPB, Effectiveness Evaluations.
2
VLI - What is it?VLI - What is it?
A
0005
PR
M/H/H/H
3
A
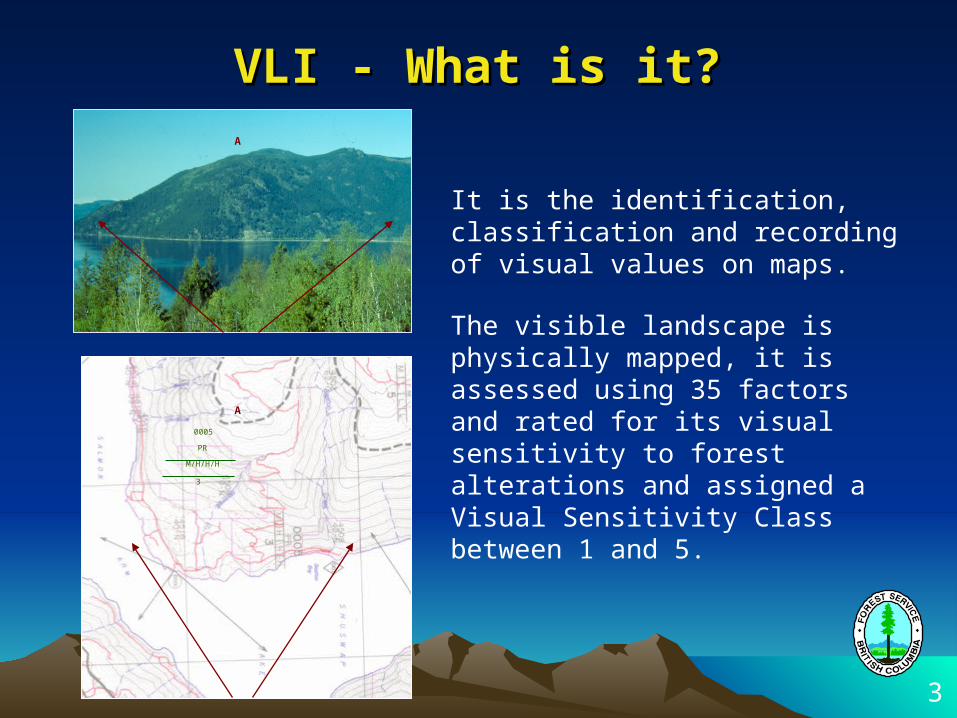
It is the identification, classification and recording of visual values on maps.
The visible landscape is physically mapped, it is assessed using 35 factors and rated for its visual sensitivity to forest alterations and assigned a Visual Sensitivity Class between 1 and 5.
3
1. VLI in Review1. VLI in Review• Mapping is completed from public use areas, communities, roads,
water routes, trails etc.
• Identifies what’s visible and not visible.
• Delineates landscape into Visual Sensitivity Units (VSUs).
• Records particulars of each Visual Sensitivity Unit.
Existing Visual Condition (EVC)
Visual Absorption Capability (VAC)
Biophysical Rating (BR)
Viewing Condition (VC)
Viewer Rating (VR)
• Classifies the VSU into one of five Visual Sensitivity Classes (VSC).
4
Existing Visual Condition (EVC):Existing Visual Condition (EVC):
Identifies the existing level of human made alterations on
the landscape at the time the inventory is conducted.
The terminology used is the same as for VQOs except
that it has one more Class (Excessive Modification).
5
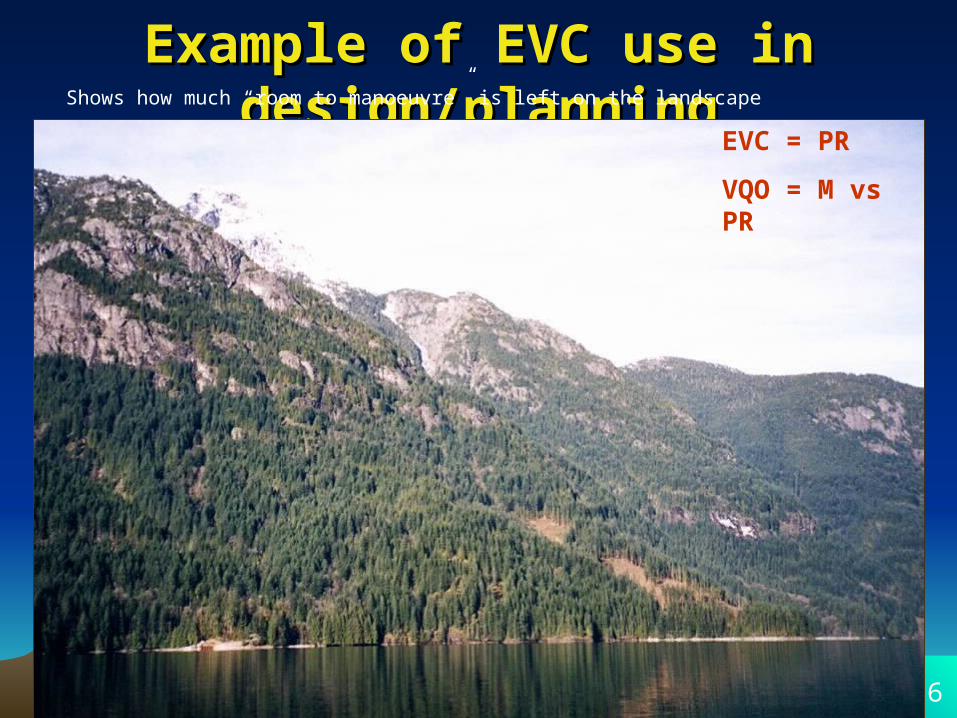
Example of EVC use in design/planningExample of EVC use in design/planningShows how much “room to manoeuvre” is left on the landscape
6
EVC = PR
VQO = M vs PR
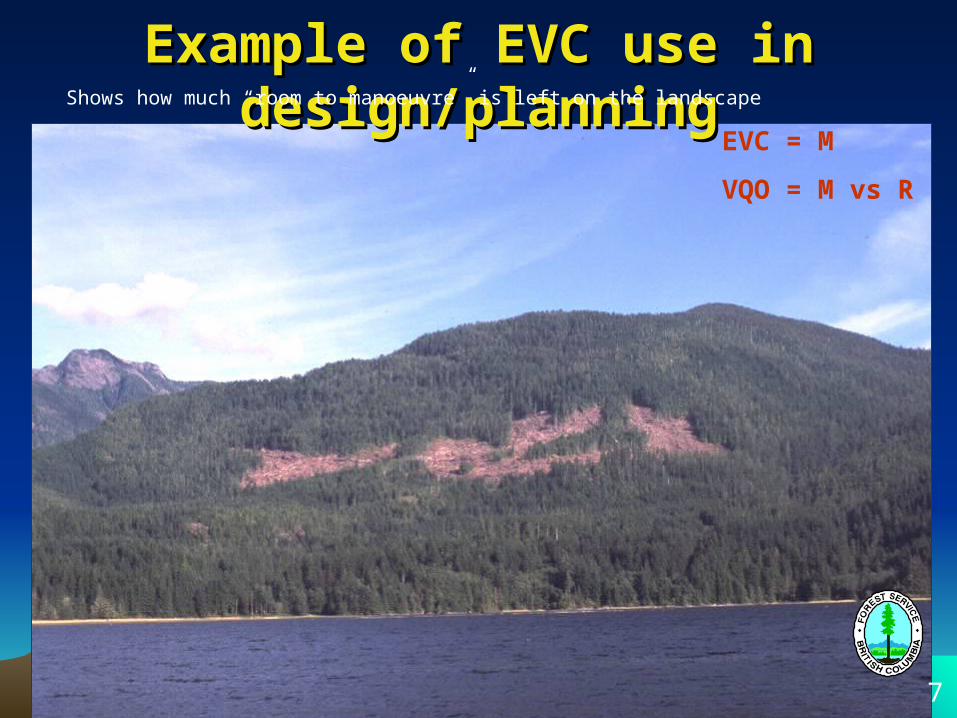
Example of EVC use in design/planningExample of EVC use in design/planningShows how much “room to manoeuvre” is left on the landscape
7
EVC = M
VQO = M vs R
Visual Absorption Capability (VAC):Visual Absorption Capability (VAC):
Rates the relative capacity of the landscape to absorb
human made alterations and still maintain some visual
integrity. The scale is high, medium, low. The higher the
rating the more ability to absorb alteration.
8
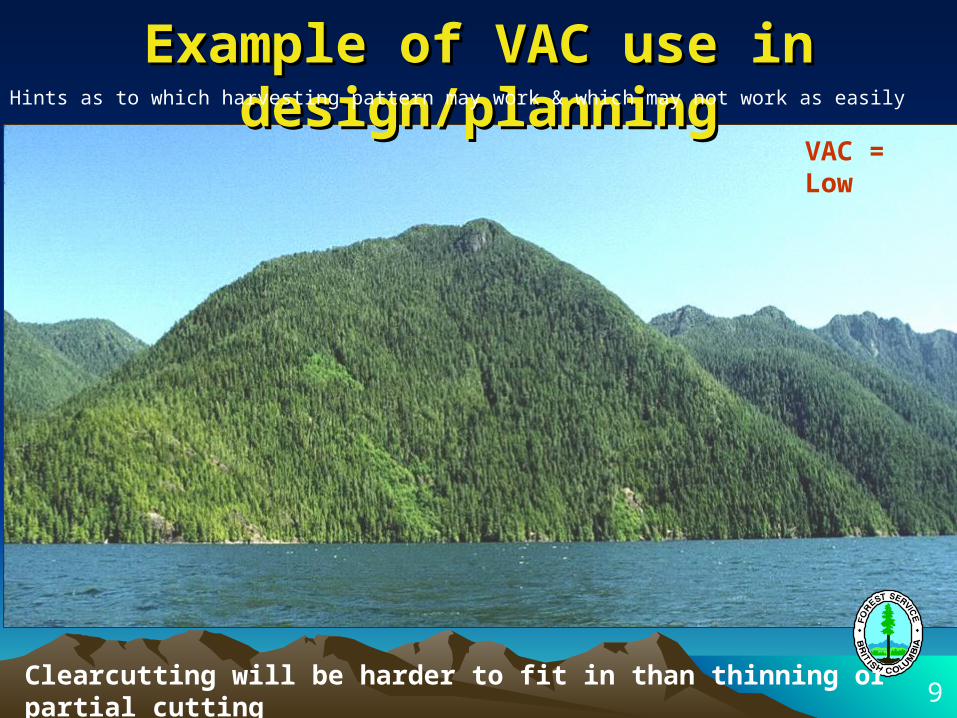
Example of VAC use in design/planningExample of VAC use in design/planningHints as to which harvesting pattern may work & which may not work as easily
9
VAC = Low
Clearcutting will be harder to fit in than thinning or partial cutting
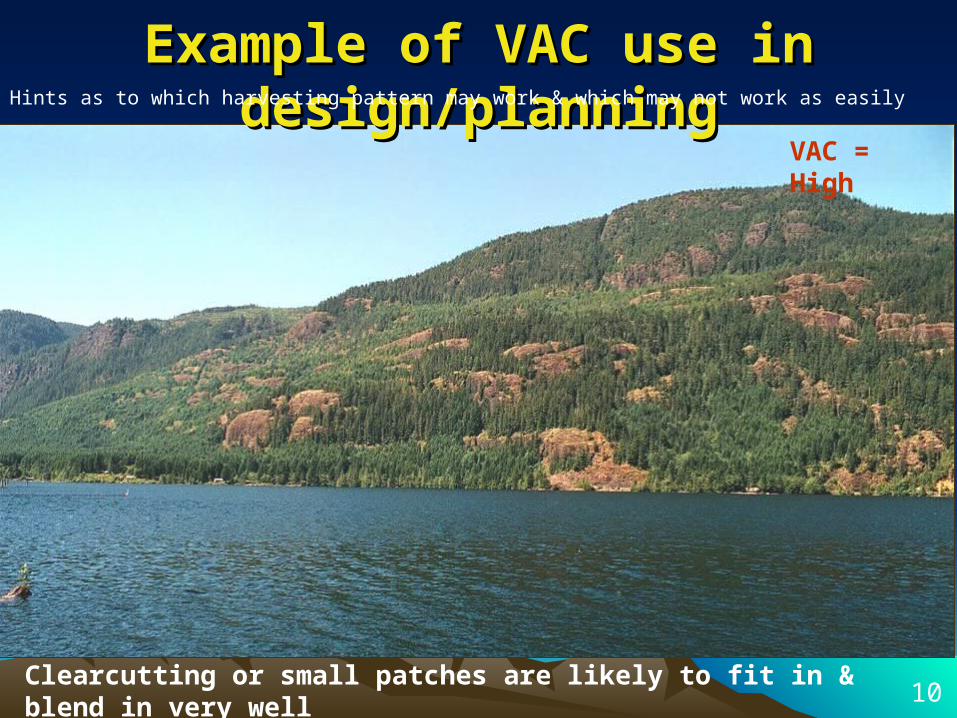
Example of VAC use in design/planningExample of VAC use in design/planningHints as to which harvesting pattern may work & which may not work as easily
10
VAC = High
Clearcutting or small patches are likely to fit in & blend in very well
Biophysical Rating (BR):Biophysical Rating (BR):
Identifies the degree of visual interest in the landscape and
rates the level that it would attract viewer attention. The
scale is high, medium low. The higher the attraction, the
more sensitive it is.
11
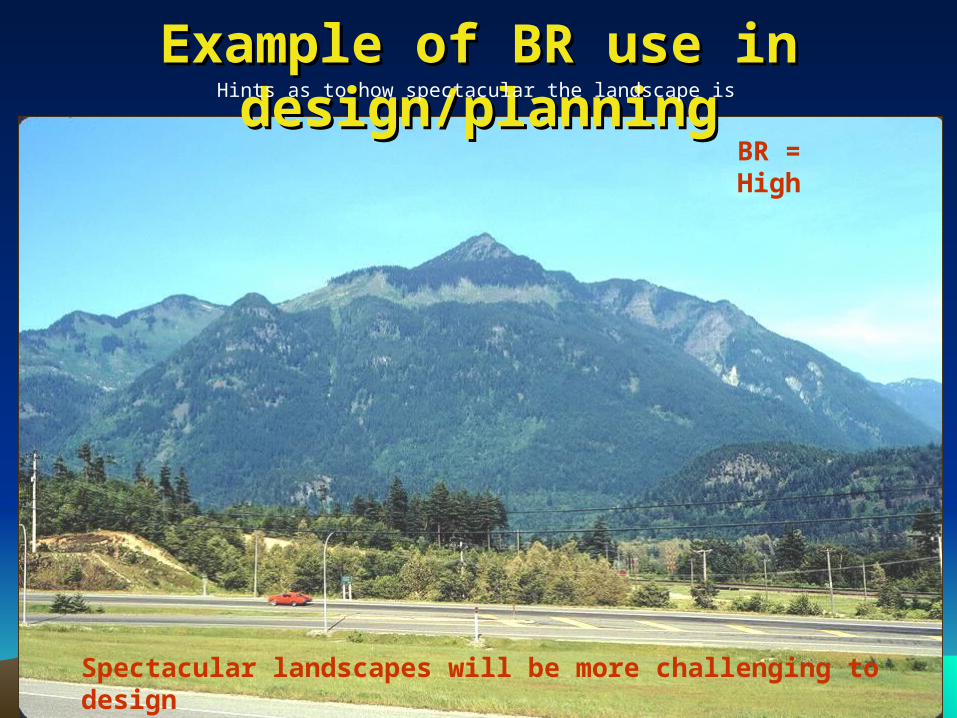
Example of BR use in design/planningExample of BR use in design/planningHints as to how spectacular the landscape is
BR = High
Spectacular landscapes will be more challenging to design
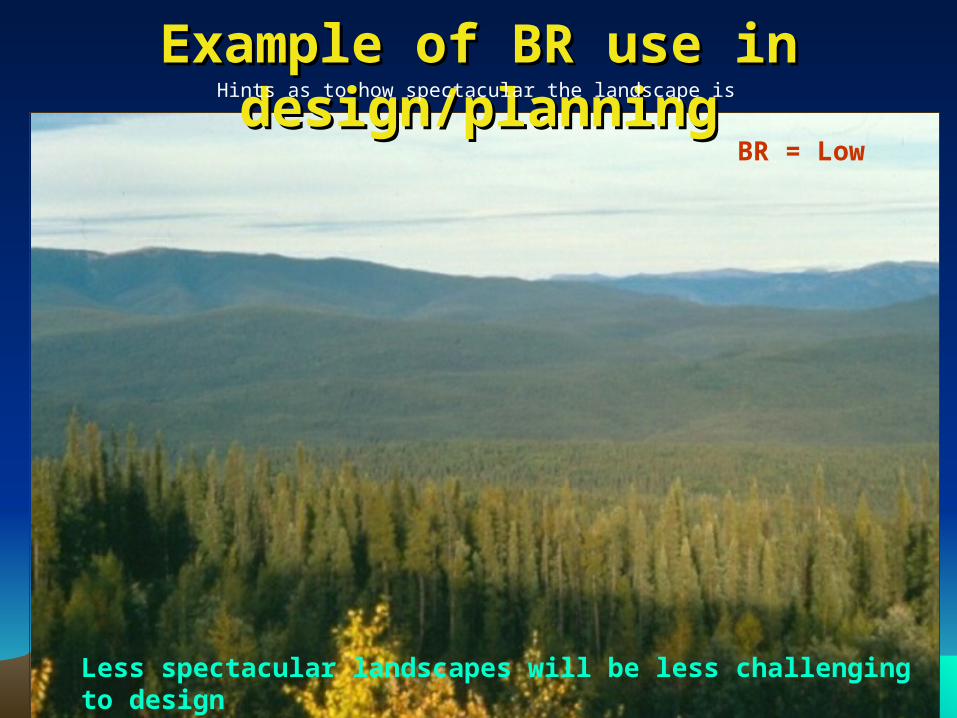
Example of BR use in design/planningExample of BR use in design/planningHints as to how spectacular the landscape is
BR = Low
Less spectacular landscapes will be less challenging to design
Viewing Condition (VC):Viewing Condition (VC):Records the conditions under which the landscape is
viewed such as viewing duration and number of viewpoints.
The scale is high, medium & low. The higher the rating the
more you see the landscape and the more sensitive it is.
14
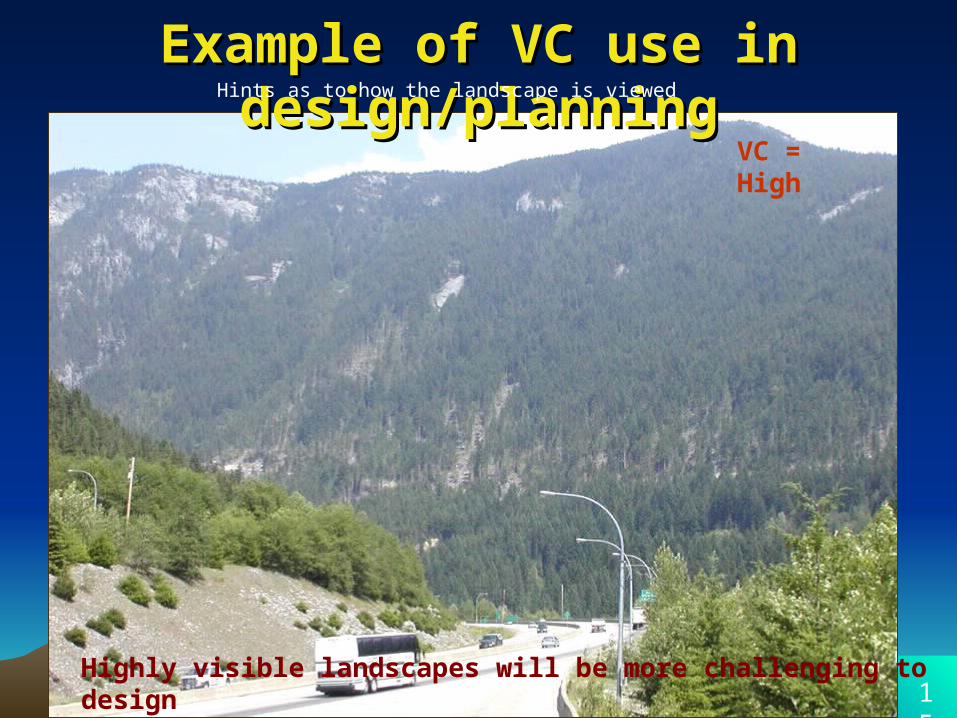
Example of VC use in design/planningExample of VC use in design/planningHints as to how the landscape is viewed
15
VC = High
Highly visible landscapes will be more challenging to design
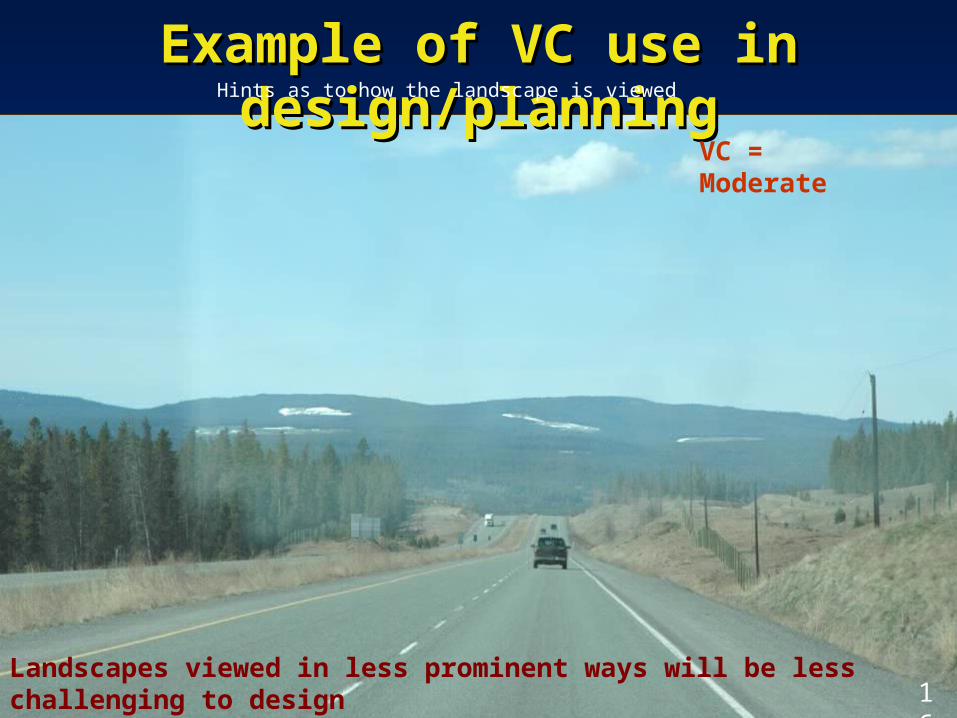
Example of VC use in design/planningExample of VC use in design/planningHints as to how the landscape is viewed
16
VC = Moderate
Landscapes viewed in less prominent ways will be less challenging to design
Viewer Rating (VR):Viewer Rating (VR):Measures the number of people and their expectations
for visual quality. Ratings are high, medium & low. The
higher the rating the more people view the landscape
and/or are more concerned.
17
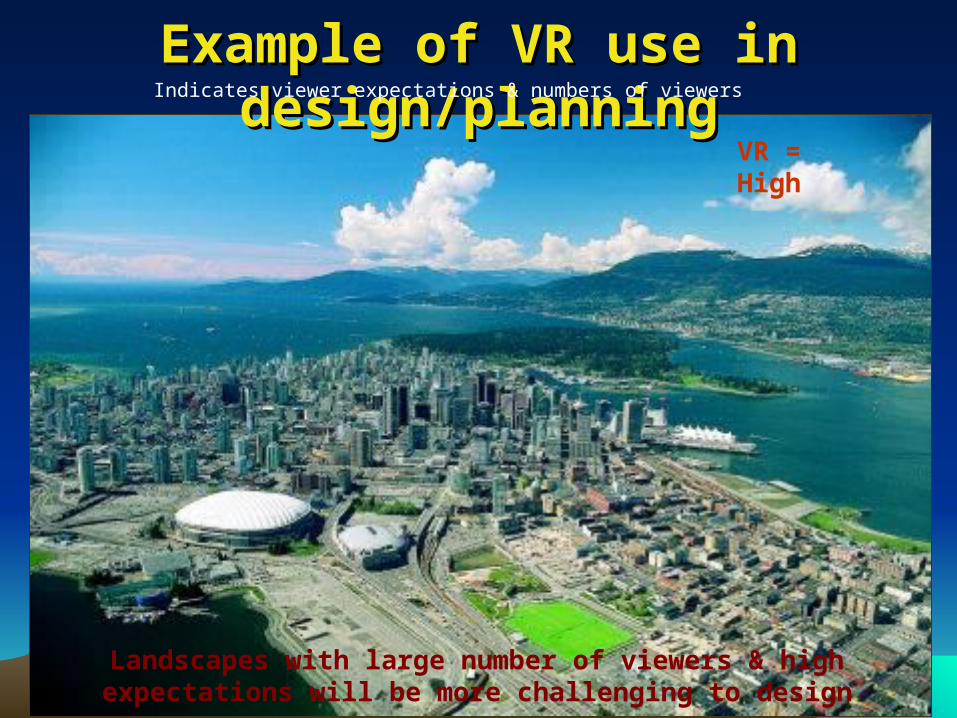
Example of VR use in design/planningExample of VR use in design/planningIndicates viewer expectations & numbers of viewers
VR = High
Landscapes with large number of viewers & high expectations will be more challenging to design
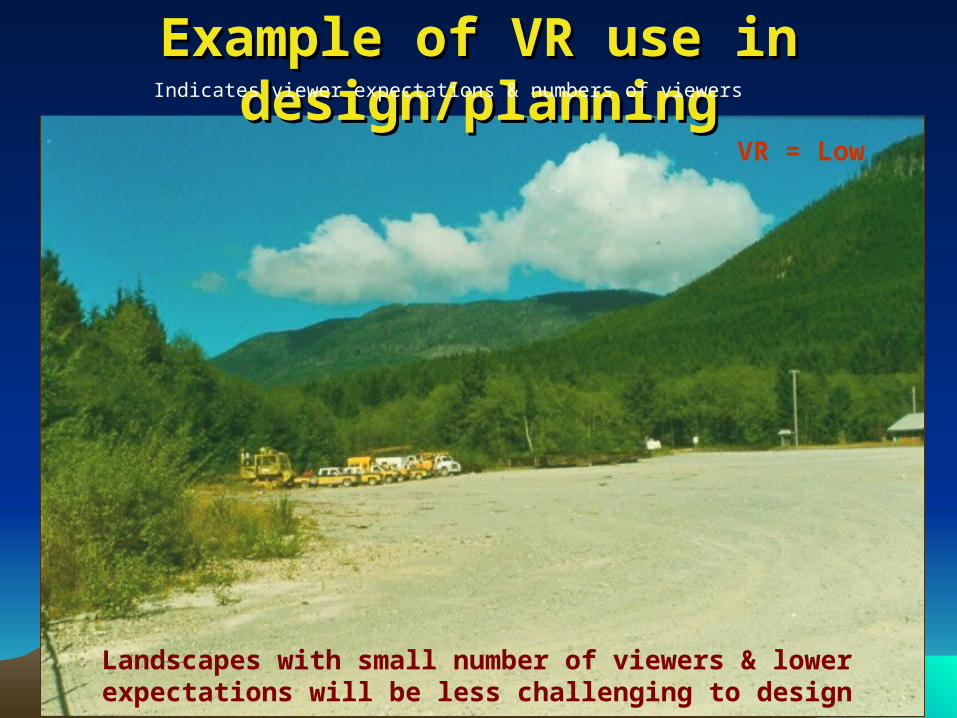
Example of VR use in design/planningExample of VR use in design/planning
VR = Low
Landscapes with small number of viewers & lower expectations will be less challenging to design
Indicates viewer expectations & numbers of viewers
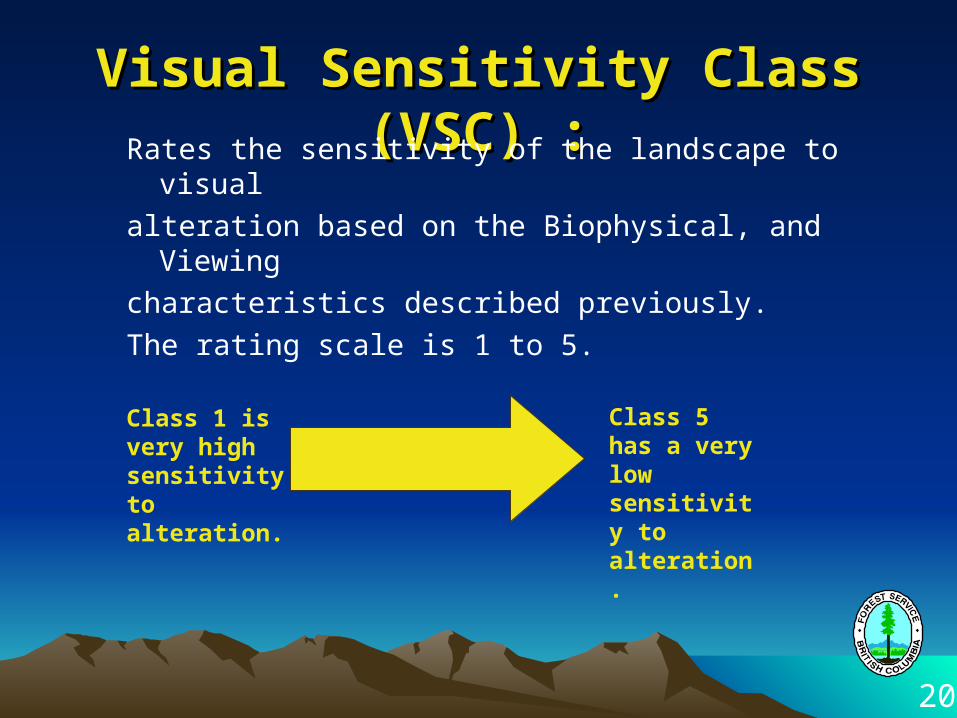
Visual Sensitivity Class (VSC) :Visual Sensitivity Class (VSC) :
Rates the sensitivity of the landscape to visual
alteration based on the Biophysical, and Viewing
characteristics described previously.
The rating scale is 1 to 5.
Class 5 has a very low sensitivity to alteration.
Class 1 is very high sensitivity to alteration.
20
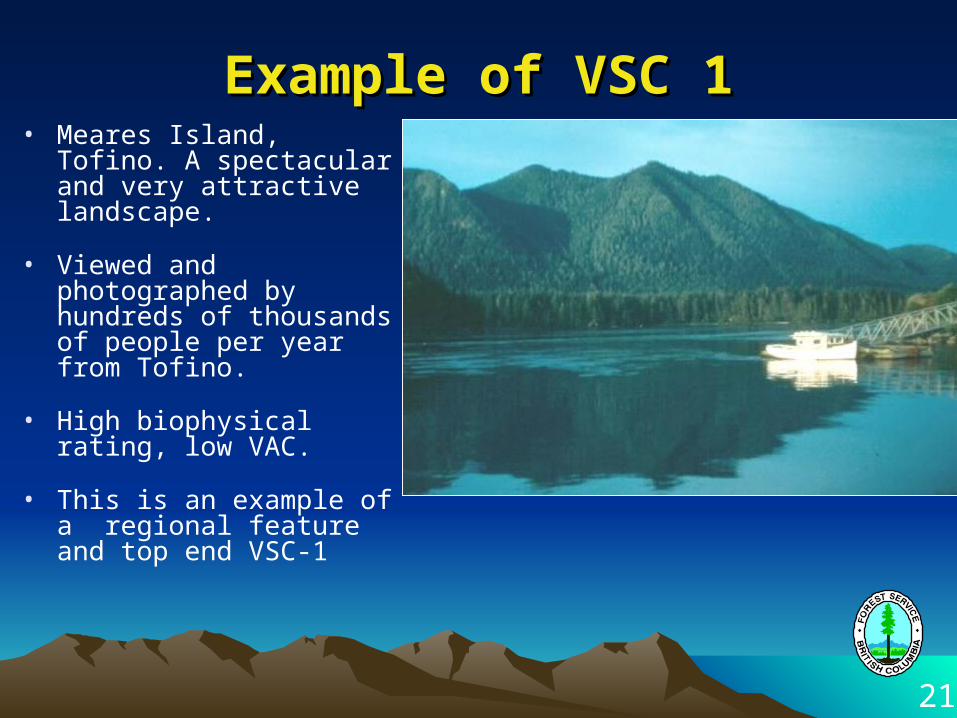
Example of VSC 1Example of VSC 1• Meares Island, Tofino. A
spectacular and very attractive landscape.
• Viewed and photographed by hundreds of thousands of people per year from Tofino.
• High biophysical rating, low VAC.
• This is an example of a regional feature and top end VSC-1
21
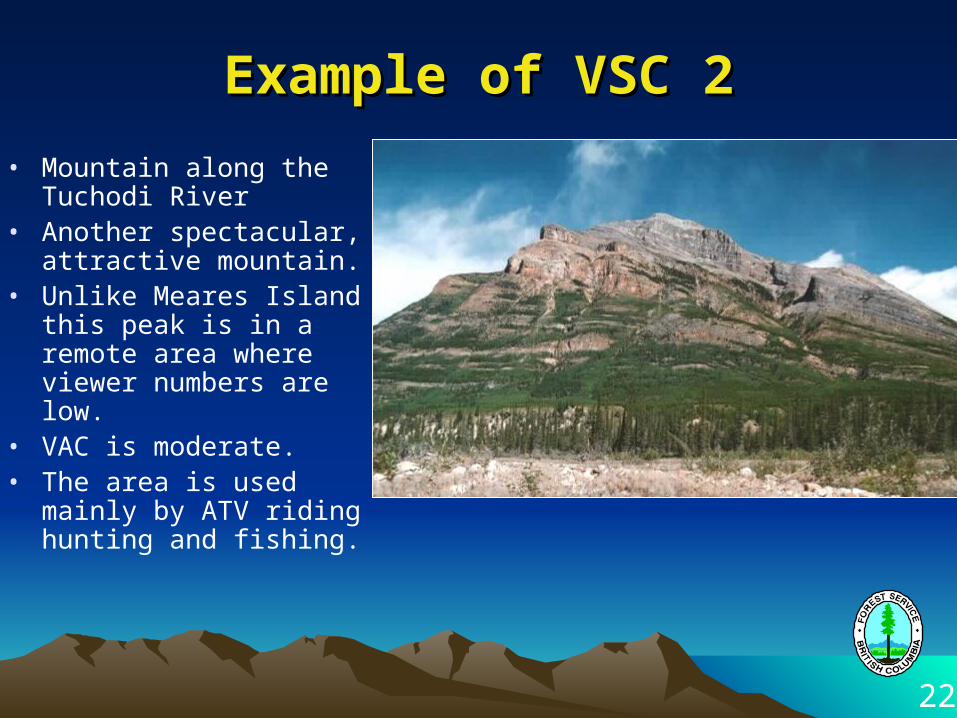
Example of VSC 2Example of VSC 2
• Mountain along the Tuchodi River
• Another spectacular, attractive mountain.
• Unlike Meares Island this peak is in a remote area where viewer numbers are low.
• VAC is moderate. • The area is used mainly by
ATV riding hunting and fishing.
22
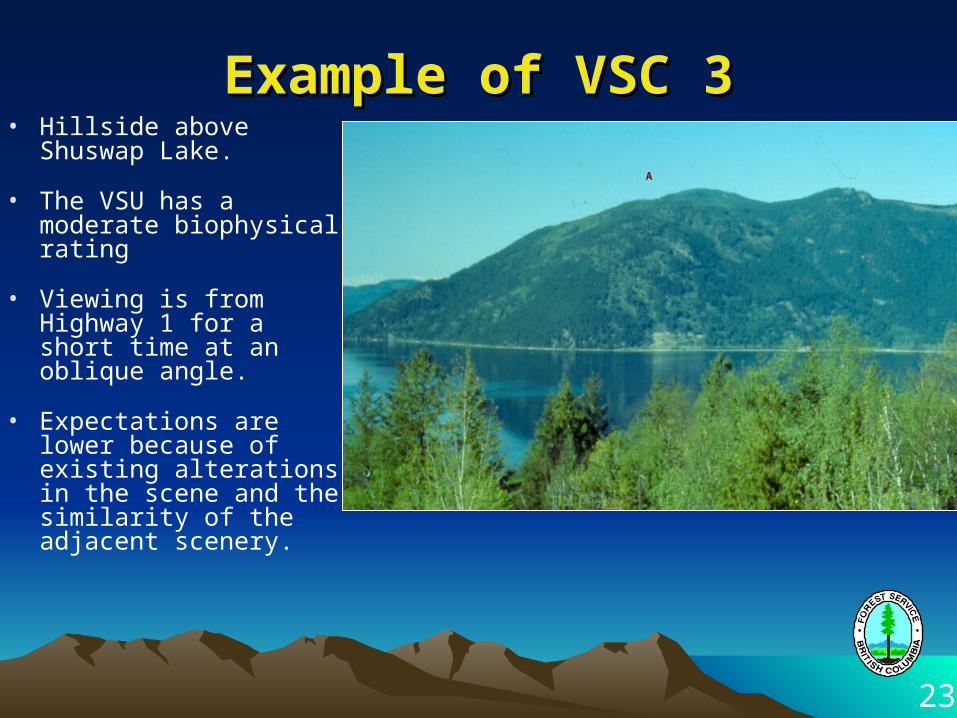
Example of VSC 3Example of VSC 3• Hillside above Shuswap
Lake.
• The VSU has a moderate biophysical rating
• Viewing is from Highway 1 for a short time at an oblique angle.
• Expectations are lower because of existing alterations in the scene and the similarity of the adjacent scenery.
A
23
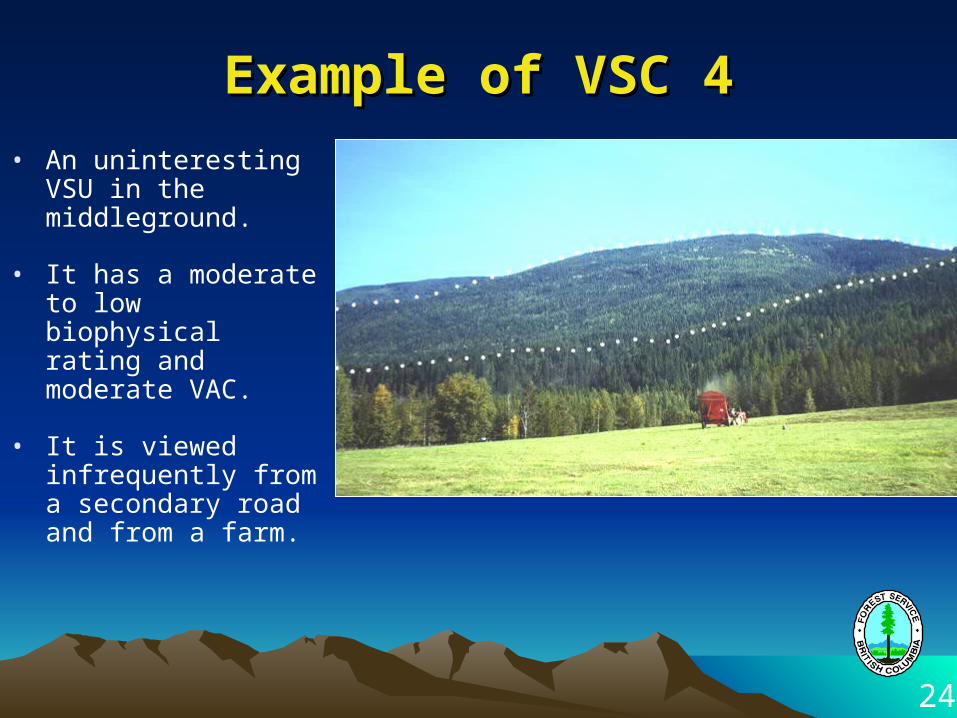
Example of VSC 4Example of VSC 4
• An uninteresting VSU in the middleground.
• It has a moderate to low biophysical rating and moderate VAC.
• It is viewed infrequently from a secondary road and from a farm.
24
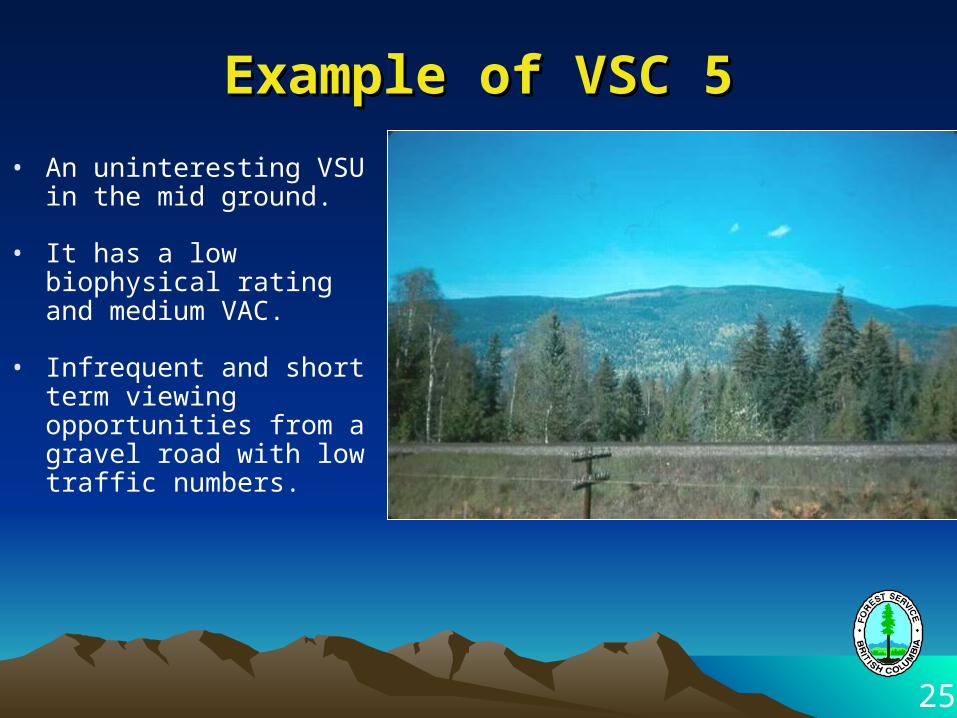
Example of VSC 5Example of VSC 5
• An uninteresting VSU in the mid ground.
• It has a low biophysical rating and medium VAC.
• Infrequent and short term viewing opportunities from a gravel road with low traffic numbers.
25
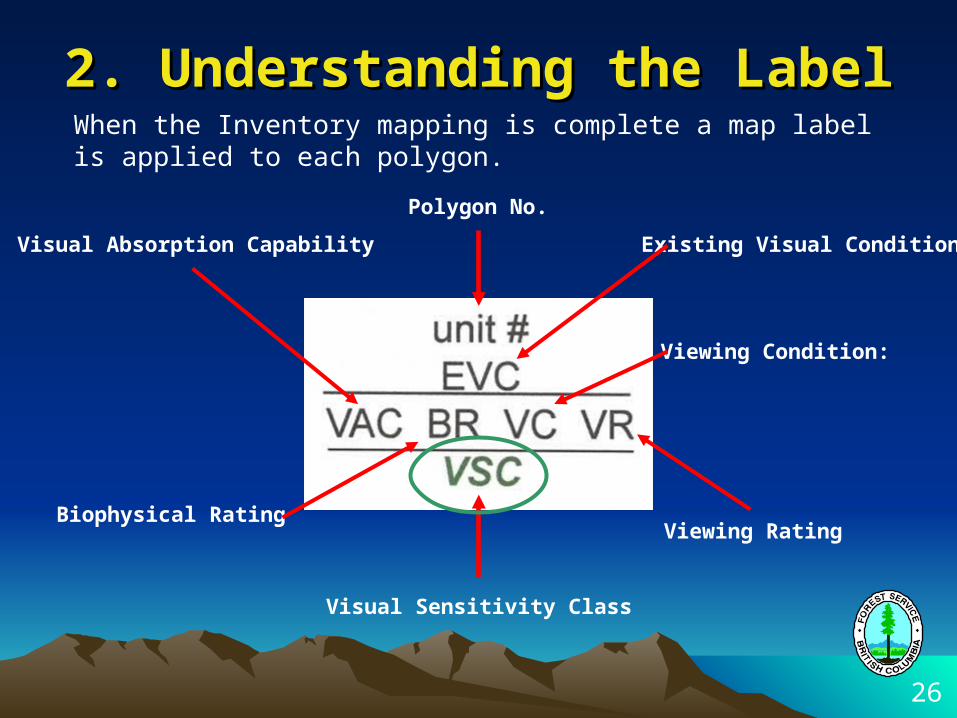
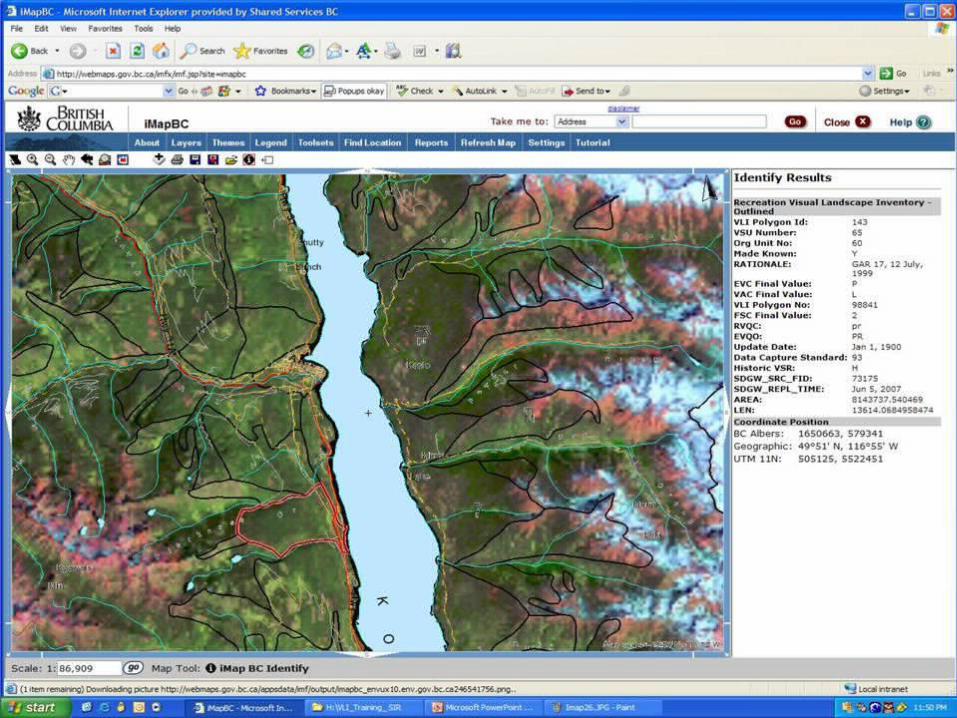
2. Understanding the Label2. Understanding the Label
Polygon No.
Existing Visual Condition
Biophysical Rating
Viewing Condition:
Visual Absorption Capability
Viewing Rating
Visual Sensitivity Class
When the Inventory mapping is complete a map label is applied to each polygon.
26
Beyond VLI: rvqcBeyond VLI: rvqc
28
In VLI, the VSC is expressed as a rvqc, which is then taken into consideration in the establishement of scenic areas & VQOs.
Management decisions (scenic areas & VQOs are also stored within the VLI database available online
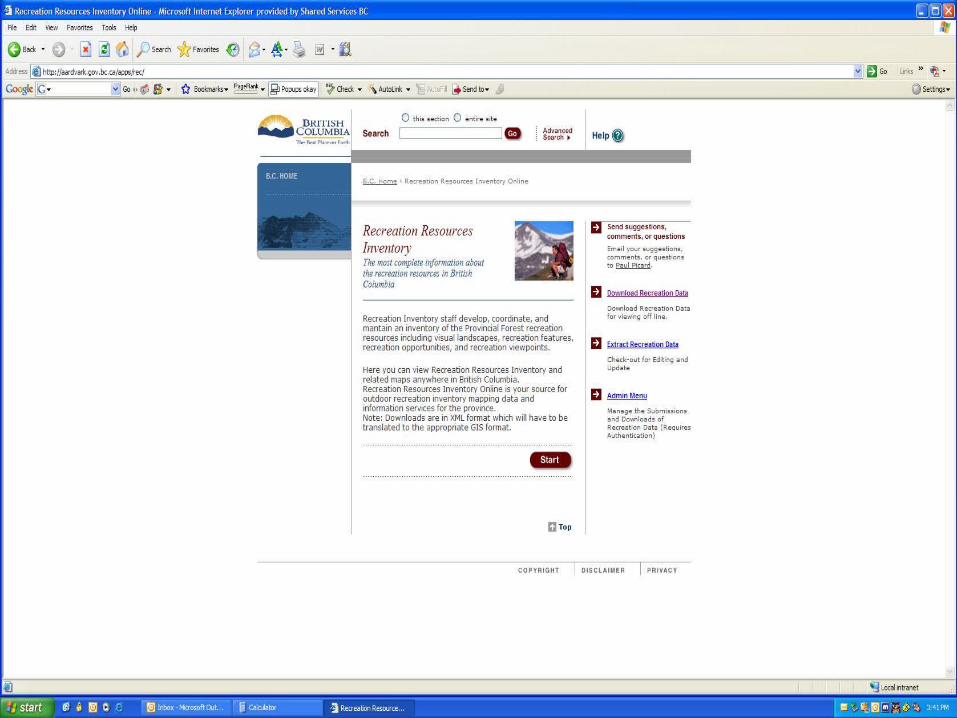
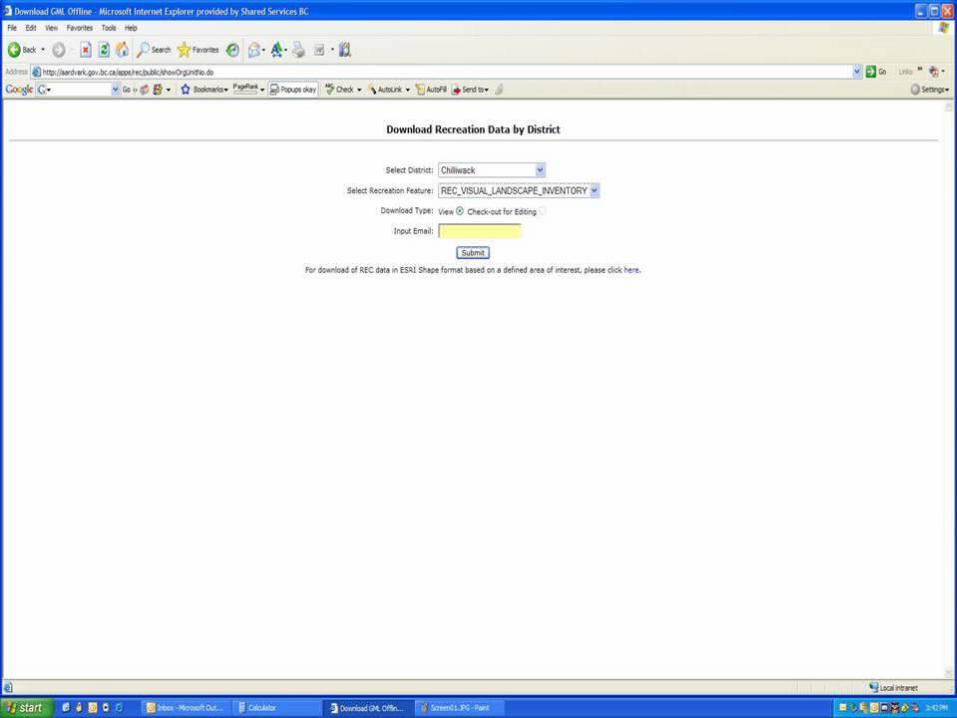
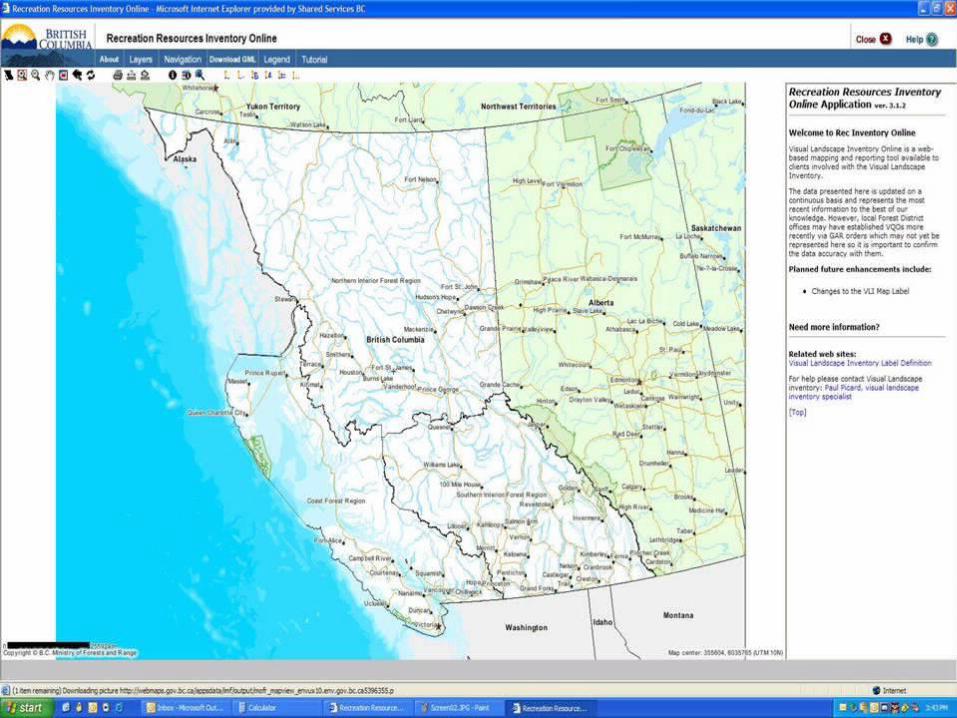
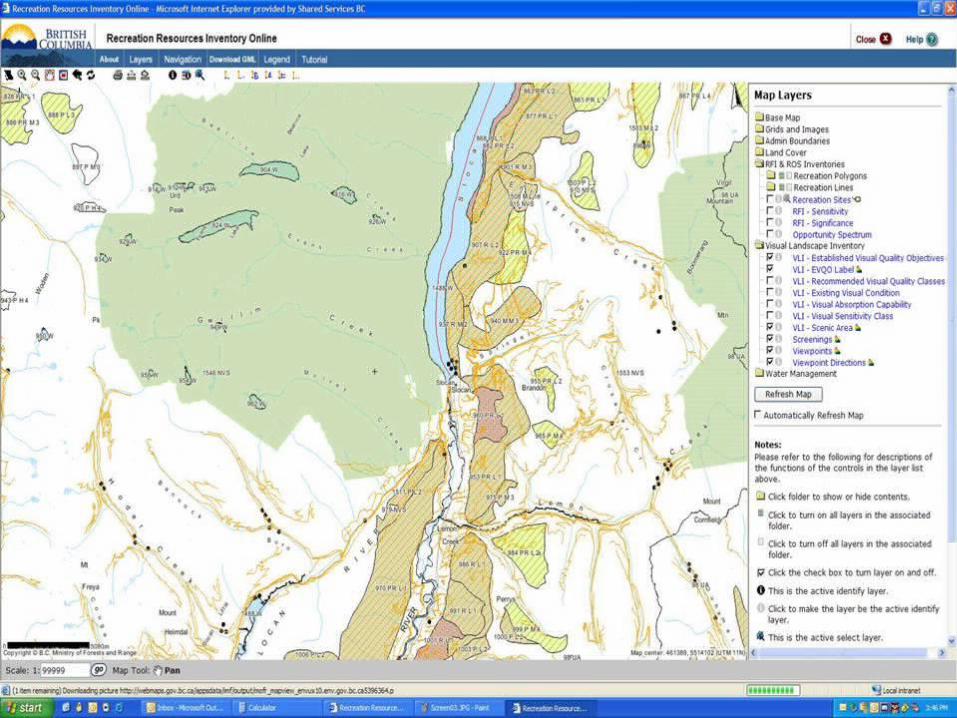
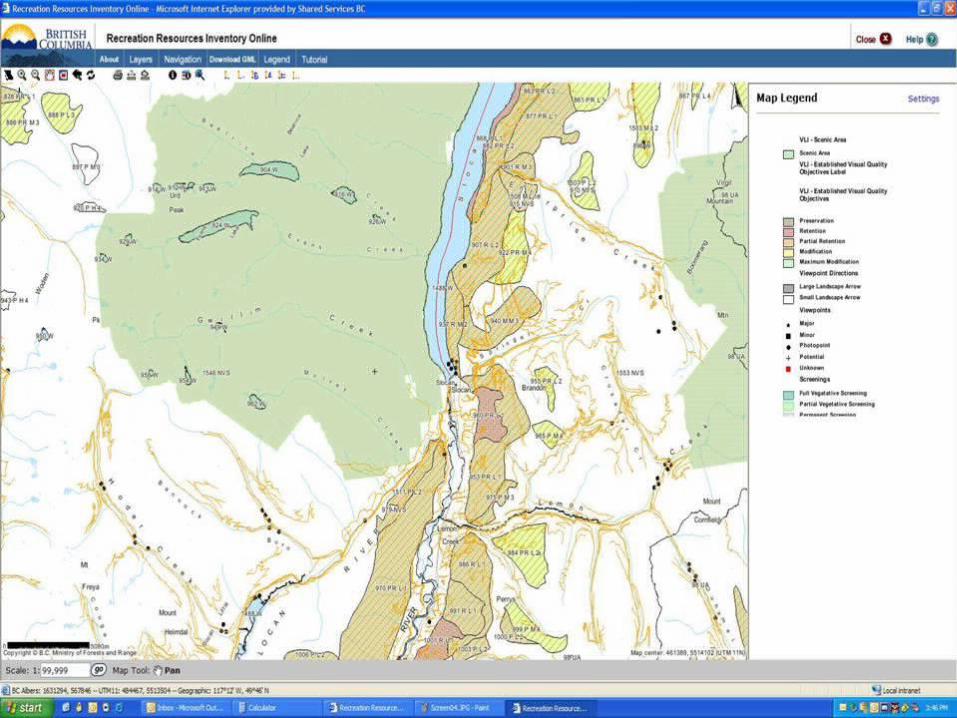
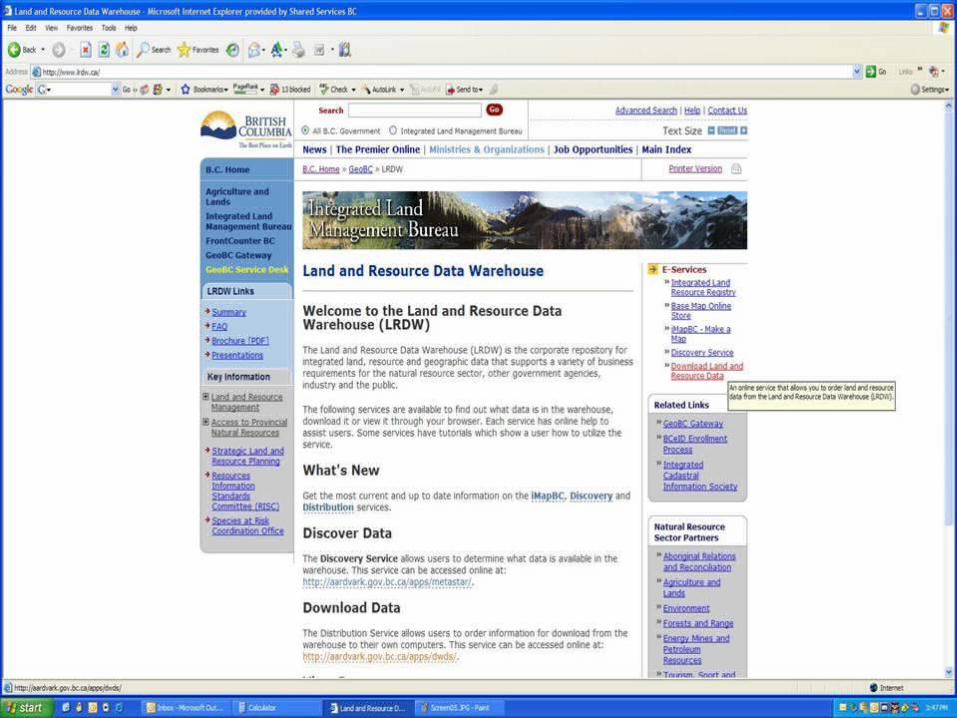
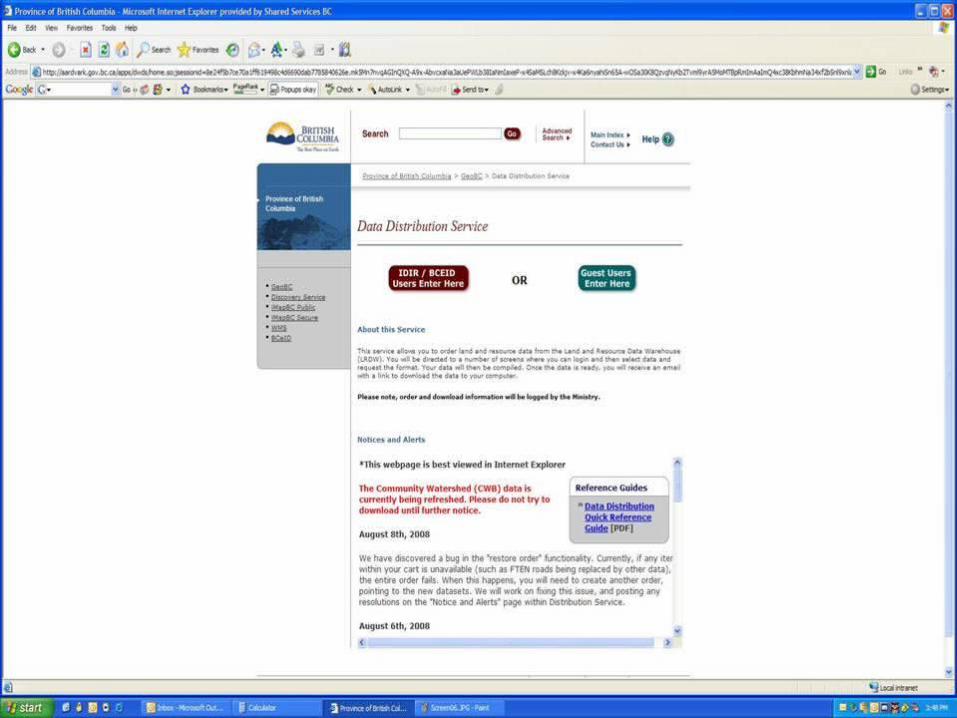
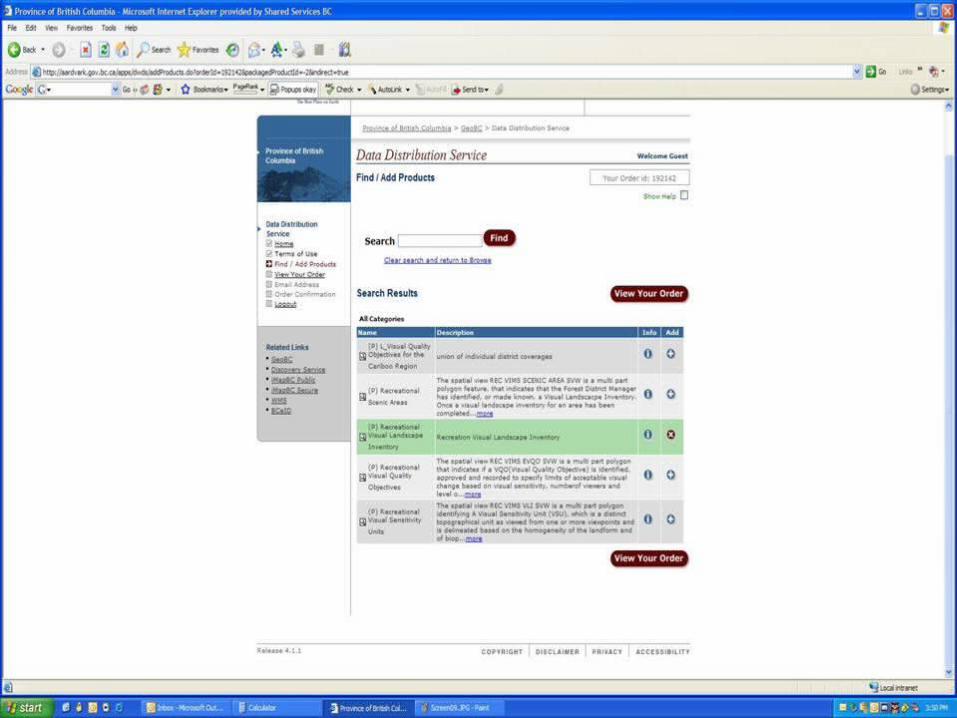
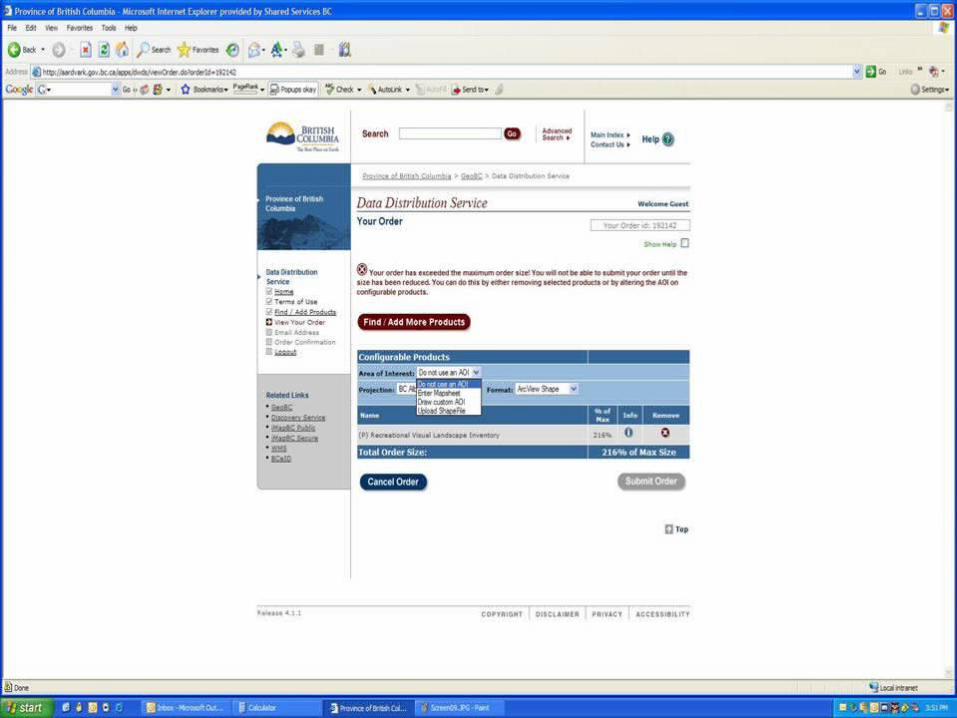
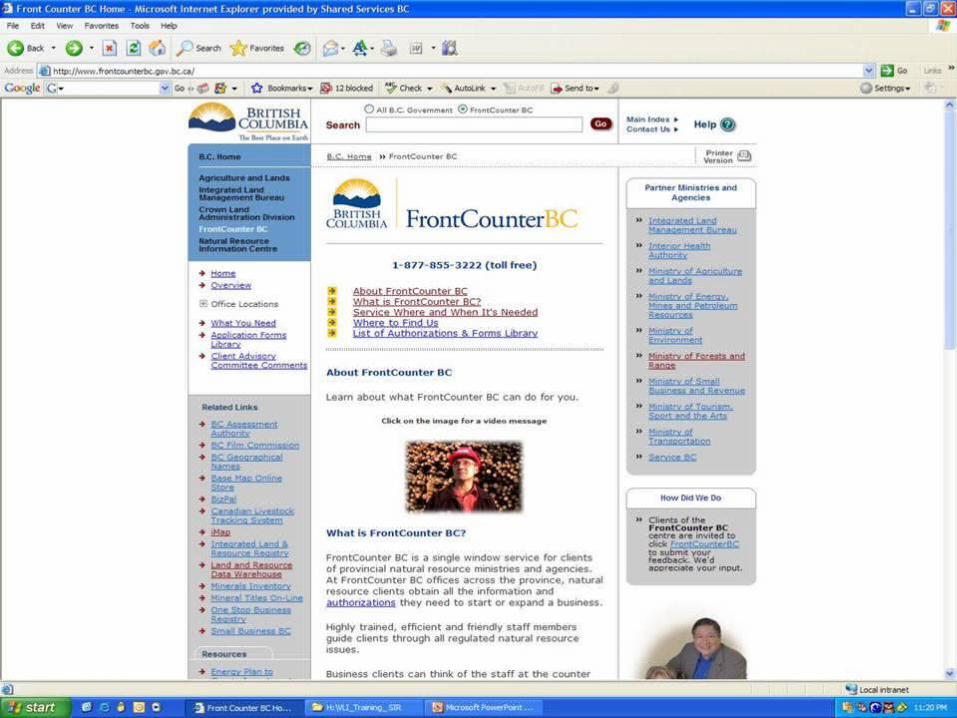
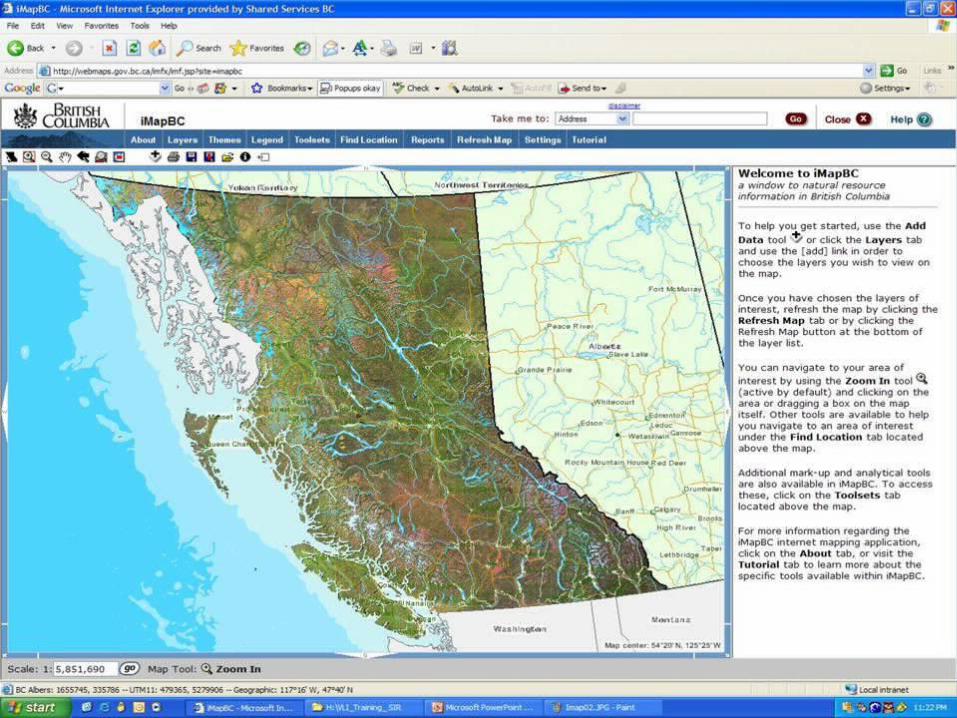
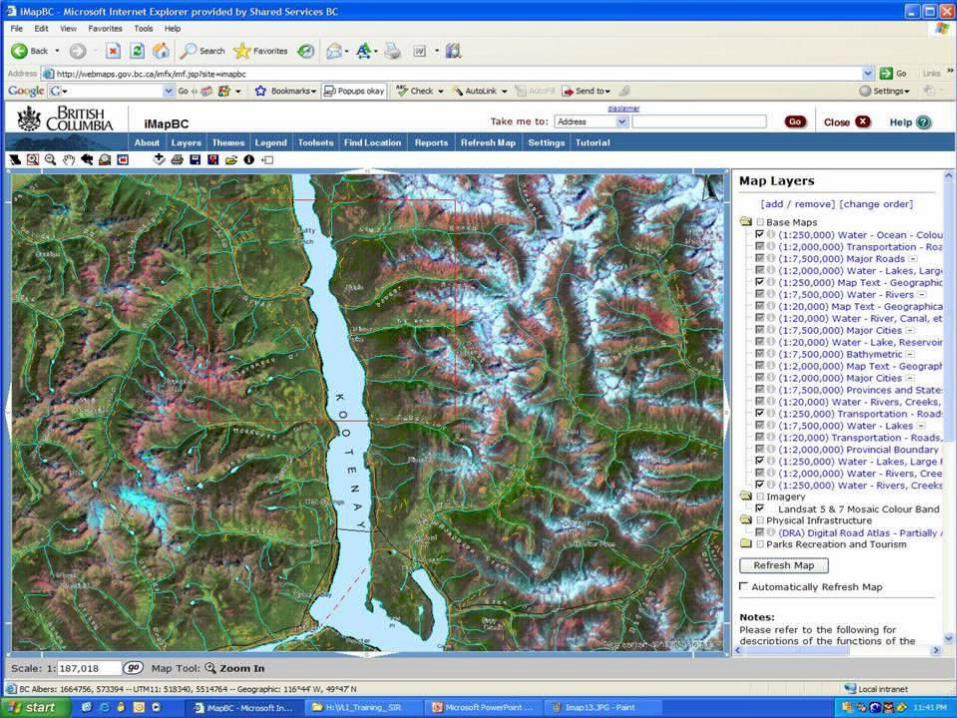
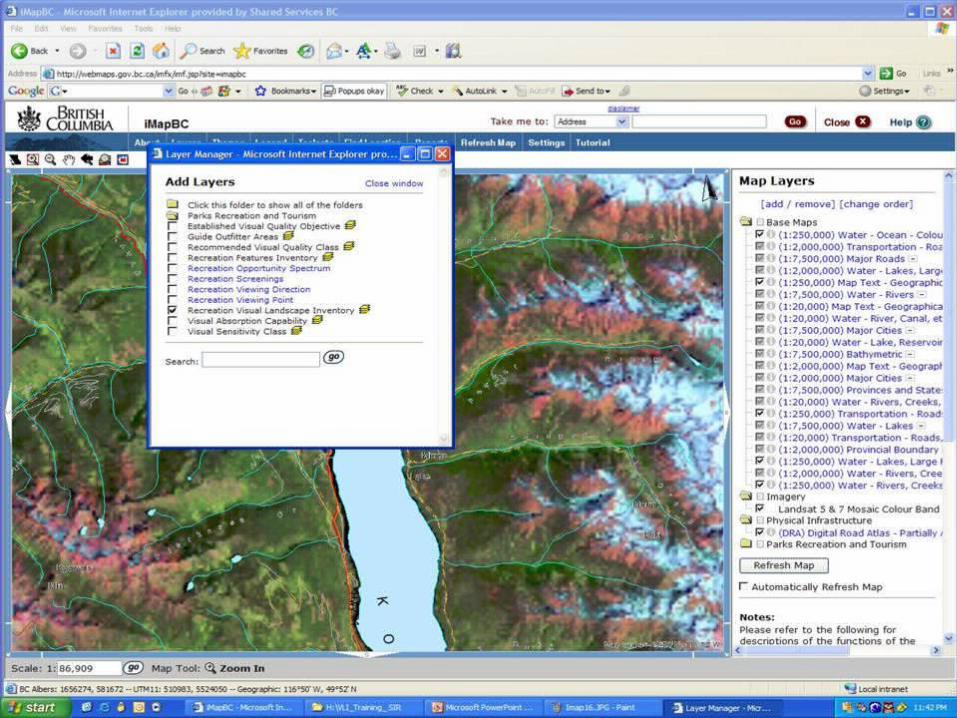
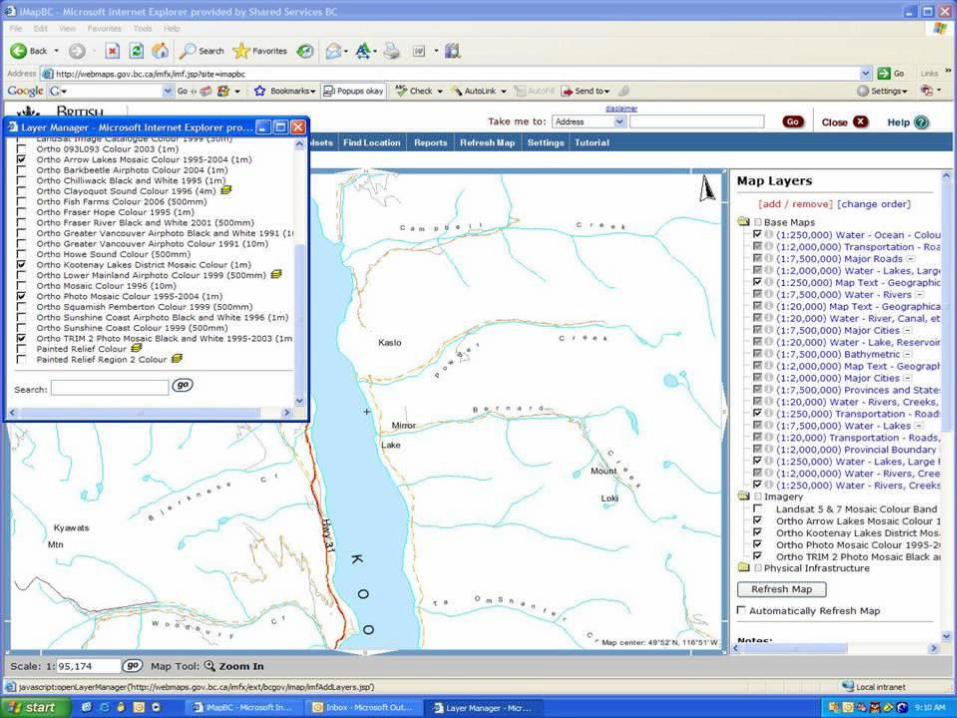
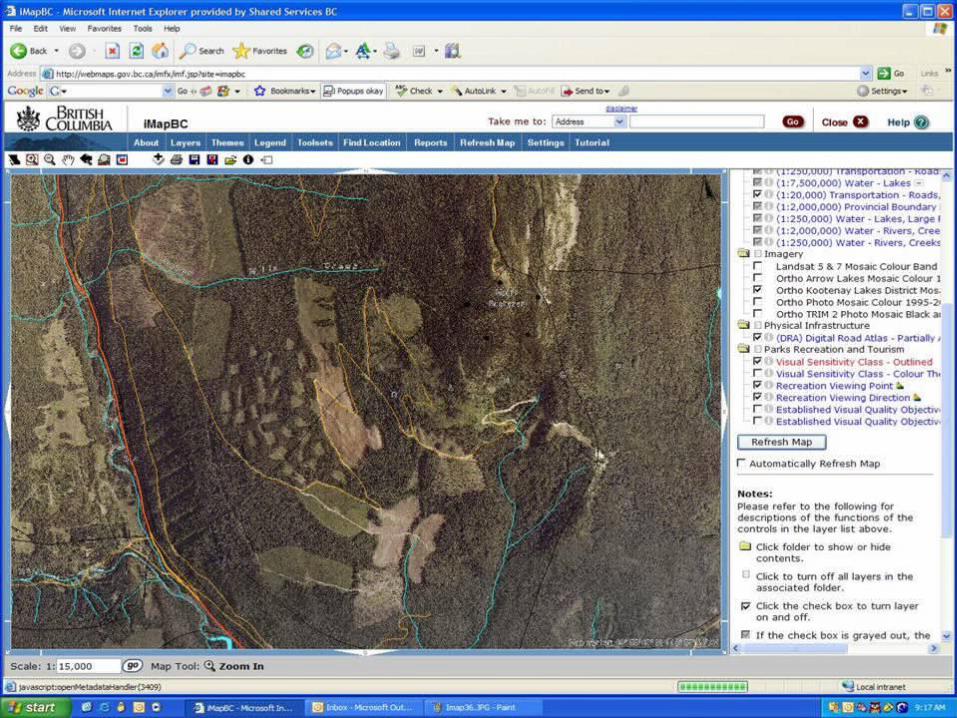
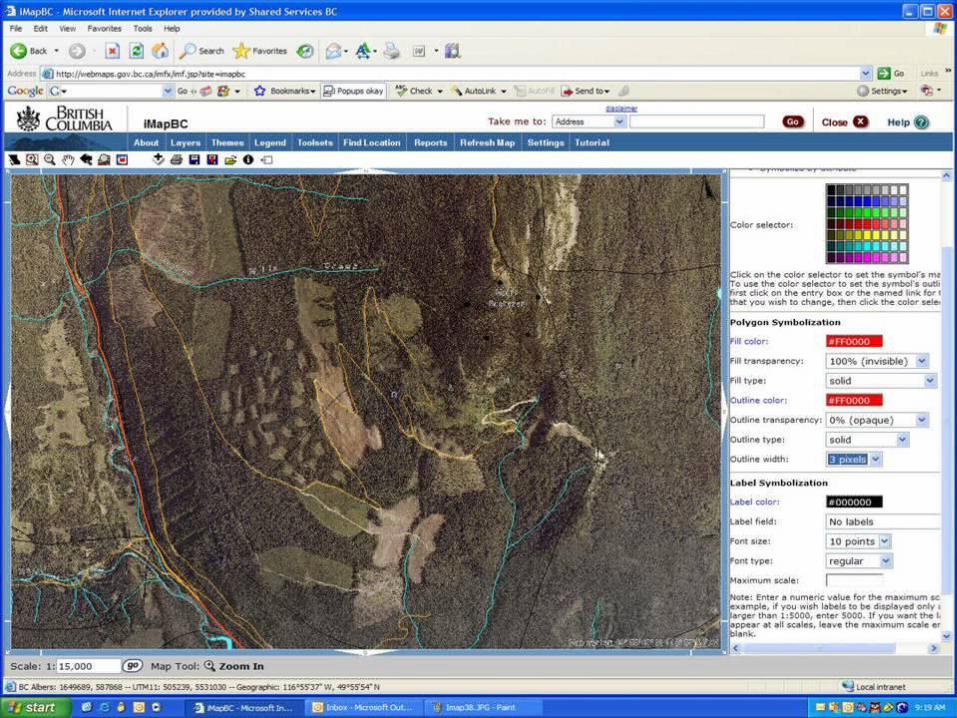
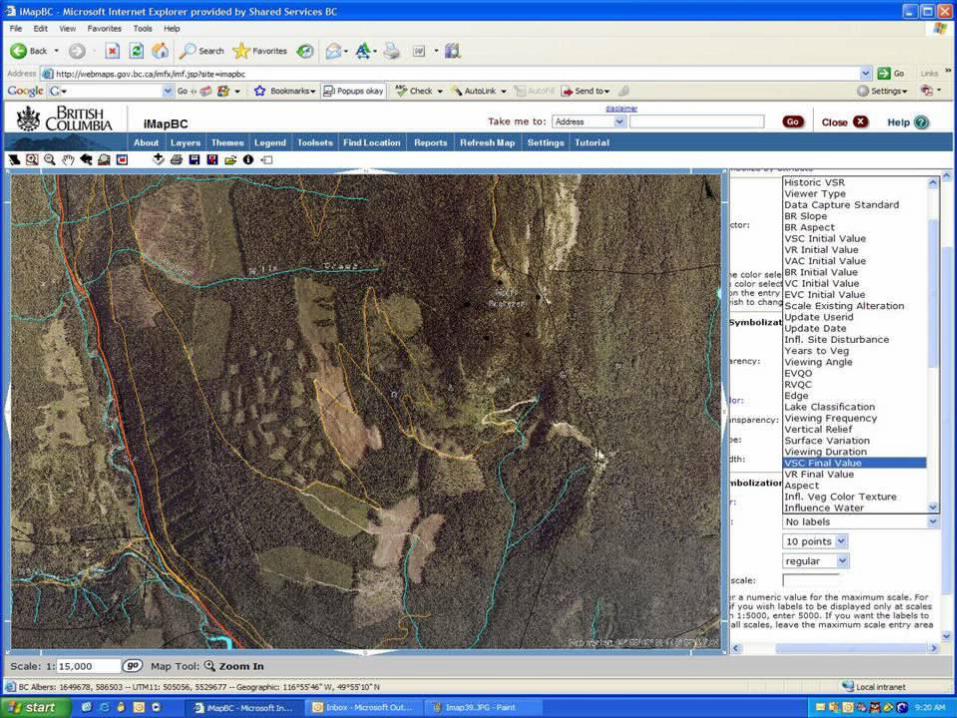
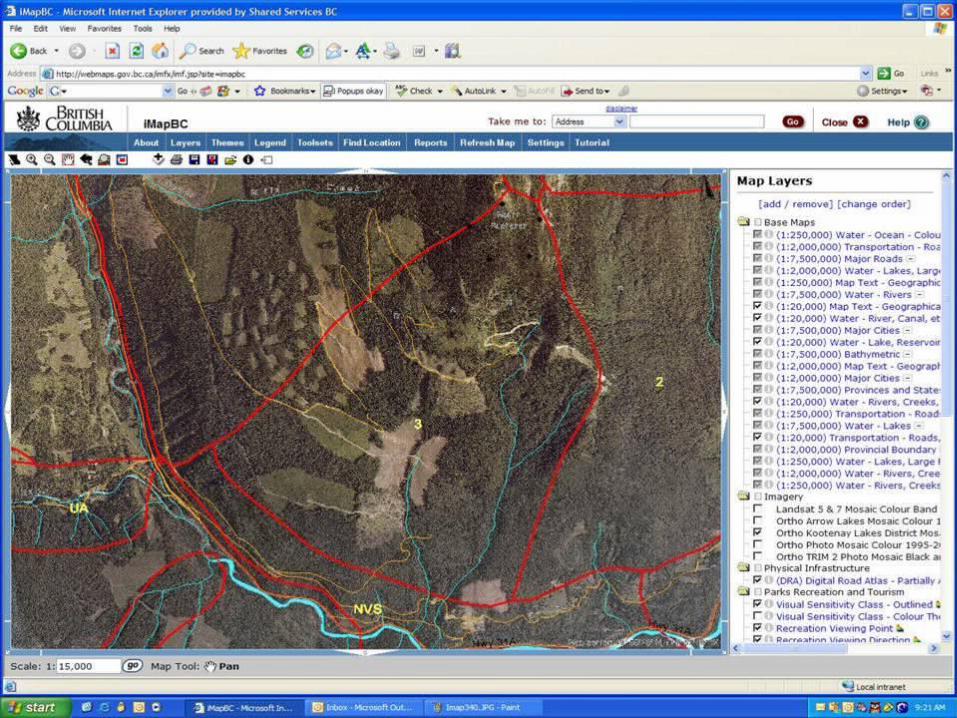
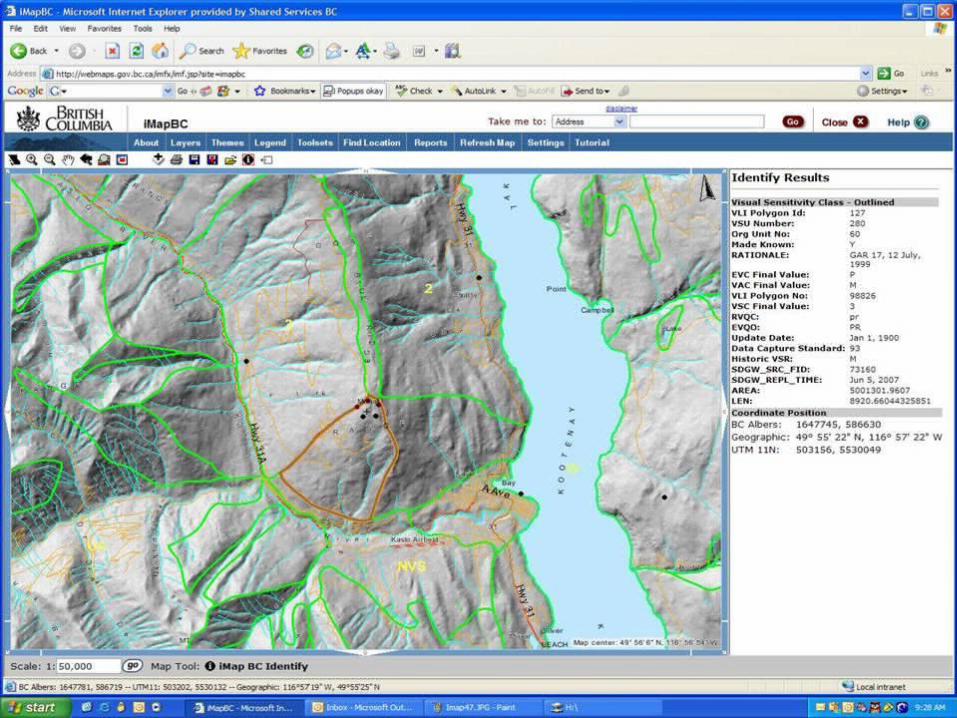
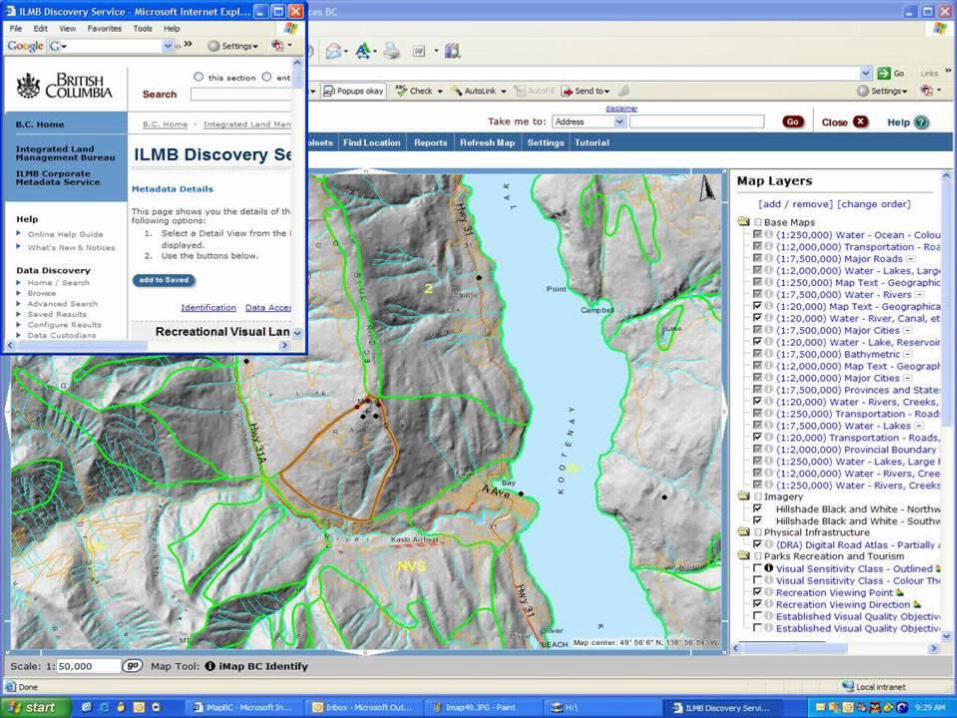
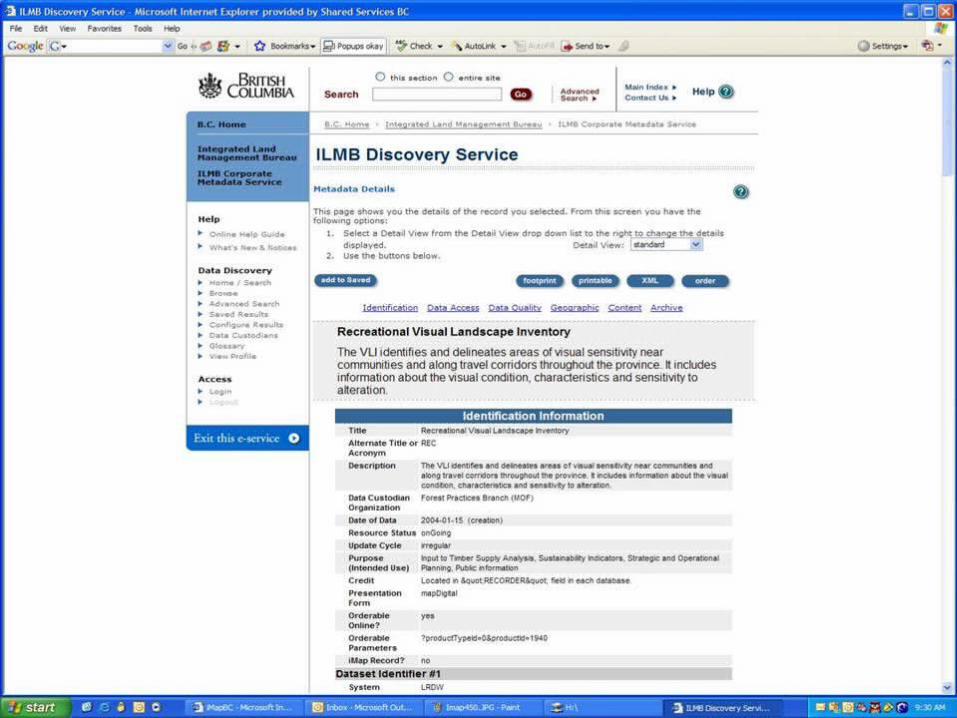
44. . How VLI information is accessed onlineHow VLI information is accessed online
VLI stored as shape files on the Land & Resource Data Warehouse (LRDW)
29
Via the Recreation Resource Inventory Online
Via www.lrdw.ca
Via IMAP or IMFapp

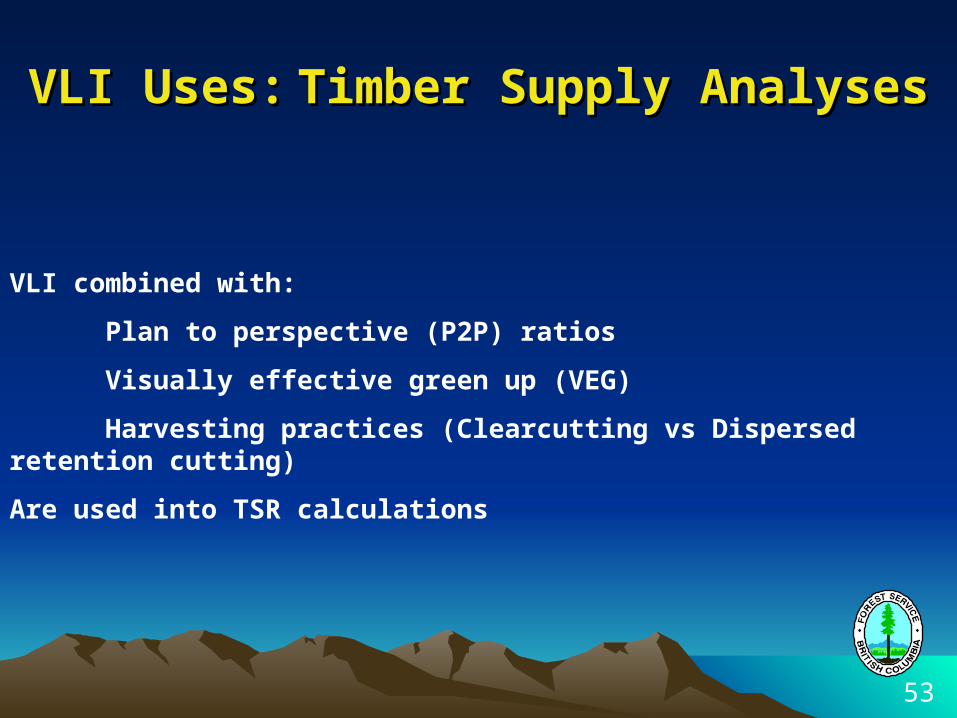
VLI Uses:VLI Uses:Timber Supply AnalysesTimber Supply Analyses
53
VLI combined with:
Plan to perspective (P2P) ratios
Visually effective green up (VEG)
Harvesting practices (Clearcutting vs Dispersed retention cutting)
Are used into TSR calculations
Timber availability: Timber available for harvest in the short and near term. Corresponds to the mature merchantable growing stock in the absence of legislative framework (or any other constraint).
Timber supply: estimate of future sustainable timber harvests under a set of rules and for long planning horizons (e.g. 200 yrs).
VLI Uses:VLI Uses:Timber Supply Analyses cont.Timber Supply Analyses cont.
54
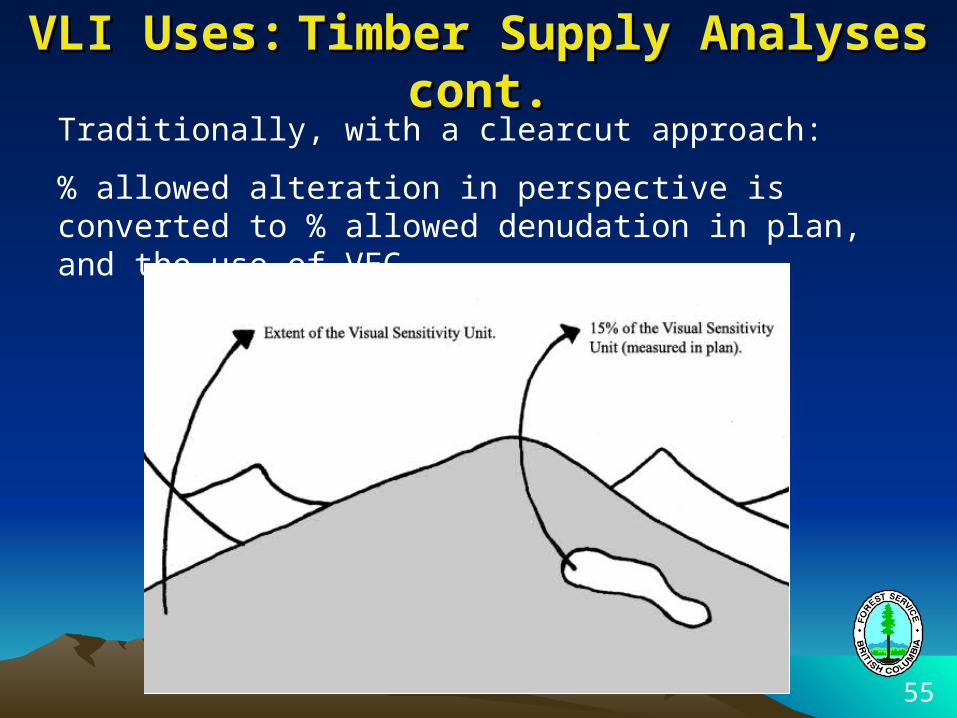
Traditionally, with a clearcut approach:
% allowed alteration in perspective is converted to % allowed denudation in plan, and the use of VEG
VLI Uses:VLI Uses:Timber Supply Analyses cont.Timber Supply Analyses cont.
55
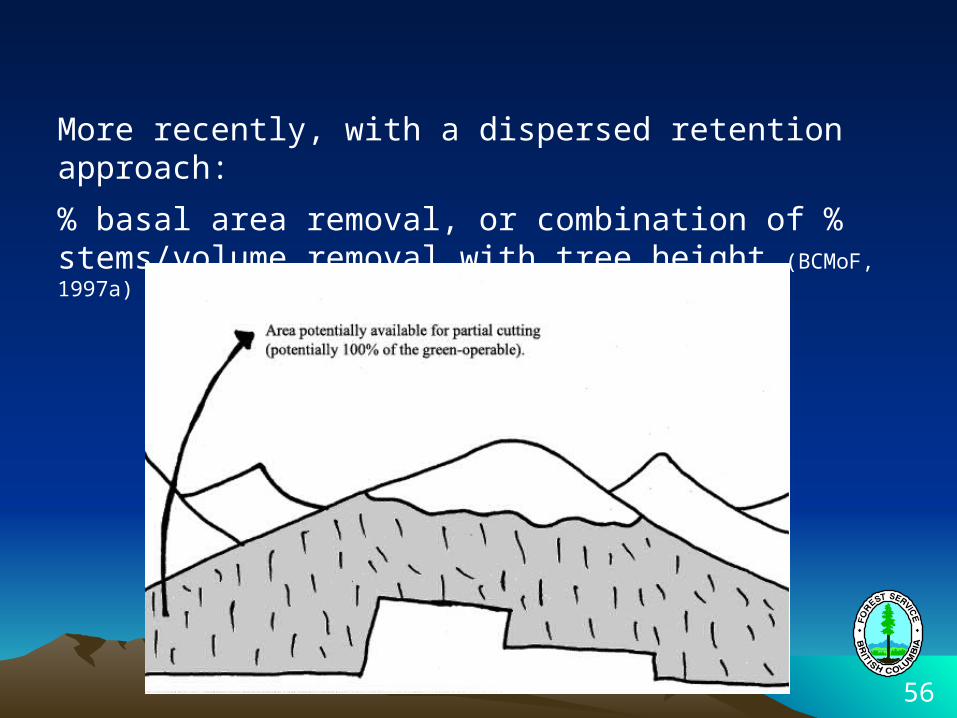
More recently, with a dispersed retention approach:
% basal area removal, or combination of % stems/volume removal with tree height (BCMoF, 1997a)
56
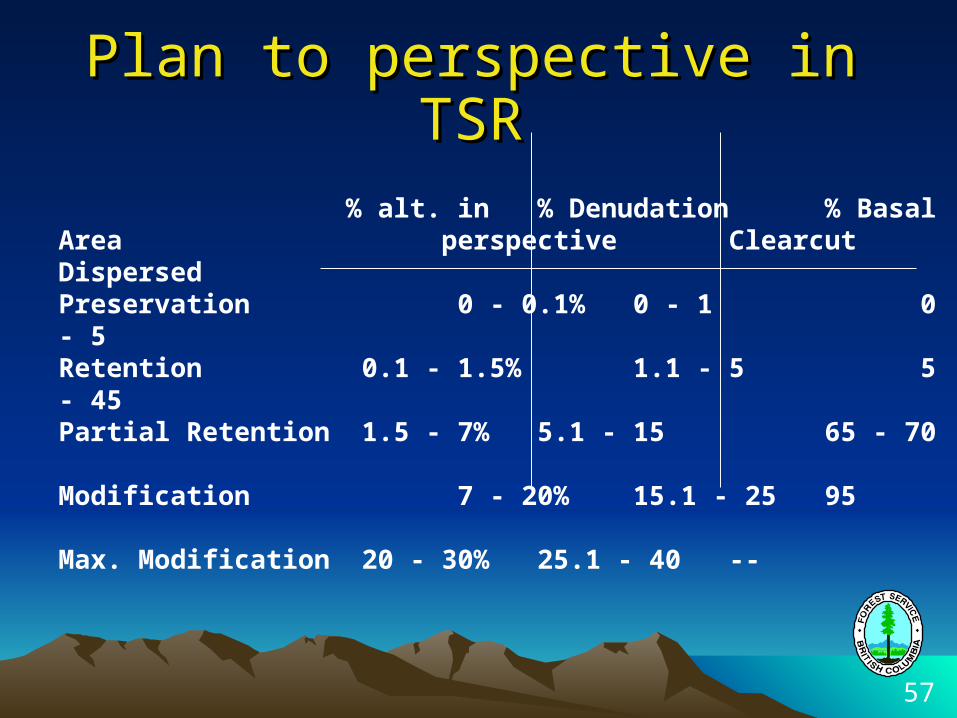
Plan to perspective in TSRPlan to perspective in TSR
% alt. in % Denudation % Basal Areaperspective Clearcut Dispersed
Preservation 0 - 0.1% 0 - 1 0 - 5Retention 0.1 - 1.5% 1.1 - 5 5 - 45Partial Retention 1.5 - 7% 5.1 - 15 65 - 70Modification 7 - 20% 15.1 - 25 95Max. Modification 20 - 30% 25.1 - 40 --
57
Other VLI uses:Other VLI uses:
identifying Potential Scenic Areasidentifying Potential Scenic Areas
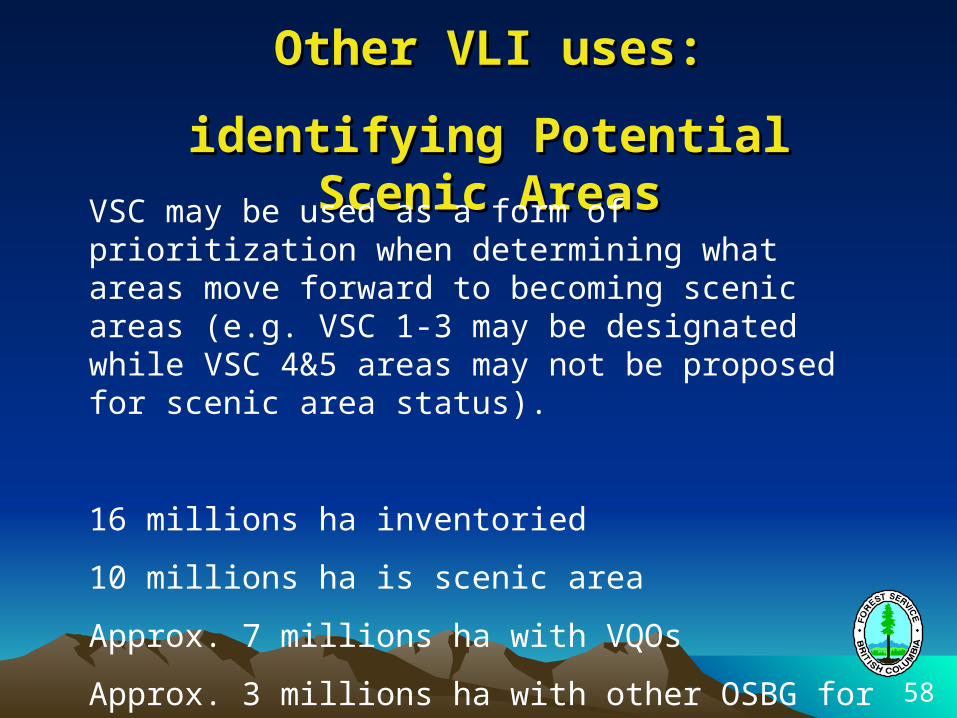
VSC may be used as a form of prioritization when determining what areas move forward to becoming scenic areas (e.g. VSC 1-3 may be designated while VSC 4&5 areas may not be proposed for scenic area status).
16 millions ha inventoried
10 millions ha is scenic area
Approx. 7 millions ha with VQOs
Approx. 3 millions ha with other OSBG for visuals58
Other VLI uses:Other VLI uses:
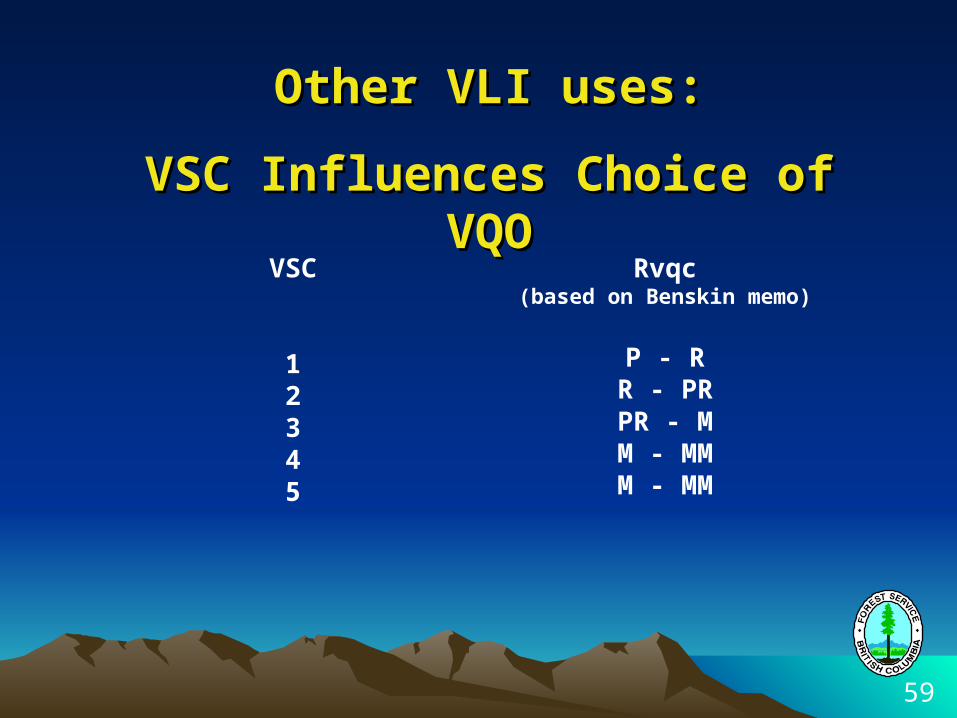
VSC Influences Choice of VQOVSC Influences Choice of VQO
VSC
12345
59
Rvqc(based on Benskin memo)
P - RR - PRPR - MM - MMM - MM
Other VLI uses:Other VLI uses:
Setting OSBG for Scenic AreasSetting OSBG for Scenic Areas
Under the Forest Planning and Practices Regulation (FPPR) a default VQO is derived by consulting visual sensitivity class contained in VLI, again, based on the Benskin memo as done for rvqcs (For known scenic areas without VQOs only)
60
Other VLI UsesOther VLI Uses
- To store EVQO & Scenic area status
- Input to Strategic Planning (for the location and significance of scenic areas)
- Input to Operational Plans (as a reference for legal objective, some viewpoints for VIAs, etc.)
- Monitoring & Auditing e.g. Effectiveness & FPB
61
Monitoring & AuditingMonitoring & Auditing
62
C&E: assess performance based on what was approved in the FSP, can lead to fines or other penalties.
FPB: Independent watchdog, investigates based on public complaints or can start its own investigations. Makes public report, recommendations non-binding.
FREP: monitoring program to assess whether FRPA leads to governments’ objectives for each of the 11 values being met.
FREP & visualsFREP & visuals
63
Effectiveness Evaluations
It is a check form conceived to assess whether an established VQO was achieved in the field.
Process includes 2 assessments:
-Does it meet the word definition?
-Does it meet the numeric calculations considering design, soil disturbance, etc.
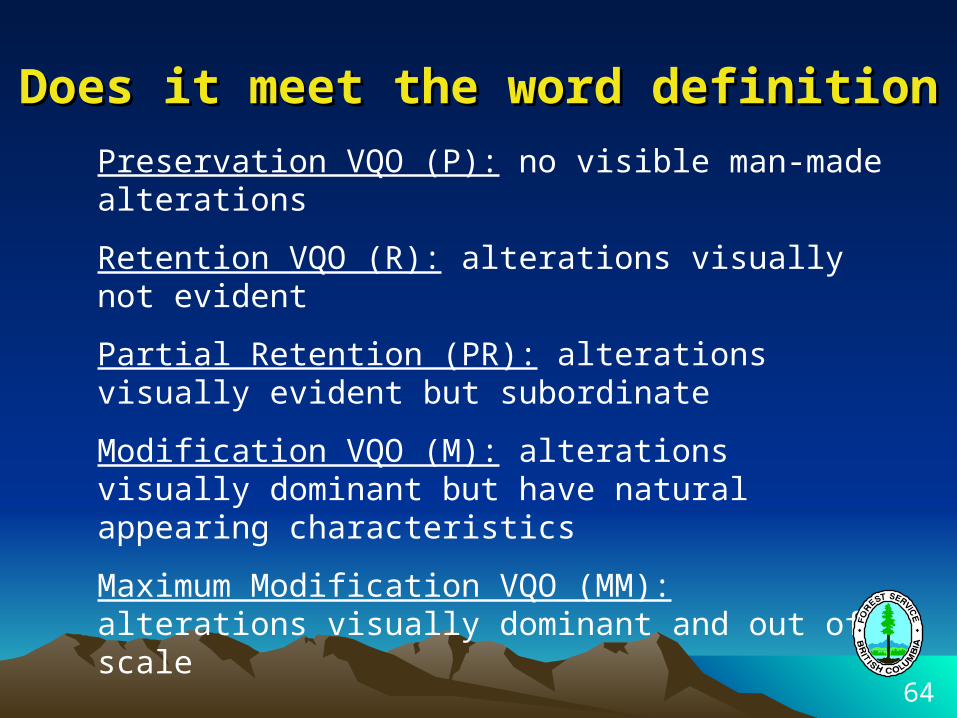
Preservation VQO (P): no visible man-made alterations
Retention VQO (R): alterations visually not evident
Partial Retention (PR): alterations visually evident but subordinate
Modification VQO (M): alterations visually dominant but have natural appearing characteristics
Maximum Modification VQO (MM): alterations visually dominant and out of scale
Does it meet the word definitionDoes it meet the word definition
64
% alteration is measured and then adjusted (up or down) based on:
-Roads & soil disturbances
-Within block retention
-Design
-Etc.
So 5% alteration (R) can shift to 7.5% (PR) or to 3% (still R)
Does it meet the “number” definitionDoes it meet the “number” definition
65
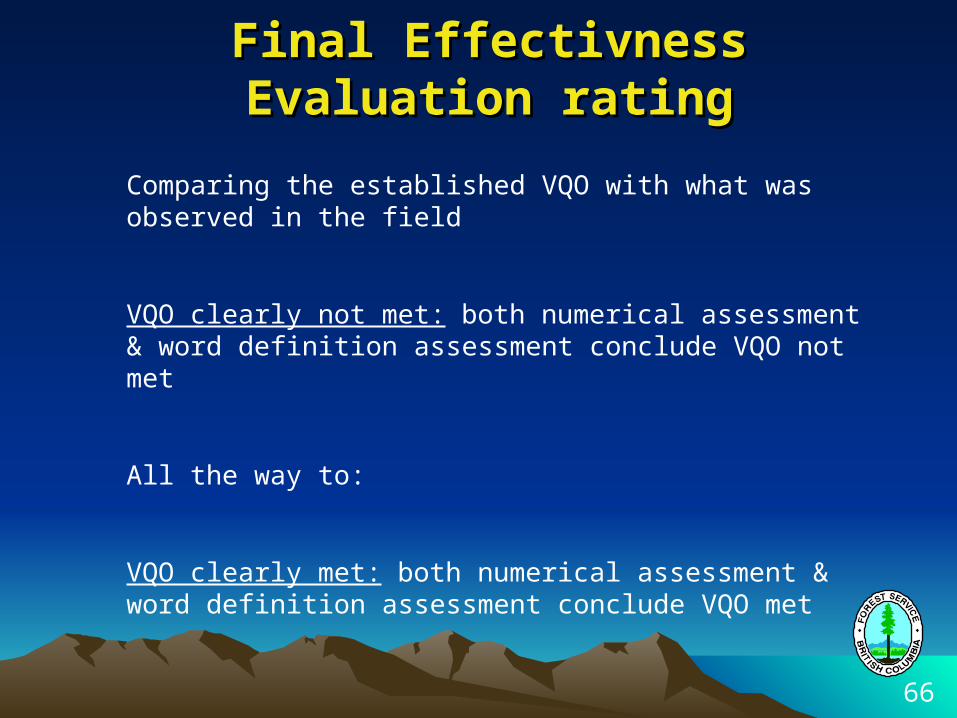
Final Effectivness Evaluation Final Effectivness Evaluation ratingrating
66
Comparing the established VQO with what was observed in the field
VQO clearly not met: both numerical assessment & word definition assessment conclude VQO not met
All the way to:
VQO clearly met: both numerical assessment & word definition assessment conclude VQO met
THANK YOU !THANK YOU !


