LION ATTACKS ON HUMANS IN SOUTHEASTERN TANZANIA: RISK FACTORS AND PERCEPTIONS A DISSERTATION SUBMITTED TO THE FACULTY OF THE GRADUATE SCHOOL OF THE UNIVERSITY OF MINNESOTA BY HADAS KUSHNIR IN PARTIAL FULFILLMENT OF THE REQUIREMENTS FOR THE DEGREE OF DOCTOR OF PHILOSOPHY DR. CRAIG PACKER, CO-ADVISER & DR. STEPHEN POLASKY, CO-ADVISER DECEMBER 2009
Transcript
LION ATTACKS ON HUMANS IN SOUTHEASTERN TANZANIA: RISK FACTORS AND PERCEPTIONS
A DISSERTATION SUBMITTED TO THE FACULTY OF THE GRADUATE SCHOOL
OF THE UNIVERSITY OF MINNESOTA BY
HADAS KUSHNIR
IN PARTIAL FULFILLMENT OF THE REQUIREMENTS FOR THE DEGREE OF
DOCTOR OF PHILOSOPHY
DR. CRAIG PACKER, CO-ADVISER & DR. STEPHEN POLASKY, CO-ADVISER
DECEMBER 2009
UMI Number: 3389333
All rights reserved
INFORMATION TO ALL USERS The quality of this reproduction is dependent upon the quality of the copy submitted.
In the unlikely event that the author did not send a complete manuscript
and there are missing pages, these will be noted. Also, if material had to be removed, a note will indicate the deletion.
UMI 3389333
Copyright 2010 by ProQuest LLC. All rights reserved. This edition of the work is protected against
unauthorized copying under Title 17, United States Code.
Thank you to Douglas Silverman for taking a chance and moving to Minnesota and
becoming my cherished partner. For helping me realize my dreams, supporting me during
the long lonely months in the field, and never resenting for a moment the months we had
to spend apart. I can honestly say I would not have survived graduate school without him.
I would like to thank all of my extended family in Israel for their love and support from
thousands of miles away. Above all, I want to thank my parents, Dina and Yochanan
Kushnir, and my sister, Tamar Kushnir. When I think of the unending love and support I
have received from them over the years, I feel like the luckiest person in the world.
iv
Dedication
This dissertation is dedicated to both my grandmothers, Gila Kushnir and Esperance
Asher, whose high school educations were cut short by war and resettlement. It is
because of their strength and sacrifice that I was able to obtain the education they were
never able to receive.
This dissertation is also dedicated to the many victims of lion attacks in Tanzania whose
stories I will never forget. It is my hope that this research will in some way help to
prevent future attacks.
v
Table of Contents
Acknowledgements .............................................................................................................. i Dedication .......................................................................................................................... iv Table of Contents ................................................................................................................ v List of Tables .................................................................................................................... vii List of Figures .................................................................................................................. viii Introduction to the Dissertation .......................................................................................... x CHAPTER 1: Using Landscape Characteristics to Predict Risk of Lion Attacks in Southeastern Tanzania ..................................................................................................... 1
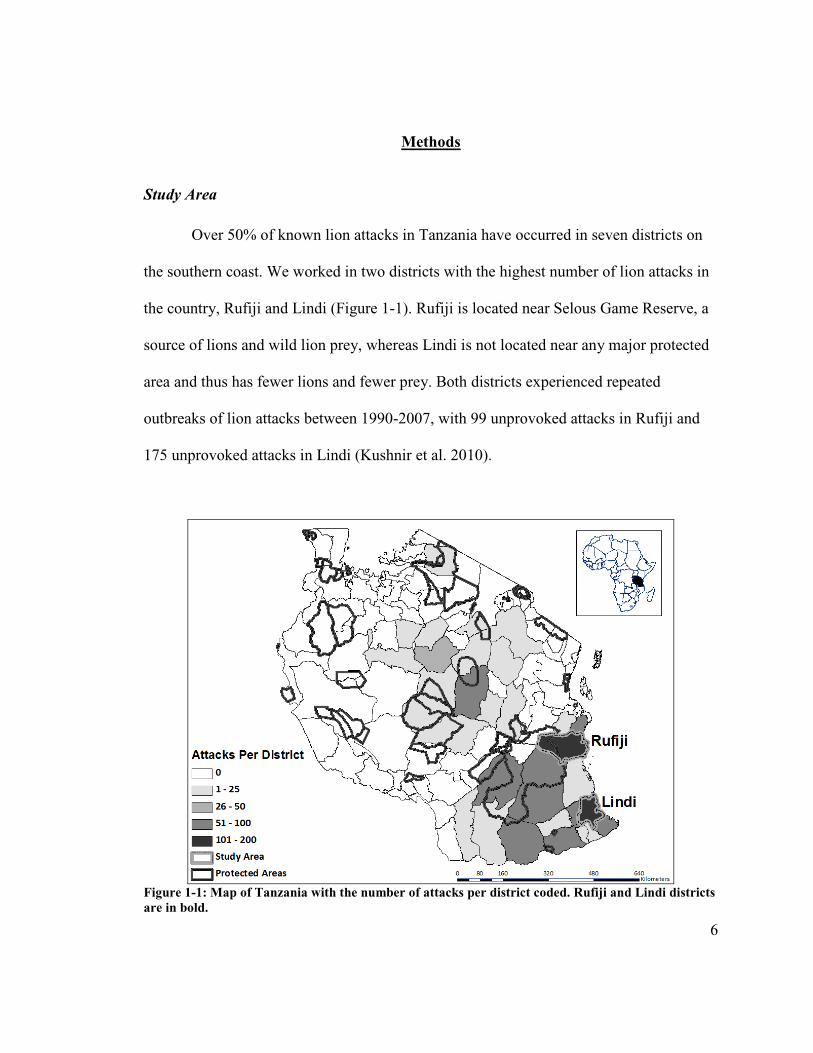
Study Area ................................................................................................................... 6 Data Collection ........................................................................................................... 7 Data Analysis .............................................................................................................. 8
Characteristics that Influence the Likelihood of Attack ........................................... 17 Extrapolating Results beyond Rufiji & Lindi ............................................................ 19
Conclusion .................................................................................................................... 20 CHAPTER 2: Human and Ecological Risk Factors for Unprovoked Lion Attacks on Humans in Southeastern Tanzania ............................................................................... 22
Selection of Study Areas............................................................................................ 26 Data Collection ......................................................................................................... 29 Data Analysis ............................................................................................................ 30
Results ........................................................................................................................... 32 Variations in Human Activity Patterns during Lion Attacks between Districts ....... 32 Variations in Risk Factors between Village Types and Districts ............................. 35 Variations in Attack Prevention between Village Types and Districts ..................... 38
Discussion ..................................................................................................................... 41 Qualitative Differences between Districts ................................................................ 41 District-Level Variations in Human Activity Patterns during Lion Attacks ............. 43 Village-Level Variation of Risk Factors ................................................................... 44 Attack Prevention ...................................................................................................... 47
CHAPTER 3: Reality vs. Perception: How Rural Tanzanians View Risks from Man-Eating Lions ..................................................................................................................... 51
Study Area ................................................................................................................. 55 Data Collection & Analysis ...................................................................................... 57
Results ........................................................................................................................... 60 Overall Risk & Factors that Affect Risk Perceptions ............................................... 60 Perceived Risk versus Actual Risk ............................................................................ 64 Comparison of Risks ................................................................................................. 67
Discussion ..................................................................................................................... 70 Perception of Overall Risk ........................................................................................ 70 Specific Factors that Affect Risk Perceptions ........................................................... 71 Comparison of High-Risk Situations between Districts............................................ 74 Perceived Risk versus Actual Risk ............................................................................ 75 Comparison of Risks ................................................................................................. 77
Conclusion .................................................................................................................... 79 REFERENCES ................................................................................................................. 81 APPENDIX 1: Predicted Attacks versus Actual Attacks per Ward ................................. 90 APPENDIX 2: Questionnaire ........................................................................................... 93
vii
List of Tables
CHAPTER 1:
Table 1-1: Results of logistic regression for Rufiji & Lindi districts (Model 1) .............. 13
Table 1-2: Results of logistic regression for all five district (Model 2) ............................ 14
CHAPTER 2:
Table 2-1: Description of variables in logistic regression models .................................... 31
Table 2-2: Results of combined logistic regression model for both districts ................... 36
Table 2-3: Results from logistic regression model for Rufiji district ............................... 37
Table 2-4: Results from logistic regression model for Lindi district ................................ 38
CHAPTER 3:
Table 3-1: Results of multivariate ordinal regression ....................................................... 62
Table 3-2: Chi-square statistics for comparing risk from lions to other wildlife and non-
urban areas, and bare areas. We then calculated the proportion of each land cover class
within a 2.5-kilometer radius of each point. Lions move an average of 3-5km a day
(Mosser & Packer 2009; Henry Brink pers. comm.), and we tested alternative radii,
ranging from 0.5km to 8km, but found that 2.5km provided the best model fit. In order to
integrate land cover change into the model, we also used calculated percent difference in
9
each land cover class within the 2.5km radius by subtracting the proportion of each class
in 1990 from the proportion of each class in 2000, thereby accounting for change in the
2.5km radius around each point.
We used backwards stepwise logistic regression in SPSS to create the best model
(Model 1). Using this model, we calculated attack probabilities for points on a 0.5km grid
across both Rufiji and Lindi. We then removed the variable for distance to attack (Model
2) and re-ran the model to calculate attack probability for a 0.5km grid of points across
Rufiji, Lindi and three additional districts, Kilwa, Ruangwa, and Mtwara, for which all
necessary data, except distance to attack, were available. Once we calculated attack
probability for each point in the 0.5km grid, we converted the values into a raster grid and
mapped it in ArcGIS.
We conducted two tests to determine how well the models performed in relation
to actual attacks. In Rufiji and Lindi, we calculated the mean probability values for 1km
buffers around actual attack points using the Zonal Statistic function in Hawth’s Analysis
Tools add-on for ArcGIS (Beyer 2004), which sums the probabilities of all grids in the
1km buffer and divides the value by the number of grids. We then used ANOVA to
compare the mean of these values to the mean of the probability values of 1km buffers
around a new random sample of points across both districts. To test how well Model 2
performed in districts where we only have knowledge of attacks at the ward level (the
next administrative unit below district), we calculated the sum of the probabilities in each
ward as predicted by the model multiplied by a scaling variable to convert relative
10
probability to predicted number of attacks. We calculated the scaling variable separately
for each district by dividing the number of attacks per district by the sum of the
probability values for the entire district, thus converting the scale of probability values to
a similar scale as attacks. The objective of this calculation was to determine how well the
model predicted high-risk areas within each district. We graphed the predicted number of
attacks per ward versus actual number of attacks per ward and used a correlation matrix
to compare these values. First, we found the Pearson correlation value across all wards in
the five districts combined. Second, we calculated correlation values across wards for
each district separately.
Results
Figure 1-2 and Figure 1-3 show the location of attacks in Rufiji and Lindi districts
respectively. It is evident that attacks are concentrated in certain areas within each district
and that not all villages have attacks. Because lions are found across both districts, it is
not the absence of lions that defines the absence of attacks. Attacks also occur in the
same area over a number of different years.
11
Figure 1-2: Map of Rufiji district with attacks coded by years.
Figure 1-3: Map of Lindi district with attacks coded by years.
12
Table 1-1 shows the final logistic regression model for Rufiji and Lindi districts
(Model 1). This model predicts 62.2% of the attack points correctly and 93.3% of all
points (both attack and non-attack points) correctly. The model considers a point to be an
attack point if the probability is 50% or greater. Attack probability is negatively
correlated to distance to nearest attack, distance to nearest village, and distance to nearest
water body and positively correlated to the squared terms for distance to nearest village
and the nearest water body. High proportions of four land cover variables increase the
overall probability of an attack: open woodland/bushland, grassland with scattered crops,
woodland/bushland with scattered crops, and bare areas. A larger proportion of urban
area decreases the overall probability of attack. Changes in land cover were also
significant. Positive changes in four cover types increase the probability of attack:
increases in grassland, open woodland/bushland, closed woodland/bushland/forest, and
grassland with scattered crops. A high percent increase in urban areas decreases the
overall probability of attack. When we removed distance to nearest prior attack from the
model (Model 2, Table 1-2), all of the other variables from Model 1 continue to affect the
overall probability of an attack. However, without distance to nearest prior attack, Model
2 correctly predicts a lower percentage of points: 38.3% of attack points and 90.5% of
attack and non-attacks points. It is important to note that spatial autocorrelation could be
an issue in both models, but we attempted to account for this by incorporating most of the
important spatial variables.
13
Table 1-1: Results of logistic regression for Rufiji & Lindi districts (Model 1)
Variable
Estimated Coefficient
Estimated Standard
Error p-value
Odds Ratio
Log10 Distance to Nearest Prior Attack -5.682 .488 .000 .003
Log10 Distance to Nearest Village -12.581 1.741 .000 .000
Log10 Distance to Nearest Village Squared 8.457 1.463 .000 4707.78
Log10 Distance to Nearest Waterbody -2.508 1.364 .066 .081
Log10 Distance to Nearest Waterbody Squared 2.221 .883 .012 9.221
Percent Open Woodland/Bushland .010 .005 .049 1.010
Percent Grassland with Scattered Crops .016 .008 .033 1.016
Percent Woodland/Bushland with Scattered Crops .013 .005 .005 1.013
Percent Urban -.213 .118 .071 .808
Percent Bare Areas .085 .034 .012 1.089
Percent Difference in Grassland .029 .010 .003 1.029
Percent Difference in Open Woodland/Bushland .013 .007 .041 1.014
Percent Difference in Closed Woodland/ Bushland/Forest
.016 .008 .033 1.017
Percent Difference in Grassland with Scattered Crops .023 .014 .096 1.023
Percent Difference in Urban -.289 .149 .052 .749
Constant 4.770 .744 .000 117.869
14
Table 1-2: Results of logistic regression for all five district (Model 2)
Variable
Estimated Coefficient
Estimated Standard
Error p-value
Odds Ratio
Log10 Distance to Nearest Village -7.833 1.225 .000 .000
Log10 Distance to Nearest Village Squared 2.282 1.036 .028 9.798
Log10 Distance to Nearest Waterbody -1.715 .987 .082 .180
Log10 Distance to Nearest Waterbody Squared 1.588 .658 .016 4.892
Percent Open Woodland/Bushland .009 .004 .023 1.009
Percent Grassland with Scattered Crops .023 .006 .000 1.023
Percent Woodland/Bushland with Scattered Crops .009 .004 .010 1.009
Percent Urban -.203 .097 .036 .816
Percent Bare Areas .112 .022 .000 1.118
Percent Difference in Grassland .056 .009 .000 1.058
Percent Difference in Open Woodland/Bushland .017 .006 .004 1.017
Percent Difference in Closed Woodland/ Bushland/Forest
.031 .007 .000 1.032
Percent Difference in Grassland with Scattered Crops .064 .011 .000 1.067
Percent Difference in Urban -.242 .119 .042 .785
Constant .760 .510 .136 2.139
Figure 1-4 and Figure 1-5 show attack probabilities mapped across Rufiji and
Lindi district as predicted by Model 1. Overlaid on the probabilities are the actual attack
points. The predicted probabilities at attack points are significantly higher than the
random sample of points for both Model 1 (F=1843, df=2107, p<0.01) and Model 2
(F=485, df=2107, p<0.01). At the ward level, the predicted number of attacks is
significantly correlated to the actual attacks per ward (Pearson=0.554, n=97, p<0.01) (See
Appendix 1 for table of actual versus predicted attacks per ward). For each separate
district, predicted attacks and actual attack values were significantly correlated in Rufiji,
Lindi and Mtwara districts (Pearson=0.577, n=15, p<0.05; Pearson=0.455, n=29, p<0.05;
Pearson=0.475, n=19, p<0.05). In Ruangwa, results approached statistical significance
15
(Pearson=0.502, n=15, p=0.057), and the results from Kilwa showed almost no
correlation (Pearson=-0.012, n=19, p=0.961). Figure 1-6 shows actual attacks per ward
plotted against predicted attacks per ward for the three non-study districts. There is a
positive relationship between actual and predicted attacks for Mtwara and Ruangwa but
not for Kilwa.
Figure 1-4: Map of Rufiji district showing the attack probability as predicted by Model 1
16
Figure 1-5: Map of Lindi district showing the attack probability as predicted by Model 1.
Figure 1-6: Actual versus predicted attacks for Kilwa, Ruangwa, and Mtwara districts.
R2= 0.252
R2= 0.225
R2=-0.0001471
17
Discussion
Characteristics that Influence the Likelihood of Attack
The results of Model 1 identify a number of factors that increase the probability of
an attack at a given location. Probability increases as distance to the nearest attack
decreases, showing that attacks tend to be clustered. Attack risk declines steadily until
about 5.5km from a village, where the probability bottoms out and remains low, showing
that attacks occur in areas near human habitation. Distance to water exhibits a similar
effect with probabilities being high near water and declining to a constant plateau at
about 3.7km. A number of studies have shown that lions prefer areas near rivers and
lakes for access to water, prey, hunting cover, and den sites (Schaller 1972; Spong 2002;
Ogutu & Dublin 2004; Hopcraft et al. 2005; Mosser et al. 2009). Surprisingly, distances
to nearest protected area and to roads were not significant in the model. We had expected
to see a protected-area effect with attacks either being higher near sources of wildlife or
higher in areas where lion prey is scarce§. It is possible that resident lion populations in
the agricultural areas are responsible for most incidents of man-eating, resulting in no
clear link to protected areas. Lions are known to use roads and paths while moving
through an area, and many attacks occur along roads. It is possible that our map of roads
was not detailed enough to catch smaller dirt roads used by lions. The road map also did
not capture footpaths used by most people.
§ District, distance to nearest protected area, and an interaction term for district by distance to nearest protected area were all tested but none were significant or remained in the model. We also constructed a model for Rufiji district only and distance to protected area was still not significant.
18
A high proportion of four cover types are linked to an increase in attack
probability: open woodland/bushland, both grassland and woodland/bushland with
scattered crops, and bare areas. Open woodland and bushland are ideal habitats for lions,
providing habitat for both grazing and browsing prey and hunting cover for lions. In a
fine-scale landscape analysis of lion predation in the Serengeti National Park, Hopcraft et
al. (2005) showed that lions prefer areas with hunting cover where prey are easier to
catch rather than areas where prey abundance is high. Grassland and woodland//bushland
with scattered crops encompass areas of small-scale agriculture occupied by both people
and wildlife. The patchy nature of the landscape allows wildlife to live in close proximity
to humans. In addition, people tend to live in temporary structures and stay outside to
protect crops since these areas contain a high abundance of bush pigs, a common
nocturnal crop pest that lure lions into agricultural areas (Packer et al. 2005; Kushnir et.
al. 2010). Areas with a high proportion of bare area also have an increased likelihood of
attack. These areas are mostly sandy beaches along rivers. Sand bars are cultivated during
the dry season and experience high human use. Urban areas with high human population
density cannot support wildlife, thus urbanization decreases attack probability.
We can group landscape changes that lead to an increase in attack probabilities
into two categories: changes that lead to a loss in prey and changes that attract lions to an
area. Two types of change identified by the model cause a loss in lion prey: increase in
closed woodland/bushland/forest, and an increase in urban areas. Each of these changes
affects the probability of attack in a different way. Conversion of land to closed
19
woodland/bushland/forest may increase the probability of attacks in a location by
reducing the likelihood that lions can catch wild prey as grazers are forced out of the
area. Spong (2002) found that lions in Selous Game Reserve show significant avoidance
of woodland areas, supporting the idea than an increase in densely wooded habitat
adversely affects lions. An increase in urban areas has the opposite effect: urban areas not
only cause a loss in lion prey but also are environmentally unsuitable for lions. The
second category of change is change that attracts lions to an area. These changes include
conversion of land to grassland with scattered crops, grassland, or open
woodland/bushland areas. Conversion of land to small-scale agriculture not only disrupts
the ecosystem and leads to an increase in bush pigs but also makes people increasingly
vulnerable, since they are in areas where they are in regular contact with wildlife. Both
grassland and open woodland and bushland are preferred habitats for lions (Spong 2002;
Hopcraft et al. 2005), thus an increase in this habitat near an area would increase the
chance of people encountering lions, and therefore increase the chance of attack.
Extrapolating Results beyond Rufiji & Lindi
Although we were able to construct a model that identified the high-risk areas in
both Rufiji and Lindi (Model 1) given attack locations, the larger question is whether we
can identify high risk-areas in places where fine-scale attack data are not available.
Model 2 successfully predicted attacks per ward in Rufiji, Lindi and two additional
districts: Mtwara & Ruangwa. In these districts, attacks per ward were positively
correlated to predicted attacks per ward. Model 2, however, failed to identify high-risk
20
wards in Kilwa, where actual and predicted attacks were not correlated. In Kilwa, the
model under-predicted attacks in some of the wards with the most attacks and over-
predicted attacks in several wards with no attacks. Kilwa district is situated between
Rufiji and Lindi and experiences many fewer attacks then any of the neighboring
districts. Kilwa is close to Selous Game Reserve and lions range throughout the entire
district, yet Kilwa only had 22 attacks from 1990-2007. Kilwa has a population density of
12.8 people per km2, compared to the other districts where the population densities are
38.2 (Lindi), 79.0 (Mtwara), 21.1 (Rufiji), and 45.5 (Ruangwa). It is possible, that with
low human populations, much of the landscape is undisturbed, allowing lions sufficient
space and prey to stay away from human settlement.
Conclusion
Techniques that identify spatial landscape characteristics predisposing areas to
carnivore conflict can help to elucidate underlying causes and predict future conflicts. By
modeling conflict risk in two districts with highly detailed data, we were able to predict
risk in two out of three additional districts. This approach allows for the optimal
implementation of conflict mitigation programs based on model predictions. For
example, the identification of high-risk areas allows wildlife managers to pinpoint
locations for interventions such as training local game scouts to assist in controlling man-
eaters or helping villagers improve their safety. By identifying characteristics of high-risk
locations, village land-use planners could encourage villagers to farm in areas that do not
contain the optimal conditions for lion attacks or to maintain low-risk land cover types
21
near their villages. Since human-carnivore conflict greatly affects both local communities
and carnivore populations, conservation biologists must identify areas most at risk in
order to implement prevention measures before conflict occurs.
22
CHAPTER 2: Human and Ecological Risk Factors for Unprovoked
Lion Attacks on Humans in Southeastern Tanzania**
** Kushnir H., H. Leitner, D. Ikanda, and C. Packer. 2010. Human and ecological risk factors for unprovoked lion attacks on humans in southeastern Tanzania. Human Dimensions of Wildlife. 15(5). In press.
23
Lions (Panthera leo) have attacked over 1000 people in Tanzania since 1990. We worked
in the two districts with the highest number of attacks, Rufiji and Lindi, and conducted
interviews in two villages with high attack numbers and two neighboring villages with no
attacks. Logistic regression analysis of 128 questionnaires revealed the following risk
factors: ownership of fewer assets, poorly constructed houses/huts, longer walking
distances to resources, more nights sleeping outdoors, increased sightings of bush pigs
(Potamochoerus porcus), and lower wild prey diversity. A comparative analysis revealed
significant differences between the two districts: while high bush pig and low prey
numbers affected both districts, hut construction was only significant in Rufiji, and
walking distances, asset ownership, sleeping outdoors, and house construction were only
significant in Lindi. Such information will help relevant authorities develop site-specific
methods to prevent lion attacks and can inform similar research to help prevent human-
carnivore conflict worldwide.
24
Introduction
An increase in human population and the resulting ecological impacts have led to
an increase in human-wildlife conflict throughout the world (Fall & Jackson 2002),
making it one of the foremost issues facing wildlife conservation today (Woodroffe et al.
2005b). This is particularly true for carnivores. Human population growth has led to
encroachment into wildlife areas, alteration of carnivore habitat, and depletion of prey
populations, while successful conservation has allowed for the recovery of several
Mishra 2006). Carnivores have the potential to cause serious economic damage and even
harm humans, diminishing public support for wildlife conservation and motivating the
extermination of problem animal species (Treves & Karanth 2003b; Loe & Roskaft
2004). Persecution by people in response to conflict – real or perceived – is one of the
main factors in carnivore population declines around the world (Woodroffe 2001;
Woodroffe & Frank 2005).
A severe example of direct human-carnivore conflict recently occurred in
Tanzania where lions have attacked over 1000 people between 1990 and 2007 (updated
from Packer et al. 2005). The situation is unusual in that most attacks involved lions
entering settlements and agricultural areas, apparently in search of humans (Baldus 2004;
Packer et al. 2005). Tanzania is home to 25-50% of all African lions, making it a critical
country for lion conservation (Chardonnet 2002; Bauer & Van Der Merwe 2004). Not
only are lions important top predators to the natural ecosystem, but they are also of great
25
economic importance to Tanzania, where nature-based tourism, including trophy hunting
and photographic tourism, is the second largest source of foreign revenue (Wade et al.
2001).
Until recently, there have been few published studies of lion attacks on humans.
The studies that do exist take a case-study approach, view the issue from a natural history
perspective, or examine lion health as a cause of the problem (Yamazaki & Bwalya 1999;
Peterhans & Gnoske 2001; Patterson et al. 2003; Baldus 2004, 2006). In 2005, Packer et
al. published a study of 231 attacks across Tanzania, which broadly identifies important
risk factors and patterns in human activities during attacks. The study found that lion
attacks tend to be highest in districts with high abundances of bush pigs and low
abundances of other natural prey. Most attacks occur when people are tending crops in
their agricultural fields, and concurrently, 39% of the surveyed cases occur during harvest
time (March-May). Bush pigs are a major risk factor, as people sleep in their fields in
makeshift huts to protect their crops from this nocturnal agricultural pest. Farmers also
report seeing lions enter their fields in pursuit of bush pigs. Along with tending and
protecting crops, other common activities during attacks include walking alone in the
early morning and evening hours, using the outhouse at night, and participating in
retaliatory lion hunts.
Although the Packer et al. (2005) study identifies activities that put people at risk
and broad-scale risk factors related to lion prey and bush pigs, it does not examine
variations in human activities linked to risk. Our study examines human and ecological
26
risk factors in greater detail and at both the district- and village-level. We consider
wildlife presence as well as human factors, including: asset ownership, distances to key
resources, amount of time sleeping in agricultural fields/outdoors, and house/hut
construction. We conducted the study in the two districts with the highest number of
attacks reported in the Packer et al. (2005) study: Rufiji and Lindi. Within each district,
certain areas experience a high number of attacks while others were free of conflict
despite being in close proximity to attack hotspots, indicating that local variation in
ecology and/or human activities may influence the probability of an attack. Examining
variations in human activities and wildlife presence at the village- and district-levels will
therefore provide a more nuanced view of the risk factors for lion attacks.
Methods
Selection of Study Areas
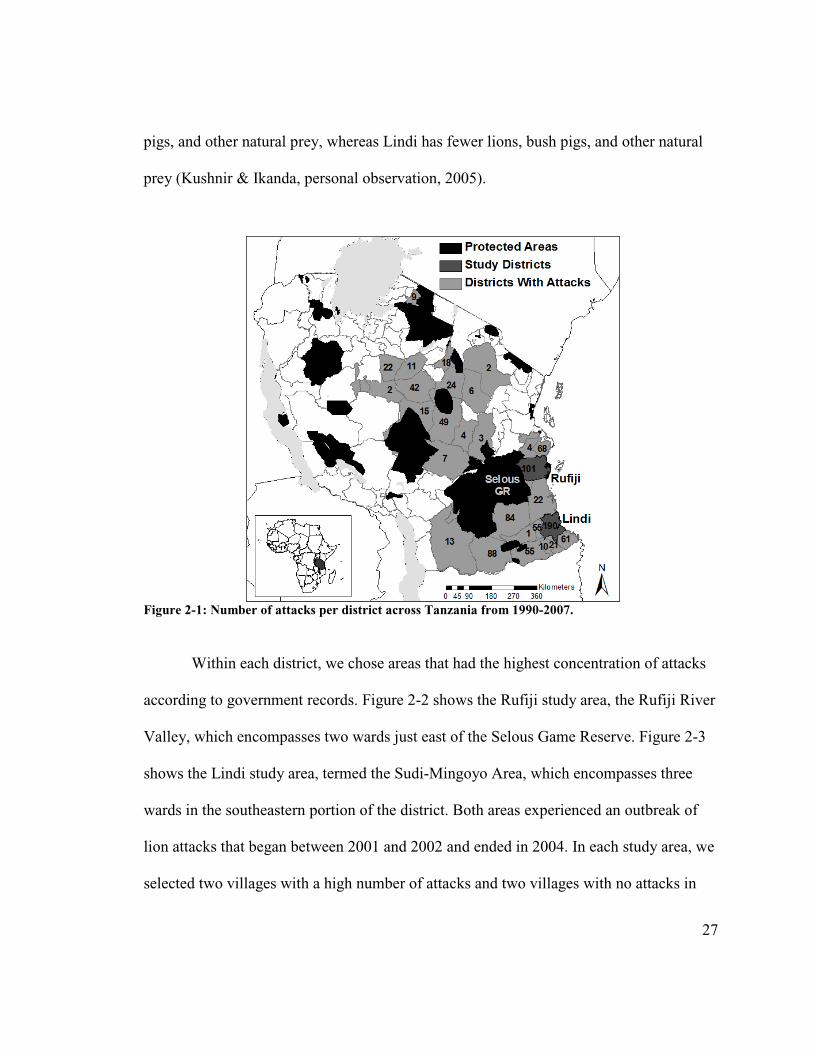
This study focuses on the two districts with the highest number of lion attacks
since 1990, as identified in the Packer et al. (2005) study (Figure 2-1). Rufiji district had
101 attacks between 1990 and 2007 while Lindi district had 190 attacks in the same
period (updated from Packer et al. 2005). Rufiji’s human population totals just over
200,000 in ~98 villages; Lindi is home to just over 250,000 in ~129 villages. However,
Lindi, with an area of 6,732 km2 is more densely populated (37 people/km2) than Rufiji
(21 people/km2), whose habitable area covers 9,645 km2. Rufiji contains part of a major
protected area, the Selous Game Reserve, which is also a source of wild lions, whereas
Lindi is not near any major protected areas. Thus, Rufiji has a large number of lions, bush
27
pigs, and other natural prey, whereas Lindi has fewer lions, bush pigs, and other natural
prey (Kushnir & Ikanda, personal observation, 2005).
Figure 2-1: Number of attacks per district across Tanzania from 1990-2007.
Within each district, we chose areas that had the highest concentration of attacks
according to government records. Figure 2-2 shows the Rufiji study area, the Rufiji River
Valley, which encompasses two wards just east of the Selous Game Reserve. Figure 2-3
shows the Lindi study area, termed the Sudi-Mingoyo Area, which encompasses three
wards in the southeastern portion of the district. Both areas experienced an outbreak of
lion attacks that began between 2001 and 2002 and ended in 2004. In each study area, we
selected two villages with a high number of attacks and two villages with no attacks in
28
close proximity to attack villages and with similar land cover types. An “attack village” is
one that experienced an attack on humans within the boundary of the village, including
the land used for cultivation by its villagers. We made site visits to verify that villages
selected as “non-attack villages” were attack free from1990-2007. By selecting villages
in this manner, we are able to compare human activities and wildlife presence in villages
with different attack histories while controlling for environmental conditions. In addition,
all villages have similar livelihood strategies (small-scale agriculture), wealth status, and
religion (primarily Islam). We confirmed the presence of lions in all villages so that
differences in attacks were not due to the absence of lions.
Figure 2-2: Rufiji River Valley study area, Rufiji district. Study villages are in bold with larger symbols.
29
Figure 2-3: Sudi-Mingoyo study area, Lindi district. Study villages are in bold with larger symbols.
Data Collection
We collected two types of data: human activity patterns during lion attacks, and
human activities and wildlife presence in attack and non-attack villages. We began by
cross checking Packer et al. (2005) data with district records and obtaining information
on more recent attacks. We then traveled from village to village inquiring about all
attacks that occurred from 1990-2007. We uncovered a number of unreported cases by
inquiring directly in each village; any remaining unreported cases are likely to be
randomly distributed and of equal proportion in both districts. We focused solely on
“unprovoked” attacks, which included any attack that did not occur during a lion hunt
(discounting 17 attacks). We collected data on human activities during lion attacks
30
through interviews with village leaders, survivors, or family members. The district
records generally provide the date, name, age and sex of the victim, and we collected
additional data such as the time and location of the attack and what the victim was doing
at the time of attack. Whenever possible, we obtained accounts from witnesses or people
who visited the scene shortly after an attack to avoid bias from non-witness statements.
To compare villages with and without a history of attacks, we collected data on
socioeconomics, daily activities, personal safety, wildlife presence, and attack prevention
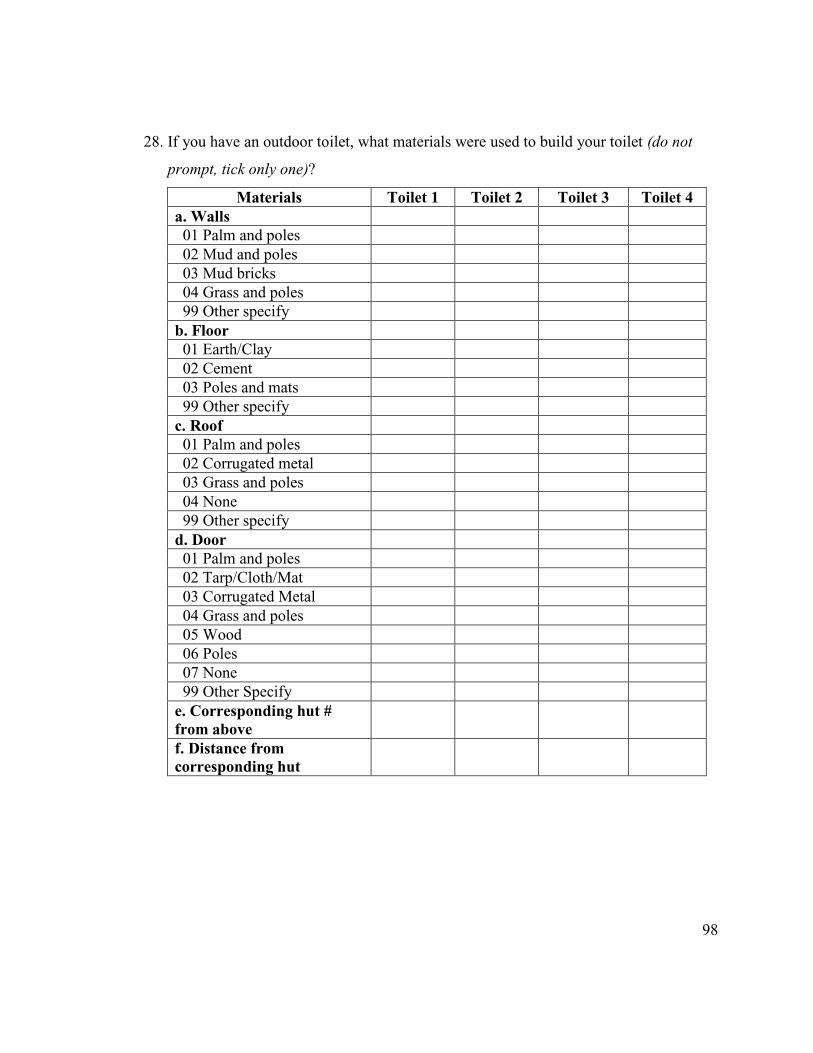
through questionnaire-based interviews (see Appendix 2 for questionnaire). With the
assistance of an interpreter, we conducted sixteen interviews in each of the eight study
villages, for a total of 128 interviews. Households were selected at random through
village registers, and male and female heads of household were selected alternately to
assure an even gender ratio. Although some of the questions were household level
questions, most of the questionnaire focused on individual-level data.
Data Analysis
We used chi-square analysis to compare human activity patterns during lion
attacks between the two districts. To identify risk factors, we conducted a series of
backwards linear stepwise logistic regressions. Logistic regressions compared human
activities and wildlife presence between villages with and without attacks by treating the
study like a case-control design, where people in villages with attacks were assigned 1
and people in non-attack villages assigned 0. Three regression analyses were conducted:
one with data from both Rufiji and Lindi and one each for Rufiji and Lindi separately.
31
For the regressions, we consider variables significant if they had a p-value of less than
0.05, but considered any variable with p < 0.10 as worthy of discussion. Table 2-1
provides a description of each variable in the model.
Table 2-1: Description of variables in logistic regression models
Variable*
Description
Main home located on agricultural field According to interviewee & assessment of interviewer
Number of assets owned Count of prompted list of eight assets
Number of problem species reported Count of unprompted list of animals specified by interviewee as crop pests
Walking distance to firewood (minutes) Walking distance to water (minutes) Walking distance to neighbors (minutes)
Walking distance in minutes from home as reported by interviewee, we averaged times if interviewee had more than one home (i.e. in village center & agricultural field)
Days walked to agricultural field per year We determined which months people go to agricultural fields, then how many days per week in each month, and calculated the total
Nights slept in agricultural field per year We determined which months people sleep in their agricultural field, then how many days per week each month, and calculated the total
Nights slept outdoors per year
We identified what traditional activities caused each individual to sleep outdoors, then asked how many nights per year they sleep outdoors for each activity, and calculated the total
Days per year bush pigs sighted in village center
Days per year bush pigs sighted in agricultural field
If interviewee specified that they see bush pigs in their village or agricultural fields, we determined which months, then how many times per week in each month, and calculated the total
Number of lions prey types sighted Interviewees pointed to and named animals from a page of pictures of common lion prey, none of the animals were the same as crop pests mentioned.
Interviews were always conducted at the main home of the interviewee. We observed and recorded information on each aspect of house construction (walls, roof, door, & floor). Note that coding was slightly different in the Lindi model because there were no thatch houses in Lindi.
Hut safety - Level 1: Elevated thatch & pole hut - Level 2: Non-elevated thatch & pole hut - Level 3: Mud/mud brick house - Level 4: Does not sleep in agricultural field
We considered huts to be any structure in which people temporarily reside in an agricultural field. We questioned interviewees on each aspect of hut construction (walls, roof, door, & floor). Note that coding was slightly different in the Rufiji model because mud/mud brick huts were rare.
*These represent only the variables that remained in the models after the backwards stepwise logistic regression. A number of additional variables were included in the original models but were not significant: number of livestock owned, walking distance to agricultural field (minutes), sighting of lions in village centers and in agricultural fields, sighting of lion signs in village centers and in agricultural fields.
Results
Variations in Human Activity Patterns during Lion Attacks between Districts
A number of human activity patterns varied significantly between districts. Most
notable were the location and activity of victims during attacks, and the time of day when
the attack occurred. In Rufiji, the majority of attacks occurred inside structures in
agricultural fields (45%), whereas in Lindi, cases largely occurred outside structures in
agricultural fields (39%), outside homes in the village center (31%), as well as on roads
or paths in areas peripheral to the village center (19%) (X2 = 104.02, p < 0.01) (Figure
2-4). Although both districts experienced a large proportion of attacks in agricultural
fields, site visits revealed that significantly more of the Lindi attacks (39%) occurred
inside village centers as compared to Rufiji (11% ) (X2 = 23.25, p < 0.01). The victims’
activities during attacks also differed substantially between districts (X2 = 87.66, p <
33
0.01) (Figure 2-5). In Rufiji, 43% of attacks occurred when individuals were resting,
sitting, or sleeping inside their home. In Lindi, attacks were more common when people
were walking (36%), using the outhouse or bathing (27%), or resting outside their homes
(18%). In Rufiji, most victims were accompanied by other people at the time of the attack
(59%), but in Lindi, most victims were alone (65%) (X2 = 9.27, p < 0.05). In Rufiji, the
majority of cases occurred at night (62%), while most cases in Lindi occurred in the late
evening (45%) (X2 = 22.39, p < 0.01) (Figure 2-6).
Figure 2-4: Percent of lion attacks at each location in Rufiji and Lindi districts.
34
Figure 2-5: Percentage of attacks in each activity category for Rufiji and Lindi.
Figure 2-6: Percent of attacks at each time category for Rufiji and Lindi.
35
Variations in Risk Factors between Village Types and Districts
Results from the logistic regression using data from both districts identify factors
that differentiate attack and non-attack villages. Compared to villages without attacks,
people in attack villages walk longer distances to water, firewood, and neighbors, see
bush pigs more frequently in agricultural fields, see fewer types of problem species and
lion prey, spend fewer nights sleeping in agricultural fields, spend more nights sleeping
outside for traditional ceremonies, such as funerals and weddings, own fewer assets, and
live in weaker structures in village centers and agricultural fields (Table 2-2).
36
Table 2-2: Results of combined logistic regression model for both districts showing risk factors for lion attacks
Variable
B SE Wald df P
Gendera -1.65 0.786 4.39 1 0.036
Agea -0.06 0.032 2.96 1 0.086
Main home located on agricultural fielda -1.78 2.166 0.67 1 0.411
Districta 2.38 1.937 1.51 1 0.220
Number of assets owned*** -1.43 0.450 10.16 1 0.001
Number of problem species reported** -1.01 0.452 5.04 1 0.025
Walking distance to firewood (min)* 0.02 0.013 3.10 1 0.078
Walking distance to water (min)*** 0.04 0.015 9.04 1 0.003
Walking distance to neighbors (min)** 0.28 0.109 6.50 1 0.011
Nights slept in agricultural field per year* -0.02 0.009 3.21 1 0.073
Nights slept outdoors per year** 0.03 0.015 3.97 1 0.046
Days per year pigs sighted in village center 0.01 0.005 2.31 1 0.129
Days per year pigs sighted in agricultural field*** 0.03 0.008 10.26 1 0.001
Number of lions prey types sighted*** -0.83 0.270 9.43 1 0.002
Hut safety level 4 (does not sleep in agricultural field)*** -6.80 2.462 7.62 1 0.006
Constant 13.07 4.126 10.03 1 0.002 a These variables were controlled for and therefore never dropped from the model Significance ***p<0.01, **p<0.05, *p<0.10
Results from the logistic regressions for each individual district identify district-
specific risk factors. The logistic regression for Rufiji revealed four main factors that
distinguished attack from non-attack villages (Table 2-3): people in attack villages see
more bush pigs in agricultural fields and village centers, see fewer problem species and
fewer lion prey types, and build weaker structures in agricultural fields than people in
37
non-attack villages. Seven factors that distinguish attack villages in Lindi were identified
by the logistic regression model (Table 2-4): people in attack villages own fewer assets,
walk farther to firewood and water, spend more nights sleeping outdoors for traditional
ceremonies, see bush pigs more frequently in agricultural fields, see fewer types of lion
prey, walk to their agricultural fields on fewer days a year, and built weaker houses.
Table 2-3: Results from logistic regression model for Rufiji district showing district specific risk factors
Variable
B SE Wald df P
Gendera -0.08 0.976 0.01 1 0.933
Agea -0.01 0.034 0.02 1 0.880
Main home located on agricultural fielda -0.64 0.876 0.53 1 0.467
Number of problem species reported* -0.84 0.453 3.40 1 0.065
Days per year pigs sighted in village center* 0.01 0.005 3.66 1 0.056
Days per year pigs sighted in agricultural field** 0.01 0.005 6.00 1 0.014
Number of lions prey types sighted** -0.43 0.191 4.96 1 0.026
Hut safety (does not sleep in agricultural field) 0.17 1.508 0.01 1 0.911
Constant 3.78 2.595 2.12 1 0.145 a These variables were controlled for and therefore never dropped from the model Significance ***p<0.01, **p<0.05, *p<0.10
38
Table 2-4: Results from logistic regression model for Lindi district showing district specific risk factors
Variable
B SE Wald df P
Gendera -2.47 1.457 2.88 1 0.090
Agea -0.03 0.052 0.29 1 0.587
Number of assets owned** -2.01 0.884 5.19 1 0.023
Walking distance to firewood (min)** 0.08 0.032 5.90 1 0.015
Walking distance to water (min)** 0.09 0.034 7.40 1 0.007
Days walked to agricultural field per year* -0.02 0.012 3.72 1 0.054
Nights slept outdoors per year** 0.10 0.045 4.63 1 0.031
Days per year bush pigs sighted in agricultural field** 0.05 0.023 4.85 1 0.028
Number of lions prey types sighted** -1.84 0.801 5.29 1 0.021 House safety (mud/brick/cement house, metal/wood roof & door) 7.51 2 0.023 House safety (mud/brick house, thatch roof, metal/wood door)** 3.78 1.793 4.45 1 0.035
Constant 5.19 4.466 1.35 1 0.245 a These variables were controlled for and therefore never dropped from the model Significance ***p<0.01, **p<0.05, *p<0.10
Variations in Attack Prevention between Village Types and Districts
The two districts showed significant differences in the precautions people took to
protect themselves against lion attacks (X2 = 17.34, p < 0.05) (Figure 2-7). Although in
both Rufiji and Lindi people frequently stated that they stay inside after dark, the
proportion in Rufiji (55%) was lower than in Lindi (79%). In addition, in Rufiji, a larger
proportion of people construct stronger homes and fences (17%), and become more
vigilant (13%). In Lindi, a higher proportion of people reported that they avoided moving
around unnecessarily during the day (11%). Despite these differences between districts,
39
there was no significant difference in precaution responses between attack and non-attack
villages within each district.
Figure 2-7: Measures people take to protect themselves from attacks.
We asked respondents about the effectiveness of measures to prevent attacks by
lions on humans (Figure 2-8). In all of the measures but bush pig control, results from
Rufiji and Lindi were not significantly different. Overall, people thought it would be
effective to build safer structures in agricultural fields (60%), build safer homes (62%),
walk in larger groups (52%), cut tall grass near homes (61%), and erect fences around
their yard to enclose outhouses and cooking areas (66%). People thought it would be
ineffective to avoid sleeping in agricultural fields (44%), change the location of
40
agricultural fields (22%), and cut high grass along commonly used paths (45%). As for
bush pig control, a slight majority (52%) in Rufiji said yes, or yes with stipulations, while
in Lindi, 70% of people said bush pig control would not help prevent attacks (X2 = 6.02,
p < 0.05). In some cases, people stipulated how a particular measure might become more
effective. For example, 19% of interviewees said yard fences would help as long as the
fences were strong or tall.
Figure 2-8: Responses of interviewees when asked if they thought specific actions would help prevent lion attacks.
We stratified responses about effective prevention measures by village type
within each district. In Rufiji, people in attack villages were more likely to think that lion
attacks could be prevented by building safer huts (X2 = 5.43, p < 0.05), not sleeping in
41
agricultural fields (X2 = 4.52, p < 0.05), shifting the location of agricultural fields (X2 =
3.95, p < 0.05), and cutting grass around homes (X2 = 3.92, p < 0.05). In Lindi, people in
attack villages were more likely to think that walking in larger groups would help prevent
attacks (X2 = 4.36, p < 0.05).
Villagers in both districts and in both village types gave statistically similar
responses when questioned on what should be done to reduce lion attacks. Government
assistance was the most common response (42%), which includes providing security,
hunting offending lions, and providing resources to respond to attacks. Only 18%
mentioned killing lions, and 14% mentioned the need for village game scouts to respond
to attacks. Less than 10% of respondents mentioned measures like providing villagers
with guns, more cooperation between villages, personal precautions such as building
stronger homes, advice about conflict mitigation from researchers, and clearing bushes.
Discussion
Qualitative Differences between Districts
Differences in both ecology and culture provide a framework for understanding
risk factors for lion attacks. The villages in Rufiji lie along the Rufiji River, on which the
villagers are dependent for water and food. Although the village centers lie on the north
side of the river, the fertile areas are to the south. This means that people need to cross
the river daily or live in their agricultural fields to tend and protect their crops. Since the
primary livelihood is subsistence agriculture, villagers spend considerable time on the
south side of the river. At the same time, the village centers – schools, shops, people’s
42
homes - and the main road lie to the north of the river, requiring villagers to travel
between the village centers and the agricultural fields. Since most people have a home at
the village center, they build temporary structures on the south side of the river, where
they spend most of their time during harvest seasons for upwards of seven to ten months
per year. The harvest season is a critical time to sleep in agricultural fields, as pests like
bush pigs, warthogs (Phacochoerus africanus), vervet and blue monkeys (Allenopithecus
nigroviridis, Cercopithecus mitis), yellow baboons (Papio cynocephalus), and even
elephants (Loxodonta africana), come regularly to raid crops. Anecdotal evidence from
villagers suggests that lions are predominantly found on the south side of the river and
are at least partially blocked from moving into the villages by the river.
Much like in the Rufiji River Valley, people in the Sudi-Mingoyo Area of Lindi
district subsist mainly on small-scale agriculture, but unlike in Rufiji, they have no clear
physical feature that defines the location of agricultural fields. Thus, agricultural fields
can be anywhere from a five minute walk to a two and a half hour walk each way from
village centers, but overall they tend to be closer to village centers on average than in
Rufiji. In addition, people rarely choose to sleep in their agricultural fields, but rather
spend most of the year in their homes in the village centers. This is most likely because
the main crop pests in Lindi, monkeys, are diurnal and do not require people to protect
crops at night, whereas in Rufiji, one of the main crop pests are bush pigs, a nocturnal
species. Another difference between Rufiji and Lindi is the location of water. Unlike in
Rufiji, people in Lindi do not fetch water from a river; instead, they use water pumps in
43
the village or travel to wells. The distance traveled each way to wells can be as long as an
hour, and even when there are water pumps in the village, they may be dry, causing
people to walk to neighboring villages.
District-Level Variations in Human Activity Patterns during Lion Attacks
Along with an awareness of the ecological and cultural difference between the
districts, data on human activity patterns during lion attacks provides further information
for understanding key differences between Rufiji and Lindi districts. In Rufiji, the
majority of attacks occurred at night, inside structures located in agricultural fields while
people were sitting, resting, or sleeping inside. Victims in Rufiji therefore tended to be
accompanied by other people during the attacks. In Lindi, attacks mostly occurred outside
homes in either the village center or agricultural fields, while people were conducting
various domestic activities or walking along roads and paths outside the village center.
The attacks in Lindi predominantly occurred in the late evening, while individuals were
alone, walking home or preparing to retire for the night.
District-specific conditions explain these results. In Rufiji, the separation created
by the river causes attacks to be located primarily in agricultural fields, where more lions
are present and where people often sleep in unsafe structures. In Lindi, there are no
barriers between agricultural fields and village centers, therefore lions move freely and
attack people in both locations. Since most people in Lindi do not sleep in their
agricultural fields, and since walking distances to resources are quite variable, people are
more susceptible to attack while walking along paths and roads. In addition, since village
44
homes are stronger than structures on agricultural fields, most attacks occur outside
homes.
Village-Level Variation of Risk Factors
It is clear from the analysis of the questionnaire data that human activities and
wildlife presence varies between villages with and without a history of attacks. Since we
chose villages with similar ecological surroundings, these differences should help clarify
the factors that increase the risk of lion attacks. Due to the small number of study
villages, statistical differences could have resulted from chance or unmeasured variables,
however, most of the significant factors relate to obvious risk factors. Additionally,
differences do not come from lion absence, as all villagers reported lions roaming
through their village during the 2001-2004 outbreaks and lion presence was not a
significant variable in any logistic regression models.
Six key determinants emerge from the logistic regression of village-level variation
that combines both districts: distance walked to resources, bush pig presence, wild prey
diversity, sleeping outdoors, socioeconomic variables, and home safety. People in attack
villages walk longer distances to firewood, water, and neighbors than people in villages
without attacks. On average, people will walk 52 min per day for firewood with some
people traveling two hours each way, not including the time spent collecting firewood in
unsafe areas. People usually retrieve water two to three times a day and walk an average
of 20 min each way with some traveling up to two hours to arrive at water. People also
spend time visiting neighbors, traveling an average of about five minutes, though
45
occasionally walking as long as 30 min, often in the evening hours. With no electricity
and lions roaming freely, even a short walk to a neighbor’s house after dark can pose a
significant risk. Distance to agricultural fields was surprisingly not a significant variable
in the model.
People see bush pigs more frequently in attack villages as compared with non-
attack villages. Bush pigs increase the risk of attack in two ways. First, bush pigs are
major nocturnal crop pests that force people to sleep in their agricultural fields and even
leave their huts in the middle of the night to chase bush pigs away. Secondly, bush pigs
are a key lion prey species in places depleted of other prey, drawing lions into human-
dominated areas. To compound things further, the human population of Rufiji and Lindi
is predominantly Muslim, so people will not eat and rarely kill any type of pig. This
ensures that bush pigs thrive in agricultural areas, despite being a major pest. Similar
examples of the relationship between large cats and wild pigs are documented in
Sumatra, another largely Muslim society, where wild pigs (Sus scrofa) draw tigers
(Panthera tigris) into oil palm plantations. Much like with lions, pigs allow tigers to live
in highly disturbed human dominated areas because they thrive as crop pests in the same
areas (Maddox et al. 2003).
People in attack villages see fewer types of other crop pests and lion prey than
people in non-attack villages. Other crop pests include warthogs, monkeys, baboons,
rodents, and elephants. Lion prey includes giraffe (Giraffa camelopardis), Grant’s
and snake. Non-wildlife risks included drought, famine, malaria, and AIDS. I only
questioned respondents about the respective animal species that were present in the study
59
area, so I did not question people in Lindi about hippopotamus and crocodile. In a very
small number of cases, people would indicate that the animals were not present and thus
could not know about its level of risk (this only occurred for buffalo and elephant).
Data were analyzed using SPSS 16.0. I used the chi-square goodness-of-fit test
and analysis of variance (ANOVA) to compare perceptions to demographic data and
perceptions between districts. I used a multivariate ordinal regression to determine the
variables that influence perceived likelihood of attack. The dependent variable in the
ordinal regression model was the response to Question 1 on likelihood of attack, ranked
from 1-3: (1) Not at all likely, (2) Somewhat likely, and (3) Very likely. To compare
perceptions of risk involving locations, times, activities, and people at risk, I plotted the
percent of responses in each category versus the percent of attack cases in each category
for each district. Activity categories of perceptions did not always match activities during
attacks, so I re-coded these categories to match. I could not match five perceived risky
activities with actual attack activities because attack activities are not categorized with
the same specificity. These were left out of the graph (collecting firewood, getting water,
collecting building materials, fishing, and collecting wild tubers). In addition, I combined
farming/guarding crops with sleeping inside in agricultural fields because the main
reason people sleep in their agricultural fields is to farm or guard crops. To compare
years that people remembered as being bad years to actual bad years, I plotted the percent
of responses for a given year against the number of attacks per year. I used chi-square
tests for non-parametric data to determine if differences between responses in the
60
comparison of risks question were significant.
Results
Overall Risk & Factors that Affect Risk Perceptions
Overall, 96.5% of respondents are afraid of being attacked, 69.0% are worried
about being attacked, and 53.2% think they are very likely to be attacked. Given that
there are an average of 15.5 attacks per year in Rufiji and Lindi, that approximately
450,000 people live in both districts, and that the average lifespan in Tanzania is 55.9
years, people have a 0.19% chance of being attacked over their lifetime. There are no
significant differences in response to the three perceptions questions listed above (fear,
worry, likelihood) between people living in an attack or non-attack village or between
people with or without an attack in their family. There is also no significant difference in
perceptions (fear, worry, likelihood) based on proximity to protected areas or sightings of
lions or lion signs in villages or agricultural fields, with one exception: people who see
lion signs in their village are more likely to be worried/very worried about attacks as
compared with those that don’t (X2 = 5.529, p < 0.05). Both males and females are
equally afraid and worried about attacks, but females are more likely than males to think
that they are not at all likely to be attacked (X2 = 10.123, p < 0.01). People with more
education (having completed Standard 5-7) were more afraid (X2 = 13.124a, p < 0.01)
and worried (X2 = 9.978, p < 0.01) about attacks and thought they were more likely to be
attacked (X2 = 12.703, p < 0.05) than those with less education (Standard 1-4) or no
education at all. Although age does not have a significant effect on risk perceptions (fear,
61
worry, likelihood), people who thought attacks had increased were younger on average
than those who thought that attacks had decreased (F = 7.052, p < 0.01).
Results of the multivariate ordinal regression show there are five variables that are
related to a person’s perceived likelihood of attack (Table 3-1): age, acres of land
cultivated, number of livestock owned, gender, and education. An increase in one’s age
and number of livestock owned decreases perceived likelihood of attack, while an
increase in acres of land cultivated and level of education increases perceived likelihood
of attack. In addition, men perceive their likelihood of attack to be higher than do women.
Note that having an attack in the village or family and sighting of lion signs are not
significant.
62
Table 3-1: Results of multivariate ordinal regression assessing perceived likelihood of being attacked
Estimated Coefficient
Estimated Standard Error
p-value 95% CI
Lower Bound
Upper Bound
Threshold Somewhat likely -3.883 1.231 .002 -6.296 -1.469 Very likely -2.288 1.180 .053 -4.601 .025 Location Age** -.056 .021 .007 -.096 -.015 Number of assets owned -.310 .202 .125 -.706 .087 Acres of land cultivated* .369 .147 .012 .081 .658 Number of livestock owned* -.049 .024 .043 -.096 -.001 Male (compared to female)* 1.024 .515 .047 .014 2.034 No education * (compared to S5-7)
-1.392 .556 .012 -2.483 -.302
Standard 1-4 (compared to S5-7)
-.343 .713 .631 -1.740 1.055
No attack in village .256 .478 .592 -.680 1.193 No lion attack in family -.812 .620 .191 -2.028 .404 Never seen a lion in village -.248 .473 .601 -1.176 .680 Never seen a lion in agricultural field
.543 .562 .334 -.559 1.644
Never seen lion signs in village .223 .630 .724 -1.012 1.457 Never seen lion signs in agricultural field
buffalo (2%). These data show that people assess their risk from the mega-herbivores
78
correctly, as elephants, hippopotamus, and buffalo do kill less people than lions.
However, peoples’ tendency to equate the risk of lions as equal to that of leopards and
crocodiles illustrates the tendency to overestimate risk from situations that elicit dread
and fear. The fear that arises when people think about being hunted by a predator creates
a perception that all predators are equally dangerous. Much like the response to questions
about fear and concern over attacks, people may not be responding to actual objective
risk of death or injury but to the fear associated with predatory species. Death from
snakes is harder to quantify than death from larger animals because people often die
before seeking medical attention and cases are not reported to the districts. It is likely that
people are overestimating their risk from snakes as compared to lions because snakes
elicit the same type of dead and fear as predators.
Most people view the danger from drought, famine, malaria, and AIDS to be
greater than that from lions. However, a large number of people also view these risks to
be the same as those posed by lions. This shows that although some people rationally
consider these day-to-day risks to be greater than the danger from lions, many still
exaggerate their risk from lions. According to the United Nations World Food
Programme (2009), 58% of Tanzania’s population lives on less than $1 a day, 44% are
undernourished, and 38% of children under five are malnourished. The country is also
plagued with irregular rainfall and 1.4 million people (3.4% of the total population) are
living with HIV/AIDS (World Food Programme 2009). Considering these statistics, it is
remarkable that almost 40% of the interviewees perceive the risk from lion attacks to be
79
the same as drought, famine, malaria, and AIDS. This again highlights peoples’ tendency
to overestimate infrequent dramatic causes of death while underestimating more mundane
common risks (Johnson & Tversky 1983). Similarly, numerous studies on perceived
versus actual crop damage have found that people perceive more visible and extreme
damage to be worse than continuous damage (Conover 1994; Naughton-Treves 1997;
Gillingham & Lee 2003; Naughton-Treves & Treves 2005; Linkie et al. 2007). An
example is that people perceive elephants to be the worst crop pests even though
monkeys, pigs, and even livestock cause more economic loss (Naughton-Treves 1997).
Conclusion
People in Rufiji and Lindi districts overestimate their risk from lion attacks,
which is consistent with literature on risk perceptions of other spectacular though rare
events. It is not that people are irrational but rather that they are responding to the unique
and terrifying nature of such events. In fact, when questioned about specifics of risk,
people are very aware of where and when they are at risk. This study highlights the
importance of using multiple types of questions to uncover risk perceptions, because a
narrow survey might only capture the overall level of fear and not identify people’s
ability to accurately asses risk and the high level of local knowledge about such events.
The findings of this study also have management implications. Since the majority
of the population is concerned about attacks, management officials will be able to
implement prevention efforts just as easily in communities with a history of attacks as
those without attacks. This is necessary because all rural residents of high-risk areas
80
should take precautions because attacks could occur in new areas due to changes in the
landscape or human activity patterns. Details about the specific locations and activities
that people incorrectly estimate also point to areas to focus community education and
prevention. For example, people in both districts underestimate their attack risk near their
homes. Although such attacks are not as common as those in agricultural fields or
walking in the village periphery, people need to understand their risks and be encouraged
to build fences that enclose their cooking area and outdoor toilet. Such details highlight
the importance of considering local perceptions when developing management strategies
to reduce human-wildlife conflict.
81
REFERENCES
Bagchi S. and C. Mishra. 2006. Living with large carnivores: predation on livestock by the snow leopard (Uncia uncia). Journal of zoology 268(3):217-224.
Baird T. D., P. W. Leslie, and J. T. McCabe. 2009. The Effect of Wildlife Conservation on Local Perceptions of Risk and Behavioral Response. Human Ecology 37(4):463-474.
Baldus R. D. 2006. A man-eating lion (Panthera leo) from Tanzania with a toothache. European Journal of Wildlife Research 52(1):59-62.
Baldus R.D. 2004. Lion conservation in Tanzania leads to serious human-lion conflicts: with a case study of a man-eating lion killing 35 People. GTZ Wildlife Programme, Tanzania, Wildlife Division, Dar es Salaam, Tanzania. Wildlife Discussion Paper No. 41:1-63.
Bauer H. 2003. Local perceptions of Waza National Park, northern Cameroon. Environmental Conservation 30(2):175-181.
Bauer H. and S. Van Der Merwe. 2004. Inventory of free-ranging lions Panthera leo in Africa. Oryx 38(1):26-31.
Beyer, H. L. 2004. Hawth's Analysis Tools for ArcGIS. Available from http://www.spatialecology.com/htools (accessed February 2009).
Butler J. R. A. 2000. The economic costs of wildlife predation on livestock in Gokwe communal land, Zimbabwe. African Journal of Ecology 38(1):23-30.
Chardonnet P. 2002. Conservation of the African Lion: contribution to a status survey. International Foundation for the Conservation of Wildlife, France and Conservation Force, USA.
Conforti V. A. and F. C. C. de Azevedo. 2003. Local perceptions of jaguars (Panthera onca) and pumas (Puma concolor) in the Iguacu National Park area, south Brazil. Biological Conservation 111(2):215-221.
Conover M. R. 1994. Perceptions of Grass-Roots Leaders of the Agricultural Community about Wildlife Damage on their Farms and Ranches. Wildlife Society Bulletin 22(1):94-100.
82
Dar N. I., R. A. Minhas, Q. Zaman, and M. Linkie. 2009. Predicting the patterns, perceptions and causes of human–carnivore conflict in and around Machiara National Park, Pakistan. Biological Conservation 142(10):2076-2082.
Fall M. W. and W. B. Jackson. 2002. The tools and techniques of wildlife damage management - changing needs: an introduction. International Biodeterioration & Biodegradation 49(2-3):87-91.
Fascione N., A. Delach, and M. E. Smith. 2004. Introduction: People and Predator: from conflict to coexistence. Pages 1-8 In N. Fascione, A. Delach, and M. E. Smith, editors. People and predators: from conflict to coexistence, Island Press, Washington DC.
Fischhoff B., A. Bostrom, and M. J. Quadrel. 1993. Risk Perception and Communication. Annual Review of Public Health 14:183-203.
Gadd M. E. 2005. Conservation outside of parks: Attitudes of local people in Laikipia, Kenya. Environmental Conservation 32(1):50-63.
Gillingham S. and P. C. Lee. 2003. People and protected areas: a study of local perceptions of wildlife crop-damage conflict in an area bordering the Selous Game Reserve, Tanzania. Oryx 37(3):316-325.
Gore M. L., W. F. Siemer, J. E. Shanahan, D. Scheufele, and D. J. Decker. 2005. Effects on risk perception of media coverage of a black bear-related human fatality. Wildlife Society Bulletin 33(2):507-516.
Gore M. L., B. A. Knuth, P. D. Curtis, and J. E. Shanahan. 2006. Stakeholder perceptions of risk associated with human-black bear conflicts in New York's Adirondack Park campgrounds: Implications for theory and practice. Wildlife Society Bulletin 34(1):36-43.
Gurung B., J. L. D. Smith, C. McDougal, J. B. Karki, and A. Barlow. 2008. Factors associated with human-killing tigers in Chitwan National Park, Nepal. Biological Conservation 141(12):3069-3078.
Henderson D. W., R. J. Warren, D. H. Newman, J. M. Bowker, J. S. Cromwell, and J. J. Jackson. 2000. Human perceptions before and after a 50% reduction in an urban deer herd's density. Wildlife Society Bulletin 28(4):911-918.
Holmern T., J. Nyahongo, and E. Roskaft. 2007. Livestock loss caused by predators outside the Serengeti National Park, Tanzania. Biological Conservation 135(4):518-526.
83
Hopcraft J. G. C., A. R. E. Sinclair, and C. Packer. 2005. Planning for success: Serengeti lions seek prey accessibility rather than abundance. Journal of Animal Ecology 74(3):559-566.
Ikanda D. and C. Packer. 2008. Ritual vs. retaliatory killing of African lions in the Ngorongoro Conservation Area, Tanzania. Endangered Species Research 6(1):67-74.
Ikanda D. K. In prep. Large carnivore attacks and the human-carnivore conflict. In E. J. Gereta and E. Roskaft, editors. Biodiversity in poor countries rich in natural resources; an African outlook, Tapir Forlag, Trondheim, Norway.
Johnson E. J. and A. Tversky. 1983. Affect, Generalization, and the Perception of Risk. Journal of Personality and Social Psychology 45(1):20-31.
Kaltenborn B. P., T. Bjerke, and J. Nyahongo. 2006. Living with Problem Animals: Self-Reported Fear of Potentially Dangerous Species in the Serengeti Region, Tanzania. Human Dimensions of Wildlife 11(6):397-409.
Kissui B. M. 2008. Livestock predation by lions, leopards, spotted hyenas, and their vulnerability to retaliatory killing in the Maasai steppe, Tanzania. Animal Conservation 11(5):422-432.
Kleiven J., T. Bjerke, and B. P. Kaltenborn. 2004. Factors influencing the social acceptability of large carnivore behaviours. Biodiversity and Conservation 13(9):1647-1658.
Kolowski J. M. and K. E. Holekamp. 2006. Spatial, temporal, and physical characteristics of livestock depredations by large carnivores along a Kenyan reserve border. Biological Conservation 128(4):529-541.
Kretser H. 2008. The exurban frontier: anticipating human-wildlife interactions where we live, work, and play [dissertation]. Ithaca, NY, Cornell University.
Kretser H. E., P. D. Curtis, J. D. Francis, R. J. Pendall, and B. A. Knuth. 2009. Factors affecting perceptions of human-wildlife interactions in residential areas of northern New York and implications for conservation. Human Dimensions of Wildlife 14(2):102-118.
Kretser H. E., P. J. Sullivan, and B. A. Knuth. 2008. Housing density as an indicator of spatial patterns of reported human-wildlife interactions in Northern New York. Landscape and Urban Planning 84(3/4):282-292.
Kuriyan R. 2002. Linking local perceptions of elephants and conservation: Samburu pastoralists in northern Kenya. Society & Natural Resources 15(10):949-957.
84
Kushnir H., H. Leitner, D. Ikanda, and C. Packer. 2010. Human and ecological risk factors for unprovoked lion attacks on humans in southeastern Tanzania. Human Dimensions of Wildlife. 15(5). In press.
Linkie M., Y. Dinata, A. Nofrianto, and N. LeaderWilliams. 2007. Patterns and perceptions of wildlife crop raiding in and around Kerinci Seblat National Park, Sumatra. Animal Conservation 10(1):127-135.
Loe J. and E. Roskaft. 2004. Large carnivores and human safety: A review. Ambio 33(6):283-288.
Loewenstein G. F., E. U. Weber, C. K. Hsee, and N. Welch. 2001. Risk as feelings. Psychological bulletin 127(2):267-286.
Lucherini M. and M. J. Merino. 2008. Perceptions of human-carnivore conflicts in the High Andes of Argentina. Mountain Research and Development 28(1):81-85.
Maddox T.M., Gemita E., Wijamukti S., Selampassy A. 2003. Pigs, palms, people, and tigers: survival of the Sumatran tiger in a commercial landscape. Conservation Programmes, Zoological Society of London, Regents Park, London.
Madhusudan M. D. 2003. Living amidst large wildlife: livestock and crop depredation by large mammals in the interior villages of Bhadra Tiger Reserve, south India. Environmental management 31(4):466-475.
Manfredo M. J., H. C. Zinn, L. Sikorowski, and J. Jones. 1998. Public acceptance of mountain lion management: a case study of Denver, Colorado, and nearby foothills areas. Wildlife Society Bulletin 26(4):964-970.
Marker L. L., M. G. L. Mills, and D. W. Macdonald. 2003. Factors influencing perceptions of conflict and tolerance toward cheetahs on Namibian farmlands. Conservation Biology 17(5):1290-1298.
McIvor D. E. and M. R. Conover. 1994. Perceptions of farmers and non-farmers toward management of problem wildlife. Wildlife Society Bulletin 22(2):212-219.
Meine C. 2009. Early Wolf Research and Conservation in the Great Lakes Region. Pages 1-14 In A. P. Wydeven, T. R. Van Deelen, and E. J. Heske, editors. Recovery of gray wolves in the Great Lakes Region of the United States: an endangered species success story, Springer, New York.
Meriggi A. and S. Lovari. 1996. A review of wolf predation in southern Europe: does the wolf prefer wild prey to livestock? Journal of Applied Ecology 33(6):1561-1571.
85
Michalski F., R. L. P. Boulhosa, A. Faria, and C. A. Peres. 2006. Human-wildlife conflicts in a fragmented Amazonian forest landscape: determinants of large felid depredation on livestock. Animal Conservation 9(2):179-188.
Mosser A. and C. Packer. 2009. Group territoriality and the benefits of sociality in the African lion. Animal Behavior 78(2):359-370.
Mosser A., J. Fryxell, L. Eberly, and C. Packer. 2009. Serengeti real estate: density versus fitness-based indicators of lion habitat quality. Ecology Letters 12(10):1050-1060.
Naughton-Treves L., A. Treves. 2005. Socio-ecological factors shaping local support for wildlife: crop-raiding by elephants and other wildlife in Africa. Pages 252-277 In R. Woodroffe, S. Thirgood, and A. Rabinowitz, editors. People and Wildlife: Conflict or Coexistence? Cambridge University Press, Cambridge, UK.
Naughton-Treves L. 1998. Predicting patterns of crop damage by wildlife around Kibale National Park, Uganda. Conservation Biology 12(1):156-168.
Naughton-Treves L. 1997. Farming the forest edge: Vulnerable places and people around Kibale National Park, Uganda. Geographical Review 87(1):27-46.
Nielsen S. E., S. Herrero, M. S. Boyce, R. D. Mace, B. Benn, M. L. Gibeau, and S. Jevons. 2004. Modeling the spatial distribution of human-caused grizzly bear moralities in the Central Rockies ecosystem of Canada. Biological Conservation 120(1):101-113.
Nyhus P. J. and R. Tilson. 2004. Characterizing human-tiger conflict in Sumatra, Indonesia: implications for conservation. Oryx 38(1):68-74.
Odden J., I. Herfindal, J. D. C. Linnell, and R. Andersen. 2008. Vulnerability of domestic sheep to lynx depredation in relation to roe deer density. Journal of Wildlife Management 72(1):276-282.
Ogada M. O., R. Woodroffe, N. O. Oguge, and L. G. Frank. 2003. Limiting depredation by African carnivores: the role of livestock husbandry. Conservation Biology 17(6):1521-1530.
Ogutu J. O. and H. T. Dublin. 2004. Spatial dynamics of lions and their prey along an environmental gradient. African Journal of Ecology 42(1):8-22.
Packer C., D. Ikanda, B. Kissui, and H. Kushnir. 2005. Lion attacks on humans in Tanzania. Nature 436(7053):927-928.
86
Packer C., H. Brink, B. M. Kissui, H. Maliti, H. Kushnir, and T. Caro. In review. The impact of trophy hunting on lion and leopard populations in Tanzania. Conservation Biology.
Patterson B. D., E. J. Neiburger, and S. M. Kasiki. 2003. Tooth breakage and dental disease as causes of carnivore-human conflicts. Journal of Mammalogy 84(1):190-196.
Patterson B. D., S. M. Kasiki, E. Selempo, and R. W. Kays. 2004. Livestock predation by lions (Panthera leo) and other carnivores on ranches neighboring Tsavo National Parks, Kenya. Biological Conservation 119(4):507-516.
Peterhans J. C. K. and T. P. Gnoske. 2001. The science of ‘man-eating’ among lions Panthera Leo with a reconstruction of the natural history of the ‘Man-Eaters of Tsavo’. Journal of East African Natural History 90:1-40.
Quigley H., S. Herrero. 2005. Characterization and prevention of attacks on humans. Pages 27-48 In R. Woodroffe, S. Thirgood, and A. Rabinowitz, editors. People and Wildlife: Conflict or Coexistence? Cambridge University Press, Cambridge, UK.
Saberwal V. K., J. P. Gibbs, R. Chellam, and A. J. T. Johnsingh. 1994. Lion human conflict in the Gir Forest, India. Conservation Biology 8(2):501-507.
Sangay T. and K. Vernes. 2008. Human-wildlife conflict in the Kingdom of Bhutan: Patterns of livestock predation by large mammalian carnivores. Biological Conservation 141(5):1272-1282.
Schaller G. B. 1972. The Serengeti lion. University of Chicago Press, Chicago.
Slovic P. 2001. The risk game (Reprinted from 'The risk game'). Journal of hazardous materials 86(1-3):17-24.
Slovic P. 1997. Public perception of risk. Journal of Environmental Health 59(9):22-25.
Slovic P. 1987. Perception of Risk. Science 236(4799):280-285.
Slovic P., E. Peters, M. L. Finucane, and D. G. MacGregor. 2005. Affect, risk, and decision making. Health Psychology 24(4):S35-S40.
Slovic P. and E. Peters. 2006. Risk perception and affect. Current Directions in Psychological Science 15(6):322-325.
Slovic P., M. L. Finucane, E. Peters, and D. G. MacGregor. 2007. The affect heuristic. European Journal of Operational Research 177(3):1333-1352.
87
Spong G. 2002. Space use in lions, Panthera leo, in the Selous Game Reserve: social and ecological factors. Behavioral Ecology and Sociobiology 52(4):303-307.
Stahl P., J. M. Vandel, V. Herrenschmidt, and P. Migot. 2001. Predation on livestock by an expanding reintroduced lynx population: long-term trend and spatial variability. Journal of Applied Ecology 38(3):674-687.
Stout R. J., R. C. Stedman, D. J. Decker, and B. A. Knuth. 1993. Perceptions of Risk from Deer-Related Vehicle Accidents - Implications for Public Preferences for Deer Herd Size. Wildlife Society Bulletin 21(3):237-249.
Tate R. B., N. Fernandez, A. Yassi, M. Canizares, J. Spiegel, and M. Bonet. 2003. Change in health risk perception following community intervention in Central Havana, Cuba. Health promotion international 18(4):279-286.
Treves A. and K. U. Karanth. 2003a. Special section: Human-carnivore conflict: Local solutions with global applications. Conservation Biology 17(6):1489-1490.
Treves A. and K. U. Karanth. 2003b. Human-carnivore conflict and perspectives on carnivore management worldwide. Conservation Biology 17(6):1491-1499.
Treves A., L. Naughton-Treves, E. K. Harper, D. J. Mladenoff, R. A. Rose, T. A. Sickley, and A. P. Wydeven. 2004. Predicting human-carnivore conflict: a spatial model derived from 25 years of data on wolf predation on livestock. Conservation Biology 18(1):114-125.
Thornton, C. & M.S. Quinn. 2010. Risk Perceptions and public attitudes towards cougars in the southern foothills of Alberta. Human Dimensions of Wildlife. In Press.
Vijayan S. and B. P. Pati. 2002. Impact of changing cropping patterns on man-animal conflicts around Gir protected area with specific reference to Talala sub-district, Gujarat, India. Population and Environment 23(6):541-559.
Wade D. J., B. C. Mwasaga, and P. F. J. Eagles. 2001. A history and market analysis of tourism in Tanzania. Tourism Management 22(1):93-101.
Wang S. W. and D. W. Macdonald. 2006. Livestock predation by carnivores in Jigme Singye Wangchuck National Park, Bhutan. Biological Conservation 129(4):558-565.
Wang Y. Q., J. Tobey, G. Bonynge, J. Nugranad, V. Makota, A. Ngusaru, and M. Traber. 2005. Involving geospatial information in the analysis of land-cover change along the Tanzania coast. Coastal Management 33(1):87-99.
88
West B. C. and J. A. Parkhurst. 2002. Interactions between deer damage, deer density, and stakeholder attitudes in Virginia. Wildlife Society Bulletin 30(1):139-147.
Wilson S. M., M. J. Madel, D. J. Mattson, J. M. Graham, and T. Merrill. 2006. Landscape conditions predisposing grizzly bears to conflicts on private agricultural lands in the western USA. Biological Conservation 130(1):47-59.
Wilson S. M., M. J. Madel, D. J. Mattson, J. M. Graham, J. A. Burchfiled, and J. M. Belsky. 2005. Natural landscape features, human-related attractants, and conflict hotspots: a spatial analysis of human-grizzly bear conflicts. Ursus 16(1):117-129.
Windschitl P. D. 2002. Judging the accuracy of a likelihood judgment: The case of smoking risk. Journal of Behavioral Decision Making 15(1):19-35.
Woodroffe R. and L. G. Frank. 2005. Lethal control of African Lions (Panthera leo): local and regional population impacts. Animal Conservation 8(1):91-98.
Woodroffe R. 2001. Strategies for carnivore conservation: lessons from contemporary extinctions. Pages 61-92 In J. L. Gittleman, S. M. Funk, D. Macdonald, and R. K. Wayne, editors. Carnivore conservation, Cambridge University Press, Cambridge, England.
Woodroffe R. 2000. Predators and people: using human densities to interpret declines of large carnivores. Animal Conservation 3:165-173.
Woodroffe R. and J. R. Ginsberg. 1998. Edge effects and the extinction of populations inside protected areas. Science 280(5372):2126-2128.
Woodroffe R., P. Lindsey, S. Romanach, A. Stein, and S. M. K. ole Ranah. 2005a. Livestock predation by endangered African wild dogs (Lycaon pictus) in northern Kenya. Biological Conservation 124(2):225-234.
Woodroffe R., S. Thirgood, and A. Rabinowitz. 2005b. The impact of human-wildlife conflict on natural systems. Pages 1-12 In R. Woodroffe, S. Thirgood, and A. Rabinowitz, editors. People and Wildlife: Conflict or Coexistence? Cambridge University Press, Cambridge, UK.
World Food Programme. 2009. United Republic of Tanzania. United Nations World Food Programme, Rome, Italy. Available from http://www.wfp.org/countries/tanzania-united-republic (accessed September 2009).
Wydeven A. P., A. Treves, B. Brost, and J. E. Wiedenhoeft. 2004. Characteristics of Wolf Packs in Wisconsin: Identification of Trains Influencing Depredation. Pages
89
28-50 In N. Fascione, A. Delach, and M. E. Smith, editors. People and predators: from conflict to coexistence, Island Press, Washington DC.
Yamazaki K. and T. Bwalya. 1999. Fatal lion attacks on local people in the Luangwa Valley, Eastern Zambia. South African Journal of Wildlife Research 29(1):19-21.
Zinn H. C. and C. L. Pierce. 2002. Values, gender, and concern about potentially dangerous wildlife. Environment and Behavior 34(2):239-256.
90
APPENDIX 1: Predicted Attacks versus Actual Attacks per Ward
District
Ward
Predicted Attacks
Actual Attacks
Kilwa Chumo 1.02 0 Kilwa Kandawale 0.46 4 Kilwa Kijumbi 0.96 0 Kilwa Kikole 1.39 0 Kilwa Kipatimu 1.96 2 Kilwa Kiranjeranje 0.86 8 Kilwa Kivinje Singino 0.98 0 Kilwa Lihimalyao 0.23 0 Kilwa Likawage 1.43 2 Kilwa Mandawa 2.04 4 Kilwa Masoko 0.21 0 Kilwa Miguruwe 3.23 0 Kilwa Mingumbi 0.61 0 Kilwa Miteja 0.42 0 Kilwa Mitole 0.99 0 Kilwa Nanjirinji 3.48 0 Kilwa Njinjo 0.79 1 Kilwa Pande 0.56 1 Kilwa Tingi 0.37 0 Lindi Chiponda 2.29 0 Lindi Chlkonji 3.14 0 Lindi Kilolambwani 5.86 0 Lindi Kitomanga 3.20 8 Lindi Kiwalala 3.07 1 Lindi Kiwawa 4.35 7 Lindi Lindi Urban 4.97 3 Lindi Mandwanga 2.69 5 Lindi Matimba 5.47 9 Lindi Mbanja 4.41 0 Lindi Mchinga 14.62 10 Lindi Milola 10.85 7 Lindi Mingoyo 2.13 1 Lindi Mipingo 19.52 13 Lindi Mnara 6.08 1 Lindi Mnolela 8.41 27 Lindi Mtama 5.03 4 Lindi Mtua 1.83 3 Lindi Nachunyu 13.10 18
7. Level of education completed_____________________________________________
8. Main occupation of household head
9. Total number of people living in the household ___ a. Number of adults____ b.
Number of children ____
94
Section B: Home & Assets
10. Do you own or rent your home? __Own(00) __Rent(01) __Owned by Family
Member(02)
11. Does your household own any of the following assets (prompt)? If so, how many?
# Assets Number 01 Generator 02 Water tank 03 Sewing machine 04 Radio 05 Cell phone 06 Bicycle 07 Motorcycle 08 Canoe (Rufiji Only) 09 Farm land cultivated and fallow (list amount in acres) – Farm 1 09 Farm land cultivated and fallow (list amount in acres) – Farm 2 10 Fence around your back yard enclosing your toilet and cooking
area
If yes, why?
Section C: Livestock & Agriculture
12. What livestock does your household own (prompt)? Where are they kept?
# Type Number Where are they kept? Village(00), Shamba(01), Both(03)
Other specify(99) 01 Cattle 02 Goats 03 Sheep 04 Chickens/Chicks 05 Dogs 06 Ducks 07 Donkey 99 Other specify
13. In the last 12 months, how much land did your household cultivate?
Farm1____ Acres, Farm 2____ Acres
95
14. In the last 12 months, what crops did your household plant (do not prompt)? In what
months where they planted and harvested? And, how many sacks were harvested?
24. Which months do you walk to our shamba and for how many days each month?
Month 1 2 3 4 5 6 7 8 9 10 11 12 Tick if you walk to your field
How many days that month
25. When sleeping in your shamba do you sleep in any sort of structure or hut? __No(00)
__Yes(01)
97
26. If you sleep in a stricture or hut, what materials were used to build it (do not prompt,
tick only one each)?
Materials Hut 1 Hut 2 Hut 3 Hut 4 a. Walls 01 Palm and poles 02 Mud and poles 03 Mud bricks 04 Grass and poles 99 Other specify b. Floor 01 Earth/Clay 02 Cement 03 Poles and mats 99 Other specify c. Roof 01 Palm and poles 02 Corrugated metal 03 Grass and poles 04 None 99 Other specify d. Door 01 Palm and poles 02 Tarp/Cloth/Mat 03 Corrugated Metal 04 Grass and poles 05 Wood 06 Poles 07 None 99 Other Specify e. Elevated? 00 No if Yes note how high (m)
27. Do you have an outdoor toilet near your hut in your shamba? __No(00) __Yes(01)
a. If no, how far from your hut to you go to relieve yourself ________Meters
98
28. If you have an outdoor toilet, what materials were used to build your toilet (do not
prompt, tick only one)?
Materials Toilet 1 Toilet 2 Toilet 3 Toilet 4 a. Walls 01 Palm and poles 02 Mud and poles 03 Mud bricks 04 Grass and poles 99 Other specify b. Floor 01 Earth/Clay 02 Cement 03 Poles and mats 99 Other specify c. Roof 01 Palm and poles 02 Corrugated metal 03 Grass and poles 04 None 99 Other specify d. Door 01 Palm and poles 02 Tarp/Cloth/Mat 03 Corrugated Metal 04 Grass and poles 05 Wood 06 Poles 07 None 99 Other Specify e. Corresponding hut # from above
f. Distance from corresponding hut
99
Section E: Daily Activities
29. When you are staying in your shamba, do you ever do the following (prompt)? If so,
what time of day do you usually do it? How often do you do it? And, how far do you
go to do it?
# Activity N(00) Y(01)
Time of
day
# Times a week
How far
(km)
Travel time (min)
Notes
01 Collect firewood
02 Get water 04 Visit a
neighbor
05 Go to town 99 Go to other
Shamba
99 Other specify
99 Other specify
30. When you are staying in your main house, do you ever do the following (prompt)? If
so, what time of day do you usually do it? How often do you do it? And, how far do
you go to do it?
# Activity N(00) Y(01)
Time of
day
# Times a week
How far
(km)
Travel time (min)
Notes
01 Collect firewood
02 Get water 04 Visit a
neighbor
05 Go to town 99 Go to other
Shamba
99 Other specify
99 Other specify
100
31. Which of the following activities do your children do on a daily basis (prompt)? )? If
they do the activity, what time of day do they usually do it? How often do they do it?
And, how far do they go to do it?
# Activity N(00) Y(01)
Time of
day
# Times a week
How far
(km)
Travel time (min)
Notes
01 Collect firewood
02 Get water 03 Go to the
shop
07 Go to shamba 08 Herd
livestock
09 Play outside 10 Go to school 99 Other specify
99 Other specify
32. Which of the following activities the elderly in your family do on a regular basis
(prompt)? If they do the activity, what time of day do they usually do it? How often
do they do it? And, how far do they go to do it?
# Activity N(00) Y(01)
Time of
day
# Times a week
How far
(km)
Travel time (min)
Notes
01 Collect firewood
02 Get water 03 Go to the
shop
04 Visit neighbors
07 Go to shamba 08 Herd
livestock
99 Other specify
101
Section F: Being Outside While Dark
33. Do you do the following activities outdoors after sundown (prompt)? Until what
time? Are there any other reasons why you are outside after dark?
Activity Main Home (00) Shamba (01) #
N(00) Y(01)
Until what time N(00) Y(01)
Until what time
01 Bathing 02 Cooking/Eating 03 Sitting/Resting 99 Other specify
34. Do you do any activities outdoors between 5AM and 7AM (prompt)? If so, when?
Activity
Main Home (00) Shamba (01) # Starting at what time Starting at what time 99 99 99
35. Do you use the outdoor toilet/or relieve yourself after dark? __No(00) __Yes(01)
a. If so, how many times after dark do you go? _______
36. Are there any occasions when you sleep outdoors at night? __No(00) __Yes(01)
37. If you sleep outdoors at night, on what occasions (do not prompt)? (Tick all that
apply)
# Activity Tick How many nights a year? 01 Traditional Ceremonies 02 Weddings 03 Funerals 04 Fishing 05 Hunting 06 Collecting Timber 99 Other specify
102
Section G: Wildlife
38. Have you seen lions in the village? __No(00) __Yes(01) (Actual lions, not just
evidence of them)
39. Have you seen lions in the shambas? __No(00) __Yes(01) (Actual lions, not just
evidence of them)
40. If you have seen lions in your village or shamba, when did you see them? (list each
sighting)
Number of lions
When? Month/Season & Year
Location Village(00), Shamba(01), Other specify(99)
41. Have you seen signs of lions in the village? __No(00) __Yes(01) (Foot prints or
roaring)
42. Have you seen sign of lions in the shambas? __No(00) __Yes(01) (Foot prints or
roaring)
43. How often do you see signs of lions in your village or shamba during each season?
Season Times a Month? a. In Village (00) b. In Shamba (01)
00 Wet Season
01 Dry Season
44. Do you think the number of lions have increased or decreased in this village during
your lifetime?
__Increase(01) __Decrease(02) __Same(03) __Don’t Know(04) a. Why? ________
71. Do you think doing the following things would reduce the risk of lion attacks
(prompt)?
# Activity N(00) Y(01)
Don’t Know(02)
Reason
01 Build different, safer makeshift huts
02 Build safer houses
03 Not sleeping in shamba
04 Changing location of shambas
05 Better bush pig control
06 Walking in large groups
07 Cutting high grass near home
08 Cutting high grass along commonly used paths
09 Building a fence around your home that encloses your outdoor toilet and cooking area
108
Section I: Observation
72. What materials were used to build the house and toilet at the interview location (Tick
only one each)?
Materials House (00) Toilet (01) a. Walls 01 Palm and poles 02 Mud and poles 03 Mud bricks 04 Grass and poles 99 Other specify b. Floor 01 Earth/Clay 02 Cement 03 Poles and mats 99 Other specify c. Roof 01 Palm and poles 02 Corrugated metal 03 Grass and poles 04 None 99 Other specify d. Door 01 Palm and poles 02 Tarp/Cloth/Mat 03 Corrugated Metal 04 Grass and poles 05 Wood 06 Poles 07 None 99 Other Specify
73. How far is the outdoor toilet from the home? ___Meters
74. Is there a fence around the backyard that encloses the cooking area and toilet?
__No(00) __Yes(01)
a. If yes, what materials were used to build it (check only one)? __Poles(01)