47
Lipidomics at Baker Heart and Diabetes Institute: from discovery to translation Peter Meikle 12 September 2017
Lipidomics at Baker Heart and Diabetes Institute:
from discovery to translation
Peter Meikle
12 September 2017
Overview
• Lipidomics: technology and strategy
• Biomarker discovery and translation
• Lipid metabolism: Therapeutic intervention strategies
Lipidomics: technology and strategy
Plasma lipidomics at Baker Institutephospholipid
cholesterolester
triglyceride
ApoA-I
LCAT
cholesterol
Triacylglycerol 16:0/16:0/16:0
Phosphatidylcholine 16:0/18:0Ceramide (d18:1/16:0)1-palmitoyl-2-(5'-oxo-valeroyl)-sn-glycero-3-phosphocholine (POVPC)
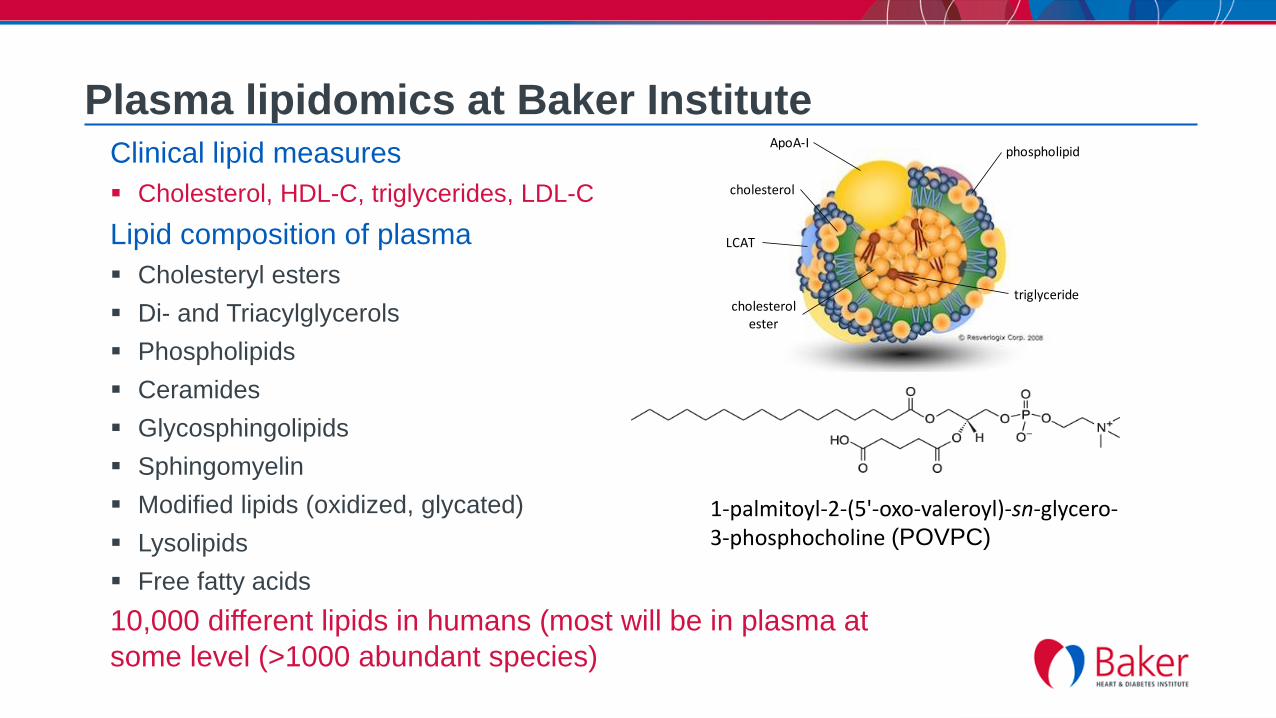
Clinical lipid measures
Cholesterol, HDL-C, triglycerides, LDL-C
Lipid composition of plasma
Cholesteryl esters
Di- and Triacylglycerols
Phospholipids
Ceramides
Glycosphingolipids
Sphingomyelin
Modified lipids (oxidized, glycated)
Lysolipids
Free fatty acids
10,000 different lipids in humans (most will be in plasma at
some level (>1000 abundant species)
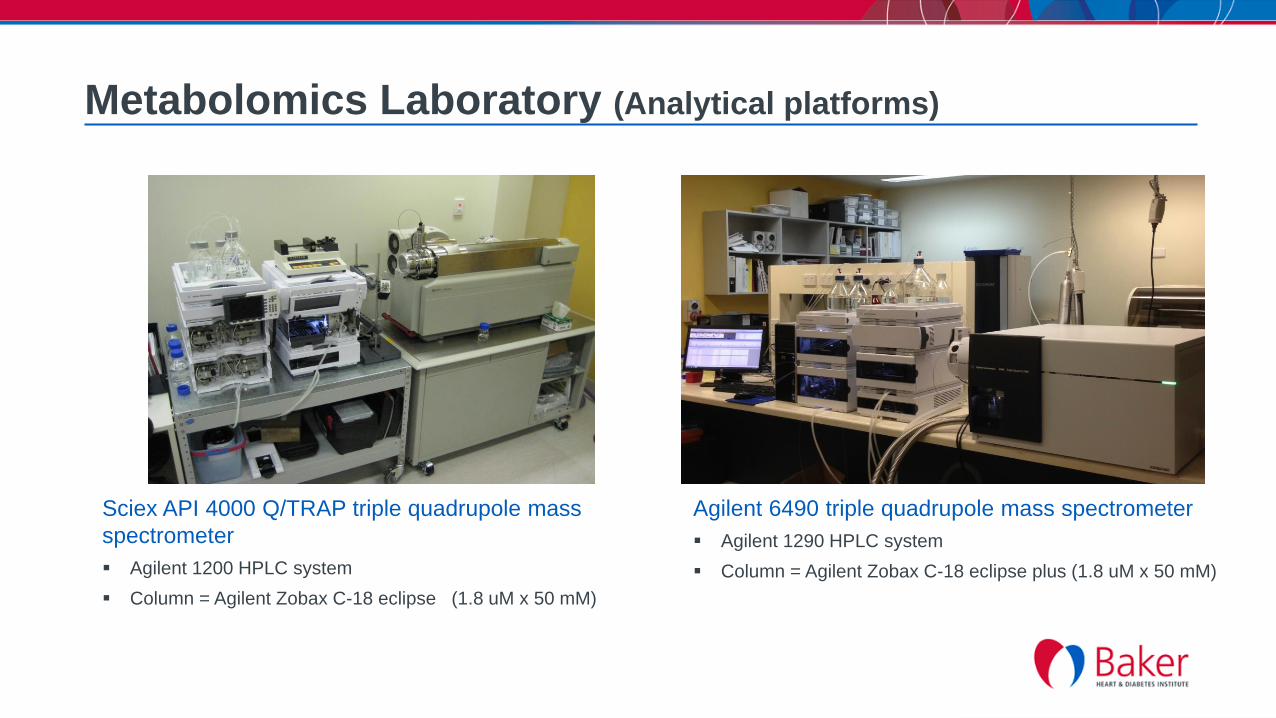
Metabolomics Laboratory (Analytical platforms)
Sciex API 4000 Q/TRAP triple quadrupole mass
spectrometer
Agilent 1200 HPLC system
Column = Agilent Zobax C-18 eclipse (1.8 uM x 50 mM)
Agilent 6490 triple quadrupole mass spectrometer
Agilent 1290 HPLC system
Column = Agilent Zobax C-18 eclipse plus (1.8 uM x 50 mM)

Metabolomics Laboratory (High throughput lipidomics)
Lipid extraction (10 µL plasma)1
Addition of stable isotope/non-physiological standards
Single phase BuOH/MeOH
Centrifuge (supernatant)
LC-MS/MS
Lipid quantification (relative)2
LC ESI-MS/MS
Stable isotope dilution (non-physiological)
Multiple reaction monitoring (scheduled)
>600 lipid species (15 min)
1 Alshehry et al. An efficient single phase method for the extraction of plasma lipids. Metabolites. 2015;5:(2)389-403.
2 Weir et al. Plasma lipid profiling in a large population-based cohort. Journal of lipid research. 2013;54:(10)2898-2908.

Plasma lipid MRM experiment (20min LC gradient)XIC of +MRM (432 pairs): 385.000/159.000 amu Expected RT: 7.6 I... Max. 465.7 cps.
2 4 6 8 10 12 14 16 18
Time, min
0.0
2.0e5
4.0e5
6.0e5
8.0e5
1.0e6
1.2e6
1.4e6
1.6e6
1.8e6
2.0e6
2.2e6
Inte
ns
ity, c
ps
7.20 7.60
%B
100
80
60
40
20
0
• Current capabilities >600 lipid species in 15 min

Separation of isobaric and isomeric speciesXIC of +MRM (159 pairs): 766.539/184.100 amu Expected RT: 0.0 I... Max. 1.1e6 cps.
8.5 9.0 9.5 10.0 10.5 11.0 11.5
Time, min
0.00
1.00e5
2.00e5
3.00e5
4.00e5
5.00e5
6.00e5
7.00e5
8.00e5
9.00e5
1.00e6
1.10e6
Inte
ns
ity, c
ps
10.19
9.70
PhospholipidsSeparation of acyl / alkyl / alkenyl species of the same nominal mass
PC(35:5)PC(O-36:5)
PC(P-36:4)
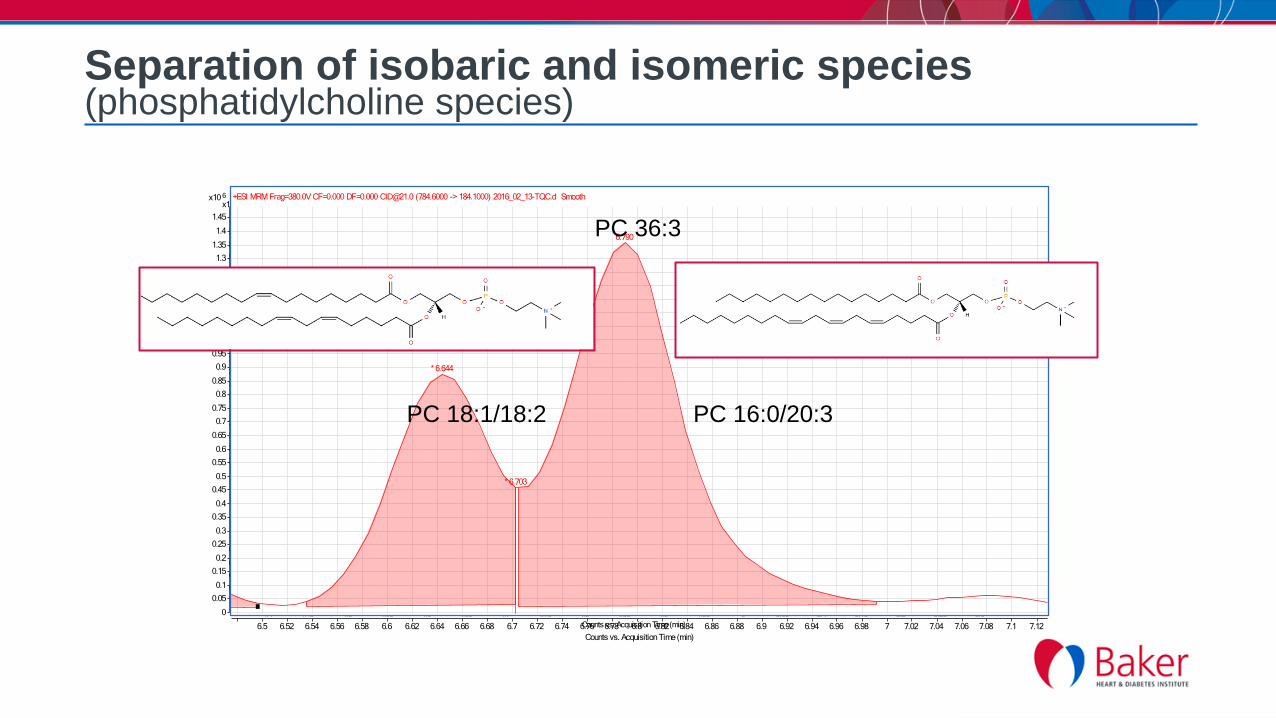
Separation of isobaric and isomeric species(phosphatidylcholine species)
5x10
0
0.2
0.4
0.6
0.8
1
1.2
1.4
1.6
1.8
2
2.2
2.4
2.6
2.8
3
3.2
3.4
3.6
3.8
4
4.2
4.4
4.6
4.8
5
5.2
5.4
5.6
5.8
6
Cpd 146: PC 36:3: +ESI MRM Frag=380.0V CF=0.000 DF=0.000 [email protected] (784.6000 -> 184.1000) FT03_0007 TQC 0745.d
4.856
Counts vs. Acquisition Time (min)
4.4 4.45 4.5 4.55 4.6 4.65 4.7 4.75 4.8 4.85 4.9 4.95 5 5.05 5.1 5.15 5.2 5.25 5.3
6x10
0
0.05
0.1
0.15
0.2
0.25
0.3
0.35
0.4
0.45
0.5
0.55
0.6
0.65
0.7
0.75
0.8
0.85
0.9
0.95
1
1.05
1.1
1.15
1.2
1.25
1.3
1.35
1.4
1.45
+ESI MRM Frag=380.0V CF=0.000 DF=0.000 [email protected] (784.6000 -> 184.1000) 2016_02_13-TQC.d Smooth
6.790
* 6.644
* 6.703
Counts vs. Acquisition Time (min)
6.5 6.52 6.54 6.56 6.58 6.6 6.62 6.64 6.66 6.68 6.7 6.72 6.74 6.76 6.78 6.8 6.82 6.84 6.86 6.88 6.9 6.92 6.94 6.96 6.98 7 7.02 7.04 7.06 7.08 7.1 7.12
PC 36:3
PC 18:1/18:2 PC 16:0/20:3

Characterisation of glycerophospholipid species
High complexity of extended chromatograms
Requires characterisation of lipid species
Characterise based on fragmentation in positive and negative mode
Lithium adducts provide fatty acid specific fragmentation
Hsu et al. (2003) JMS 38(7), 752-763
Mild acid hydrolysis can selectively remove plasmalogens
leaving alkyl- and diacyl- species intact
Synthesis of lipid standards

High throughput lipidomic profileLipid class/subclass No. of species Parent ion Daughter ion
dihydroceramide (dhCer) 6 [M+H]+ 284.3 m/z
ceramide (Cer) 41 [M+H]+ Sphingoid specific m/z
monohexosylceramide (MHC) 6 [M+H]+ 264.3 m/z
dihexosylceramide (DHC) 6 [M+H]+ 264.3 /z
trihexosylcermide (THC) 6 [M+H]+ 264.3 m/z
sulphatide (Sul) 6 [M+H]+ 264.3 m/z
GM1 ganglioside (GM1) 1 [M+2H]2+ 366.2 m/z
GM3 ganglioside (GM3) 6 [M+H]+ 264.3 m/z
sphingomyelin (SM) 36 [M+H]+ 184.1 m/z
phosphatidylcholine (PC) 184 [M+H]+ 184.1 m/z
phosphatidylethanolamine (PE) 124 [M+H]+ NL, 141.0 Da
phosphatidylinositol (PI) 32 [M+NH4]+ NL, 277.0 Da
lysophosphatidylinositol (LPI) 8 [M+NH4]+ NL, 277.0 Da
phosphatidylserine (PS) 7 [M+H]+ NL, 185.0 Da
phosphatidylglycerol (PG) 4 [M+ NH4]+ NL, 189.0 Da
bis(monoacylglycerol)phosphate (BMP) 1 [M+ NH4]+ 339.3 m/z
free cholesterol (COH) 1 [M+ NH4]+ 369.3 m/z
cholesteryl ester (CE) 28 [M+ NH4]+ 369.3 m/z
cholesteryl ester derivatives 18 [M+ NH4]+ 367.3/369.3 m/z
acylcarnitine 14 [M+H]+ 85.1 m/z
diacylglycerol (DG) 20 [M+ NH4]+ NL, fatty acid
triaclyglycerol (TG) 44 [M+ NH4]+ NL, fatty acid
alkyl-diacylglycerol (TG(O)) 3 [M+ NH4]+ NL, fatty acid
TOTAL 602
phosphatidylcholine (PC) 68 [M+H]+ 184.1 m/z
alkylphosphatidylcholine (PC(O)) 22 [M+H]+ 184.1 m/z
alkenylphosphatidylcholine (PC(P)) 24 [M+H]+ 184.1 m/z
lysophosphatidylcholine (LPC) 56 [M+H]+ 184.1 m/z
lysoalkylphosphatidylcholine (LPC(O)) 10 [M+H]+ 104.1 m/z
lysoalkenylphosphatidylcholine (LPC(P)) 4 [M+H]+ 104.1 m/z
phosphatidylethanolamine (PE) 36 [M+H]+ NL, 141.0 Da
alkylphosphatidylethanolamine (PE(O)) 14 [M+H]+ NL, 141.0 Da
alkenylphosphatidylethanolamine (PE(P)) 56 [M+H]+ Acyl specific
lysophosphatidylethanolamine (LPE) 14 [M+H]+ NL, 141.0 Da
lysoalkenylphosphatidylethanolamine (LPE(P)) 4 [M+H]+ NL, 172 Da

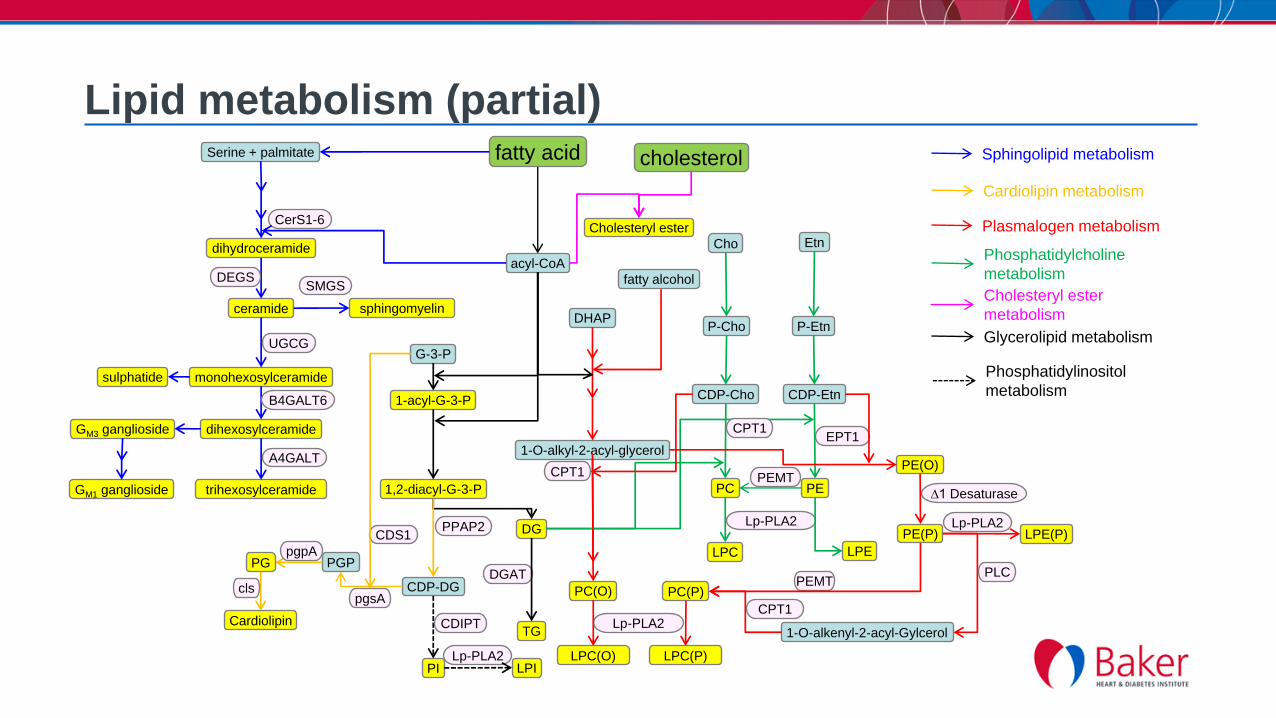
Lipid metabolism (partial)
G-3-P
PPAP2
1-acyl-G-3-P
1,2-diacyl-G-3-P
DG
CDP-DG
TG
DGAT
Cho
P-Cho
CDS1
CDP-Cho
PC
Etn
P-Etn
CDP-Etn
PE
CPT1
EPT1
PEMT
PGPPG
PI
pgsA
Cardiolipin
cls
Serine + palmitate
ceramide
monohexosylceramide
dihydroceramide
fatty acid
dihexosylceramide
trihexosylceramide
CerS1-6
DEGS
UGCG
B4GALT6
A4GALT
PC(O) PC(P)
1-O-alkyl-2-acyl-glycerol
DHAP
PEMT
LPC(O)
Lp-PLA2
sphingomyelin
SMGS
acyl-CoA
CDIPT
pgpA
CPT1
fatty alcohol
PE(O)
PE(P)
∆1 Desaturase
LPC LPE
Lp-PLA2
cholesterol
Cholesteryl ester
Sphingolipid metabolism
Cardiolipin metabolism
Plasmalogen metabolism
Glycerolipid metabolism
Phosphatidylcholine
metabolism
Phosphatidylinositol
metabolism
Cholesteryl ester
metabolism
LPC(P)
1-O-alkenyl-2-acyl-Gylcerol
PLC
CPT1
LPE(P)Lp-PLA2
Lp-PLA2LPI
sulphatide
GM3 ganglioside
GM1 ganglioside

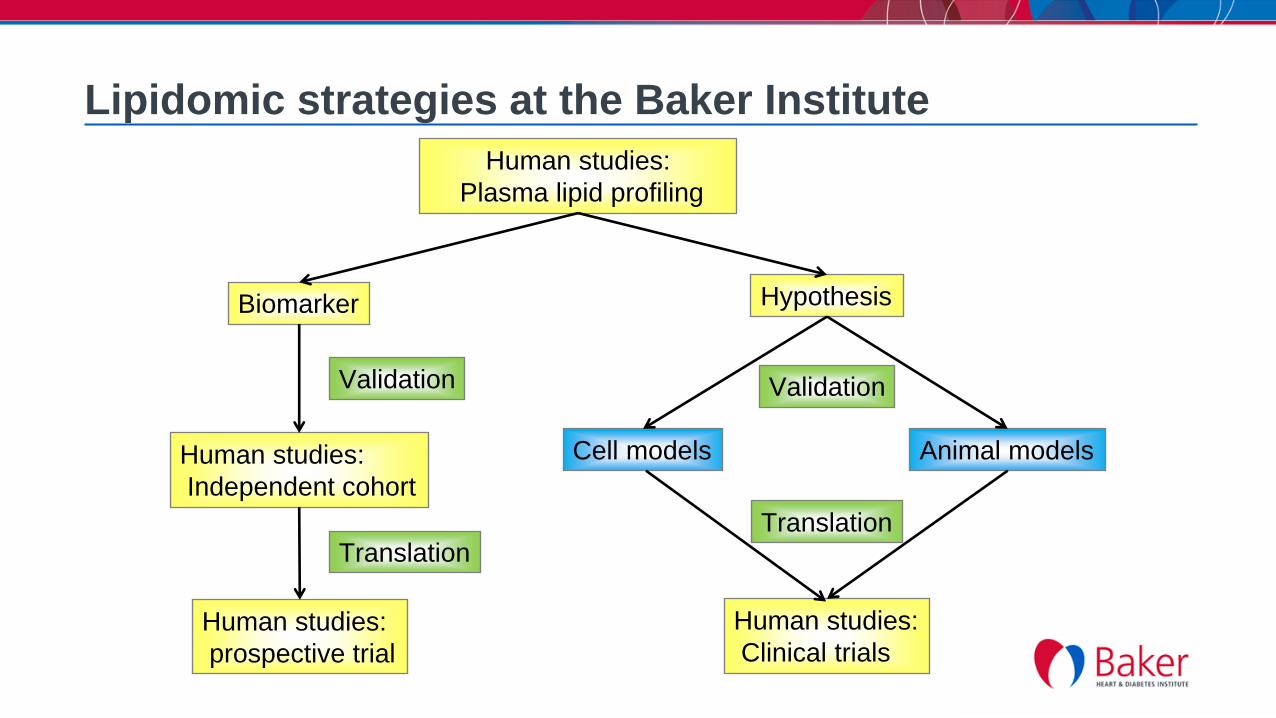
Lipidomic strategies at the Baker Institute
Human studies:
Plasma lipid profiling
Hypothesis
Validation
Translation
Cell models Animal models
Human studies:
Clinical trials
Biomarker
Human studies:
Independent cohort
Validation
Translation
Human studies:
prospective trial
BiomarkersLIPID Study (Long-term Intervention with Pravastatin in Ischemic Disease)
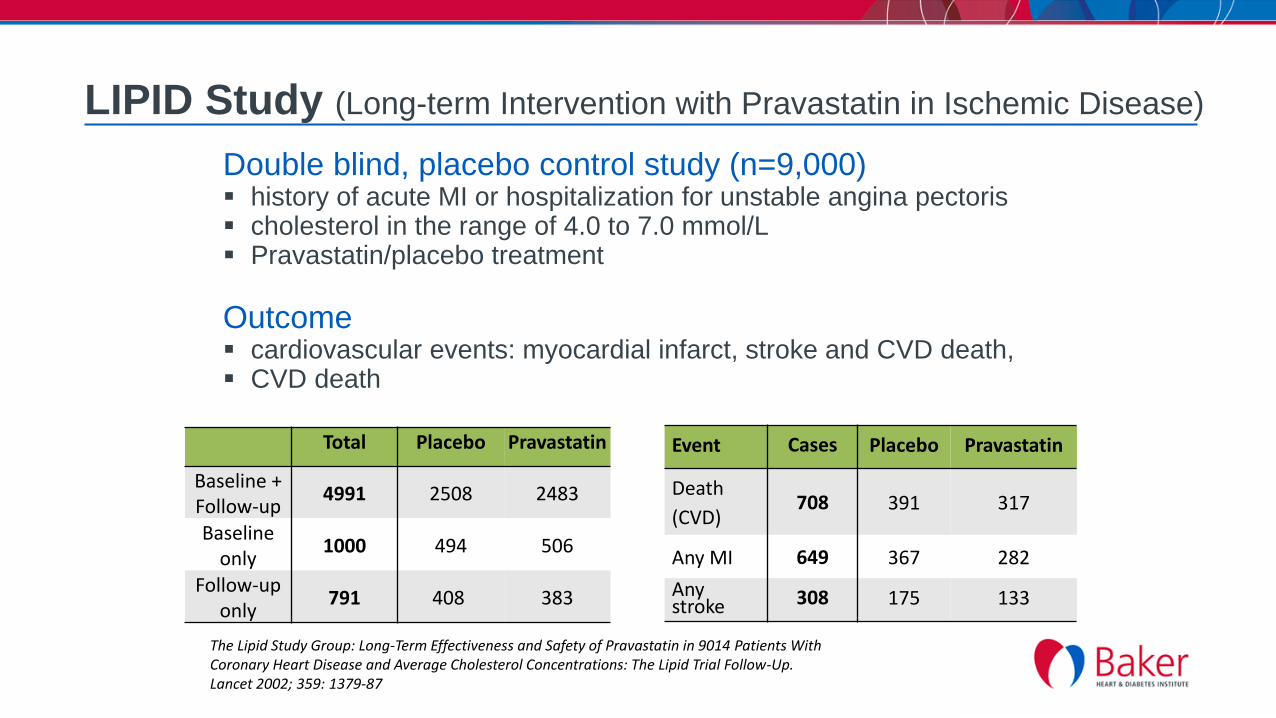
LIPID Study (Long-term Intervention with Pravastatin in Ischemic Disease)
Double blind, placebo control study (n=9,000) history of acute MI or hospitalization for unstable angina pectoris cholesterol in the range of 4.0 to 7.0 mmol/L Pravastatin/placebo treatment
Outcome cardiovascular events: myocardial infarct, stroke and CVD death, CVD death
The Lipid Study Group: Long-Term Effectiveness and Safety of Pravastatin in 9014 Patients With Coronary Heart Disease and Average Cholesterol Concentrations: The Lipid Trial Follow-Up. Lancet 2002; 359: 1379-87
Total Placebo Pravastatin
Baseline + Follow-up
4991 2508 2483
Baseline only
1000 494 506
Follow-up only
791 408 383
Event Cases Placebo Pravastatin
Death
(CVD)708 391 317
Any MI 649 367 282
Any stroke 308 175 133
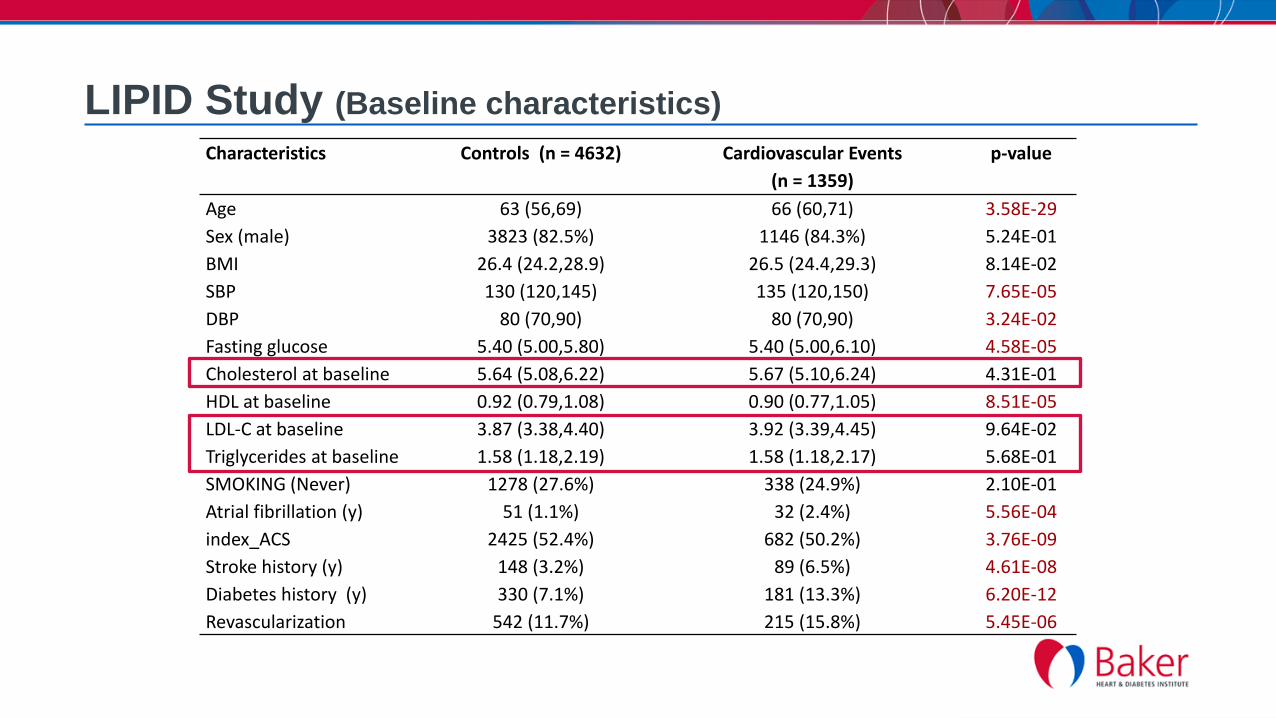
LIPID Study (Baseline characteristics)
Characteristics Controls (n = 4632) Cardiovascular Events
(n = 1359)
p-value
Age 63 (56,69) 66 (60,71) 3.58E-29
Sex (male) 3823 (82.5%) 1146 (84.3%) 5.24E-01
BMI 26.4 (24.2,28.9) 26.5 (24.4,29.3) 8.14E-02
SBP 130 (120,145) 135 (120,150) 7.65E-05
DBP 80 (70,90) 80 (70,90) 3.24E-02
Fasting glucose 5.40 (5.00,5.80) 5.40 (5.00,6.10) 4.58E-05
Cholesterol at baseline 5.64 (5.08,6.22) 5.67 (5.10,6.24) 4.31E-01
HDL at baseline 0.92 (0.79,1.08) 0.90 (0.77,1.05) 8.51E-05
LDL-C at baseline 3.87 (3.38,4.40) 3.92 (3.39,4.45) 9.64E-02
Triglycerides at baseline 1.58 (1.18,2.19) 1.58 (1.18,2.17) 5.68E-01
SMOKING (Never) 1278 (27.6%) 338 (24.9%) 2.10E-01
Atrial fibrillation (y) 51 (1.1%) 32 (2.4%) 5.56E-04
index_ACS 2425 (52.4%) 682 (50.2%) 3.76E-09
Stroke history (y) 148 (3.2%) 89 (6.5%) 4.61E-08
Diabetes history (y) 330 (7.1%) 181 (13.3%) 6.20E-12
Revascularization 542 (11.7%) 215 (15.8%) 5.45E-06

LIPID Study
Hypotheses
That baseline plasma lipid species are associated with incident cardiovascular events independent of traditional risk factors
That plasma lipid species will provide improved prediction of cardiovascular events
Aims
Perform lipidomic profiling on 12,000 samples from LIPID Study
Identify lipid species that associated with future CVD events
Develop multivariate models to predict the risk of future CVD

Plasma lipid profiling of the LIPID cohort
Lipid extraction
10mL plasma
Stable isotope internal standards
Single phase, BuOH / MeOH / H2O
Multiple reaction monitoring (MRM)
11773 samples
420 MRM transitions
352 lipid species in total
Several months
Dataset (> 4 million lipid measurements)
Agilent 6490 triple quadrupole mass spectrometer (1290 HPLC)

LIPID Study (Association of lipids with cardiovascular outcomes)
Outcomes
Cardiovascular events (MI, stroke and CVD death)
CVD death
Cox regression (log-transformed, Stdev normalised)
Adjust for covariates
Hazard ratio (95% confidence interval),
Correction for multiple comparison (Benjamini-Hochberg)

Lipid classes associated with CVD death
Dihydroceramide Ceramide Monohexosylceramide Dihexosylceramide Trihexosylceramide GM3 ganglioside Sphingomyelin Phosphatidylcholine Alkylphosphatidylcholine Alkenylphosphatidylcholine Lysophosphatidylcholine Lysoalkylphosphatidylcholine Phosphatidylethanolamine Alkylphosphatidylethanolamine Alkenylphosphatidylethanolamine Lysophosphatidylethanolamine Phosphatidylinositol Lysophosphatidylinositol Phosphatidylserine Phosphatidylglycerol Cholesterol Cholesteryl ester Diacylglycerol Triacylglycerol Oxidised PC Oxidised CE
6.58E-018.12E-019.09E-028.98E-011.10E-018.12E-019.09E-028.12E-019.24E-014.75E-013.20E-018.12E-012.81E-028.12E-018.12E-019.09E-028.12E-018.12E-012.51E-026.58E-019.17E-019.32E-019.09E-029.17E-018.12E-014.36E-01
0.5 1.0 2.0
Hazard Ratio (95% Confidence intervals)
55 lipid species associated with cardiovascular events
95 lipid species associated with cardiovascular death
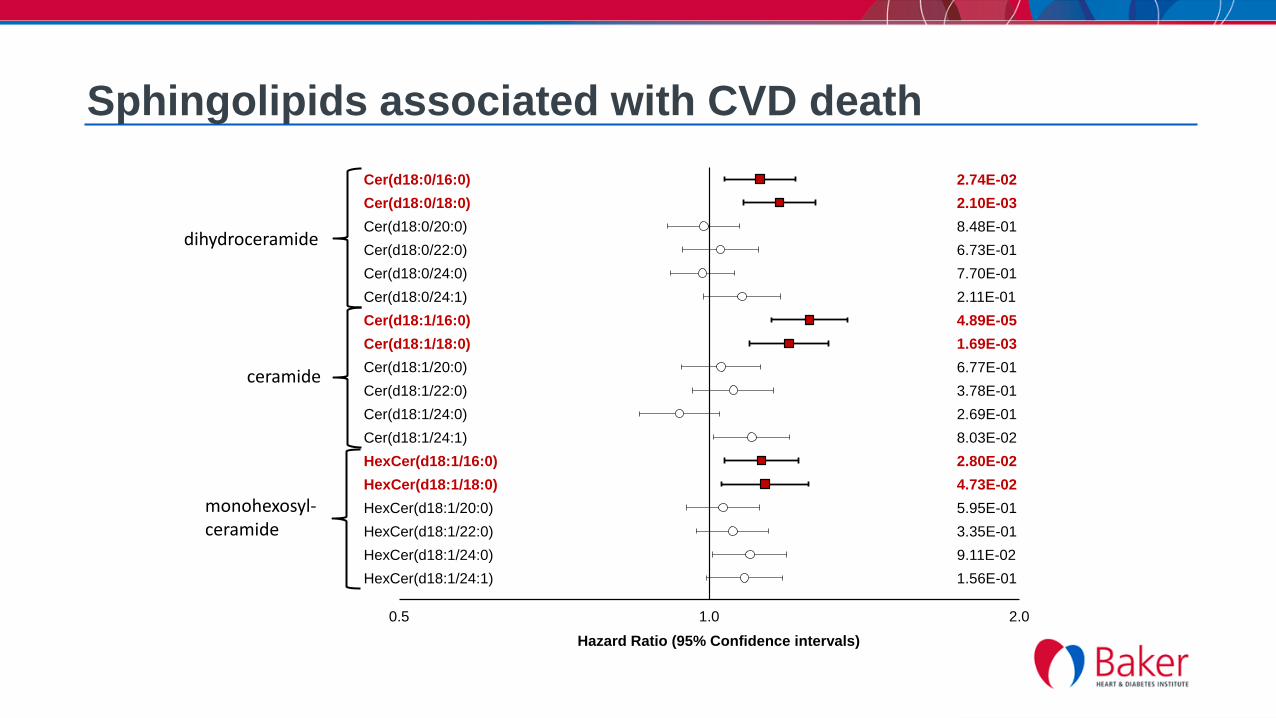
Sphingolipids associated with CVD death
Cer(d18:0/16:0)
Cer(d18:0/18:0)
Cer(d18:0/20:0)
Cer(d18:0/22:0)
Cer(d18:0/24:0)
Cer(d18:0/24:1)
Cer(d18:1/16:0)
Cer(d18:1/18:0)
Cer(d18:1/20:0)
Cer(d18:1/22:0)
Cer(d18:1/24:0)
Cer(d18:1/24:1)
HexCer(d18:1/16:0)
HexCer(d18:1/18:0)
HexCer(d18:1/20:0)
HexCer(d18:1/22:0)
HexCer(d18:1/24:0)
HexCer(d18:1/24:1)
2.74E-02
2.10E-03
8.48E-01
6.73E-01
7.70E-01
2.11E-01
4.89E-05
1.69E-03
6.77E-01
3.78E-01
2.69E-01
8.03E-02
2.80E-02
4.73E-02
5.95E-01
3.35E-01
9.11E-02
1.56E-01
0.5 1.0 2.0
Hazard Ratio (95% Confidence intervals)
dihydroceramide
ceramide
monohexosyl-ceramide

Lipid metabolism in cardiovascular disease
G-3-P
PPAP2
1-acyl-G-3-P
1,2-diacyl-G-3-P
DG
CDP-DG
TG
DGAT
Cho
P-Cho
CDP-Cho
PC
Etn
P-Etn
CDP-Etn
PE
EPT1
PEMT
PI
Serine + palmitate
ceramide
monohexosylceramide
dihydroceramide
fatty acid
dihexosylceramide
trihexosylceramide
DEGS
UGCG
B4GALT6
A4GALT
acyl-CoA
CDIPT
CPT1
LPC LPE
Lp-PLA2
Sphingolipid metabolism
Glycerolipid metabolism
Phosphatidylcholine
metabolism
Phosphatidylinositol
metabolism
CerS1 (18:0)
CerS2 (20:0 -24:0)
CerS5/6 (16:0)
(16:0)
(18:0)

LIPID Study(Prediction of future cardiovascular events)

LIPID Study (Prediction of future cardiovascular events)
Correlation minimization to reduce collinear lipids
352 lipids reduced to144 lipid species
Create a base model (Cox regression) with significant covariates (22 covariates)
Add lipids sequentially to the base model
Select lipids based on Akaike Information Criterion (AIC)
Within a cross validated framework (5 x 200)
Rank the top 20 lipids.
Create a series of models (Cox regression) by adding lipids sequentially to the
base model
Within a cross validated framework (5 x 200)
Determine C-statistics and NRI (categorical and continuous) relative to the base model and
calculate 95% CI

LIPID Study(Prediction of future cardiovascular events)
0.640
0.645
0.650
0.655
0.660
0.665
0.670
0.675
0 1 2 3 4 5 6 7 8 9 10 11 12 13 14 15 16 17 18 19 20
Ave
rage
C-s
tati
stic
s
No of Lipids
Cardiovascular events
0.690
0.700
0.710
0.720
0.730
0.740
0.750
0.760
0 1 2 3 4 5 6 7 8 9 10 11 12 13 14 15 16 17 18 19 20
Ave
rage
C-s
tati
stic
s
No of Lipids
Cardiovascular death

LIPID Study: Plasma lipids improve upon traditional risk factors to predict future cardiovascular events
Cardiovascular events C-Statistic (95% CI)NRI*
Categorical (95% CI) Continuous (95% CI)
Base model (22) 0.645 (0.644 - 0.646) Reference Reference
Base model + 8 lipids 0.666 (0.665 - 0.667) 0.082 (0.080 - 0.084) 0.291 (0.287 - 0.295)
% change 2.1 8.2 29.1
Cardiovascular death C-Statistic (95% CI)NRI*
Categorical (95% CI) Continuous (95% CI)
Base model (22) 0.703 (0.701 - 0.705) Reference Reference
Base model + 8 lipids 0.741 (0.739 - 0.742) 0.103 (0.099 - 0.106) 0.420 (0.414 - 0.426)
% change 3.8 10.3 42.0
* NRI based on a categorical model of <10, 10–15, and >15% 5-years risk.
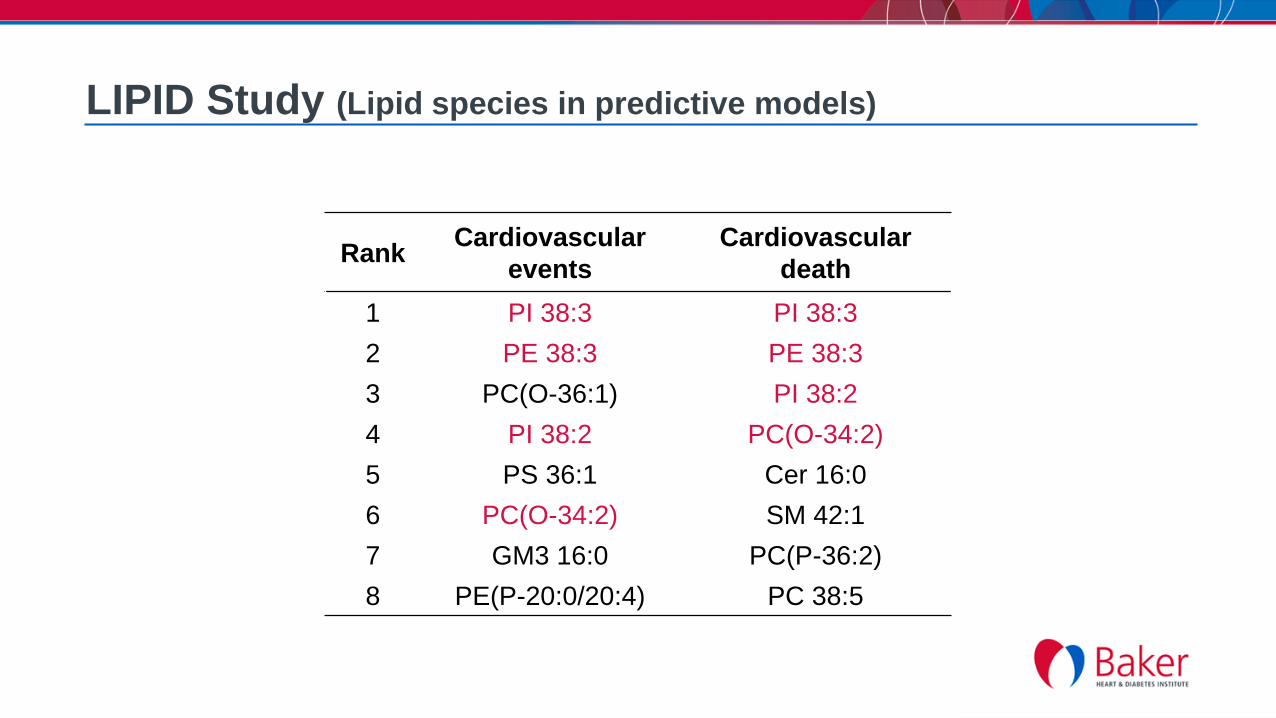
LIPID Study (Lipid species in predictive models)
RankCardiovascular
events
Cardiovascular
death
1 PI 38:3 PI 38:3
2 PE 38:3 PE 38:3
3 PC(O-36:1) PI 38:2
4 PI 38:2 PC(O-34:2)
5 PS 36:1 Cer 16:0
6 PC(O-34:2) SM 42:1
7 GM3 16:0 PC(P-36:2)
8 PE(P-20:0/20:4) PC 38:5

Validation of findings in the ADVANCE Study

The ADVANCE Study(Action in Diabetes and Vascular disease: preterAx and diamicroN-MR Controlled Evaluation)
Double blind placebo controlled multicenter trial
T2D patients, high risk CVD (n=11,140)
Design (2x2)
Blood pressure control x intensive glucose control
Outcomes 5 years follow up
Primary outcomes (cardiovascular events)
o Myocardial infarct, stroke and CVD death
Patel et.al, J Hum Hypertens 2005;19:S27-S32.

The ADVANCE Study (sub-cohort selection)
Design (case-cohort)
Random selection of 3,154 participant
o 334 cases (MI, stroke, CVD death)
o 2,820 non-cases
Add all available cases from the remainder trial to the cohort
o 625 cases (364 CVE, 261 renal cases)
Cardiovascular
eventsCVD death Stroke
Myocardial
infarct
Cases 698 355 192 238
Non-cases 3,081 3,424 3,587 3,541

Prediction of cardiovascular disease death
ADVANCE Study (Validation of lipid species from LIPID Study)
C-Statistics (95% CI)NRI
Categorical (95% CI) Continuous (95% CI)
Base model 0.695 Reference Reference
Base + Lipids
(8 features) 0.711 0.045 0.292
% change 1.6 4.5 29.2
C-Statistics (95% CI)NRI
Categorical (95% CI) Continuous (95% CI)
Base model 0.765 Reference Reference
Base + Lipids
(8 features)0.782 0.102 0.392
% change 1.7 10.2 39.2
Prediction of cardiovascular events
Categorical reclassification: <10%, 10-15%, >15%
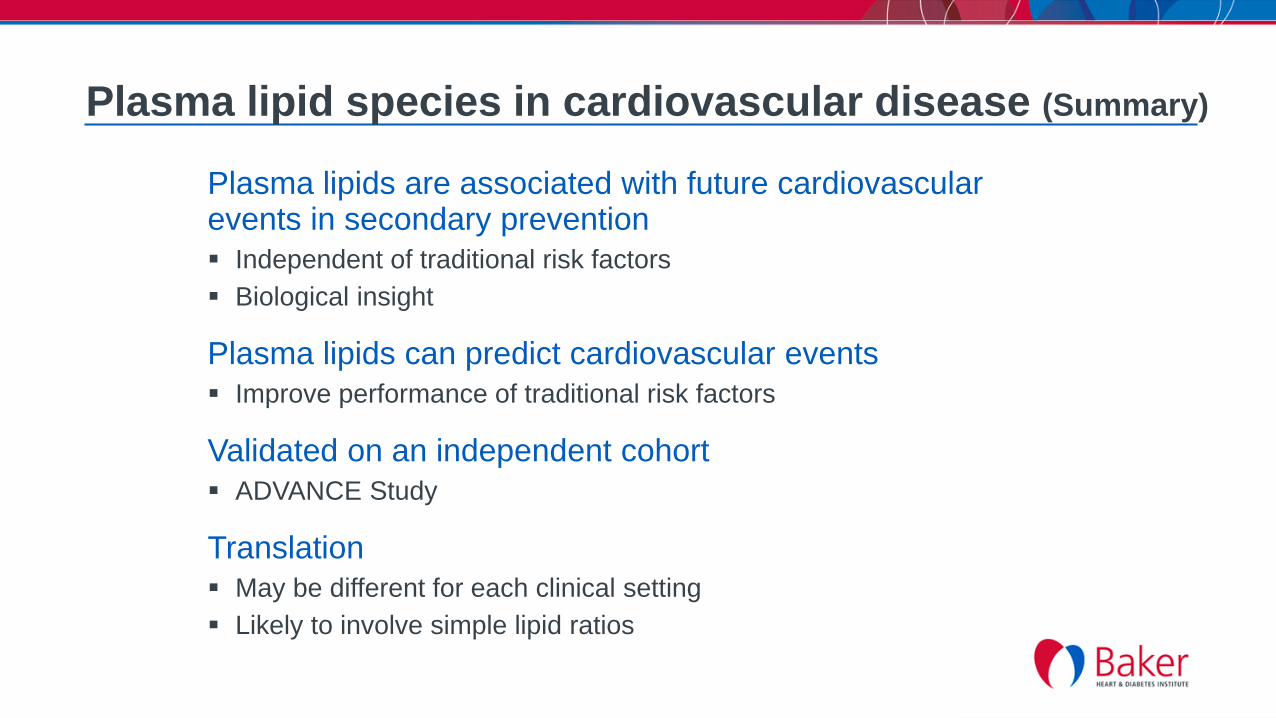
Plasma lipid species in cardiovascular disease (Summary)
Plasma lipids are associated with future cardiovascular events in secondary prevention
Independent of traditional risk factors
Biological insight
Plasma lipids can predict cardiovascular events
Improve performance of traditional risk factors
Validated on an independent cohort
ADVANCE Study
Translation
May be different for each clinical setting
Likely to involve simple lipid ratios
Lipidomic strategies at the Baker Institute
Human studies:
Plasma lipid profiling
Hypothesis
Validation
Translation
Cell models Animal models
Human studies:
Clinical trials
Biomarker
Human studies:
Independent cohort
Validation
Translation
Human studies:
prospective trial

Plasmalogen modulation in cardiometabolic disease

polar head group
Anti-atherogenic •anti-oxidant•anti-inflammatory •cholesterol efflux
vinyl ether
Plasmalogens and atherosclerosis

Plasmalogens and cardiometabolic disease
Baker IDI clinical cohort (n=220)
Plasmalogens negatively associated with stable and unstable coronary artery disease (Meikle et al, ATVB. 2011;31(11):2723-32)
LIPID / ADVANCE Study (n=5,991; n=3770)
Plasmalogens negatively associated with future CVE (CVD death)
(Alshehry et al, Circulation. 2016;134(21):1637-1650)
AusDiab / San Antonio Family Heart Study (n=1,000; n=1200)
Plasmalogens negatively associated with type 2 diabetes
(Meikle et al, PLoS One. 2013;8(9):e74341)
The Australian Imaging Biomarker and Lifestyle Study (n=1,000)
Plasmalogens negatively associated with Alzheimer’s disease

Can plasmalogen upregulation attenuate atherosclerosis?
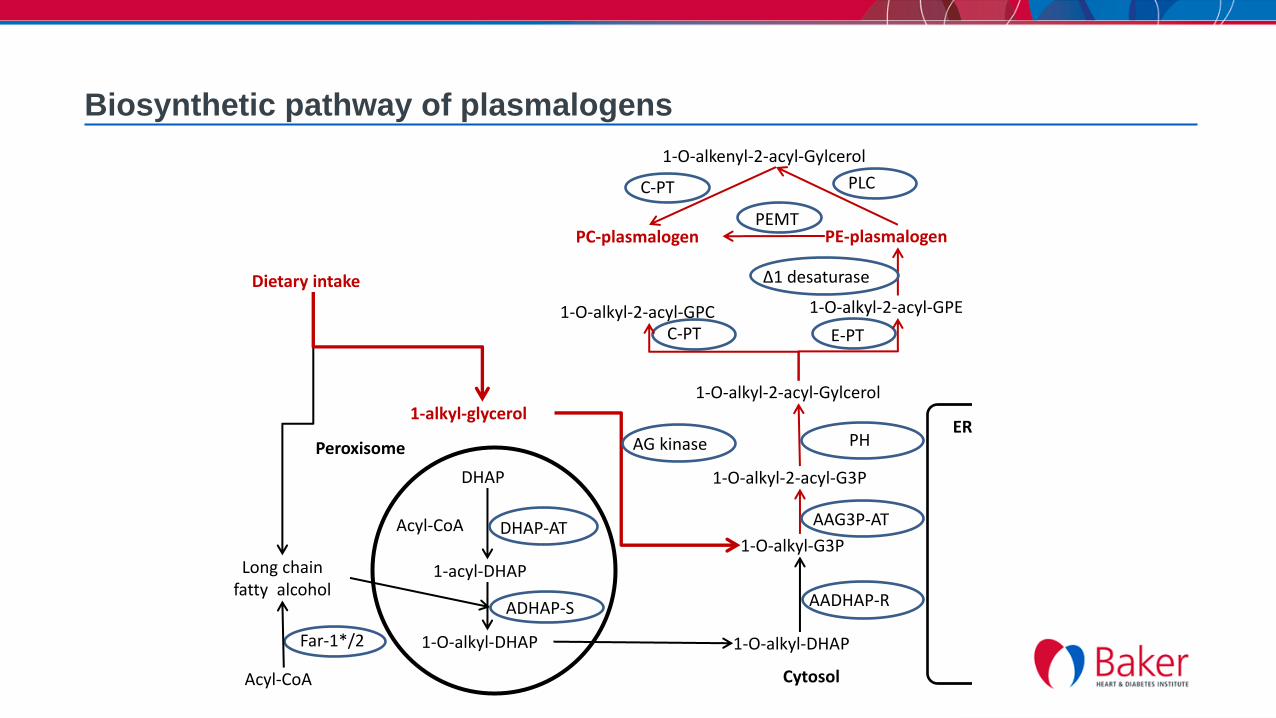
Biosynthetic pathway of plasmalogens
DHAP
1-acyl-DHAP
Acyl-CoA
1-O-alkyl-DHAP
ADHAP-S
Long chain fatty alcohol
Far-1*/2
Acyl-CoA
1-O-alkyl-DHAP
1-O-alkyl-G3P
1-O-alkyl-2-acyl-G3P
1-O-alkyl-2-acyl-Gylcerol
1-O-alkyl-2-acyl-GPC 1-O-alkyl-2-acyl-GPE
PC-plasmalogen PE-plasmalogen
Peroxisome
DHAP-AT
AADHAP-R
Δ1 desaturase
C-PT
Dietary intake
PH
AAG3P-AT
ER
E-PT
1-alkyl-glycerol
Cytosol
1-O-alkenyl-2-acyl-Gylcerol
C-PT
PEMT
AG kinase
PLC

Plasmalogen upregulation to prevent atherosclerosis in ApoE mice (Aliki Rasmiena)
C57/BL6 (controls)ApoE-/-
ApoE-/-GPx-/-
Weekly weighing and twice weekly scruffing
6 wk 18 wk
high fat diet +/- 2% batyl alcohol diet
0 wk
chow
batyl alcohol
plasmalogen
Analysis
Lipid profiles of mouse plasma and heart
Sudan IV staining for lesions/plaque in aorta
Detection of inflammatory and oxidative markers in aorta and aortic sinus sections

Batyl alcohol supplementation increased plasmalogen levels in plasma
Data are median (interquartiles) of N = 9 – 10 /group. *** indicates P<0.001
0
200
400
600
800
C57/BL6 ApoE-/- ApoE-/-GpX1-/-
PE
pla
sm
alo
ge
n
(nm
ol/μ
mo
l PC
)
0% BA
2% BA
***
***
***
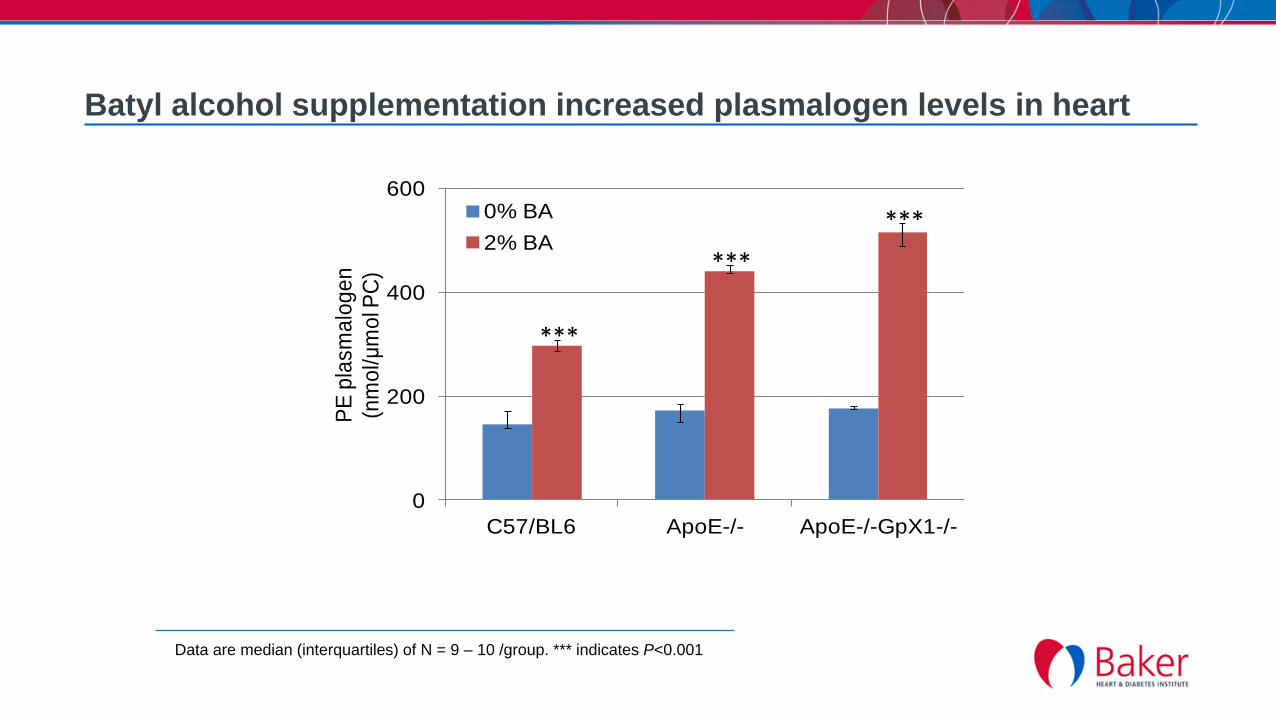
Batyl alcohol supplementation increased plasmalogen levels in heart
0
200
400
600
C57/BL6 ApoE-/- ApoE-/-GpX1-/-
PE
pla
sm
alo
ge
n
(nm
ol/μ
mo
l PC
)
0% BA
2% BA
Data are median (interquartiles) of N = 9 – 10 /group. *** indicates P<0.001
***
***
***

Assessment of aortic lesions
0% BA
2% BA
C57/BL6 ApoE -/- ApoE-/-GPx1-/-
Diagram obtained from JACC
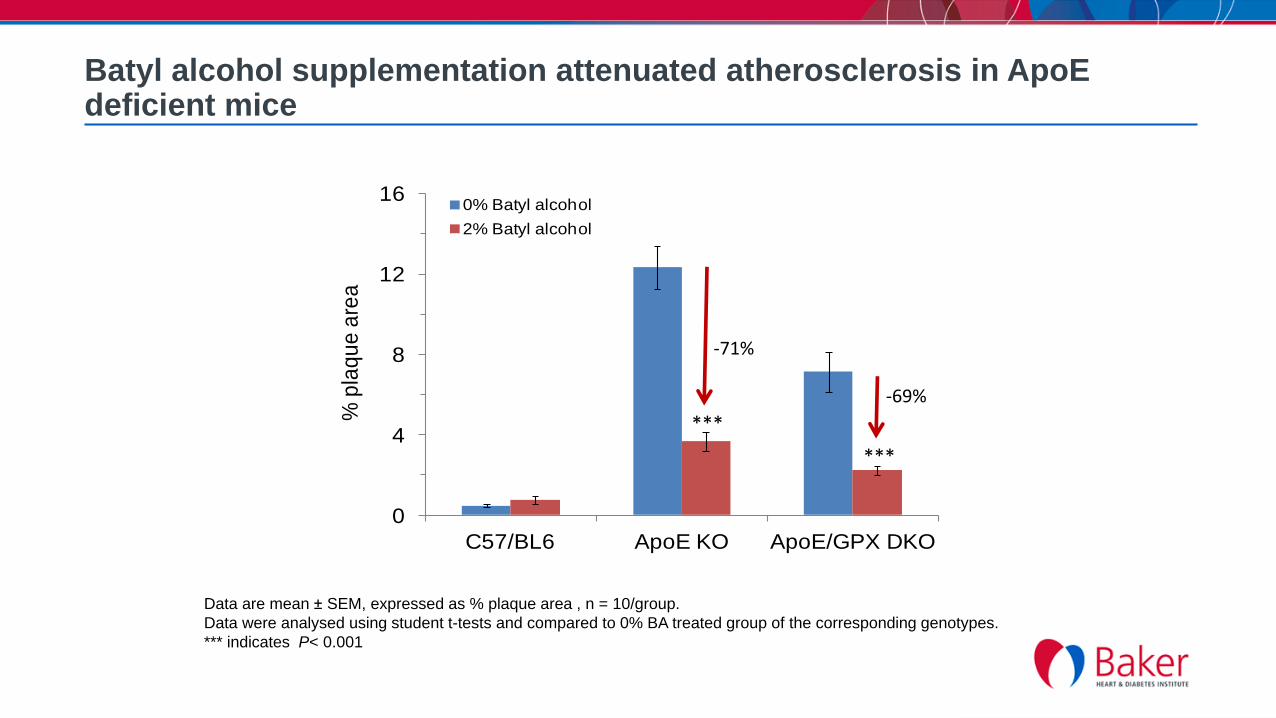
Batyl alcohol supplementation attenuated atherosclerosis in ApoE deficient mice
0
4
8
12
16
C57/BL6 ApoE KO ApoE/GPX DKO
% p
laq
ue
are
a
0% Batyl alcohol
2% Batyl alcohol
***
***
-71%
-69%
Data are mean ± SEM, expressed as % plaque area , n = 10/group.
Data were analysed using student t-tests and compared to 0% BA treated group of the corresponding genotypes.
*** indicates P< 0.001

Plasmalogen upregulation to prevent atherosclerosis in ApoE mice
Batyl alcohol containing diet successfully elevated plasmalogen concentration in plasma and heart
Plasmalogen up-regulation reduced atherosclerosis in ApoE-/- and ApoE-/-GPx-/-
Differential effects on inflammation and oxidative stress were observed in ApoE-/- and ApoE-/-GPx-/- mouse model
Acknowledgments
Baker IDI Heart and Diabetes InstituteBronwyn Kingwell
Paul NestelGerard Wong
Metabolomics Lab
King Fahad Medical City Zahir Alshehry
Graham HillisSophia ZoungasJohn Chalmers
Mark Woodward
Malcolm McConville
John SimesAndrew TonkinDavid SullivanAdrienne Kirby
Liz Barnes


