J. Sep. Sci. 2013, 00, 1–10 1 Rodica D. Nas ¸ cu-Briciu Costel S ˆ arbu Faculty of Chemistry and Chemical Engineering, Babes ¸ -Bolyai University, Cluj Napoca, Romania Received October 2, 2012 Revised December 5, 2012 Accepted January 7, 2013 Research Article Lipophilicity of oils and fats estimated by TLC A representative series of natural toxins belonging to alkaloids and mycotoxins classes was investigated by TLC on classical chemically bonded plates and also on oils- and fats- impregnated plates. Their lipophilicity indices are employed in the characterization and comparison of oils and fats. The retention results allowed an accurate indirect estimation of oils and fats lipophilicity. The investigated fats and oils near classical chemically bonded phases are classified and compared by means of multivariate exploratory techniques, such as cluster analysis, principal component analysis, or fuzzy-principal component analysis. Additionally, a concrete hierarchy of oils and fats derived from the observed lipophilic character is suggested. Human fat seems to be very similar to animal fats, but also possess RP-18, RP-18W, and RP-8. Keywords: Animal fats / Human fat / Lipophilicity / Multivariate exploratory methods / Vegetable oils DOI 10.1002/jssc.201200922 1 Introduction In the last decades, the biological behavior (toxicity, antiox- idant or oxidant activity, etc.) was directly correlated to the chemical structure and lipophilicity of the compounds and their ability to interact with the chemical entities that char- acterize the biological environment [1]. The lipophilicity is defined as the tendency of a compound to partition between a nonpolar and an aqueous environment, but here the environ- mental circumstances play a decisive role in the chemical and biological behavior [2, 3]. The lipophilicity is associated with an increased biological activity, poor aqueous solubility, faster metabolization and elimination, increased plasma protein binding, sometimes shorter duration of action. Simultane- ously, it plays an important role in the pharmacodynamic and toxicological profile of drugs [4, 5]. The experiments of lipophilicity determination involve a partitioning step in which the compound, according to its structural partic- ularities, is distributed between the involved immiscible phases (liquid–liquid or liquid–solid). The lipophilicity is Correspondence: Dr. Costel Sˆ arbu, Faculty of Chemistry and Chemical Engineering, Babes ¸-Bolyai University, Arany Janos Str. No. 11, Cluj Napoca, RO-400028, Rom ˆ ania E-mail: [email protected]Fax: +40-264-590818 Abbreviations: BE, bear; CA, cluster analysis; CD, cod liver; CE, cedar; CO, corn; CR, castor; Fuzzy-PCA, fuzzy-principal component analysis; GR, grapes; HPTLC, high performance thin layer chromatography; HU, female fat; ME, medol; OL, olive; PA, paraffin; PCA, principal component analysis; PC1, first principal component; PC, principal component; PG, pig; PL, palm; PN, peanuts; PU, pullet; SH, sheep; SF, sunflower; SY, soybean; TD, tetradecane; TE, terpineol expressed through the partition coefficient, denoted in few different ways, frequently depending on the determination method (logP, logk w , and logK ow ). Nowadays, the mostly used methods of determination are the chromatographic methods (HPLC or TLC), which are flexible and possess significant advantages; and dynamic process, in which the consumption of the investigated compounds is minimal, chemicals used are highly pure, and additional analytical quantification is not required. The lipophilicity descriptors list is completed by computed logP values that mathematically analyze the structural features and express them numerically [6]. Few years ago, the lipophilicity experiments were only carried out in order to investigate the lipophilic character of compounds; but now, they are extended to the evaluation of stationary phase lipophilic character [7–11]. These methods require only the determination of some retention parameters [12–14]. The chromatographic methodologies involved in the lipophilic character estimation are usually based on the reversed-phase partition mechanism, when the stationary phase is totally nonpolar (octadecyl or octyl chemically modi- fied silica gels). However, since the biological environment is characterized by large complexity described by various chem- ical entities, a pertinent analysis should be performed on stationary phases exhibiting different characteristics. In this context, the TLC plates impregnated with different types of lipophilic material (synthetic oils, vegetable oils, and derived products, animal fats or even human fat) may offer some per- tinent information regarding the interactions that may take place among the biological membrane and investigated com- pounds, and, in addition, the lipophilic materials can be clas- sified by advanced and robust chemometric approaches [9,10]. Oils and fats represent a mixture of compounds with highly lipophilic character. This particularity recommends Colour Online: See the article online to view Figs. 2 and 4 in colour. C 2013 WILEY-VCH Verlag GmbH & Co. KGaA, Weinheim www.jss-journal.com
Transcript
J. Sep. Sci. 2013, 00, 1–10 1
Rodica D. Nascu-BriciuCostel Sarbu
Faculty of Chemistry andChemical Engineering,Babes-Bolyai University, ClujNapoca, Romania
Received October 2, 2012Revised December 5, 2012Accepted January 7, 2013
Research Article
Lipophilicity of oils and fats estimatedby TLC
A representative series of natural toxins belonging to alkaloids and mycotoxins classeswas investigated by TLC on classical chemically bonded plates and also on oils- and fats-impregnated plates. Their lipophilicity indices are employed in the characterization andcomparison of oils and fats. The retention results allowed an accurate indirect estimationof oils and fats lipophilicity. The investigated fats and oils near classical chemically bondedphases are classified and compared by means of multivariate exploratory techniques, suchas cluster analysis, principal component analysis, or fuzzy-principal component analysis.Additionally, a concrete hierarchy of oils and fats derived from the observed lipophiliccharacter is suggested. Human fat seems to be very similar to animal fats, but also possessRP-18, RP-18W, and RP-8.
In the last decades, the biological behavior (toxicity, antiox-idant or oxidant activity, etc.) was directly correlated to thechemical structure and lipophilicity of the compounds andtheir ability to interact with the chemical entities that char-acterize the biological environment [1]. The lipophilicity isdefined as the tendency of a compound to partition between anonpolar and an aqueous environment, but here the environ-mental circumstances play a decisive role in the chemical andbiological behavior [2, 3]. The lipophilicity is associated withan increased biological activity, poor aqueous solubility, fastermetabolization and elimination, increased plasma proteinbinding, sometimes shorter duration of action. Simultane-ously, it plays an important role in the pharmacodynamicand toxicological profile of drugs [4, 5]. The experimentsof lipophilicity determination involve a partitioning stepin which the compound, according to its structural partic-ularities, is distributed between the involved immisciblephases (liquid–liquid or liquid–solid). The lipophilicity is
Correspondence: Dr. Costel Sarbu, Faculty of Chemistry andChemical Engineering, Babes-Bolyai University, Arany Janos Str.No. 11, Cluj Napoca, RO-400028, RomaniaE-mail: [email protected]: +40-264-590818
Abbreviations: BE, bear; CA, cluster analysis; CD, cod liver;CE, cedar; CO, corn; CR, castor; Fuzzy-PCA, fuzzy-principalcomponent analysis; GR, grapes; HPTLC, high performancethin layer chromatography; HU, female fat; ME, medol; OL,olive; PA, paraffin; PCA, principal component analysis; PC1,first principal component; PC, principal component; PG, pig;PL, palm; PN, peanuts; PU, pullet; SH, sheep; SF, sunflower;SY, soybean; TD, tetradecane; TE, terpineol
expressed through the partition coefficient, denoted in fewdifferent ways, frequently depending on the determinationmethod (logP, logkw, and logKow). Nowadays, the mostly usedmethods of determination are the chromatographic methods(HPLC or TLC), which are flexible and possess significantadvantages; and dynamic process, in which the consumptionof the investigated compounds is minimal, chemicals usedare highly pure, and additional analytical quantification isnot required. The lipophilicity descriptors list is completedby computed logP values that mathematically analyze thestructural features and express them numerically [6]. Fewyears ago, the lipophilicity experiments were only carried outin order to investigate the lipophilic character of compounds;but now, they are extended to the evaluation of stationaryphase lipophilic character [7–11]. These methods require onlythe determination of some retention parameters [12–14].
The chromatographic methodologies involved in thelipophilic character estimation are usually based on thereversed-phase partition mechanism, when the stationaryphase is totally nonpolar (octadecyl or octyl chemically modi-fied silica gels). However, since the biological environment ischaracterized by large complexity described by various chem-ical entities, a pertinent analysis should be performed onstationary phases exhibiting different characteristics. In thiscontext, the TLC plates impregnated with different types oflipophilic material (synthetic oils, vegetable oils, and derivedproducts, animal fats or even human fat) may offer some per-tinent information regarding the interactions that may takeplace among the biological membrane and investigated com-pounds, and, in addition, the lipophilic materials can be clas-sified by advanced and robust chemometric approaches [9,10].
Oils and fats represent a mixture of compounds withhighly lipophilic character. This particularity recommends
Colour Online: See the article online to view Figs. 2 and 4 in colour.
2 R. D. Nascu-Briciu and C. Sarbu J. Sep. Sci. 2013, 00, 1–10
them to be useful in the lipophilicity studies. In addi-tion, their natural complexity may simulate the biologicalmembranes in a much better way. Such experiments arebased on the TLC possibility of plate impregnation withdifferent natural or synthetic materials. Over the years,paraffin oil [15,16] silicon oil [17,18], and ethyl oleate [19], forexample, were often used for the impregnation of silica gelplates, in order to change the stationary phase characteristics,but these studies have aimed rather the separation of targetcompounds than their lipophilicity and chromatographicbehavior investigation. Oils as impregnating agents werealso used for lipophilicity assessment of some compoundsnot only for their separation [20, 21].
In view of the above considerations, the purpose of thiswork is to evaluate, characterize, and classify different oilsand fats by means of TLC lipophilicity analysis of some nat-ural compounds with increased toxicity. One of the majorgoals is to illustrate the differences and similarity existing be-tween the investigated oils and fats by comparing with humanfat. The investigation will be performed by using advancedchemometric methods, such as cluster analysis (CA), prin-cipal component analysis (PCA), or fuzzy-principal compo-nent analysis (Fuzzy-PCA). The stationary phase’s lipophilic-ity charts and the PCA loadings scatter plots provide a newvision about the compound–oil/fat interaction evaluated bymeans of chromatographic separation mechanism. The com-pounds taken into consideration, in this study, belong to my-cotoxins and alkaloids groups and over time they prove tohave very significant effects over human health.
2 Materials and methods
All solvents (acetone, methanol, acetonitrile) and ammoniumsolution (25%) were purchased from Chemical Company(Iasi, Romania). The used solvents were of HPLC gradi-ent grade. Water for chromatography was produced withinthe laboratory by means of a Multilab GFL-2008 distilla-tion system and used during experiments. The investigatedcompounds, purchased from different commercial sources(Merck, Fluka, and Sigma–Aldrich), were of analytical grade.The compounds taken into consideration are as follows:1. aflatoxine G1; 2. ochratoxine A; 3. zearalenone; 4. qui-nine; 5. cinconine, 6. hydroquinine; 7. o-(4-chlorobenzoyl)hydroquinine; 8. hydroquinine 4-methyl-2-quinolyl ether; 9.(DHQ)2 Phal; 10. (DHQ)2 AQN; 11. camptothecin. Stocksolutions having concentrations of 1 mg/mL were obtainedfrom each of the tested compounds through direct dissolu-tion in methanol. The chemically bonded plates such as RP-18, RP-18W, RP-8, RP-2, CN, Diol, and NH2 were purchasedfrom Merck. All the plates were of high performance thinlayer chromatography (HPTLC) quality.
liver: CD) and fats (pig: PG; sheep: SH; pullet: PU; bear: BE)used for the impregnation were from local markets, whilethe female fat (HU) was obtained from liposuction surgery.The TLC silica gel 60 F254s plates (10 × 10 cm) from Merckwere used as support for impregnation. The chromatographicplates were impregnated with 10% diethyl ether solution ofeach individual oil and fat mentioned above. All fats usedas raw material were extracted from the natural membranesby heating to melting point followed by filtration. The im-pregnation was performed in a chromatographic chamber byascendant development. After impregnation, the plates weredried at room temperature (∼22�C) for 24 h before use.
2.2 Chromatographic analysis
Spots of 2 �L were applied on the chromatographic plates ata distance of 1.5 cm from the bottom and the margin of theplates, starting from left to right, with 0.7 cm space betweentwo consecutive spots. The elution distance was 8 cm. TheTLC separation was performed in an ascendant chromato-graphic chamber, prior to saturation with the mobile phasefor 15 min. The plates were developed at room temperature.
In order to select the most exclusive organic modifier forthe mobile phase, three organic solvents were tested. The in-vestigated solvents were as follows: methanol, acetone, andACN. The best results were obtained using methanol. Themobile phases containing different mixtures of methanol andwater were optimized in order to observe a significant migra-tion of the compounds while the elution step was changed.The alkaloids are compounds with basic properties, whichmakes them difficult analytes in chromatographic analysismainly because of strong interactions between their cationicforms and surface-active groups. These interactions causewidening of spots, poor separation efficiency, and spot asym-metry [22]. In our case, a strong tailing effect could be ob-served when the mobile phases consisted of methanol andwater and consequently, in order to avoid this problem, thepH of the mobile phase has been adjusted to a value of 9.6by ammonium solution addition, which plays the role of anionization suppressor. The ammonium solution addition hada very positive effect; so after the elution, the obtained spotswere highly compact and no diffusion could be observed.For each stationary phase, five different elutions with mobilephases consisting of methanol and water were made. Thecompositions of the mobile phase used for experiments onRP-18, RP-8, and RP-2 ranged from 85 to 95% methanol,in steps of 2.5%. In the case of the other stationary phases,the methanol fraction modification was of 5%. The methanolfraction ranged from 75 to 95% for RP-18W, from 35 to 55%for NH2, from 50 to 70% for Diol, and finally from 65 to 85%for CN, and all impregnated plates. The compounds were vi-sualized under the UV light (365 and 254 nm), as fluorescentspots on plate background. Each separation was made in du-plicate and the considered RF value was computed as the ratiobetween the mean of migration distance of a particular com-pound over solvent front distance. The difference between
the considered values was of 10−3 order. The RM values werecalculated from retention factor RF.
3 Theory and procedures
The RF values of compounds obtained on each stationaryphase were computed as reported between the compoundsmigration distance over the solvent front distance. The RF
values formed the basis of all the TLC lipophilicity indices.The logarithm of retention factor RM obtained is the mostpopular descriptor in TLC, as described by Bate-Smith andWestall [23], through the following relation:
RM = log(
1
RF− 1
)(1)
During the last years, it has been shown that the meanvalue of the RMs (mRM) obtained on the same stationaryphase but with different mobile phases may be consideredas a suitable and descriptive lipophilicity index [24, 25]. Thedirect influence of the organic modifier concentration fromthe mobile phase over the RM value is recovered in the linearrelationship described by Soczewinski-Wachtmeister (Eq. (2))[26]:
RM = RM0 + bC (2)
where RM0 represents the extrapolated value to pure water, bis the regression slope and at the same time it is consideredto be the specific surface area of the stationary phase and alsoan alternative descriptor of lipophilicity; C represents the vol-ume fraction of the organic solvent in the mobile phase. TheRM0 is usually expressed directly from regression equation offive RM values obtained for mobile phases containing differ-ent fractions of organic modifier. RM0 is widely accepted asthe most powerful lipophilicity descriptor derived from chro-matographic retention data, although its value is more of-ten different from those experimentally determined throughdirect methods, when applicable. Even more, it is stronglydependent on the organic modifier used [27].
During the last decade, new insights were offered by PCA,which has the ability to provide highly descriptive lipophilicityindices. PCA is extracting the meaningful and interpretablefeatures from the underlying information of the multivariateraw data. It has the ability to separate the pertinent infor-mation from the noise. Usually the first few componentsaccount for the maximum information existing in the initial(raw) data. Various studies have revealed that the score plotof the first two principal components (PCs) offer sustainablepatterns that are highly related to the chemical reality [28]. Ba-sically in our case the lipophilicity descriptors are consideredas the first principal components (PC1) obtained by applying
the PCA algorithms to the covariance matrix (11 rows and5 columns) formed by the compounds RM values obtainedfor each mobile phase level. Moreover, by applying the PCAalgorithm on the matrix (26 rows and 11 columns) formedby lipophilicity indices (all mRM values; all RM0 values or allPC1/RM values) obtained on different stationary phases mayoffer a suggestive classification of stationary phases or, in ourcase, the impregnation material. In addition, a careful investi-gation of eigenvectors (loadings) can offer useful informationconcerning the chromatographic behavior of the compoundsand the mobile phase influence over the obtained lipophilicityindices. The influence of the initial data over the PCA anal-ysis is underlined by the corresponding eigenvalues. In ourparticular case, the high regularity existed within the initialmatrix formed by the lipophilicity indices is illustrated by thecumulative variance (>99%) accounted by PC1 and PC2.
However, the PCA is sensitive to outliers, missing data,and poor linear correlation between variables due to poorlydistributed variables, which may lead to erroneous conclu-sions. In this regard, one of the most powerful approachesto improve PCA appears to be the fuzzification of the matrixdata, thus diminishing the influence of the outliers. Fuzzylogic is a form of many-valued logic, which deals with rea-soning that is approximate rather than fixed and exact. Fuzzy
logic has been extended to handle the concept of partial truth,where the truth value may range between completely true (1)and completely false (0) [29, 30]. In our case, Fuzzy-PCA of-fered a better classification of the studied fats and oils.
The PCA and Fuzzy-PCA was completed by the CA,which is a well known and widely used unsupervised clus-tering procedure with its hierarchical and nonhierarchicalapproaches. CA is a multivariate analysis technique used tosort samples (in our case a reversed-phase materials, oils, andfats) into groups. Ward’s method as the amalgamation ruleand the squared Euclidean distance as metric were used toestablish clusters. For the classification of stationary phases,the CA was applied on the matrices formed by mRM, RM0,and PC1/RM values. The chemometric analysis has beenperformed by using Statistica 8 software (StatSoft, Tulsa,USA).
4 Results and discussion
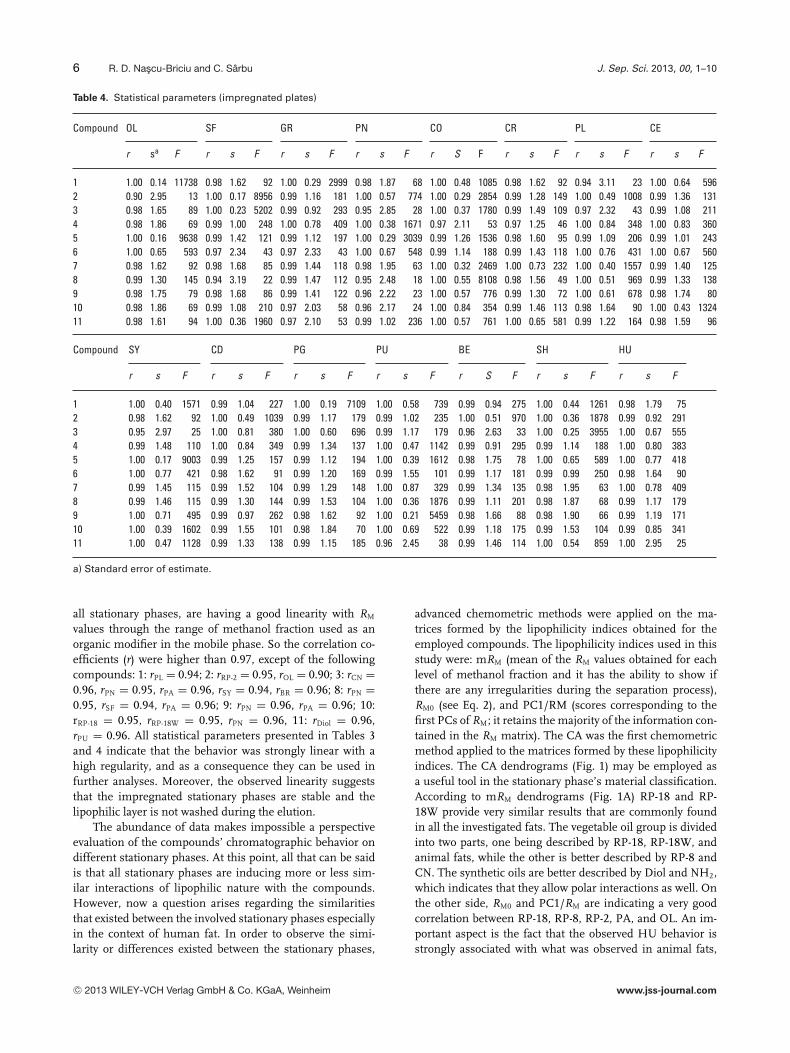
The lipophilicity descriptors on which the entire classificationhas been performed are listed in Tables 1 and 2. The regres-sion correlation coefficients corresponding to Soczewinski–Snyder equation, obtained for the employed compounds on
all stationary phases, are having a good linearity with RM
values through the range of methanol fraction used as anorganic modifier in the mobile phase. So the correlation co-efficients (r) were higher than 0.97, except of the followingcompounds: 1: rPL = 0.94; 2: rRP-2 = 0.95, rOL = 0.90; 3: rCN =0.96, rPN = 0.95, rPA = 0.96, rSY = 0.94, rBR = 0.96; 8: rPN =0.95, rSF = 0.94, rPA = 0.96; 9: rPN = 0.96, rPA = 0.96; 10:rRP-18 = 0.95, rRP-18W = 0.95, rPN = 0.96, 11: rDiol = 0.96,rPU = 0.96. All statistical parameters presented in Tables 3and 4 indicate that the behavior was strongly linear with ahigh regularity, and as a consequence they can be used infurther analyses. Moreover, the observed linearity suggeststhat the impregnated stationary phases are stable and thelipophilic layer is not washed during the elution.
The abundance of data makes impossible a perspectiveevaluation of the compounds’ chromatographic behavior ondifferent stationary phases. At this point, all that can be saidis that all stationary phases are inducing more or less sim-ilar interactions of lipophilic nature with the compounds.However, now a question arises regarding the similaritiesthat existed between the involved stationary phases especiallyin the context of human fat. In order to observe the simi-larity or differences existed between the stationary phases,
advanced chemometric methods were applied on the ma-trices formed by the lipophilicity indices obtained for theemployed compounds. The lipophilicity indices used in thisstudy were: mRM (mean of the RM values obtained for eachlevel of methanol fraction and it has the ability to show ifthere are any irregularities during the separation process),RM0 (see Eq. 2), and PC1/RM (scores corresponding to thefirst PCs of RM; it retains the majority of the information con-tained in the RM matrix). The CA was the first chemometricmethod applied to the matrices formed by these lipophilicityindices. The CA dendrograms (Fig. 1) may be employed asa useful tool in the stationary phase’s material classification.According to mRM dendrograms (Fig. 1A) RP-18 and RP-18W provide very similar results that are commonly foundin all the investigated fats. The vegetable oil group is dividedinto two parts, one being described by RP-18, RP-18W, andanimal fats, while the other is better described by RP-8 andCN. The synthetic oils are better described by Diol and NH2,which indicates that they allow polar interactions as well. Onthe other side, RM0 and PC1/RM are indicating a very goodcorrelation between RP-18, RP-8, RP-2, PA, and OL. An im-portant aspect is the fact that the observed HU behavior isstrongly associated with what was observed in animal fats,
Figure 1. Hierarchical clustering of stationary phases using mRM
(a), RM0 (b) and PC1/RM (c) values.
and it may confirm that the fats impregnated plates are avery good alternative to the lipophilicity estimation. More-over, the dendrogram corresponding to mRM and PC1/RM
(Fig. 1A and C) has suggested HU as highly related to RP-18and RP-18W. This observation is quite encouraging becausethe lipophilicity expressed on RP-18 was associated with thebiological behavior for years. Fats from all animals are highly
related, except PU, which has induced behavior that is moreclose to vegetable oils. In addition, the SF oil was more closeto the fats than to the vegetable oils. In addition, it may beobserved that the synthetic oils are divided into two differ-ent clusters. TD and TE are closely related to RP-2, Diol, andNH2. In all these stationary phases, some hydrophilic inter-actions are present besides the lipophilic interactions. Thiswas expected since the viscosity of these materials was verylow; consequently it was also expected that the covering layerwill not be as efficient as the other two synthetic oils (PA andME) and some silanol interactions could take place.
CA dendrograms were very useful to indicate the sim-ilarities that existed between the stationary phases, but itcould not answer the question regarding the hierarchy oftheir lipophilicity. This can be solved by a graphical represen-tation (Fig. 2) of the first two PCs obtained by applying PCA tothe covariance matrices formed by the accepted lipophilicityindices (mRM, RM0, or PC1/RM). Also, the obtained eigen-values confirmed that the data are uniformly distributed. Allgraphs are displaying linear clusters or groups that may indi-cate the lipophilic range of the tested fats and oils. In all cases,it is indicated that HU showed the behavior of compoundsquite similar to RP-18. The mRM and PC1/RM representationis presenting the groups of compound in few hypotheticallinear clusters. If the RP-18 is considered the most lipophilicstationary phase, it should be placed at a distinctive positionthat is considered as a reference, but once again it may beobserved that the RP-8 and RP-18W are not following thisrule.
The mRM values allow the formation of several linear clus-ters, which suggests similarities and differences existed be-tween the impregnation materials from the lipophilicity pointof view. The hierarchy indicated by the studied compoundsis in good agreement with previous studies that elaboratedon compounds with different lipophilicity level (lipophilic vi-tamins, flavonoids, and sweeteners) [13–15]. Once again thelipophilicity of HU fat seems to be close to CD and PU, whichindicates that a diet based on pullet and fish appears appro-priate. The hierarchy of vegetable oils, such as CO, CR, SF,and OL, is also respected, while other vegetable oils seem tobe classified as follows: GR > PL > PN > SY > CE. Theless lipophilic oils are TD and TE. The differences betweenanimal fats are not very big, PG, PU, and SH being very simi-lar. Figure 2C indicates that the majority of the vegetable oilsmay be clearly distinguished, since they were classified in aseparate group.
The lipophilic nature of the impregnation materialstrongly influences the interactions that define the retentionmechanism. Previous studies [12–15] have revealed that thegraphical representations of PCA loadings as a function oforganic modifier fraction can be a good indicator of the inter-actions variance. The profiles (Fig. 3) obtained for the majorityof stationary phases are in good agreement with the profilecorresponding to the RP-18. This aspect indicates that the re-tention is generally based on lipophilic interactions. However,there are few exceptions, for PA and OL, when the observedprofiles are more different.
8 R. D. Nascu-Briciu and C. Sarbu J. Sep. Sci. 2013, 00, 1–10
Figure 2. Lipophilicity charts obtained for the studied stationaryphases (blue: chemically bonded, green: synthetic oils, purple:vegetable oils, pink: animal fats, red: human) obtained throughapplication of PCA to the matrix of the chromatographic deter-mined indices: mRM (a), RM0 (b) and PC1/RM (c).
As it was described above, PCA is sensitive to outliers,missing data, and poor linear correlation between variablesdue to poorly distributed variables, which may lead to er-roneous conclusions. This may be avoided by fuzzificationof the matrix data before PCA. For our particular case, theobtained results are presented in Fig. 4. On comparing the
Figure 3. The RM loadings spline scatterplot.
classical PCA and Fuzzy-PCA classification, it may be ob-served that all stationary phases are generally arranged inlinear clusters that may indicate much better lipophilicity hi-erarchy. The linear clusters presented in Fig. 4 confirm thatHU is strongly described by other fats, by OL and SY, and alsoby RP-18. All these observations indicate that the lipophilic-ity of HU is quite similar to some oils and fats, and even tochemically bonded stationary phases. The lipophilicity of sta-tionary phases is a sum of the contribution of each chemicalcompound from the raw impregnation material. In this con-dition, it is expected that some of the vegetable oils correlatewith animal fats and also with chemically bonded stationaryphases. Even if the lipophilicity level is quite similar, while in-vestigating the biological behavior of particular compounds,the impregnation material chemical composition is anotheraspect to be considered besides lipophilicity. It is expectedthat an animal fat presented as being related to human fatexhibits a better description of the biological pathway than asynthetic stationary phase. If, chemically bonded stationaryphases are accepted as a reference, it is easy to conclude thatmRM lead to the more realistic classification. Such observa-tion has also been made in other studies, dealing with verydifferent classes of compounds [8–11], and it may be con-cluded that the mRM lipophilicity index is a very powerfuland highly descriptive. In addition, the results indicate thatmRM should not be ignored in future lipophilicity studies.
5 Concluding remarks
The lipophilicity indices of some natural compounds withincreased toxicity were employed in the characterization andclassification of different materials used as stationary phases,obtained by chemically bonding or by impregnation. The ob-tained results have revealed that the multivariate exploratorytechniques, such as CA, PCA, or Fuzzy-PCA, are appro-priate to classify and characterize different materials thatmay be homogeneously impregnated on a TLC plate. More-over, if comparing classical PCA with Fuzzy-PCA, it may be
Figure 4. Lipophilicity charts obtained for the studied stationaryphases (blue: chemically bonded, green: synthetic oils, purple:vegetable oils, pink: animal fats, red: human) obtained throughapplication of Fuzzy-PCA to the matrix of the chromatographicdetermined indices: mRM (a), RM0 (b), and PC1/RM (c).
concluded that the ability of fuzzy algorithms to eliminatethe influence of outliers will lead to better and more sus-tainable results. All fats and oils classification, obtained bymeans of the lipophilicity indices provided by the involvedtoxic compounds, is in a very good agreement with other re-sults obtained for very different classes of compounds such
as lipophilic vitamins [9], flavonoids [10], and sugars [11].These classes are very different from lipophilicity point ofview (very high lipophilicity: lipophilic vitamins; intermedi-ary lipophilicity: toxic compounds and flavonoids; and verylow lipophilicity: sugars) and the fact that they are leadinggenerally to similar results supports the conclusion that thesemethodologies are useful and pertinent. All the results indi-cated that the mRM appears to be the most suited descriptorand it may be selected and considered as such in the futurestudies.
Rodica D. Nascu-Briciu acknowledge that this work waspossible with the financial support of the Sectorial OperationalProgramme for Human Resources Development 2007–2013, co-financed by the European Social Fund, under the project num-ber POSDRU 89/1.5/S/60189 with the title "Postdoctoral Pro-grams for Sustainable Development in a Knowledge Based So-ciety.” Moreover, authors acknowledge the financial support ofMinistry of Education, Research, Youth and Sport of Romania(Grant PN-II-ID-PCE-2011–3-0366).
The authors have declared no conflict of interest.
6 References
[1] Van de Waterbeemed, H., Testa, B., Drug Bioavailability,2nd Ed., Wiley-VCH, Weinheim 2009.
[2] Huszar, M., Hallgas, B., Idei, M., Kiss-Szikszai, A.,Horvath, A., Patonay, T., J. Liq. Chromatogr. Relat. Tech-nol. 2008, 31, 3143–3158.
[3] IUPAC, Compendium of Chemical Terminology, 2nd Ed.,Blackwell, Oxford 1997.
[4] Kaliszan, R., Chem. Rev. 2007, 107, 3212–3246.
[5] Testa, B., Crivori, P., Reist, M., Carrupt, P. A., Perspect.Drug Discovery Des. 2000, 1, 179–211.
[6] Tetko, I. V., Gasteiger, J., Todeschini, R., Mauri, A., Living-stone, D., Ertl, P., Palyulin, V. A., Radchenko, E. V., Zefirov,N. S., Makarenko, A. S., Tanchuk, V. Y., Prokopenko, V. V.,J. Comput. Aided Mol. Des. 2005, 19, 453–463.
[7] Tache, F., Nascu-Briciu, R. D., Sarbu, C., Micale, F., Medve-dovici, A., J. Pharm. Biomed. Anal. 2012, 57, 82–93.
[8] Petre, J., Nascu-Briciu, R. D., Iancu, V., David, V., Sarbu,C., J. Liq. Chromatogr. Relat. Technol. 2011, 34, 289–306.
[9] Briciu, R. D., Sarbu, C., J. Am. Oil Chem. Soc. 2010, 10,1091–1102.
[10] Briciu, R. D., Sarbu, C., Sep. Sci. Technol. 2010, 45,1275–1285.
[11] Sarbu, C., Briciu, R. D., J. Liq. Chromatogr. Relat. Technol.2010, 33, 903–921.
[12] Sangster, J., Octanol-Water Partition Coefficients: Fun-damentals and Physical Chemistry, Wiley, West Sussex,UK 1997.
[13] Kaliszan, R., Structure and Retention in Chromatogra-phy: A Chemometric Approach, Harwood Academic Pub-lishers, Amsterdam, The Netherlands 1997.