18
Liquefied Natural Gas (LNG) Sector Overview June 2018

Liquefied Natural Gas (LNG)
Sector Overview
June 2018

Global Industry
Life Cycle
Changes in Gas Markets
Global Demand & Supply Dynamics
Global Trade | Regional Mix
Global State of the Industry
Trade Countries
Pricing
Local Industry
LNG Model
Domestic Production & Consumption
Upcoming Developments
Potential Benefits of LNG Revolution
LNG INDUSTRY

LNG – Lifecycle
• Liquefied Natural Gas (LNG) is a form of natural gas converted to liquid form ease of storage or transport. It is odourless, colourless, non-toxic, and non-
corrosive.
LNG achieves a higher reduction in volume than (CNG) so that the (volumetric) energy density of LNG is 2.4 times greater than that of CNG or 60 percent that of diesel fuel. This makes LNG cost efficient to transport
over long distances where pipelines do not exist.

Changes in Global Gas Markets:
LNG Growth Rate is expected to be seven times faster than pipeline gas trade in the coming years.
Expected to account for 50% of all globally traded gas by 2035.
SIGNIFICANCE
Unlike Pipeline gas, LNG Cargoes can be redirected to different parts of the world in response to regional fluctuations in demand & supply.
Due to increase in LNG supply, Global gas market is moving towards integration.
Global Gas Industry
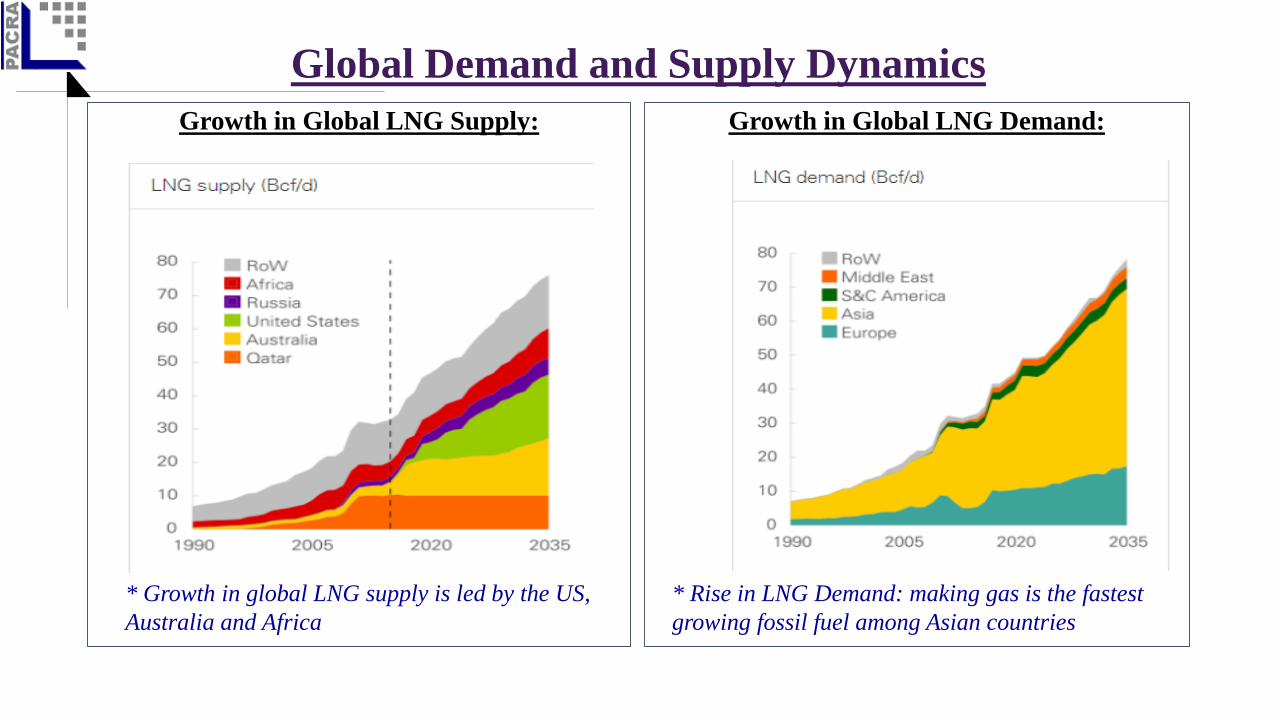
Global Demand and Supply Dynamics
Growth in Global LNG Supply: Growth in Global LNG Demand:
* Growth in global LNG supply is led by the US,
Australia and Africa
* Rise in LNG Demand: making gas is the fastest
growing fossil fuel among Asian countries
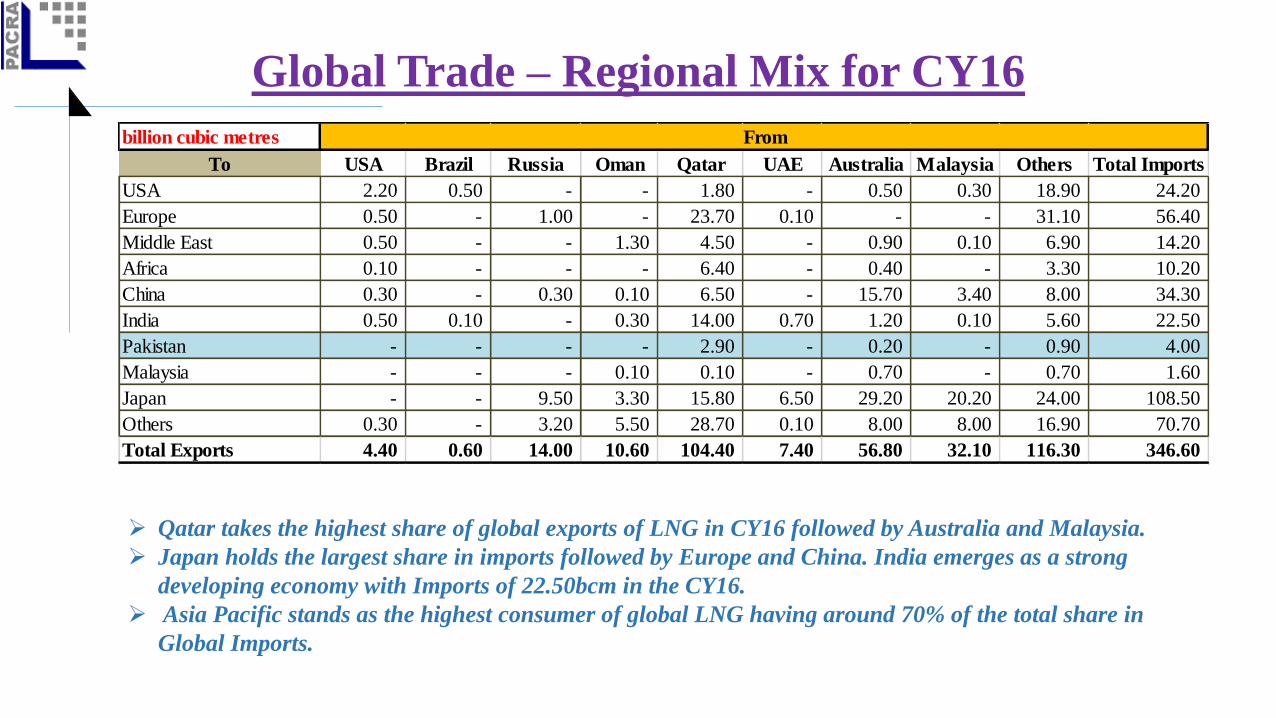
Global Trade – Regional Mix for CY16
billion cubic metres
To USA Brazil Russia Oman Qatar UAE Australia Malaysia Others Total Imports
USA 2.20 0.50 - - 1.80 - 0.50 0.30 18.90 24.20
Europe 0.50 - 1.00 - 23.70 0.10 - - 31.10 56.40
Middle East 0.50 - - 1.30 4.50 - 0.90 0.10 6.90 14.20
Africa 0.10 - - - 6.40 - 0.40 - 3.30 10.20
China 0.30 - 0.30 0.10 6.50 - 15.70 3.40 8.00 34.30
India 0.50 0.10 - 0.30 14.00 0.70 1.20 0.10 5.60 22.50
Pakistan - - - - 2.90 - 0.20 - 0.90 4.00
Malaysia - - - 0.10 0.10 - 0.70 - 0.70 1.60
Japan - - 9.50 3.30 15.80 6.50 29.20 20.20 24.00 108.50
Others 0.30 - 3.20 5.50 28.70 0.10 8.00 8.00 16.90 70.70
Total Exports 4.40 0.60 14.00 10.60 104.40 7.40 56.80 32.10 116.30 346.60
From
Qatar takes the highest share of global exports of LNG in CY16 followed by Australia and Malaysia.
Japan holds the largest share in imports followed by Europe and China. India emerges as a strong
developing economy with Imports of 22.50bcm in the CY16.
Asia Pacific stands as the highest consumer of global LNG having around 70% of the total share in
Global Imports.

Global – State of the Industry
83 MTPA FSRU
capacity, January 2017
879 MTPA Proposed
liquefaction capacity, Jan 2017
439 Vessels LNG Fleet,
Jan 2017
795 MTPA Global
nominal regasification capacity,
Jan 2017
10% of Supplyshare of LNG in global gas
supply in 2015 2
1 & 2 . Data for 2017 not available.
258 MT Global trade
in 20161

Global Trade | CountriesLNG Exports by Countries LNG Imports by Countries
• Total number of exporting countries increased from 17 in CY15 to 18 in CY16 as:
i)Angola and Egypt both returned to producing LNG following a halt in CY15 due to repair work,
ii)and Yemen, which exported LNG during 1HCY15, did not export a single cargo in CY16 due to ongoing instability
in the country.
• Total number of importing countries increased from 33 in 2015 to 35 in CY16, with Jamaica and Columbia entering the
industry.

Global Pricing Mechanism:
• Pricing in world gas markets is driven more by local and regional factors. Followingare the details pertaining to pricing contracts and mechanism more widely availablein the International Market:
• Pricing Contracts:
• Long-term contracts
• Medium-term
• Spot & Short-term contracts
• Pricing Mechanism:
1. Hub-Based: Prices are largely set at liquid trading hubs, the largest and most important of which is Henry Hub in Louisiana.
2. Oil-Linked: Without established and liquid gas trading markets, the price of LNG for majority of Asia and emerging markets is set via oil-linkages.
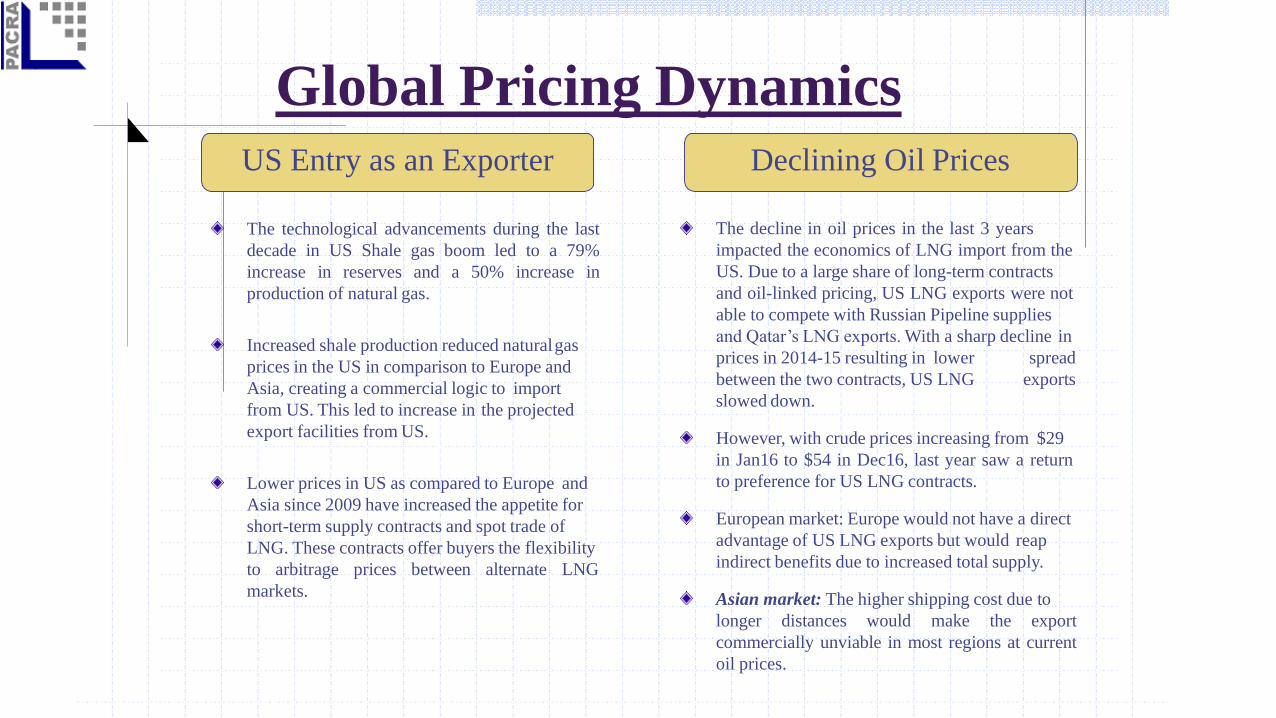
Global Pricing Dynamics
The technological advancements during the last
decade in US Shale gas boom led to a 79%
increase in reserves and a 50% increase in
production of natural gas.
Increased shale production reduced naturalgas
prices in the US in comparison to Europe and
Asia, creating a commercial logic to import
from US. This led to increase in the projected
export facilities from US.
Lower prices in US as compared to Europe and
Asia since 2009 have increased the appetite for
short-term supply contracts and spot trade of
LNG. These contracts offer buyers the flexibility
to arbitrage prices between alternate LNG
markets.
The decline in oil prices in the last 3 years
impacted the economics of LNG import from the
US. Due to a large share of long-term contracts
and oil-linked pricing, US LNG exports were not
able to compete with Russian Pipeline supplies
and Qatar’s LNG exports. With a sharp decline in
prices in 2014-15 resulting in lower
between the two contracts, US LNG
spread
exports
slowed down.
However, with crude prices increasing from $29
in Jan16 to $54 in Dec16, last year saw a return
to preference for US LNG contracts.
European market: Europe would not have a direct
advantage of US LNG exports but would reap
indirect benefits due to increased total supply.
Asian market: The higher shipping cost due to
longer distances would make the export
commercially unviable in most regions at current
oil prices.
US Entry as an Exporter Declining Oil Prices
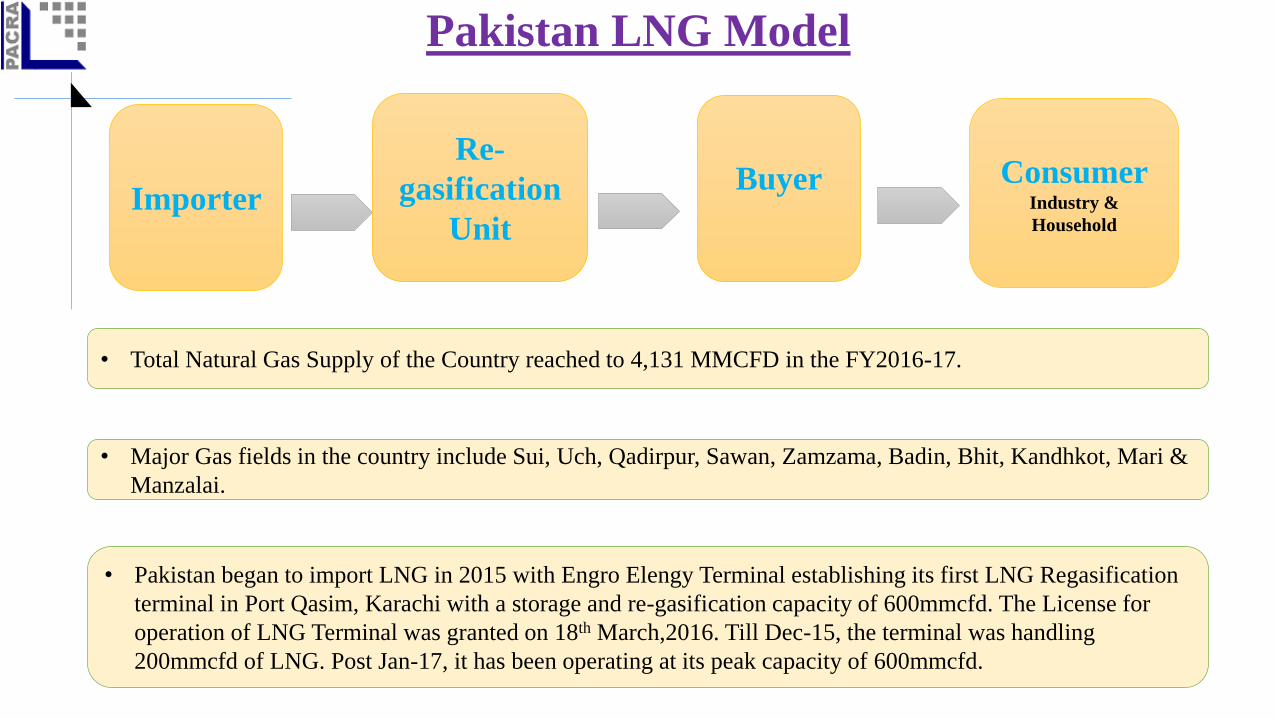
Pakistan LNG Model
Importer
Re-
gasification
Unit
Buyer ConsumerIndustry &
Household
• Total Natural Gas Supply of the Country reached to 4,131 MMCFD in the FY2016-17.
• Major Gas fields in the country include Sui, Uch, Qadirpur, Sawan, Zamzama, Badin, Bhit, Kandhkot, Mari &
Manzalai.
• Pakistan began to import LNG in 2015 with Engro Elengy Terminal establishing its first LNG Regasification
terminal in Port Qasim, Karachi with a storage and re-gasification capacity of 600mmcfd. The License for
operation of LNG Terminal was granted on 18th March,2016. Till Dec-15, the terminal was handling
200mmcfd of LNG. Post Jan-17, it has been operating at its peak capacity of 600mmcfd.

Domestic Industry | Gas Production & Consumption
Demand- ~6000mmcfd
Supply- ~4000mmcfd
Shortfall- ~2000mmcfd
Top 3 Companies Producing Natural Gas in FY17
Company Production (mmcf/year) % Production
Oil & Gas
Development Co. Ltd
383,615 25%
Pakistan Petroleum Ltd 329,367 22%
Mari Petroleum Co.
Ltd
243,820 16%
Total 956,802 63%
Others 551,013 37%
TOTAL 1,507,815 100%

LNG Imports License
Status of LNG Import Licenses
• The terminal for PGP Consortium Limited was completed in Nov-17 with a
maximum capacity of 750mmcfd and a project cost of $300mln. This project is
providing ~3,600MW of electricity generation for new RLNG-based power plants
set up by the Government.
• At present, two of the above LNG Terminals are operative – Engro Elengy and
PGP consortium Limited. Both are operative at a capacity of ~600mmcfd each.

Domestic Consumption | Natural Gas & LNG
Sector Natural Gas
Consumption
(mmcf/day)
% Share in
Consumption
(Natural Gas)
RLNG
Consumption
(mmcf/day)
% Share in
Consumption
(RLNG)
Power 980 30% 116 28%
Domestic 801 25% 0 0%
Commercial 89 3% 0% 0%
Transport 150 5% 43 10%
Fertilizer 611 18% 64 16%
General Industry 613 19% 187 46%
TOTAL 3,244 100% 410 100%
Sector Wise Natural gas & LNG Consumption (July 1,2016 to Feb 28, 2017)

Industry Developments | Terminals
• 3rd LNG Terminal (Expected CoD: FY19)
• Installation of a first merchant LNG Terminal without any government intervention –whereby import, regasification and supply – whole cycle would be managed by EngroElengy Terminal (Private) Limited. • Project being initiated by Engro Elengy Terminal (Pvt) Limited in partnership with Gunvor, Shell and Fatima group with a total project cost of $500mln.
4th LNG Terminal to be set-up by PGPC:
• After installation of its 1st floating FSRU with a re-gasification capacity of ~750mmcfd, Pakistan GasPort Consortium in collaboration with Trafigura – a Singaporean commodity trading company plans on establishing a new re-gasification unit which will operate entirely for the private sector without recourse to the Government. Details are yet to be disclosed.
5th LNG Terminal
• Exxon Mobil and Energas are also planning on installation of an FSRU near port Qasim. Related facts and timeline are not yet disclosed.

Potential benefits of LNG Revolution
• LNG is at least 30% more economical in use than CNG. Since Pakistan is one of the top CNG-
user countries, LNG availability to automobiles will result in considerable savings for
consumers as well as the Government.
• If the Railway Sector starts planning to switch from diesel-run locomotives to LNG, this would
save around 40-60% of the fuel cost.
• If the furnace-oil based power plants are replaced by more energy-efficient LNG based plants,
this is expected to save $1.5-2bln in foreign exchange annually.
• The availability of cheaper fuel will increase the country’s competitiveness, resulting in revival
of exports and the overall economy.

Challenges for LNG in Pakistan
• Pricing mechanism for commercial and households use of LNG is yet not clear.
• Devaluation of currency – RLNG based power generation costs higher than conventional
power plants.
• Inequitable tariff distribution amongst provinces.
• The emergence of circular debt may hamper the continuity of smooth operations.

Bibliography
1. 2017 World LNG Report | www.igu.org/publications
2. BP Statistical Review of World Energy June 2016 | www.bp.com
3. State of the Regulated Petroleum Industry 2015-16 | www.ogra.org.pk
4. US Energy Information Agency (EIA)
5. Impact of US LNG exports on Europe | www.energymining.org
6. Engro Elengy Terminal (Private) Limited
Analyst: Saniya Tauseef


