31
Radioactive Substances Series Liquid discharges from nuclear installations in 2010 2012

Rad
ioac
tive
Sub
stan
ces
Ser
ies
Liquid discharges from nuclear installations in 2010
2012

Liquid Discharges from nuclear installations in 2010
OSPAR Convention The Convention for the Protection of the Marine Environment of the North-East Atlantic (the “OSPAR Convention”) was opened for signature at the Ministerial Meeting of the former Oslo and Paris Commissions in Paris on 22 September 1992. The Convention entered into force on 25 March 1998. The Contracting Parties are Belgium, Denmark, the European Union, Finland, France, Germany, Iceland, Ireland, Luxembourg, the Netherlands, Norway, Portugal, Spain, Sweden, Switzerland and the United Kingdom.
Convention OSPAR
La Convention pour la protection du milieu marin de l'Atlantique du Nord-Est, dite Convention OSPAR, a été ouverte à la signature à la réunion ministérielle des anciennes Commissions d'Oslo et de Paris, à Paris le 22 septembre 1992. La Convention est entrée en vigueur le 25 mars 1998. Les Parties contractantes sont l'Allemagne, la Belgique, le Danemark, l’Espagne, la Finlande, la France, l’Irlande, l’Islande, le Luxembourg, la Norvège, les Pays-Bas, le Portugal, le Royaume-Uni de Grande Bretagne et d’Irlande du Nord, la Suède, la Suisse et l’Union européenne.
Acknowledgement This report has been prepared by the Expert Assessment Panel of the OSPAR Radioactive Substances Committee, comprising of Mr Henning Natvig (convenor), Norway, Mr Michel Chartier, France and Mrs Ann-Christin Hägg, Sweden with the support of Ms Luisa Rodriguez Lucas and Ms Corinne Michel of the OSPAR Secretariat.

OSPAR Commission, 2012
3
Contents Executive summary .................................................................................................................. 4
Récapitulatif ............................................................................................................................. 4
1. Introduction ..................................................................................................................... 5
1.1 Programmes and measures ....................................................................... 6
1.2 Annual reporting ........................................................................................ 6
1.3 Parameters monitored and reported .......................................................... 7
2. Assessment of the liquid radioactive discharges from nuclear installations in 2010 ...... 8
2.1 Introduction ................................................................................................ 8
2.2 Trends in total alpha discharges ................................................................ 8
2.3 Trends in tritium discharges ....................................................................... 8
2.4 Trends in total beta discharges .................................................................. 9
3. 2010 data and information ............................................................................................ 16
3.1 Map of nuclear installations ..................................................................... 17
3.2 Location of nuclear installations ............................................................... 18
3.3 Endnotes to data tables 4 to 8 ................................................................. 27
References ............................................................................................................................. 30

Liquid Discharges from Nuclear Installations in 2010
4
Executive summary
Discharges of radioactive substances measured as total alpha and total beta activity and excluding tritium from nuclear installations have decreased over the period 1990 – 2010. The discharges of tritium peaked in 2004.
This annual report includes the data of 2010 on liquid radioactive discharges from nuclear installations and temporal trends for the period 1990 - 2010. On this basis, an assessment has been made for the discharges from nuclear power stations, nuclear fuel reprocessing plants, nuclear fuel fabrication and enrichment plants, research and development facilities, and decommissioning and management of legacy radioactive wastes activities. Discharges are reported as total alpha, tritium and total beta activity (excluding tritium) in terabecquerel per year (TBq/y) for each type of nuclear installation.
There is a decrease in the total alpha activity discharged from all nuclear installations over the 20-year period. Discharges are at the same level as in 2009 after a slight increase in the total alpha activity discharged in 2009 from nuclear installations relative to 2008. Discharges continue to account less than one-tenth of the peak value in 1993. In 2010, there was a 23% increase compared to 2009 in alpha discharges from the fuel fabrication sub-sector at the Springfields site. However, there was a 13% decrease of alpha discharges from the reprocessing plant at Sellafield compared to 2009. Although the figures from La Hague contributed 14% to the overall total alpha discharge there was a 69% increase from 2009. Total alpha discharges arising from decommissioning are insignificant.
Downward trends for discharges of tritium since 2004 were re-established. However, such trends were related to reprocessing throughput and could rise or fall in the future. La Hague registered an increase of 9% in discharges in 2010 whereas Sellafield saw a decrease of 8%. Discharges of tritium from nuclear power stations contributed nearly 20% of the total tritium discharge. Due to an incident in a Norwegian reactor, there was an increase in the research and development facilities sector. Tritium discharges arising from decommission are a very minor contributor although quite variable.
Total beta discharges (excluding tritium) from all nuclear installations are dominated by discharges from the reprocessing plant which contributed approximately 65% of the overall discharges. There was a 50% reduction in Tc-99 discharges in 2010 at Sellafield compared with 2009 figures. However, total beta discharges from the fuel fabrication sub-sector at Springfields increased by 33% compared to the 2009 figure. Total beta discharges (excluding tritium) arising from decommissioning were insignificant.
Récapitulatif
La mesure des activités d’alpha total et de bêta total, à l’exclusion du tritium, révèle que les rejets de substances radioactives, provenant des installations nucléaires, ont diminué entre 1990 et 2010. Les rejets de tritium ont atteint leur maximum en 2004.
Le présent rapport annuel comporte les données de 2010 sur les rejets radioactifs liquides provenant des installations nucléaires et les tendances temporelles pour la période de 1990 à 2010. Une évaluation a été réalisée, à partir de ces informations, portant sur les rejets provenant des centrales nucléaires, des usines de retraitement de combustible nucléaire, des usines de production de combustible nucléaire et des usines d’enrichissement, des installations de recherche et de développement ainsi que le démantèlement et la gestion des déchets radioactifs du passé. Les rejets sont notifiés au titre des activités d’alpha total, de tritium et de bêta total (à l’exclusion du tritium) et exprimés en terabecquerel par an (TBq/y) pour chaque type d’installation nucléaire.
L’activité d’alpha total rejetée par toutes les installations nucléaires a diminué au cours des vingt dernières années. Les rejets sont redescendus au même niveau qu’en 2009, après une légère augmentation de l’activité d’alpha total en 2009 des installations nucléaires à comparer à 2008. Néanmoins, les rejets

OSPAR Commission, 2012
5
d’activité alpha représentent un dixième du maximum enregistré en 1993. Par rapport à 2009, on note une augmentation de 23 % des rejets d’activité alpha des usines de production de combustible nucléaire à Springfields et une réduction de 13 % des usines de retraitement de combustible nucléaire à Sellafield. La Hague a contribué 14% de l’ensemble des rejets d’activité d’alpha ; cependant cela représente une augmentation de 69% des rejets de l’usine par rapport à 2009. Les rejets de total alpha provenant du déclassement sont insignifiants.
Les tendances à la baisse des rejets de tritium que l'on observe depuis 2004 se sont confirmées. Toutefois, ces tendances sont liées au débit des usines de retraitement, et pourraient augmenter ou diminuer à l’avenir. On a enregistré une augmentation de 9% des rejets en 2010 à la Hague tandis qu’à Sellafield une réduction de 8% s’est avérée. En raison d’un accident dans un réacteur norvégien, il y a une hausse des activités d’alpha total dans le secteur de la recherche et du développement. Les rejets du tritium provenant du déclassement sont insignifiants mais variables.
Les rejets totaux de total bêta (à l’exclusion du tritium) émanant de toutes les installations nucléaires représentent pour la plupart les rejets des usines de retraitement, contribuant environ 65% de l’ensemble des rejets. On relève une réduction de 50 % des rejets de Tc-99 de Sellafield par rapport à 2009. Toutefois, pour cette même période on note une hausse de 33 % de l’usine de production de combustible nucléaire à Springfield. Les rejets de total bêta (à l’exclusion du tritium) provenant du déclassement sont insignifiants.
1. Introduction
Work to prevent and reduce pollution from ionising radiation in the North-East Atlantic was first undertaken within the framework of the former 1974 Convention for the Prevention of Marine Pollution from Land-based Sources (the “Paris Convention”) and then under the 1992 Convention for the Protection of the Marine Environment of the North-East Atlantic (the “OSPAR Convention”), which replaces the Paris Convention and establishes the OSPAR Commission.
At the first Ministerial Meeting of the OSPAR Commission (20-24 July 1992, Sintra, Portugal), an OSPAR Strategy for Radioactive Substances was adopted to guide the future work of the OSPAR Commission on protecting the marine environment of the North-East Atlantic against radioactive substances arising from human activities. This strategy was revised at the third Ministerial Meeting of the OSPAR Commission (23-24 September 2010, Bergen, Norway), , where the Strategy of the OSPAR Commission for the Protection of the Marine Environment of the North-East Atlantic 2010-2020 (the “North East Strategy”) was adopted.
The North-East Atlantic Environment Strategy sets out OSPAR’s vision, objectives, strategic directions and action for the period up to 2020. In Part I, the new Strategy gives prominence to the overarching implementation of the ecosystem approach and the need for integration and coordination of OSPAR’s work across themes and groups. In Part II, the Strategy provides its thematic strategies for Biodiversity and Ecosystems, Eutrophication, Hazardous Substances, Offshore Oil and Gas Industry and Radioactive Substances.
The Radioactive Substances thematic Strategy (Radioactive Substances Strategy) sets the objective of preventing pollution of the OSPAR maritime area from ionising radiation through progressive and substantial reductions of discharges, emissions and losses of radioactive substances, with the ultimate aim of concentrations in the environment near background values for naturally occurring radioactive substances and close to zero for artificial radioactive substances. In achieving this objective the following issues should, inter alia, be taken into account: (1) radiological impacts on man and biota, (2) legitimate uses of the sea, and (3) technical feasibility.
As its timeframe, the Radioactive Substances Strategy further declares that the OSPAR Commission will implement this Strategy progressively by making every endeavour, through appropriate actions and measures to ensure that by the year 2020 discharges, emissions and losses of radioactive substances are

Liquid Discharges from Nuclear Installations in 2010
6
reduced to levels where the additional concentrations in the marine environment above historic levels, resulting from such discharges, emissions and losses, are close to zero.
The Radioactive Substances Strategy provides that in accordance with the provisions of the OSPAR Convention and the findings of the Quality Status Report 2010, the OSPAR Commission will, where appropriate, develop and maintain programmes and measures to identify, prioritise, monitor and control the emissions, discharges and losses of the radioactive substances caused by human activities which reach or could reach the marine environment.
To this end, the Radioactive Substances Strategy requires the OSPAR Commission to continue the annual collection of data on discharges of radionuclides from the nuclear sector. Regular reporting is therefore required in order to review progress towards the targets of the Radioactive Substances Strategy.
1.1 Programmes and measures
Since the mid 1980s, liquid discharges of radioactive substances from nuclear installations have been addressed first under the former Paris Convention and then under the OSPAR Convention. The following relevant measures 1 are applicable 2 under the OSPAR Convention:
PARCOM Recommendation 88/4 on Nuclear Reprocessing Plants;
PARCOM Recommendation 91/4 on Radioactive Discharges 3;
PARCOM Recommendation 94/8 Concerning Environmental Impact Resulting from Discharges of Radioactive Discharges 4;
OSPAR Decision 2000/1 on Substantial Reductions and Elimination of Discharges, Emissions and Losses of Radioactive Discharges, with Special Emphasis on Nuclear Reprocessing.
The OSPAR Radioactive Substances Committee agreed at its meeting in 2006 that discharges from “decommissioning and recovery of old waste” should be reported by Contracting Parties as “exceptional discharges”.
The OSPAR First and Third Periodic Evaluation of the Progress in Implementing the OSPAR Radioactive Substances Strategy, published in 2006 and 2009, have also informed this report. (OSPAR, 2006 and OSPAR, 2009).
1.2 Annual reporting
In 1985, Contracting Parties to the former Paris Convention initiated reporting on liquid discharges from nuclear installations. These data have subsequently been submitted annually by Contracting Parties, collated by the Secretariat and, following examination by the Expert Assessment Panel (EAP) of the OSPAR Radioactive Substances Committee, published by the OSPAR Commission in the form of annual reports. At first annual reports were published as part of the OSPAR Commission's general Annual Report, and from 1991 onwards they are published in the form of Annual OSPAR Reports on Liquid Discharges from Nuclear Installations in the OSPAR maritime area. . From 1998 onwards, the annual reports also contain an
1 All measures referred to in this section can be downloaded from the OSPAR website www.ospar.org (under
"programmes and measures"). 2 OSPAR Decision 2000/1: France and the United Kingdom abstained from voting. 3 The implementation of this Recommendation requires an assessment to be carried out as to whether BAT is being
applied in nuclear installations. Contracting Parties submit national reports that also contain discharge data on a regular basis thereby using the Guidelines for the submission of information about, and the assessment of, the application of BAT in nuclear facilities (reference number: 2004-03).
4 Assessments of the effect and relative contributions of remobilised historical discharges and current discharges of radioactive substances, including wastes, on the marine environment have been published in the Quality Status Report 2000 published by the OSPAR Commission in 2000 (ISBN 0 946956 52 9) and in the MARINA II Report published by the European Commission (EC, 2003).

OSPAR Commission, 2012
7
assessment of liquid discharges which include a description of the trends from 1989 until the date of the latest report. Over time, reporting requirements and formats for data collection as regards nuclear installations have been regularly reviewed and updated in the light of experience and ongoing work under the OSPAR Commission. With a view to harmonising the way in which data and information are being established and reported, the OSPAR Commission adopted in 1996 a set of reporting formats for the annual Collection of Data on Liquid Discharges from Nuclear Installations (OSPAR agreement number: 1996-02.), which were updated in 2010 to include a guide to generate “total-alpha” and “total-beta” discharge data.
RSC decided at the meeting in 2006, that for data from 2005 onwards, discharges arising from decommissioning and the recovery and conditioning of legacy wastes should be reported separately from operational nuclear discharges. The discharges from such activities were reported as “Exceptional Discharges” and appear in this report in a separate table.
1.3 Parameters monitored and reported
Tables 1-8 of this report contain data on total alpha (Table 1), tritium (Table 2), total beta (Table 3), and individual radionuclides (Tables 4-8). Figures 1-3 of this report show trends in discharges of total alpha activity, tritium and total beta activity respectively.
Total alpha and total beta values are useful as they will encompass the contribution to the overall activity from a wide range of radionuclides which, individually, would be difficult to measure or could be below detection limits. However, total alpha and total beta values provide limited information about the potential harm as such information should be based on the characteristics of individual radionuclides. Tritium is reported separately.
There is currently little consistency in the approach adopted by Contracting Parties in the assessment of total alpha and total beta quantities. Consequently, for the purposes of this report total alpha quantities include measurements that are strictly gross alpha. Similarly for total beta, quantities as gross beta measurements are included.
Total alpha represents the measured radioactivity of alpha particle emitting radionuclides. These particles are emitted as a result of the decay of certain radionuclides, the so-called α-emitters. On average, the total liquid discharges of α-emitters from all nuclear sites represent mainly Pu-239, Pu-240 and Am-241 and, to a lesser extent, Th-230, Pu-238 and some other nuclides. Total beta represents the measured radioactivity of beta particle emitting radionuclides. These particles are emitted as a result of the decay of certain radionuclides, the so-called β-emitters. On average, the total liquid discharges of β-emitters from all nuclear sites represent mainly Ru-106, Sr-90, Pu-241, Cs-137, Tc-99 and, to a lesser extent, a range of other radionuclides. Total beta in this report excludes tritium, which is reported separately.
Tritium (H-3) is an isotope of hydrogen that emits low-energy radiation in the form of beta particles. Tritium is discharged from most nuclear power plants, reprocessing plants and some research and development facilities.

Liquid Discharges from Nuclear Installations in 2010
8
2. Assessment of the liquid radioactive discharges from nuclear installations in 2010
2.1 Introduction
Tables 1-3 summarise liquid radioactive discharges from nuclear installations for the period 1990 – 2010. Data for 1990–2009 are taken from previous OSPAR Annual Reports on Liquid Discharges from Nuclear Installations. Reported discharges include data from nuclear power stations, nuclear fuel reprocessing plants, nuclear fuel fabrication and enrichment plants, and research and development facilities. Since 2006, discharges from decommissioning are reported separately.
For each type of nuclear installation, Table 1 gives total alpha activity, Table 2 gives tritium and Table 3 gives total beta activity (excluding tritium) in terabecquerel per year (TBq/y) as well as the ratio, as a percentage, of the total discharges from all installations. To facilitate comparison of the discharges year by year, Figures 1 to 3 show trends for total alpha, tritium and total beta (excluding tritium) for the time period 1990 to 2010.
2.2 Trends in total alpha discharges
Figure 1 shows that the total alpha activity discharged in 2010 from all nuclear installations is on the same level as in 2009 after a very slight increase in 2009 relative to 2008. The position remains that discharges of alpha activity continue to be less than one-tenth of the peak value in 1993 and lower than 2006 and all previous years.
As regards the fuel reprocessing sub-sector, in 2010 the total alpha discharge from Sellafield was 0,134TBq (Table 5), which is 13% lower than the previous five years (2005: 0,25TBq; 2006: 0,21TBq; 2007: 0,125TBq; 2008: 0,127TBq; 2009: 0,154TBq). The decrease at Sellafield was offset by an increase in discharges from the reprocessing plant at La Hague. In 2010 the La Hague plant contributed 0,022TBq (14%) to the overall total alpha discharge (Table 5), which is in line with the 2005 – 2008 discharges from this plant (2005: 0,022TBq; 2006: 0,025 TBq; 2007: 0,021 TBq; 2008: 0,020 TBq). However, a 69% increase from 2009 (0,013TBq) contrasts sharply with a seemingly unusual year of low discharges. This change reflects mainly fuel throughput, burn up and decay.
The discharges from the fuel fabrication sub-sector have increased in 2010 relative to 2009.The total alpha discharge from the Springfields site during 2010 was 0,021 TBq (Table 6), which is about 23% higher than in 2009 (2009: 0,017TBq). ). This amounts to 12% of the overall total alpha discharge over the last five years (2005: 0,25TBq; 2006: 0,11TBq; 2007: 0,026TBq; 2008: 0,022TBq; 2009: 0,017TBq).
Discharges from research and development facilities continue to decline and for 2010 were only 62 MBq in total (Table 7), a 14% reduction on 2009. Total alpha discharges arising from decommissioning (Table 8) have been recorded separately since 2006, but do not contribute significantly to the overall total.
2.3 Trends in tritium discharges
Figure 2 presents the discharges of tritium, in terms of activity. The sum of the tritium discharges from all installations increased from around 8000TBq/y during the period 1990 - 1992 to a peak of 20637TBq in 2004 (Table 2). This increase was mainly due to the discharges from La Hague (2001: 9650TBq; 2002: 12000TBq; 2003: 11900TBq; 2004: 13900TBq). During the period 2005 to 2006 discharges of tritium from La Hague fell significantly (2005: 13500TBq; 2006: 11100TBq), but rose by 8% in 2007 (12000TBq). In 2008 the tritium discharges from La Hague fell to 8190TBq, but rose by 11% in 2009 to 9130TBq. In 2010 the discharges from La Hague rose further by 9% to 9950TBq (Table 5). As mentioned in earlier reports, tritium discharges tend to follow trends in reprocessing throughput. The reprocessing plant at La Hague
OSPAR Commission, 2012
9
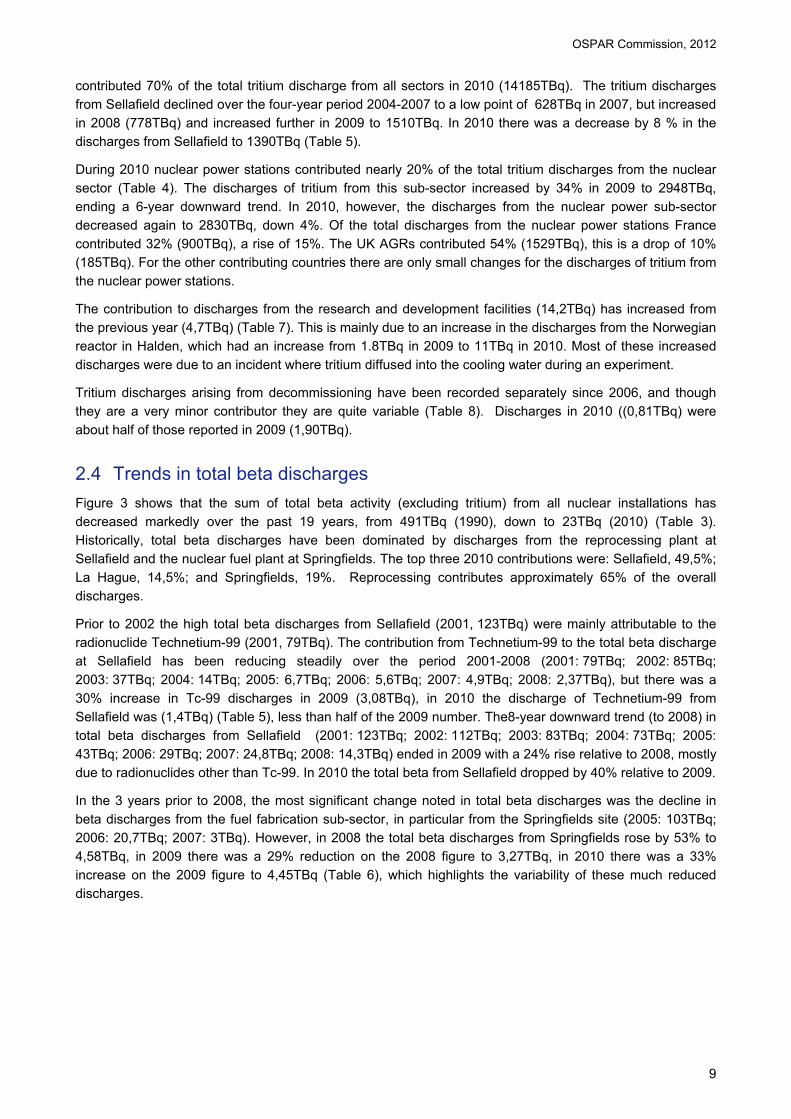
contributed 70% of the total tritium discharge from all sectors in 2010 (14185TBq). The tritium discharges from Sellafield declined over the four-year period 2004-2007 to a low point of 628TBq in 2007, but increased in 2008 (778TBq) and increased further in 2009 to 1510TBq. In 2010 there was a decrease by 8 % in the discharges from Sellafield to 1390TBq (Table 5).
During 2010 nuclear power stations contributed nearly 20% of the total tritium discharges from the nuclear sector (Table 4). The discharges of tritium from this sub-sector increased by 34% in 2009 to 2948TBq, ending a 6-year downward trend. In 2010, however, the discharges from the nuclear power sub-sector decreased again to 2830TBq, down 4%. Of the total discharges from the nuclear power stations France contributed 32% (900TBq), a rise of 15%. The UK AGRs contributed 54% (1529TBq), this is a drop of 10% (185TBq). For the other contributing countries there are only small changes for the discharges of tritium from the nuclear power stations.
The contribution to discharges from the research and development facilities (14,2TBq) has increased from the previous year (4,7TBq) (Table 7). This is mainly due to an increase in the discharges from the Norwegian reactor in Halden, which had an increase from 1.8TBq in 2009 to 11TBq in 2010. Most of these increased discharges were due to an incident where tritium diffused into the cooling water during an experiment.
Tritium discharges arising from decommissioning have been recorded separately since 2006, and though they are a very minor contributor they are quite variable (Table 8). Discharges in 2010 ((0,81TBq) were about half of those reported in 2009 (1,90TBq).
2.4 Trends in total beta discharges
Figure 3 shows that the sum of total beta activity (excluding tritium) from all nuclear installations has decreased markedly over the past 19 years, from 491TBq (1990), down to 23TBq (2010) (Table 3). Historically, total beta discharges have been dominated by discharges from the reprocessing plant at Sellafield and the nuclear fuel plant at Springfields. The top three 2010 contributions were: Sellafield, 49,5%; La Hague, 14,5%; and Springfields, 19%. Reprocessing contributes approximately 65% of the overall discharges.
Prior to 2002 the high total beta discharges from Sellafield (2001, 123TBq) were mainly attributable to the radionuclide Technetium-99 (2001, 79TBq). The contribution from Technetium-99 to the total beta discharge at Sellafield has been reducing steadily over the period 2001-2008 (2001: 79TBq; 2002: 85TBq; 2003: 37TBq; 2004: 14TBq; 2005: 6,7TBq; 2006: 5,6TBq; 2007: 4,9TBq; 2008: 2,37TBq), but there was a 30% increase in Tc-99 discharges in 2009 (3,08TBq), in 2010 the discharge of Technetium-99 from Sellafield was (1,4TBq) (Table 5), less than half of the 2009 number. The8-year downward trend (to 2008) in total beta discharges from Sellafield (2001: 123TBq; 2002: 112TBq; 2003: 83TBq; 2004: 73TBq; 2005: 43TBq; 2006: 29TBq; 2007: 24,8TBq; 2008: 14,3TBq) ended in 2009 with a 24% rise relative to 2008, mostly due to radionuclides other than Tc-99. In 2010 the total beta from Sellafield dropped by 40% relative to 2009.
In the 3 years prior to 2008, the most significant change noted in total beta discharges was the decline in beta discharges from the fuel fabrication sub-sector, in particular from the Springfields site (2005: 103TBq; 2006: 20,7TBq; 2007: 3TBq). However, in 2008 the total beta discharges from Springfields rose by 53% to 4,58TBq, in 2009 there was a 29% reduction on the 2008 figure to 3,27TBq, in 2010 there was a 33% increase on the 2009 figure to 4,45TBq (Table 6), which highlights the variability of these much reduced discharges.

Liquid Discharges from nuclear installations in 2010
10
Table 1. Total alpha discharges 1990-2010
1990 1991 1992 1993 1994 1995 1996 1997 1998 1999 2000 2001 2002 2003 2004 2005 2006 2007 2008 2009
2010
All Nuclear
Installations (TBq) 2,43 2,43 1,84 2,88 1,36 0,68 0,57 0,38 0,43 0,41 0,33 0,41 0,61 0,62 0,54 0,52 0,34 0,19 0,17 0,19 0,18
Reprocessing Plants
(TBq) 2,20 2,25 1,71 2,70 1,10 0,47 0,32 0,23 0,22 0,17 0,16 0,25 0,39 0,43 0,31 0,27 0,23 0,15 0,14 0,17
0,16
% of all installations 90,5 92,6 92,9 93,8 80,9 69,1 56,1 61,0 50,9 41,2 47,7 59,9 63,3 69,8 57,3 51,7 68,2 76,54 83,46 88,9
85,9
Nuclear Power Plants (TBq) - - - - - - - - - - - - - - - - - - - -
-
% of all installations - - - - - - - - - - - - - - - - - - - - -
Nuclear Fuel
Fabrication (TBq) 0,21 0,15 0,10 0,08 0,16 0,12 0,12 0,12 0,20 0,24 0,17 0,16 0,22 0,18 0,23 0,25 0,11 0,04 0,02 0,02
0,02
% of all installations 8,6 6,2 5,4 2,8 11,8 17,6 21,1 31,8 46,1 58,1 51,7 39,7 36,3 29,5 42,5 48,1 31,6 23,09 12,84 9,1
11,6
R&D Facilities (TBq) 0,02 0,03 0,03 0,10 0,10 0,09 0,13 0,03 0,01 0,00 0,00 0,00 0,00 0,00 0,00 0,00 0,00 0,00 0,00 0,00
0,0
% of all installations 0,8 1,2 1,6 3,5 7,4 13,2 22,8 7,2 3,0 0,7 0,5 0,4 0,3 0,7 0,2 0,2 0,0 0,06 0,05 0,03
0,03
Decommissioning (TBq) 0,00 0,00 0,01 0,00
0,0
% of all installations 0,2 0,31 3,65 1,9
2,5

OSPAR Commission, 2012
11
Table 2. Tritium discharges 1990-2010
1990 1991 1992 1993 1994 1995 1996 1997 1998 1999 2000 2001 2002 2003 2004 2005 2006 2007 2008 2009 2010
All Nuclear Installations (TBq)
7224 8798 7658 10902 12931 15040 16779 17956 16244 18771 16548 15759 18880 19637 20637 18517 15607 15594 11178 13593
14185
Reprocessing Plants (TBq) 4959 6513 4969 7460 9770 12310 13500 14500 12800 15420 13300 12210 15220 15800 17070 15070 12190 12628 8968 10640
11340
% of all installations 68,6 74,0 64,9 68,4 75,6 81,8 80,5 80,8 78,8 82,1 80,4 77,5 80,6 80,5 82,7 81,4 78,6 81,0 80,2 78,3
79,9
Nuclear Power Plants (TBq) 2164 2252 2666 3354 3044 2713 3264 3440 3430 3335 3241 3543 3648 3819 3560 3429 3394 2936 2193 2948
2830
% of all installations 30,0 25,6 34,8 30,8 23,5 18,0 19,5 19,2 21,1 17,8 19,6 22,5 19,3 19,4 17,3 18,5 21,7 18,8 19,6 21,7
19,9
Nuclear Fuel Fabrication (TBq) - - - - - - - - - - - - - - - - - - - -
-
% of all installations - - - - - - - - - - - - - - - - - - - - -
R&D Facilities (TBq) 101 32 24 88 118 17 15 16 14 16 7 6 12 18 7 18 5 6 6 4,7
14,22
% of all installations 1,4 0,4 0,3 0,8 0,9 0,1 0,1 0,1 0,1 0,1 0,0 0,0 0,1 0,1 0,0 0,1 0,0 0,0 0,1 0,0
0,1
Decommissioning (TBq) 16,90 25,07 11,18 1,90
0,81
% of all installations 0,1 0,16 0,10 0,0
0,0

Liquid Discharges from nuclear installations in 2010
12
Table 3. Total beta (other radionuclides excluding tritium) discharges 1990-2010
1990 1991 1992 1993 1994 1995 1996 1997 1998 1999 2000 2001 2002 2003 2004 2005 2006 2007 2008 2009
2010
All Nuclear Installations (TBq) 491 227 269 252 321 365 332 315 265 256 172 231 235 198 204 105 58 33,42 27,23
29,81
23,05
Reprocessing Plants (TBq) 384 178 134 170 195 243 169 167 112 126 98 141 125 97 86 54 37 29,61 20,67 21,34 14,74
% of all installations 78,2 78,4 49,7 67,4 60,8 66,5 50,9 53,0 42,3 49,1 56,9 61,2 53,1 49,0 42,3 51,8 62,5 88,6 75,9 71,6
64
Nuclear Power Plants (TBq) 10,3 3,8 8,9 11,1 2,8 3,4 5,2 7,4 2,0 2,0 3,0 4,2 3,6 3,2 1,3 2,0 0,75 0,46 1,53 2,1
3,2
% of all installations 2,1 1,7 3,3 4,4 0,9 0,9 1,6 2,3 0,8 0,8 1,7 1,8 1,5 1,6 0,6 1,9 1,3 1,4 5,6 7
14,0
Nuclear Fuel Fabrication (TBq) 92 39 120 63 114 112 150 140 150 128 71 85 106 97 116 103 21 3 5 3,3
4,4
% of all installations 18,7 17,1 44,6 25,0 35,5 30,7 45,1 44,4 56,7 49,9 41,2 36,8 45,1 49,1 56,8 98,0 35,4 8,9 16,8 11
19,3
R&D Facilities (TBq) 4,5 6,3 6,6 8,2 9,1 7,0 8,1 1,0 0,66 0,36 0,30 0,46 0,46 0,44 0,47 0,09 0,06 0,13 0,07 2,31
0,02
% of all installations 0,9 2,8 2,5 3,2 2,8 1,9 2,4 0,3 0,2 0,1 0,2 0,2 0,2 0,2 0,2 0,1 0,1 0,4 0,2 7,7
0,1
Decommissioning (TBq) 0,40 0,04 0,38 0,80
0,59
% of all installations 0,0 0,1 1,4 2,7
2,6

OSPAR Commission, 2012
13
0,0
0,5
1,0
1,5
2,0
2,5
3,0
3,5
1990 1991 1992 1993 1994 1995 1996 1997 1998 1999 2000 2001 2002 2003 2004 2005 2006 2007 2008 2009 2010
TB
q
Research and Development Facilities Nuclear Fuel Fabrication and Enrichment PlantsDecommissioning Reprocessing PlantsAll Nuclear Facilities Lineær (Nuclear Fuel Fabrication and Enrichment Plants)
Figure 1: Total Alpha Discharges (1990-2010)

Liquid Discharges from nuclear installations in 2010
14
0
5000
10000
15000
20000
25000
1990 1991 1992 1993 1994 1995 1996 1997 1998 1999 2000 2001 2002 2003 2004 2005 2006 2007 2008 2009 2010
TBq
Research and Development Facilities Reprocessing Plants Decommissioning Nuclear Power Plants All Nuclear Facilities
Figure 2: Tritium Discharges (1990-2010)

OSPAR Commission, 2012
15
0
100
200
300
400
500
600
1990 1991 1992 1993 1994 1995 1996 1997 1998 1999 2000 2001 2002 2003 2004 2005 2006 2007 2008 2009 2010
TB
q
Research and Development Facilities Nuclear Fuel Fabrication and Enrichment Plants Decommissioning
Reprocessing Plants Nuclear Power plants All Nuclear Facilities Figure 3: Total Beta discharges (other radionuclides excluding tritium) (1990-2010)

Liquid Discharges from nuclear installations in 2010
16
3. 2010 data and information
This section presents information on the location of the nuclear installations and data and information on liquid discharges for each OSPAR Contracting Party under the following categories of nuclear installations draining into the OSPAR maritime area:
Table 4: Nuclear Power Stations;
Table 5: Nuclear Fuel Reprocessing Plants;
Table 6: Nuclear Fuel Fabrication and Enrichment Plants;
Table 7: Research and Development Facilities;
Table 8: Discharges from decommissioning and treatment/recovery of old radioactive waste.
Further detailed information with respect to individual plants is presented in endnotes after the entire set of tables.
The columns, headings and abbreviations used in the tables correspond to the reporting requirements set out in the current reporting format (OSPAR Agreement No. 1996-02-update 2010). The following abbreviations are used in the tables:
AGR: Advanced Gas Cooled Reactor;
GCR: Gas Cooled Reactor;
UNGG: Natural Uranium Gas Graphite (French equivalent for GCR);
PWR: Pressurised Water Reactor;
THTR: Thorium High Temperature Reactor;
BWR: Boiling Water Reactor;
NA: Not applicable;
NI: No information;
ND: Not detectable.
For radionuclides:
Ag: Silver Gd: Gadolinium Rh: Rhodium
Am: Americium I: Iodine Ru: Ruthenium
Ba: Barium Mn: Manganese S: Sulphur
Be: Beryllium Na: Sodium Sb: Antimony
C: Carbon Nb: Niobium Se: Selenium
Ce: Cerium Ni: Nickel Sr: Strontium
Cm: Curium Np: Neptunium Tc: Technetium
Co: Cobalt Pm: Promethium Th: Thorium
Cr: Chromium Pr: Praseodymium U: Uranium
Cs: Caesium Pu: Plutonium Y: Yttrium
Eu: Europium Ra: Radium Zn: Zinc
Fe: Iron Rb: Rubidium Zr: Zirconium
All data on discharge limits and releases of radionuclides have been entered in the tables using continental decimal system. The data values are expressed in scientific number format, e.g. 0,0009 as 9,0E-04.

OSPAR Commission, 2012
17
3.1 Map of nuclear installations
The map shows the location of nuclear facilities in OSPAR countries discharging directly or indirectly to the OSPAR maritime area.

Liquid Discharges from nuclear installations in 2010
18
3.2 Location of nuclear installations
The location and type of each installation is listed in the table below.
Country / Code Name of installation Type Discharging into Belgium BE1 Doel NPS Schelde BE2 Tihange NPS Meuse BE3 Mol RDF River Mol-Neet Denmark DK1 Risø DMLRW Kattegat through Roskilde Fjord France FR1 Belleville NPS Loire FR2 Cattenom NPS Mosel FR3 Chinon NPS Loire FR4 Chooz NPS/
DMLRW Meuse
FR5 Civaux NPS Vienne FR6 Dampierre en-Burly NPS Loire FR7 Fessenheim NPS Rhine FR8 Flamanville NPS Channel FR9 Fontenay-aux-Roses DMLRW Seine FR10 Golfech NPS Garonne FR11 Gravelines NPS North Sea FR12 Le Blayais NPS Gironde Estuary FR13 La Hague NFRP/
DMLRW English Channel
FR14 Nogent-sur-Seine NPS Seine FR15 Paluel NPS Channel FR16 Penly NPS Channel FR17 Saclay RDF Etang de Saclay FR18 Saint Laurent NPS Loire Germany DE1a Biblis A NPS Rhine DE1b Biblis B NPS Rhine DE2 Brokdorf NPS Elbe DE3 Brunsbüttel NPS Elbe DE4 Grafenrheinfeld NPS Main DE5 Grohnde/Emmerthal NPS Weser DE7 Kahl DMLRW Main – Shut down DE8a Krümmel/Geesthacht NPS Elbe DE8b Geesthacht RDF Elbe DE9a Lingen/Emsland NPS Ems DE9b Lingen DMLRW Ems - via municipal sewer system – Shut
down DE10 Mülheim-Kärlich DMLRW Rhine – Shut down DE11a Neckar-westheim 1 NPS Neckar DE11b Neckar-wesheim 2 NPS Neckar DE12 Obrigheim DMLRW Neckar – Shut down DE13a Philippsburg KKP1 NPS Rhine DE13b Philippsburg KKP2 NPS Rhine DE14 Rheinsberg DMLRW Havel – Shut down DE15 Stade DMLRW Elbe – Shut down DE16 Rodenkirchen-Unterweser NPS Weser DE17 Würgassen/Beverungen DMLRW Weser – Shut down DE18 Karlsruhe RDF Rhine DE19 Gronau NFFEP Vechte, IJsselmeer DE20 Hanau NFFEP Main - via municipal sewer system – Shut
down DE22 HMI Berlin RDF Havel

OSPAR Commission, 2012
19
Country / Code Name of installation Type Discharging into DE23 Jülich RDF Rur DE24 Rossendorf RDF Elbe – Shut down The Netherlands NL1 Borssele NPS Scheldt Estuary NL3 Almelo NFFEP Municipal sewer system NL4 Delft RDF Sewage system NL5 Petten RDF North Sea Norway NO1 Halden RDF River Tista (Skagerrak) NO2 Kjeller RDF River Nitelva (Skagerrak) Portugal PT1 Campus de Sacavém RDF Tagus River Spain ES1 Almaraz NPS Tagus ES2 José Cabrera DMLRW Tagus ES3 Trillo NPS Tagus ES4 Juzbado NFFEP River Tormes - Duero Sweden SE2 Ringhals 1-4 NPS Kattegat Switzerland CH1 Beznau NPS Aare CH2 Gösgen NPS Aare CH3 Leibstadt NPS Rhine CH4 Mühleberg NPS Aare CH5 Paul Scherrer Institute RDF Aare CH6 ZWILAG Würenlingen DMLRW Aare United Kingdom UK1 Berkeley DMLRW Severn Estuary UK2 Bradwell DMLRW North Sea UK3 Calder Hall DMLRW Irish Sea UK4 Chapelcross DMLRW Solway Firth UK5a Dungeness A DMLRW English Channel UK5b Dungeness B NPS English Channel UK6 Hartlepool NPS North Sea UK7a Heysham 1 NPS Morecambe Bay UK7b Heysham 2 NPS Morecambe Bay UK8a Hinkley Point A DMLRW Severn Estuary UK8b Hinkley Point B NPS Severn Estuary UK9a Hunterston A DMLRW Firth of Clyde UK9b Hunterston B NPS Firth of Clyde UK10 Oldbury NPS Severn Estuary UK11a Sizewell A DMLRW North Sea UK11b Sizewell B NPS North Sea UK12 Torness NPS North Sea UK13 Trawsfynydd DMLRW Trawsfynydd lake UK14 Wylfa NPS Irish Sea UK15 Sellafield NFRP Irish Sea UK16 Capenhurst NFFEP Irish Sea via Rivacre Brook and Mersey
Estuary UK17 Springfields NFFEP Irish Sea via River Ribble UK18 Dounreay DMLRW Pentland Firth UK19 Harwell DMLRW River Thames UK20 Winfrith DMLRW Weymouth Bay (English Channel) NPS: Nuclear Power Stations NFRP: Nuclear Fuel Reprocessing Plants
RDF: Research and Development Facilities NFFEP: Nuclear Fuel Fabrication and Enrichment Plants
DMLRW: Decommissioning and Management of Legacy Radioactive Wastes

Table 4 Nuclear Power Stations
Operational discharges of radioactive substances in 2010 (TBq)
Location Country Discharges Reactors Installed Net Specific radionuclides Ref. Site to Number
and Type
Capa-city MW (e) 2010
Electrical Output MW
(e).h 2010
Tritium
other (1) radio-
nuclidesTotal-activity
Total-activity
(excluding tritium) Co 58 Co 60 Zn 65 Sr 90 Zr/Nb 95 Ru 106 Ag 110m Sb 125 Cs 134 Cs 137 Ce 144 S 35
Belgium (2) BE1 Doel Schelde 4 PWR 431,6 3 357 911,0 5,18E+01 4,81E-04 0,00E+00 3,94E-03 7,33E-04 7,31E-04 1,20E-06 7,00E-07 1,44E-05 1,99E-05 3,66E-04 1,44E-03 2,40E-06 1,28E-04 6,00E-07 0,00E+00
433,0 3 376 387,0 2,50E-051006,0 7 796 867,01040,0 7 359 197,0
BE2 Tihange Meuse 3 PWR 962,0 7 296 667,0 5,50E+01 2,90E-04 1,09E-09 5,10E-03 6,07E-04 2,39E-03 0,00E+00 0,00E+00 2,22E-05 0,00E+00 1,23E-03 4,49E-05 1,57E-04 3,20E-04 0,00E+00 0,00E+001008,0 8 821 483,0 5,34E-051052,5 7 537 760,0
France (3) Total Parc : 4,09 E8 MWh (4)
FR1 Belleville Loire 2 PWR 2600 5,91E+1 3,09E-04 8,78E-05 7,04E-05 1,50E-05 4,50E-05 1,38E-05 2,18E-05FR2 Cattenom Mosel 4 PWR 5200 1,18E+2 8,93E-4 2,36E-4 2,81E-4 7,98E-7 5,81E-5 7,63E-5 3,23E-05 7,56E-5FR3 Chinon Loire 4 PWR 3600 4,53E+1 4,75E-4 5,89E-5 7,28E-5 2,01E-4 5,17E-5 1,49E-5 1,95E-5FR4 Chooz Meuse 2 PWR 2900 6,36E+1 5,34E-4 6,68E-5 2,58E-4 9,98E-7 3,21E-5 6,52E-5 1,27E-5 3,59E-5FR5 Civaux Vienne 2 PWR 2900 6,23E+1 1,23E-4 5,78E-6 2,19E-5 3,08E-5 1,51E-5 7,97E-6 1,01E-5FR6 Dampierre- Loire 4 PWR 3600 5,01E+1 6,11E-4 1,75E-4 9,40E-5 3,77E-7 7,55E-5 7,88E-5 1,62E-5 2,26E-5FR7 Fessenheim Rhine 2 PWR 1800 3,09E+1 4,73E-4 1,28E-4 6,69E-5 7,27E-7 1,91E-4 2,92E-5 5,17E-6 9,61E-6FR8 Flamanville North Sea 2 PWR 2600 4,94E+1 3,70E-4 1,11E-4 1,11E-4 1,80E-5 4,82E-5 1,28E-5 1,50E-5FR10 Golfech Garonne 2 PWR 2600 6,01E+1 1,70E-4 3,76E-5 5,63E-5 7,36E-6 2,14E-5 6,90E-6 8,87E-6FR11 Gravelines North Sea 6 PWR 5400 7,41E+1 1,98E-3 1,91E-4 9,87E-4 6,66E-7 3,50E-4 6,60E-5 4,52E-5 1,03E-4FR12 Le Blayais Gironde 4 PWR 3600 4,63E+1 5,38E-4 8,25E-5 1,95E-4 1,22E-4 3,28E-5 1,42E-5 2,19E-5FR14 Nogent- Seine 2 PWR 2600 7,15E+1 3,36E-4 1,02E-4 4,87E-5 1,81E-5 5,10E-5 1,99E-5 2,66E-5FR15 Paluel North Sea 4 PWR 5200 8,86E+1 9,52E-4 2,63E-4 2,49E-4 4,62E-5 1,06E-4 4,09E-5 5,16E-5FR16 Penly North Sea 2 PWR 2600 6,48E+1 1,55E-4 1,36E-5 6,15E-5 7,11E-6 1,57E-5 5,75E-6 1,68E-5FR18 Saint Laurent Loire 2 PWR 1800 2,03E+1 2,56E-4 5,38E-5 8,54E-5 3,57E-5 1,74E-5 7,12E-6 9,71E-6
Federal Republic of GermanyDE1a Biblis A Rhine 1 PWR 1225 5042097 4,9E+00 3,6E-05 6,8E-08 1,1E-05 1,5E-06 4,5E-06 3,7E-07 2,5E-06DE1b Biblis B Rhine 1 PWR 1300 10306260 1,5E+01 3,1E-05 1,3E-08 7,2E-07 4,6E-08 1,9E-05 5,0E-08 3,6E-07DE2 Brokdorf Elbe 1 PWR 1480 11945182 2,2E+01 2,1E-06 3,4E-07DE3 Brunsbüttel Elbe 1 BWR 806 0 7,4E-03 1,6E-05 7,5E-06 1,2E-06 4,2E-08 5,0E-06DE4 Grafenrheinfeld Main 1 PWR 1345 7938413 1,7E+01 4,9E-04 1,5E-05 2,7E-04 1,6E-05 6,8E-06DE5 Grohnde/Emme Weser 1 PWR 1430 11416876 2,2E+01 7,4E-06 6,3E-06DE8a Krümmel/Geest Elbe 1 BWR 1402 0 1,9E-02DE9a Lingen/EmslandEms 1 PWR 1400 11560347 2,5E+01DE11a Neckar-Westhe Neckar 1 PWR 840 2207634 4,4E+00DE11b Neckar-Westhe Neckar 1 PWR 1400 10874050 2,0E+01DE13a Philippsburg 1 Rhine 1 BWR 926 6790514 6,7E-01 1,4E-04 7,0E-06 3,7E-05 6,1E-05 6,0E-08 3,6E-07 7,0E-08 7,6E-06DE13b Philippsburg 2 Rhine 1 PWR 1468 11797122 1,4E+01 5,6E-05 3,0E-06 8,6E-06 7,8E-07 6,5E-07 7,3E-06 1,0E-05DE16 Rodenkirchen/UWeser 1 PWR 1410 11238640 2,0E+01 8,8E-05 3,2E-06 6,4E-05 4,1E-07 3,8E-07
The Netherlands (5)NL1 Borssele Westerscheld 1 PWR 520 3,76E+6 6,22E+0 7,48E-5 9,00E-8 1,75E-4 1,62E-6 6,18E-5 <MDA <MDA 9,98E-6 <MDA 1,30E-5 <MDA 1,34E-6 1,28E-5 <MDA NI
Annual Report on Liquid Discharges from Nuclear Installations, 2010

Operational discharges of radioactive substances in 2010 (TBq)
Location Country Discharges Reactors Installed Net Specific radionuclides Ref. Site to Number
and Type
Capa-city MW (e) 2010
Electrical Output MW
(e).h 2010
Tritium
other (1) radio-
nuclidesTotal-activity
Total-activity
(excluding tritium) Co 58 Co 60 Zn 65 Sr 90 Zr/Nb 95 Ru 106 Ag 110m Sb 125 Cs 134 Cs 137 Ce 144 S 35
Spain (6) (7) (8)ES1 Almaraz Tagus 2 PWR 2 025 14 891 288 3,72E+1 3,12E-3 ND 4,28E-4 6,77E-4 2,42E-5 5,50E-5 4,79E-4 4,31E-5 1,02E-4 1,17E-4 1,16E-5 8,68E-5 5,34E-5 NDES2 José Tagus 1 PWRES3 Trillo Tagus 1 PWR 1 066 7 695 504 2,06E+1 7,70E-4 ND 1,15E-5 2,02E-4 ND ND 1,93E-5 ND 2,49E-5 8,62E-6 ND 2,98E-5 ND ND
Sweden (9c) (9a) (9b)SE2 Ringhals 1-4 Kattegatt (10 BWR 854 3,80E-1 1,02E-3 1,07E-6 2,98E-3 5,40E-4 1,00E-3 1,30E-5 5,20E-5 2,00E-5 4,50E-5 2,90E-4
(11) PWR 866 7,20E+0 2,62E-5 3,22E-6 1,09E-4 5,90E-6 3,20E-5 9,50E-6 5,60E-7 2,30E-5 7,00E-6 7,60E-6(12) PWR 1048 1,70E+1 3,16E-4 9,51E-7 5,40E-4 3,70E-5 4,90E-5 1,00E-7 1,25E-5 5,50E-5 7,00E-5 1,40E-6(13) PWR 934 1,60E+1 3,59E-5 6,09E-7 6,85E-4 6,00E-4 2,90E-5 1,75E-5 6,80E-7 1,80E-6 4,70E-7
SwitzerlandCH1 Beznau Aare 2 PWR 380/380 5 531 000 8,50E+0 5,50E-8 3,50E-4 8,00E-5 4,80E-5 4,40E-7 3,40E-8 4,10E-7 9,00E-6 1,70E-6 1,00E-4CH2 Gösgen Aare 1 PWR 1035 7 974 000 1,40E+1 <2,20E-7 1,60E-5 4,90E-7CH3 Leibstadt Rhine 1 BWR 1220 8 775 000 4,10E+0 6,10E-7 2,20E-4 1,00E-5 1,40E-4 3,10E-5 1,00E-6CH4 Mühleberg Aare 1 BWR 390 2 995 000 2,40E-1 1,40E-7 5,90E-3 1,00E-3 2,50E-3 1,10E-4 1,00E-6 9,80E-7 3,10E-5
United KingdomUK5b Dungeness B English 2 AGR 1,08E+2 2,91E-3 1,19E-3 1,84E-3 1,35E-01UK6 Hartlepool North Sea 2 AGR 3,54E+2 2,94E-3 1,70E-4 1,80E-3 1,03E+00UK7a Heysham 1 Morecambe 2 AGR 2,31E+2 2,85E-3 1,29E-4 2,22E-3 2,81E-01UK7b Heysham 2 Morecambe 2 AGR 2,31E+2 8,48E-3 4,70E-5 1,09E-3 3,26E-02UK8b Hinkley Point B Severn 2 AGR 1,47E+2 4,44E-3 2,28E-4 2,98E-3 2,26E-01UK9b Hunterston B Firth of Clyde 2 AGR 1,91E+2 2,72E-5 1,09E+0UK10 Oldbury Severn 2 GCR 2,13E-1 1,46E-1 1,77E-1UK11b Sizewell B North Sea 1 PWR 2,49E+1 2,00E-2 6,00E-3UK12 Torness North Sea 2 AGR 2,70E+2 1,17E-5 1,58E-2UK14 Wylfa Irish Sea 2 GCR 5,56E+0 1,02E-2
Annual Report on Liquid Discharges from Nuclear Installations, 2010

Table 5 Nuclear Fuel Reprocessing Plants
Location ref La Hague (FR13) Sellafield (UK15)
Discharges to English Channel Irish Sea
Type of Fuel Reprocessed PWR + BWR Magnox, AGR, LWR
Capacity (t/y)
TBq released Normed releases TBq released
Radionuclide per annum in TBq per GWye in 2010 (2) (3)
(1) (38.6 GWye in 2010)
Tritium 9,95E+3 1,39E+3
Total- 2,20E-2 5,70E-4 1,34E-1
Total- 3,35E+0 8,68E-2 1,14E+1
C 14 7,34E+0 4,37E+0
S 35
Mn 54 2,03E-3
Fe 55
Co 57 8,24E-5
Co 58 1,04E-4
Co 60 6,07E-2 9,81E-2
Ni 63 3,53E-2
Zn 65 ND
Sr 89 ND
Sr 90 1,01E-1 1,02E+0
(Sr 90 + Cs 137)
(Zr + Nb 95) ND 2,37E-1
Tc 99 5,16E-2 1,41E+0
Ru 103 ND
Ru 106 1,03E+0 1,16E+0
(Ru + Rh) 106 2,06E+0
Ag 110m ND
Sb 124 ND
Sb 125 1,22E-1
I 129 1,37E+0 2,74E-1
Cs 134 7,54E-2 1,10E-1
Cs 137 9,82E-1 4,85E+0
Ce 144 1,14E-4 5,70E-1
(Ce + Pr) 144 9,73E-4
Pm 147
Eu 152
Eu 154 1,20E-3
Eu 155 2,15E-4
Np 237 7,97E-5 4,08E-2
Pu 239+240 1,92E-3 1,34E-1
Pu 241 1,64E-1 3,16E+0
Am 241 3,24E-3 2,33E-2
Cm 242 1,85E-5
Cm 243+244 1,89E-3 2,92E-3
Uranium (in kg) 2,83E+1 2,52E+2
ND: not detectable
Annual Report on Liquid Discharges from Nuclear Installations, 2010

Table 6 Nuclear Fuel Fabrication and Enrichment Plants
Location Country/ Discharges Type of Fuel Capacity Production Activity TBqRef. site to (t/y) released
in 2010
Federal Republic of Germany
DE19 Gronau Vechte, IJsselmeer Uranium enrichment total - 4,1E-09
Netherlands
NL3 Urenco, Almelo Municipal sewer system Uranium enrichment NI 4550 total - 7,00E-07
total - (- & - emitting rn) 2,00E-06
Spain
ES4 Juzbado (6) River Tormes - Duero PWR, BWR 400 364,8 total - 2,04E-5
United Kingdom
UK16 Capenhurst Irish Sea via Uranium enrichment Uranium - 6,32E-6
Rivacre Brook and Uranium daughters 6,40E-6
Mersey Estuary other - 1,51E-5
Tc 99 1,50E-6
Tritium
UK17 Springfields Irish Sea via GCR, AGR, PWR total - 2,10E-2
River Ribble fuel fabrication total - 4,45E+0
Tc 99 1,85E-2
Th 230 3,80E-3
Th 232 1,80E-4
Uranium - 1,47E-2
Np 237 3,70E-4
Annual Report on Liquid Discharges from Nuclear Installations, 2010

Table 7 Research and Development Facilities
Location Country/ Discharges Reactors Installed Radionuclides TBq releasedRef. site to Number & Capacity per annum
Type in 2010
Belgium (1)
BE3 Mol River Mol-Neet 2 129 MWth Total- 1,58E-05
Total- 1,97E-04
H 3 2,22E+00
Sr 90/Y 90 2,45E-05
Co 60 8,00E-06
Cs 134 0,00E+00
Cs 137 1,09E-04
Total activitiy 2,22E+00
France
FR17 Saclay Etang Centre de recherches du <4,40E-05
de Saclay Commissariat à l'énergie other radionuclides 6,60E-05
atomique Tritium 1,47E-02
Germany
DE8b Geesthacht Elbe 1 Tritium 1,8E-04
emitting radionuclides 7,8E-06
DE18 Karlsruhe Rhine No reactors Tritium 8,6E-02
emitting radionuclides 5,9E-04
DE22 HZ Berlin Havel 1 Tritium 4,3E-04
emitting radionuclides 4,5E-08
DE23 Jülich Rur 1 Tritium 5,6E-01
emitting radionuclides 1,9E-04
Netherlands
NL4 Delft (2) (3) (4) Sewage system 1 Research 2 MWth emitting radionuclides 3,0E-07 reactor
emitting radionuclides including tritium 1,1E-05
emitting radionuclides 5,5E-06
total NI
NL5 Petten (5) (6) (7) North Sea 1 high flux 50 MWth Tritium 2,60E-01
Research reactor emitting radionuclides 9,14E-07
1 low flux 30 kWth emitting radionuclides 1,69E-02
Research reactor total NI
Annual Report on Liquid Discharges from nuclear installations in 2010
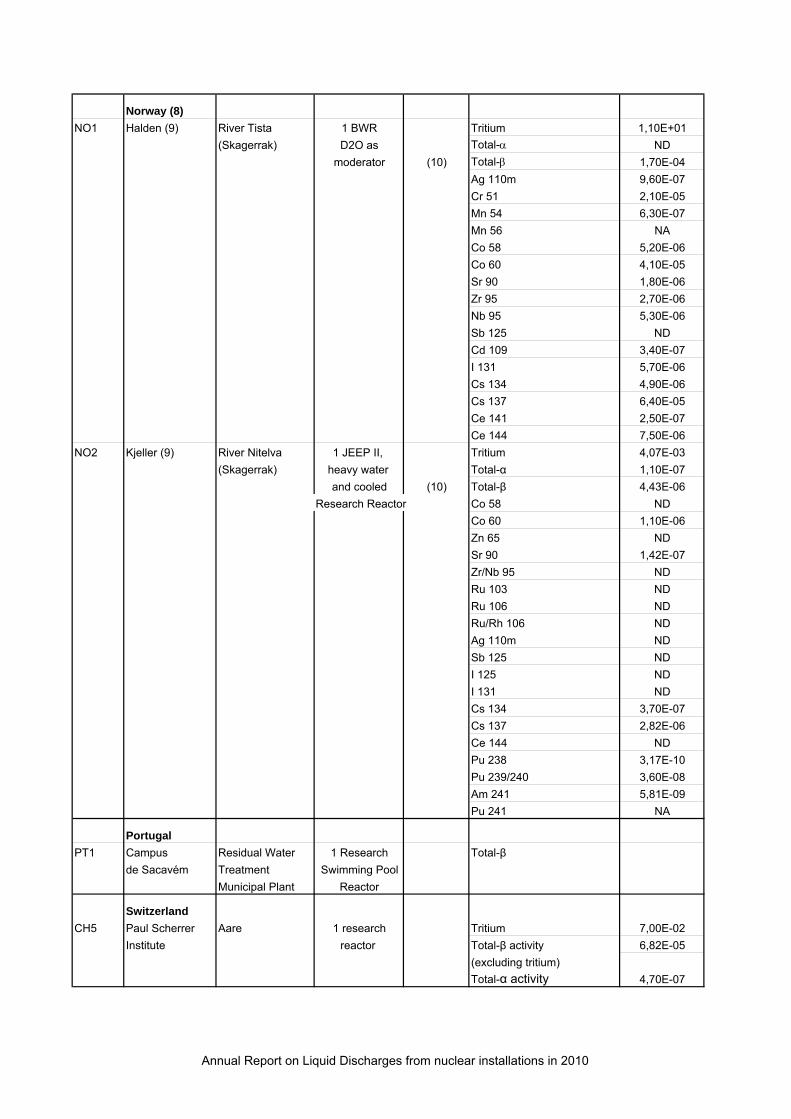
Norway (8)
NO1 Halden (9) River Tista 1 BWR Tritium 1,10E+01
(Skagerrak) D2O as Total- ND
moderator (10) Total- 1,70E-04
Ag 110m 9,60E-07
Cr 51 2,10E-05
Mn 54 6,30E-07
Mn 56 NA
Co 58 5,20E-06
Co 60 4,10E-05
Sr 90 1,80E-06
Zr 95 2,70E-06
Nb 95 5,30E-06
Sb 125 ND
Cd 109 3,40E-07
I 131 5,70E-06
Cs 134 4,90E-06
Cs 137 6,40E-05
Ce 141 2,50E-07
Ce 144 7,50E-06
NO2 Kjeller (9) River Nitelva 1 JEEP II, Tritium 4,07E-03
(Skagerrak) heavy water Total-α 1,10E-07
and cooled (10) Total-β 4,43E-06
Research Reactor Co 58 ND
Co 60 1,10E-06
Zn 65 ND
Sr 90 1,42E-07
Zr/Nb 95 ND
Ru 103 ND
Ru 106 ND
Ru/Rh 106 ND
Ag 110m ND
Sb 125 ND
I 125 ND
I 131 ND
Cs 134 3,70E-07
Cs 137 2,82E-06
Ce 144 ND
Pu 238 3,17E-10
Pu 239/240 3,60E-08
Am 241 5,81E-09
Pu 241 NA
Portugal
PT1 Campus Residual Water 1 Research Total-β
de Sacavém Treatment Swimming Pool
Municipal Plant Reactor
Switzerland
CH5 Paul Scherrer Aare 1 research Tritium 7,00E-02
Institute reactor Total-β activity 6,82E-05
(excluding tritium)
Total-α activity 4,70E-07
Annual Report on Liquid Discharges from nuclear installations in 2010

Table 8 Discharges from decommissioning and treatment/recovery of old radioactive waste in 2010
Exceptional discharges of radioactive substances in 2010 (TBq)
Location Country Discharges Reactors Specific radionuclides Ref. Site to Number
and Type
Tritium
other (1) radio-
nuclides Total-activity
Total-activity
(excluding tritium) Co 58 Co 60 Zn 65 Sr 90 Na22 Ru 106 Ag 110m Sb 125 Cs 134 Cs 137 Ce 144 S 35 Pu 241
Denmark (2) (3)
DK1 Risø Kattegat through No reactors 5,40E-02 8,25E-05
Roskilde Fjord
France Type of fuel reprocessed
FR4 Chooz (4) Meuse 1 PWR 7,3E-04 1,9E-04 2,8E-06 2,6E-06 1,8E-04
FR9 Fontenay-aux-Roses Seine No reactor 5,0E-06 1,0E-06 6,0E-06
FR13 La Hague English Channel PWR + BWR 3,7E-03 5,9E-01 3,9E-03 3,3E-02 1,1E+00 9,8E-02
Federal Republic of Germany
D9b Lingen Ems 1 BWR 4,7E-07 1,7E-06 1,3E-09 1,2E-08 1,7E-06
D10 Mülheim-Kärlich Rhine 1 PWR 4,8E-05 9,8E-06 3,6E-06
D12 Obrigheim Neckar 1 PWR 1,5E-01 2,0E-03 1,8E-07 2,6E-04 2,0E-06 3,4E-07 1,9E-04 9,3E-06
D14 Rheinsberg Havel 1 PWR 1,4E-03 9,2E-06 1,6E-07 3,6E-07 4,1E-07 8,7E-07
D15 Stade Elbe 1 PWR 7,8E-03 2,0E-05 2,7E-08 2,0E-06 1,5E-06
D17 Würgassen/Beverungen Weser 1 BWR 5,1E-04 2,9E-06 8,7E-07 1,7E-06
Spain (5)
ES2 José Cabrera Tagus 1 PWR 4,7E-02 1,3E-05 8,8E-06
SwitzerlandCH6 ZWILAG (6) Aare 2,2E-01 3,7E-09 1,1E-03 1,3E-05 1,5E-06 1,5E-05 1,1E-05 1,2E-05 2,7E-05 1,0E-03
United KingdomUK1 Berkeley Severn 2 GCR 4,1E-03 3,9E-04 2,4E-04
UK2 Bradwell North Sea 2 GCR 9,2E-03 1,1E-02 1,6E-02
UK3 Calder Hall (7) Irish Sea 4 GCR REPORTED WITH SELLAFIELD DISCHARGES
UK4 Chapelcross (8) Solway Firth 4 GCR 7,4E-03 1,0E-04 9,4E-03
UK5a Dungeness A English 2 GCR 6,6E-02 5,9E-03 1,2E-02
UK8a Hinkley Point A Severn 2 GCR 7,6E-02 2,3E-01 4,7E-02
UK9a Hunterston A (9) Firth of Clyde 2 CGR 2,9E-04 4,4E-04 1,3E-02 2,6E-04
UK11a Sizewell A North Sea 2 GCR 5,5E-02 6,9E-02 1,4E-01
UK13 Trawsfynydd (10) Trawsfynydd 2 GCR 1,4E-03 6,3E-04 3,2E-04
UK18 Dounreay (11) Pentland Firth No reactors 9,1E-02 2,0E-04 3,8E-02
UK19 Harwell River Thames No reactors 4,4E-03 7,7E-06 1,5E-04 1,2E-06 5,0E-05
UK20 Winfrith Weymouth Bay No reactors 2,3E+00 4,3E-03 5,8E-05 3,3E-03
Annual Report on Liquid Discharges from Nuclear Installations, 2010

OSPAR Commission, 2012
27
3.3 Endnotes to data tables 4 to 8
Table 4
(1) The value indicated corresponds to the sum of individually assessed nuclides.
(2) For Belgium, the nuclides included are:
ß-Activity for Tihange: Sr-89, Sr-90, ß-Activity for Doel: Sr-89, Sr-90, Other radionuclides for Tihange: Na-24, Cr-51, Mn54, Co-57, Co-58, Co-60, Fe-59, Zn-65, Zr-95, Nb-95, Mo-99, Tc99m, Ru-103, Ru-106, Ag-110m, Sb-122, Te-123m, Sb-124, Sb-125, I-131, Cs-134, Cs-136, Cs-137, Ba-140, La-140, Ce-141, Ce-144, Other radionuclides for Doel: Cr-51, Mn-54, Co-57, Co-58, Co-60, Fe-59, Zn-65, Zr-95, Nb-95, Ru-103, Ru-106, Ag-110m, Te-123m, Sb-124, Sb-125, I-131, Cs-134, Cs-137, Ba-140, La-140, Ce-141, Ce-144.
(3) France explains that there is no simple relationship between the production of electricity and discharges of radioactive effluent other than tritium. This is because the amounts of effluent discharged depend on many factors: the condition of fuel cladding (first barrier), the processing carried out in the various existing plants, the operational mode of the reactor (load-following or providing basic power) and, above all, the volume of work carried out during shutdowns for refuelling.
Moreover, electricity is produced according to a programme fixed station by station at national level, and deliberate shutdowns, either during stand-by periods or for work to be carried out, are fixed by national criteria: the end of a natural cycle, arrangements for maintenance depending on the availability of teams of workers, constraints of the national grid and the demand for electricity.
It is easy to understand that a unit can operate over a calendar year and can produce a lot of power if it has been refuelled at the end of the previous year and if it is made to extend its cycle. In this case, the production of effluent will be minimised (no work is carried out). On the other hand, a unit shutdown for a long time (decennial shut-down, typically) will show an increase in the production of effluent and a decrease in the power supplied. During the next year, these two scenarios may be reversed. There is therefore good reason not to attempt a comparison of one site with another over short periods (= 10 years) as regards the quantity of radioactive effluent (other than tritium) discharged for a given amount of electrical energy produced.
In order to eliminate the variability associated with specific operating conditions of each reactor, it is more appropriate for a given year to consider the total amount of electricity generated by the French facilities in the OSPAR area. In 2010, their net electrical output was 409 millions of MWh.
(4) Data from the producers EDF.
(5) "Total-β" values represent an assimilation of β-emitting and γ-emitting radionuclides.
(6) Regarding the nuclear power plants, the discharge data have been estimated taking into account the 2004/2/Euratom recommendation criteria.
(7) José Cabrera nuclear power plant is under decommissioning since 1 February 2010. As radioactive liquid effluents were only discharged in June, their data are reported in Table 8.
(8) Other radionuclides for Almaraz: Cr-51, Mn-54, Fe-55, Fe-59, Co-58, Co-60, Ni-63, Zn-65, Sr-89, Sr-90, Nb-95, Zr-95, Ru-103, Ru-106, Ag-110m, Sb-122, Sb-124, Sb-125, Te-123m, I-131, Cs-134, Cs-137, Ba-140, Ce-141, Ce-144. Other radionuclides for Trillo: Cr-51, Mn-54, Fe-55, Co-58, Co-60, Ni-63, Nb-95, Zr-95, Ag-110m, Te-123m, Sb-122, Sb-124, Sb-125, I-131, Cs-137. In both cases activities for Fe-55 and Ni-63 have been estimated from Co-60 using factors that have been obtained as a result of the 2010 compound samples analyses.
(9a) The value reported corresponds to the sum of individually assessed alpha emitting radionuclides.

Liquid Discharges from nuclear installations in 2010
28
(9b) The value reported corresponds to the sum of individually assessed beta emitting radionuclides, excluding H-3 but including the other beta emitting nuclides in the table.
(9c) The value reported corresponds to the sum of the detected radionuclides not mentioned in the table.
(10) For Ringhals unit 1 the following radionuclides were detected: Cr-51, Mn-54, Co-57, Co-58, Co-60, Zr-95, Nb-95, Ag-110m, Sb-124, Sb-125, Sr-90, Cs-137, H-3, Pu-238, Pu-239/240, Am-241, Cm-242, Cm-244.
(11) For Ringhals unit 2 the following radionuclides were detected: Cr-51, Mn-54, Fe-59, Co-58, Co-60, Nb-95, Ag-108m, Ag-110m, Sb-124, Sb-125, Sr-90, Cs-137, La-140, H-3, Pu-238, Pu-239/240, Am-241, Cm-242, Cm-244.
(12) For Ringhals unit 3 the following radionuclides were detected: Na-22, Cr-51, Mn-54, Co-58, Co-60, Zn-65, Zr-95, Nb-95, Ag-110m, Sb-122, Sb-124, Sb-125, Cs-137, H-3, Pu-238, Pu-239/240, Am-241, Cm-244.
(13) For Ringhals unit 4 the following radionuclides were detected: Cr-51, Mn-54, Fe-59, Co-57, Co-58, Co-60, Zr-95, Nb-95, Ag-110m, Sn-113, Sb-124, Sb-125, Cs-137, H-3, Pu-238, Pu-239/240, Am-241, Cm-242, Cm-244.
Table 5
(1) Discharges of the Centre de Stockage de la Manche (low and intermediate level waste disposal site) are included in the La Hague discharges.
(2) The values of the liquid discharge limits for tritium and iodine-129 vary depending on the annual mass throughput of uranium in THORP (Thermal Oxide Reprocessing Plant), at Sellafield which was 613 tonnes in 2002.
(3) Discharges from Calder Hall Nuclear Power Station are included in the discharges from Sellafield.
Table 7
(1) The installed capacity is the maximum value. The reactors function in a discontinuous way, often at a fraction of their maximum.
(2) Delft site refers to Research reactor of Technical University Delft and different laboratories.
(3) The data represent the total emissions/discharges from the Reactor Institute Delft (RID) complex, including the Research Reactor (HOR) and different laboratories (it is not possible to make a distinction between the various sources). The discharges from the RID-HOR are substantially lower than the total values reported.
(4) "Total-β" value represents all β-emitting nuclides, including tritium.
(5) The data represent the total emissions/discharges from the Petten complex. This will lead to a substantial overestimate of the discharges of the two reactors (it is not possible to distinguish the discharges from each separate reactor). In all cases concentrations of α-emitters were lower than the detection limit, which is used for load calculations.
(6) Petten site refers to Research reactor of EU-JRC, the low-flux research reactor, Hot Cell Laboratories, Mo Production Facilities and Decontamination and Waste Treatment of NRG.
(7) "Total-β" value represents an assimilation of β-emitting and γ-emitting radionuclides.
(8) Some radionuclides reported to be discharged in small amounts by IFE are not included as specific nuclides in the spreadsheet.
From IFE Kjeller, these radionuclides are: U-234, U-235, U-238 and Cm-244
OSPAR Commission, 2012
29
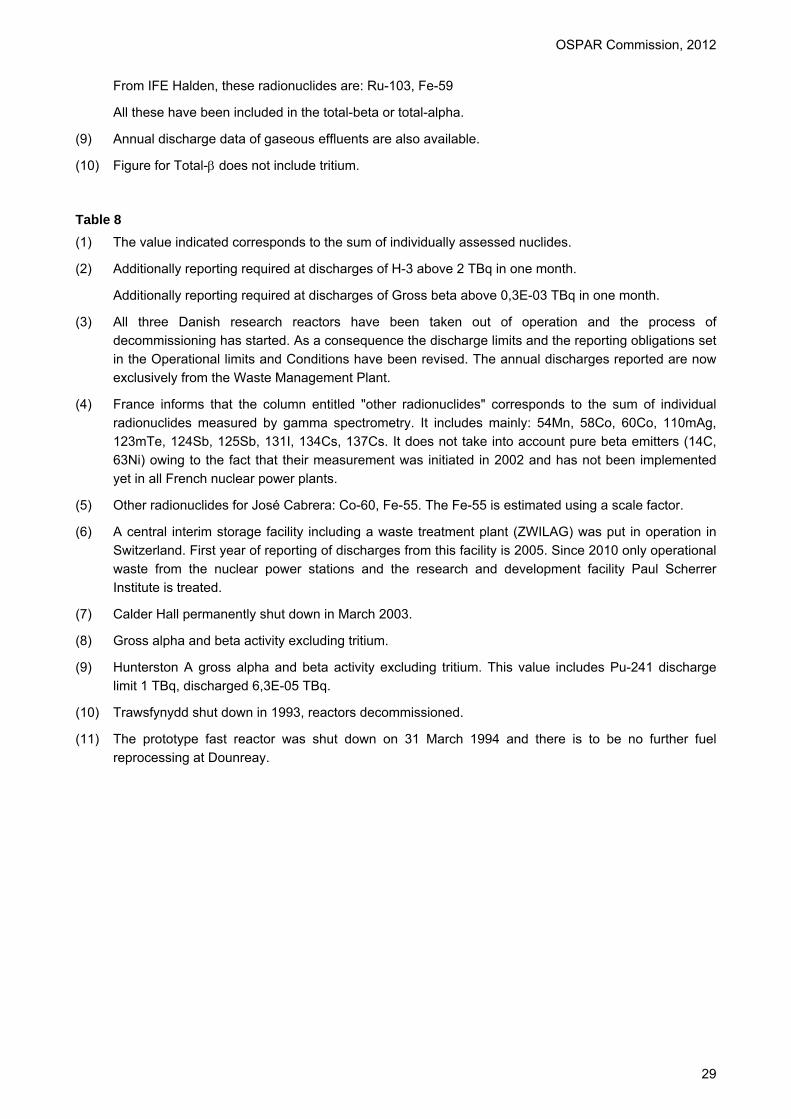
From IFE Halden, these radionuclides are: Ru-103, Fe-59
All these have been included in the total-beta or total-alpha.
(9) Annual discharge data of gaseous effluents are also available.
(10) Figure for Total- does not include tritium.
Table 8
(1) The value indicated corresponds to the sum of individually assessed nuclides.
(2) Additionally reporting required at discharges of H-3 above 2 TBq in one month.
Additionally reporting required at discharges of Gross beta above 0,3E-03 TBq in one month.
(3) All three Danish research reactors have been taken out of operation and the process of decommissioning has started. As a consequence the discharge limits and the reporting obligations set in the Operational limits and Conditions have been revised. The annual discharges reported are now exclusively from the Waste Management Plant.
(4) France informs that the column entitled "other radionuclides" corresponds to the sum of individual radionuclides measured by gamma spectrometry. It includes mainly: 54Mn, 58Co, 60Co, 110mAg, 123mTe, 124Sb, 125Sb, 131I, 134Cs, 137Cs. It does not take into account pure beta emitters (14C, 63Ni) owing to the fact that their measurement was initiated in 2002 and has not been implemented yet in all French nuclear power plants.
(5) Other radionuclides for José Cabrera: Co-60, Fe-55. The Fe-55 is estimated using a scale factor.
(6) A central interim storage facility including a waste treatment plant (ZWILAG) was put in operation in Switzerland. First year of reporting of discharges from this facility is 2005. Since 2010 only operational waste from the nuclear power stations and the research and development facility Paul Scherrer Institute is treated.
(7) Calder Hall permanently shut down in March 2003.
(8) Gross alpha and beta activity excluding tritium.
(9) Hunterston A gross alpha and beta activity excluding tritium. This value includes Pu-241 discharge limit 1 TBq, discharged 6,3E-05 TBq.
(10) Trawsfynydd shut down in 1993, reactors decommissioned.
(11) The prototype fast reactor was shut down on 31 March 1994 and there is to be no further fuel reprocessing at Dounreay.

Liquid Discharges from nuclear installations in 2010
30
References
EC, 2003. Update of the MARINA Project on the radiological exposure of the European Community from radioactivity in North European marine waters. European Commission 2003.
OSPAR, 2006. Revised First Periodic Evaluation of Progress towards the Objective of the OSPAR Radioactive Substances Strategy (JAMP product RA-1). Publication 302/2006. ISBN 1-905859-40-6. http://www.ospar.org/documents/dbase/publications/p00302_Revised First Periodic Evaluation.pdf
OSPAR, 2009. Towards the Radioactive Substances Strategy objectives - Third Periodic Evaluation. Publication 455/2009.ISBN 978-1-906840-95-2. http://www.ospar.org/documents/dbase/publications/p00455_3PE.pdf
Victoria House37-63 Southampton RowLondon WC1B 4DAUnited Kingdom
t: +44 (0)20 7430 5200f: +44 (0)20 7242 3737e: [email protected]
© OSPAR Commission, 2012. Permission may be granted by the publishers for the report to be wholly or partly reproduced in publications provided that the source of the extract is clearly indicated.
© Commission OSPAR, 2012. La reproduction de tout ou partie de ce rapport dans une publication peut être autorisée par l’Editeur, sous réserve que l’origine de l’extrait soit clairement mentionnée.
ISBN No.: 978-1-909159-03-7Publication Number: 569/2012
OSPAR’s vision is of a clean, healthy and biologically diverse North-East Atlantic used sustainably


