146 Liquid-Liquid Extraction (LLX) Extraction is a liquid-liquid operation. It is a process of transferring a solute from one liquid phase to another immiscible or partially miscible liquid in contact with the first. The two phases are chemically quite different, which leads to a separation of the components according to their distribution or partition between the two phases, normally one organic and one water . This is different from distillation, in which the liquid is partially vaporized to create another (vapor) phase, but the two phases are similar chemically. 147 Equilibrium Relations in Extraction 1. Phase rule. In a liquid-liquid system, the minimum number of components is three and we have two phases in equilibrium. For a ternary system, the number of degrees of freedom is three, as calculated by the phase rule (F = C - P + 2 = 3 - 2 + 2 = 3). We have six variables: temperature, pressure, and four concentrations. If the pressure and temperature are specified, then setting one concentration will fix the system. The other three concentrations must be calculated from the phase equilibrium. 2. Triangular coordinates and equilibrium data. Since we have three components, the equilibrium data are often expressed in equilateral triangular coordinates. This is shown in the following figure. Figure 1. Coordinates for a triangular diagram.
Transcript
146
Liquid-Liquid Extraction (LLX) Extraction is a liquid-liquid operation. It is a process of transferring a solute from one liquid phase to another immiscible or partially miscible liquid in contact with the first. The two phases are chemically quite different, which leads to a separation of the components according to their distribution or partition between the two phases, normally one organic and one water. This is different from distillation, in which the liquid is partially vaporized to create another (vapor) phase, but the two phases are similar chemically.
147
Equilibrium Relations in Extraction 1. Phase rule. In a liquid-liquid system, the minimum number of components is three and we have two phases in equilibrium. For a ternary system, the number of degrees of freedom is three, as calculated by the phase rule (F = C - P + 2 = 3 - 2 + 2 = 3). We have six variables: temperature, pressure, and four concentrations. If the pressure and temperature are specified, then setting one concentration will fix the system. The other three concentrations must be calculated from the phase equilibrium. 2. Triangular coordinates and equilibrium data. Since we have three components, the equilibrium data are often expressed in equilateral triangular coordinates. This is shown in the following figure.
Figure 1. Coordinates for a triangular diagram.
148
The three corners represent three pure components, A, B and C. The point M is a mixture. The perpendicular distance from the point M to any base line is the mass fraction of the component at the corner opposite to that base line. For example, the distance from M to base AB is the mass fraction of C (xC = 0.40).
A comFig 2misciThe twenvelseparequilialso pwhichone p
Figur The curveexperand Swe cmixtupoint mixtuequiliand Q
mmon p, whereble, anwo phalope. Aate intoibrium plottedh is calphase re
re 2. Li co
equilie isrimentsS are can chure liqu
D inure is sibrium
Q.
phase de a pai
nd liquase regiAn orio two ctie line
d. Thelled theegion.
iquid-liompone
ibrium obtaine
s. If compartiall
hoose uid of Bn Fig. separat
liquid
diagramir of coid C dion is iiginal mconjugae throu
e two pe Plait
iquid pents A a
solued thrmponenly misany b
B and S3.
ed intod phase
149
m is Typomponedissolveincludemixtureate phaugh poiphases point.
phase diand B a
ubility rough nts B cible,
binary S, say
This o two es, P Fig.3
ype I syents A es comd inside of coases a aint M.
are id Outsi
iagramare par
. Exper
ystem aand B
mpletelyde belowomposiand b w
Other denticalide the
m wherertially m
rimenta
and shoare par
y in A w the cition Mwhich a
tie linel at po
envelo
e miscible
al solub
wn in rtially or B.
curved M will are on es are int P, ope is
e.
bility.
150
Under constant temperature, if we add component A into this binary mixture drop by drop, the composition of the ternary mixture will change along line DA. The ratio of B/S is constant while the amount of A is changing. When the amount of A is just to make the mixture from two phases to one single homogeneous phase, the composition is represented by the point D’. By repeating this procedure for other binary mixtures with compositions of E, F, G, we obtain the points E’, F’, G’. The curve links the points PD’E’F’G’Q is the equilibrium solubility curve. If B and S are completely immiscible, the two end points P and Q on the solubility curve will superimpose to the top points B and S, respectively. Conjugate line. As far as some equilibrium tie lines are available, other tie lines can be obtained by interpolation with the help of conjugate curve. Assuming the tie lines E1R1, E2R2, E3R3, E4R4 are known, we draw a vertical line from E1, which intersects the horizontal line from R1 at point F. Similary, the vertical lines from E2, E3, E4, intersects the horizontal lines from R2, R3, R4 at points G, H and J. The curve joining FGHJ and the plait point P is called the conjugate line.
151
Example E1: Ternary acetic acid-benzene-water mixture. The liquid-liquid equilibrium data at 25oC is given in the following table. In the right-angled triangle, illustrate
(1) Solubility curve (2) Tie lines for experiments of Nos. 2, 3, 4, 6, 8 (3) Plait point and conjugate line
1 0.15 99.85 0.001 4.56 0.04 95.4 2 1.4 98.56 0.04 17.7 0.20 82.1 3 3.27 96.62 0.11 29.0 0.40 70.6 4 13.3 86.3 0.4 56.9 3.3 39.8 5 15.0 84.5 0.5 59.2 4.0 36.8 6 19.9 79.4 0.7 63.9 6.5 29.6 7 22.8 76.35 0.85 64.8 7.7 27.5 8 31.0 67.1 1.9 65.8 18.1 16.1 9 35.3 62.2 2.5 64.5 21.1 14.4 10 37.8 59.2 3.0 63.4 23.4 13.2 11 44.7 50.7 4.6 59.3 30.0 10.7 12 52.3 40.5 7.2 52.3 40.5 7.2 (1)The data points are plotted in the right-angled triangle coordinates, joining the points gives the solubility curve. (2) The experiments of Nos. 2, 3, 4, 6, 8 are shown as points R1, E1, R2, E2, R3, E3, R4, E4, R5, E5. The tie lines are the straight lines R1E1, R2E2, R3E3, R4E4, R5E5.
152
(3) The last set of data have the same composition in the two phases, which is the plait point. The auxiliary curve is obtained by drawing vertical lines from E1, E2, E3, E4, E5, which intersect the horizontal lines from R1, R2, R3, R4, R5 at points G, H, I, J, L. Joining GHIJLP gives the conjugate line.
153
Example E2: For the ternary system of example E1 at 25oC, a mixture is separated into two liquid phases after settling. One phase contains 15% acetic acid, 0.5% water and the rest being benzene (all mass %). Use the conjugate line in example E1 to determine the composition of the other conjugate liquid phase and draw the tie line. Solution: The solubility and conjugate curves are given.
1. Find the composition of 15% acetic acid, 0.5% water as point R.
2. Draw a horizontal line from R to intersect the conjugate line at Q.
3. Draw a vertical line from Q to intersect the solubility curve at E, which is the composition of the other conjugate phase, 59% acetic acid, 37% water, 4% benzene.
4. Join RE to obtain the tie line.
154
3. Equilibrium data on rectangular coordinates. Because of the special coordinates, the triangular diagram is not convenient. The liquid-liquid phase equilibrium is more often presented in rectangular coordinates, which is shown in Fig. 4 for acetic acid (A) - water (B) - isopropyl ether solvent (C).
Figure 4. Acetic acid (A)-Water (B)-Isopropyl ether (C) liquid-liquid phase diagram at 293 K (20oC). The solvent pair B and C are partially miscible. The concentration of A is plotted on the horizontal axis and that of C on the vertical axis. The concentration of B is calculated from the following equation
155
x x xB A C= − −1 0. y y yB A C= − −1 0. A tie line gi is shown connecting the water-rich layer i, called the raffinate layer, and the ether-rich solvent layer g, called the extract layer. The raffinate composition is designated by x, and the extract by y. Hence, the mass fraction of C is designated as yC in the extract laywer and as xC in the raffinate layer. To construct the tie line gi using the equilibrium yA-xA plot below the phase diagram, vertical lines to g and i are drawn. Example E3: Material balance for equilibrium layers An original mixture weighing 100 kg and containing 30 kg of isopropyl ether (C), 10 kg of acetic acid (A), and 60 kg water (B) is equilibrated and the equilibrium phases separated. What are the compositions of the two equilibrium phases. Solution: The composition of the original mixture is xC = 0.30, xA = 0.10, xB = 0.60 This composition is plotted as point h on Fig. 4. The tie line gi is obtained through point h by trial and error. The composition of the extract (ether) layer at g is yA = 0.04, yC = 0.94, and yB = 1 – 0.04 – 0.94 = 0.02 mass fraction. The raffinate (water) layer composition at i is xA = 0.12, xC = 0.02, and xB = 1 – 0.12 – 0.02 = 0.86 mass fraction.
156
In the above system (Fig. 4) the solvent pair B and C are partially miscible, while A is totally soluble in B or C. It is also common for some other systems that both pairs, A and C, and B and C are partially miscible. This is Type II system and shown in figure 5.
Figure 5. Liquid-liquid phase diagram where the solvent pairs A-C and B-C are partially miscible. Examples are the systems of Styrene (A) -Ethylbene (B) -Diethylene Glycol (C), and Chlorobenzene (A) -Methylethyl Ketone (B) -Water (C).
157
Single-Stage Equilibrium Extraction In an extraction process we have two entering streams (L kg and V kg) which are NOT in equilibrium, as shown in Fig. 6. The solvent, as stream V2, enters and the stream L0 enters from the other side. The two entering streams are mixed and equilibrated and then exit as streams L1 and V1, which are in equilibrium with each other. To find the final product compositions in the two phases, it is required to know the mixture total mass and composition (point M). This can be obtained by material balances. After the point M is identified, the product composition can be found by the equilibrium tie line.
158
Figure 6. Single-stage Liquid-liquid extraction: (a) process flow diagram, (b) phase diagram. Material balances: Overall: L V L V M0 2 1 1+ = + = (1) (A): L x V y L x V y MxA A A A AM0 0 2 2 1 1 1 1+ = + = (2) (C): L x V y L x V y MxC C C C CM0 0 2 2 1 1 1 1+ = + = (3) Since xA + xB + xC = 1 , an equation for B is not needed. because L0 and V2 are known, values of M, xAM, and xCM, can be found from Eqs. (1) to (3). L1 and V1 are obtained by drawing a tie line through point M.
159
Derivation of lever-arm rule for graphical addition. In Figure 7 we have two streams (L & V) mixed to give a resulting mixture stream M kg total mass. ((b)
(b)
Figure 7. Graphical addition and lever-arm rule: (a) process flow, (b) graphical addition. By doing material balances, we have Overall: V L M+ = (4) (A): Lx Vy MxA A AM+ == (5) (C): Lx Vy MxC C CM+ == (6) Combining Eqs. (4) & (5), and (4) & (6), we have
LV
x yx x
AM A
A AM=
−−
(7)
LV
x yx x
CM C
C CM=
−−
(8)
Equating Eqs. (7) & (8) and rearranging,
x xx x
x yx y
C CM
A AM
CM C
AM A
−−
=−−
(9)
The left side is the slope of line LM and the right side is the slope of line MV. Because the two slopes are the same and the two lines have a common point M, the three
160
points L, M, and V must be on a straight line. The lever-arm rule is
LV
VMLM
= & LM
VMLV
= (10)
Example E4: Amount of phases in solvent extraction The compositions of the two equilibrium layers in example E1 are: for the extract layer (V),
yA = 0.04, yB = 0.02, yC = 0.94 for the raffinate layer (L), xA = 0.12, xB = 0.86, xC = 0.02 The original mixture contained 100 kg and xAM = 0.10. Determine the amounts of V and L. Solution: The overall material balance is V + L = M = 100 kg The material balance of A is V(0.04) + L(0.12) = 100(0.10) Hence, V = 75 kg, L = 25 kg Alternatively, using the lever-arm rule, the distance hg in Fig. 4 is measured as 4.2 units and gi as 5.8 units. Then
LM
L100
hggı
4.25.8
Solving, L = 72.5 kg and V = 27.5 kg, which is in reasonable close agreement with the material balance method.
161
Countercurrent Multistage Extraction
162
1. Countercurrent process and overall balances A countercurrent multistage process is shown in Fig. 8.
Figure 8. Countercurrent multistage extraction process flow diagram The overall balance on all N stages is
L V L V MN N0 1 1+ = + =+ (11) where M is the total mass (kg/h) and is a constant, L0 the inlet feed flow rate (kg/h), VN+1 the inlet solvent flow rate (kg/h), V1 the exit extract stream, and LN the exit raffinate stream. Material balance on C gives L x V y L x V y MxC N C N N C N C CM0 0 1 1 1 1+ = + =+ +, , (12) xCM is obtained By solving Eqs. (11) & (12)
xL x V y
L VL x V y
L VCMC N C N
N
N CN C
N=
++
=++
+ +
+
0 0 1 1
0 1
1 1
1
, (13)
A similar balance on component A gives
xL x V y
L VL x V y
L VAMA N A N
N
N AN A
N=
++
=++
+ +
+
0 0 1 1
0 1
1 1
1
, (14)
So the point M, which ties together the two entering streams (usually known) and the two exit streams, can be located. The desired exit composition xAN is often set, which is on the equilibrium curve (phase boundary). Then the line LNM is extended to intersect the phase boundary of the extract phase to give V1 composition.
163
Example E5: Pure solvent isopropyl ether (C) at the rate of VN+1 = 600 kg/h is being used to extract an aqueous solution of L0 = 200 kg/h containing 30 wt % acetic acid (A) and 70 wt % water (B) by countercurrent multistage extraction. The desired exit acetic acid concentration in the aqueous phase is 4%. Calculate the compositions and amounts of the ether extract V1 and the aqueous raffinate LN. The equilibrium data at 20oC, 1 atm, are given and plotted below. Water phase (mass fraction)
xAN = 0.04. VN+1 and L0 are located by the compositions. Since LN is on the phase boundary of the raffinate phase, it can be plotted at xAN = 0.04 & we find xCN = 0.017.
165
The composition of the mixture, xCM and xAM, are calculated by Eqs. (13) & (14) as 0.75 & 0.075 and used to plot point M. V1 is located by drawing a line from LN through M & extending it until it intersects the phase boundary in the extract phase. This gives yA1 = 0.08 & yC1 = 0.90. By solving Eqs. (11) & (12), LN = 136 kg/h & V1 = 664 kg/h. 2.Stage-to-stage calculation for countercurrent extraction The next step is to go stage by stage to determine the concentrations at each stage and the total number of stages N needed to reach LN in the process.
Making a total balance on stage 1 and then on stage n, L V L V0 2 1 1+ = + (15) L V L Vn n n n− ++ = +1 1 (16) The above equations can be rearranged as L V L V L V L Vn n N N0 1 1 2 1 1− = − = = − = − =+ +... Δ (17) The value of Δ is constant for all stages. The coordinates of the operating point Δ can be obtained by material balances on A, B or C:
166
L x V y L x V y xA A N AN N A N A0 0 1 1 1 1− = = − =+ +... , Δ Δ (18) L x V y L x V y xC C N CN N C N C0 0 1 1 1 1− = = − =+ +... , Δ Δ (19)
x L x V yL V
L x V yL VA
A A N AN N A N
N NΔ =
−−
=−−
+ +
+
0 0 1 1
0 1
1 1
1
, (20)
Similar Eqs. for xBΔ & xCΔ can be obtained. This point Δ is located either by its coordinates as calculated by Eq. (20) or graphically as the intersection of lines L0V1 and LNVN+1. The method to locate V1 has been discussed in example E5. All the operating lines (L0V1, L1V2, LnVn+1, ... , LNVN+1) must pass through the common point Δ. To graphically determine the number of stages, follow the procedures below. (1) locate L0, VN+1 and LN by their compositions. (2) draw a line L0VN+1, and locate the mixture point M by Eq. (13) or (14). (3) draw a line from LN through M & extend it until it intersects the phase boundary, where is V1. (3) extend lines L0V1, and LNVN+1, which will intersect at the common operating point Δ. (4) start at L0 and draw a line L0Δ which intersects the phase boundary at V1. (5) draw an equilibrium tie line through V1 to locate L1. (6) draw a line L1Δ to give V2 at the phase boundary. (7) a tie line from V2 gives L2. This is continued until the desired LN is reached.
167
Alternately, the point Δ can firstly be located using Eq. (20). Then we start at L0 and draw a line L0Δ to locate V1. Then an equilibrium tie line through V1 locates L1. Line L1Δ is drawn to give V2. A tie line from V2 gives L2. This is continued until the desired LN is reached.
168
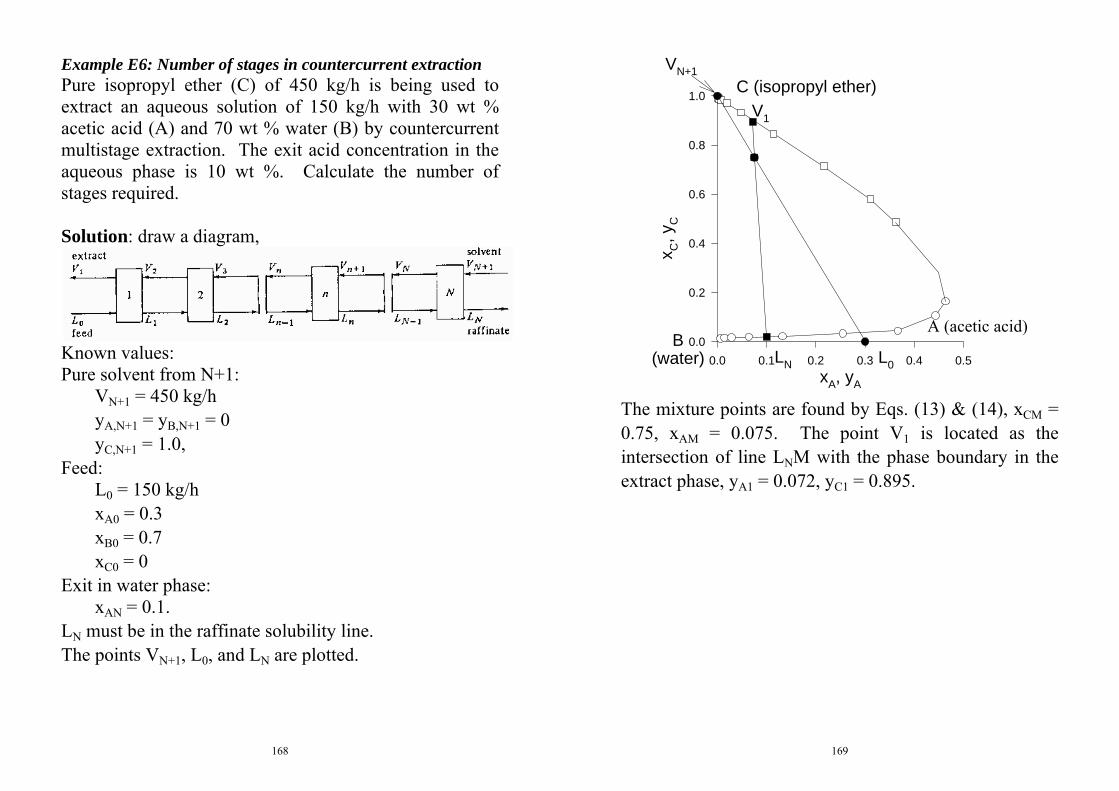
Example E6: Number of stages in countercurrent extraction Pure isopropyl ether (C) of 450 kg/h is being used to extract an aqueous solution of 150 kg/h with 30 wt % acetic acid (A) and 70 wt % water (B) by countercurrent multistage extraction. The exit acid concentration in the aqueous phase is 10 wt %. Calculate the number of stages required. Solution: draw a diagram,
Known values: Pure solvent from N+1:
VN+1 = 450 kg/h yA,N+1 = yB,N+1 = 0 yC,N+1 = 1.0,
Feed: L0 = 150 kg/h xA0 = 0.3 xB0 = 0.7 xC0 = 0
Exit in water phase: xAN = 0.1.
LN must be in the raffinate solubility line. The points VN+1, L0, and LN are plotted.
169
xA, yA
0.0 0.1 0.2 0.3 0.4 0.5
x C, y
C
0.0
0.2
0.4
0.6
0.8
1.0
A (acetic acid)B
(water)
C (isopropyl ether)
L0LN
V1
VN+1
The mixture points are found by Eqs. (13) & (14), xCM = 0.75, xAM = 0.075. The point V1 is located as the intersection of line LNM with the phase boundary in the extract phase, yA1 = 0.072, yC1 = 0.895.
170
Then lines L0V1, and LNVN+1 is drawn to locate the point Δ.
xA, yA
-0.1 0.0 0.1 0.2 0.3 0.4 0.5
x C, y
C
0.0
0.2
0.4
0.6
0.8
1.0
1.2
1.4
A (acetic acid)
B(water)
C (isopropyl ether)
L0
LN
V1
VN+1
Δ
171
Starting at L0 we draw a line L0Δ to locate V1. Then an equilibrium tie line through V1 locates L1. Line L1Δ is drawn to give V2. A tie line from V2 gives L2. A final tie line gives L3, which is beyond the desired LN. Hence, about 2.5 theoretical stages are needed.
172
3. McCabe-Thiele method Stepping off many stages on a triangular diagram can be difficult and inaccurate. More accurate calculations can be done with a McCabe-Thiele diagram. Here we focus on the concentration of solute in the extract and raffinate phases. The diagram does not show the concentration of the diluents in the extract or the concentration of solvent in the raffinate. These minor components of both phases are accounted for in determining the total flow of extract and raffinate, which affects the position of the operating line. In the McCabe-Thiele diagram, the equilibrium data are shown on a rectangular graph, where the mass fraction of solute in the extract (V) phase, yA, is plotted as the ordinate and the mass fraction of solute in the raffinate (L) phase, xA, as the abscissa. The conversion of equilibrium tie line in the triangle diagram to the y-x digram is shown below.
173
174
Since the total flow rates are not constant, the triangular diagram and the Δ point are used to plot a curved operating line on the McCabe-Thiele diagram. This construction is illustrated in the following figure for a single point. The two end points of the operating line are already given in example E6. (xAN = 0.1, yA,N+1 = 0), and (xA0 = 0.3, yA1 = 0.072). For any arbitrary operating line (must go through Δ), the values of the extract and raffinate concentrations of A are determined from the phase diagram using the common point Δ and transferred to the y-x diagram, as shown in the following figure. The number of stages is then calculated by stepping off the triangles with the operating and equilibrium lines, which is about 2 in this case.
175
176
4. Minimum solvent rate If a solvent rate VN+1 is selected at too low a value, a limiting case will be reached with an operating line through Δ and a tie line being the same. Then an infinite number of stages will be needed to reach the desired separation. The minimum amount of solvent is reached. For actual operation a greater amount of solvent must be used. The procedure to obtain this minimum solvent rate is as follows and shown in the right figure. Firstly line LNVN+1 is extended, then all tie lines between L0 and LN are drawn to intersect the extended line LNVN+1. The intersection farthest from VN+1 (if Δ is in the LN side, which is the case in the figure) or nearest VN+1 (if Δ is on the VN+1 side) is the Δmin point for minimum solvent. The actual position of Δ must be farther from VN+1 (if on the LN side) or nearer to VN+1 (if on the VN+1 side) for a finite number of stages. The larger the amount of solvent, the fewer the number of stages.