67
Liquid-Liquid Phase Transitions and Water-Like Anomalies in Liquids Erik Lascaris Final oral examination 9 July 2014 1
| Date post: | 26-Dec-2015 |
| Category: |
Documents |
| Upload: | harold-wilcox |
| View: | 214 times |
| Download: | 0 times |
1
Liquid-Liquid Phase Transitions and Water-Like Anomalies in Liquids
Erik Lascaris
Final oral examination9 July 2014
2
Outline
• Anomalies in water and simple models
• Liquid-liquid phase transition in water
• Liquid-liquid phase transition in silica
• Conclusions

3
Outline
• Anomalies in water and simple models
• Liquid-liquid phase transition in water
• Liquid-liquid phase transition in silica
• Conclusions
4
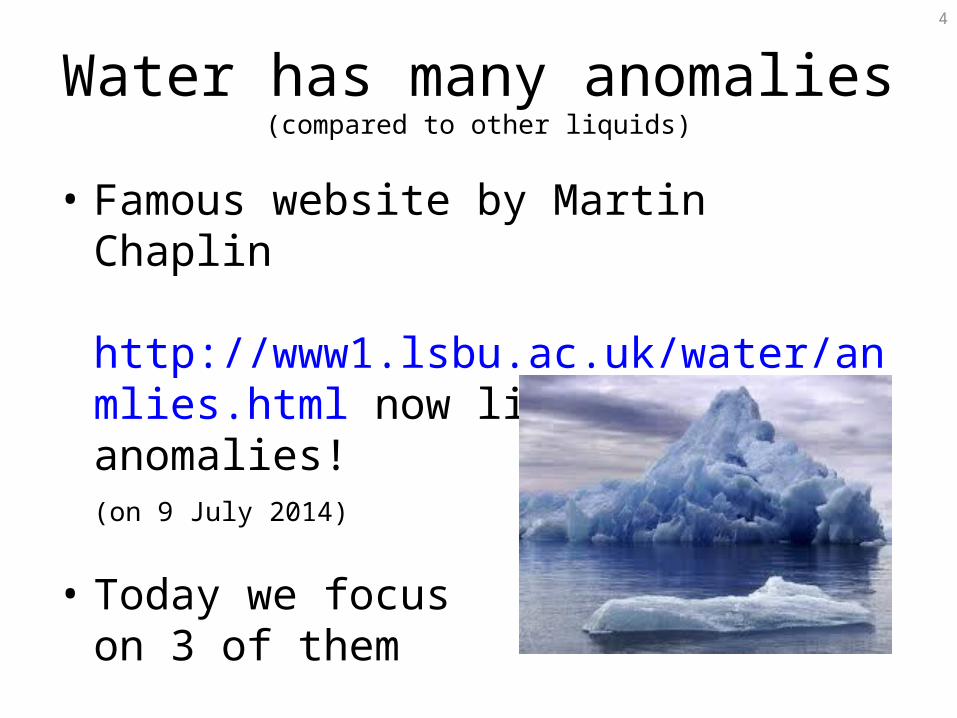
Water has many anomalies(compared to other liquids)
• Famous website by Martin Chaplin http://www1.lsbu.ac.uk/water/anmlies.html now lists 70 anomalies!(on 9 July 2014)
• Today we focuson 3 of them
5
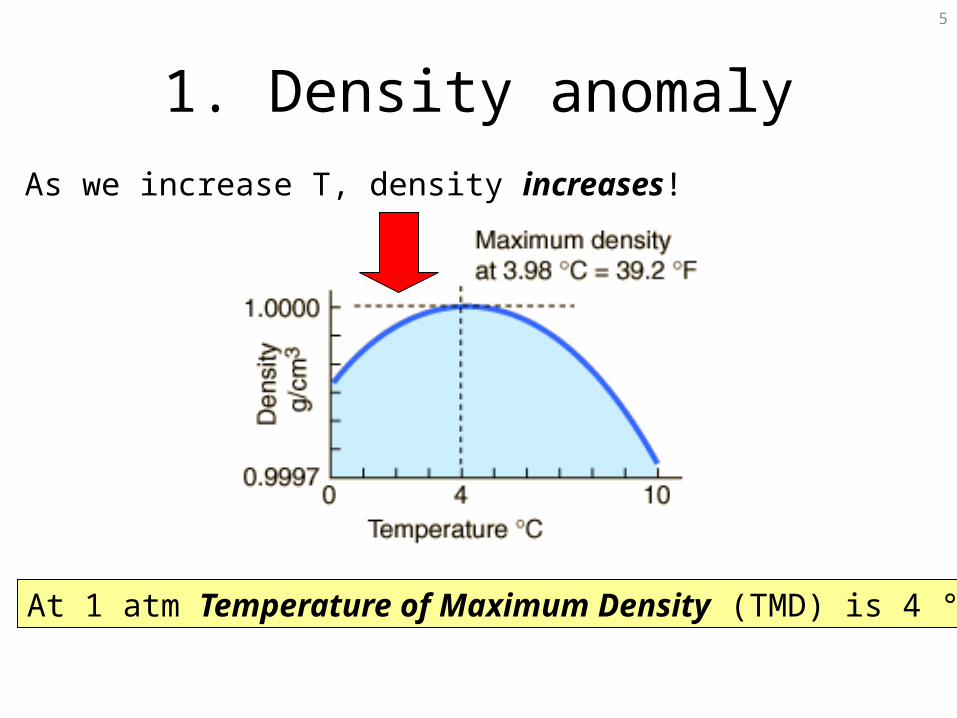
1. Density anomaly
At 1 atm Temperature of Maximum Density (TMD) is 4 °C
As we increase T, density increases!
6
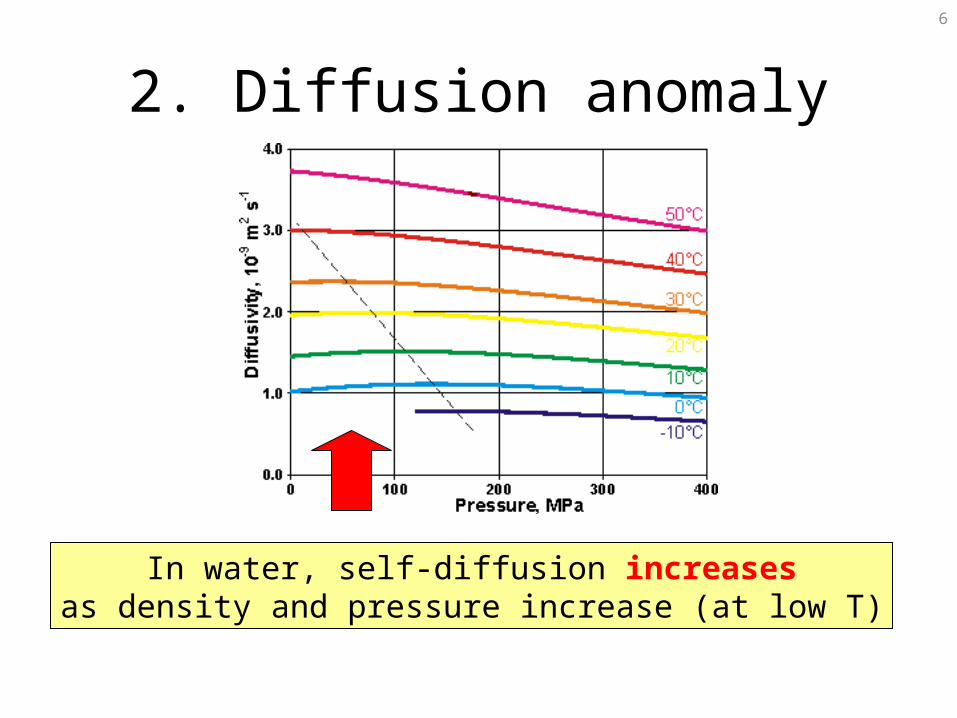
2. Diffusion anomaly
In water, self-diffusion increasesas density and pressure increase (at low T)

7
3. Melting line with negative slope
Applying pressure can melt ice!
Most liquids:
details
8
Water has many anomalies(compared to other liquids)
• Where do these come from?
• What is their origin?
Let’s try a simple model!
9
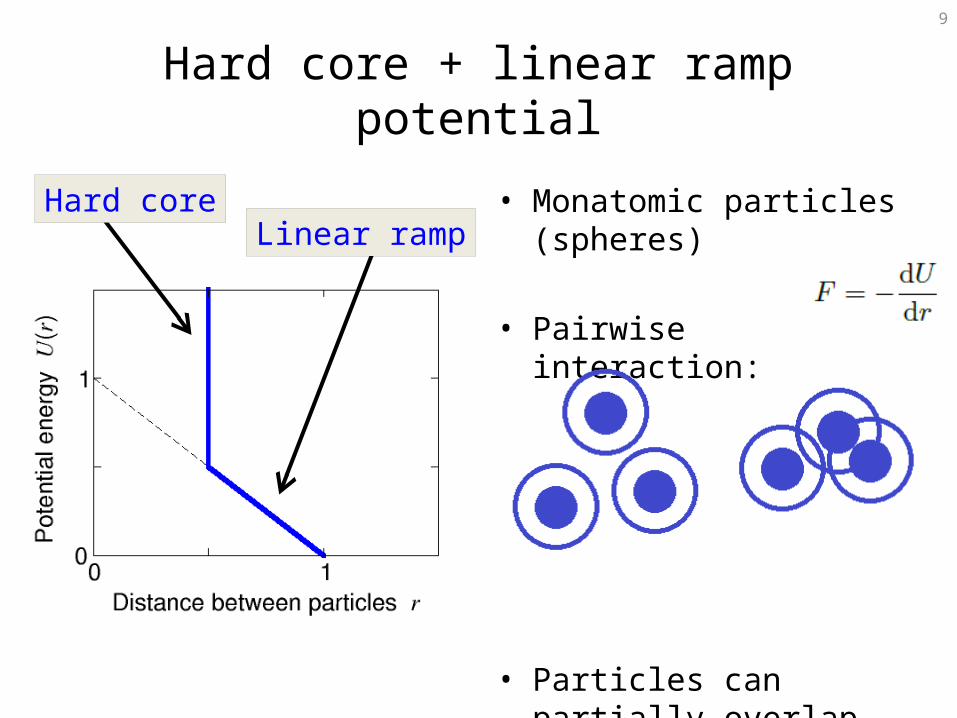
Hard core + linear ramp potential
• Monatomic particles (spheres)
• Pairwise interaction:
• Particles can partially overlap
Hard coreLinear ramp

10
PT diagram
Melting linewith negative slope
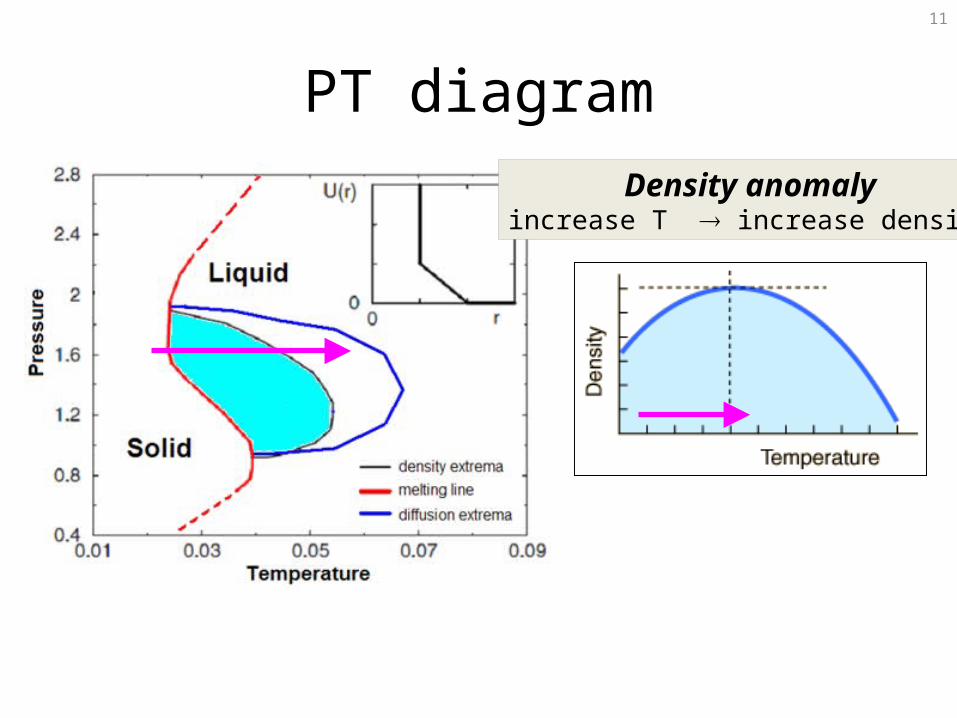
11
PT diagramDensity anomaly
increase T increase density
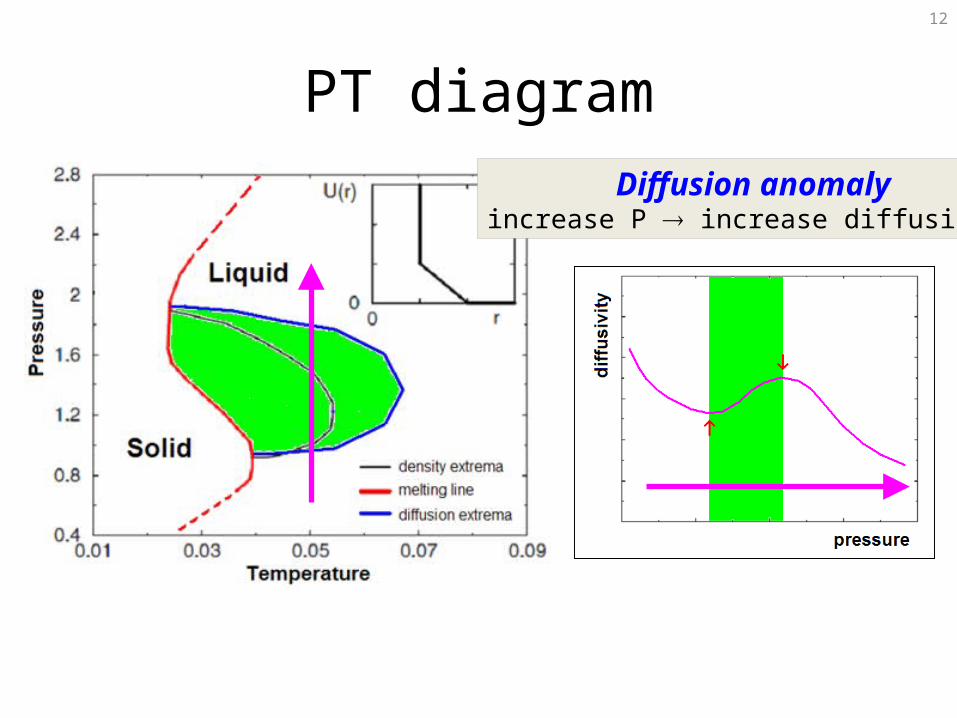
12
PT diagramDiffusion anomaly
increase P increase diffusivity
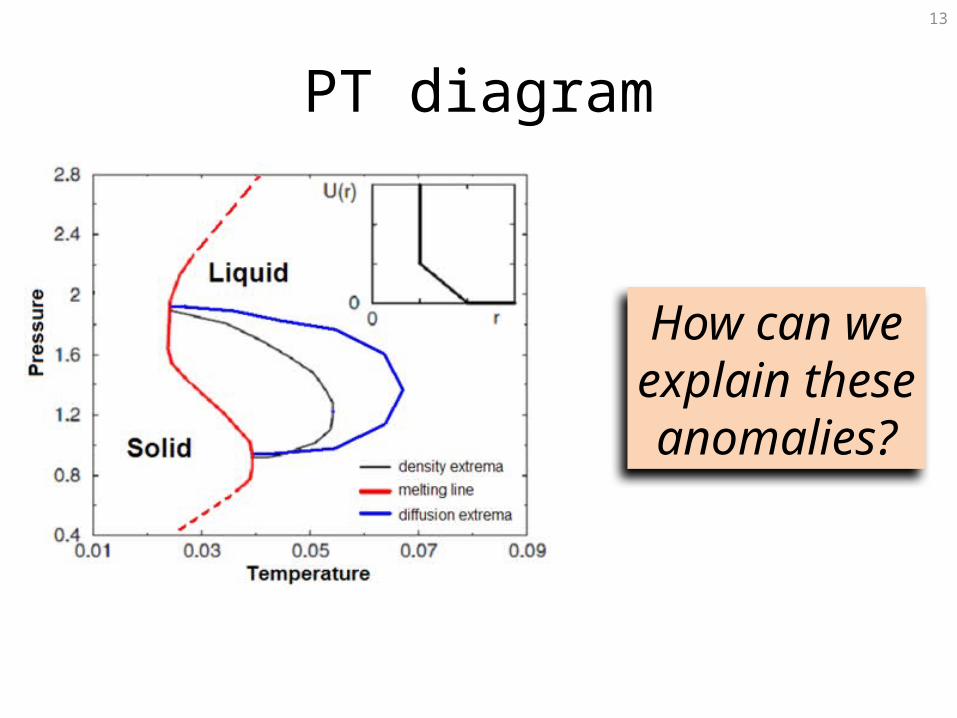
13
PT diagram
How can weexplain theseanomalies?
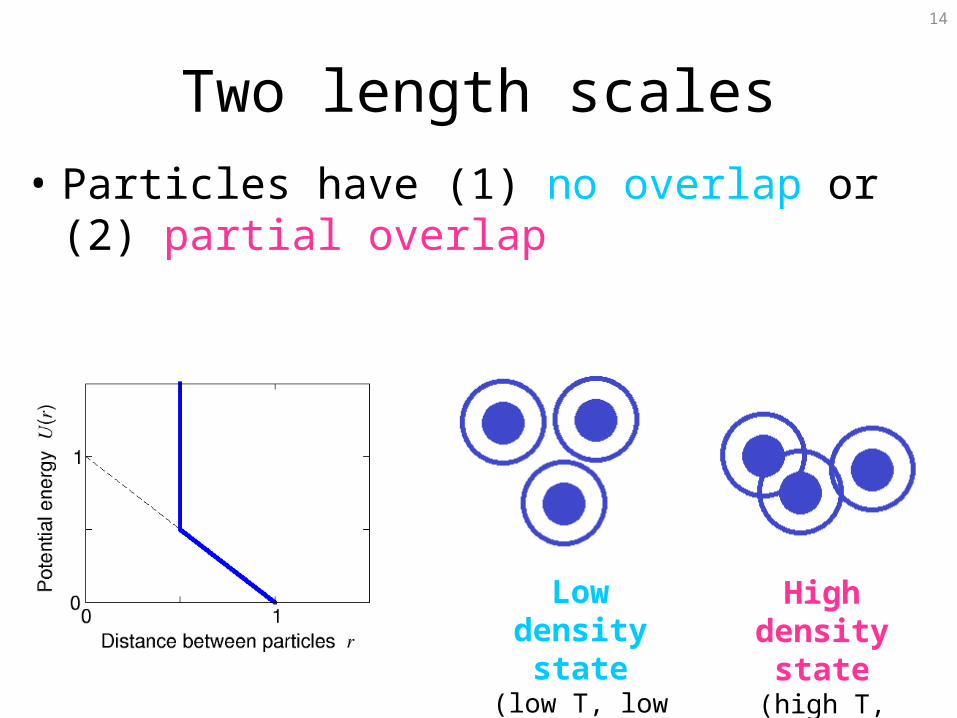
14
Two length scales• Particles have (1) no overlap or (2) partial overlap
Low density state
(low T, low P)
High density state
(high T, high P)
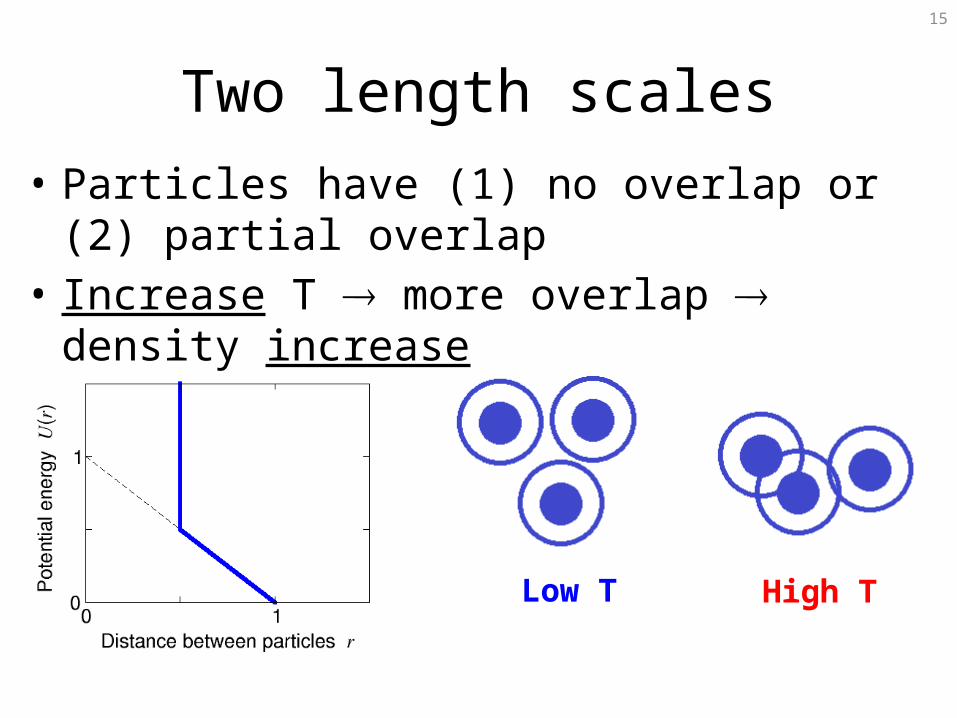
15
Two length scales• Particles have (1) no overlap or (2) partial overlap• Increase T more overlap density increase
High TLow T
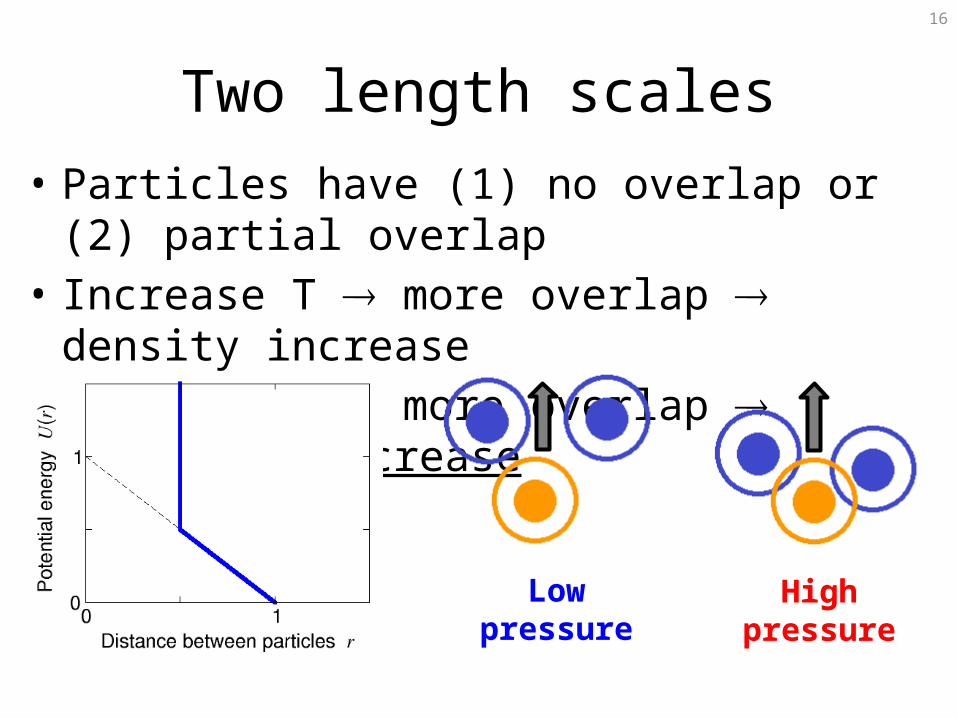
16
Two length scales• Particles have (1) no overlap or (2) partial overlap• Increase T more overlap density increase• Increase P more overlap diffusion increase
High pressureLow pressure
17
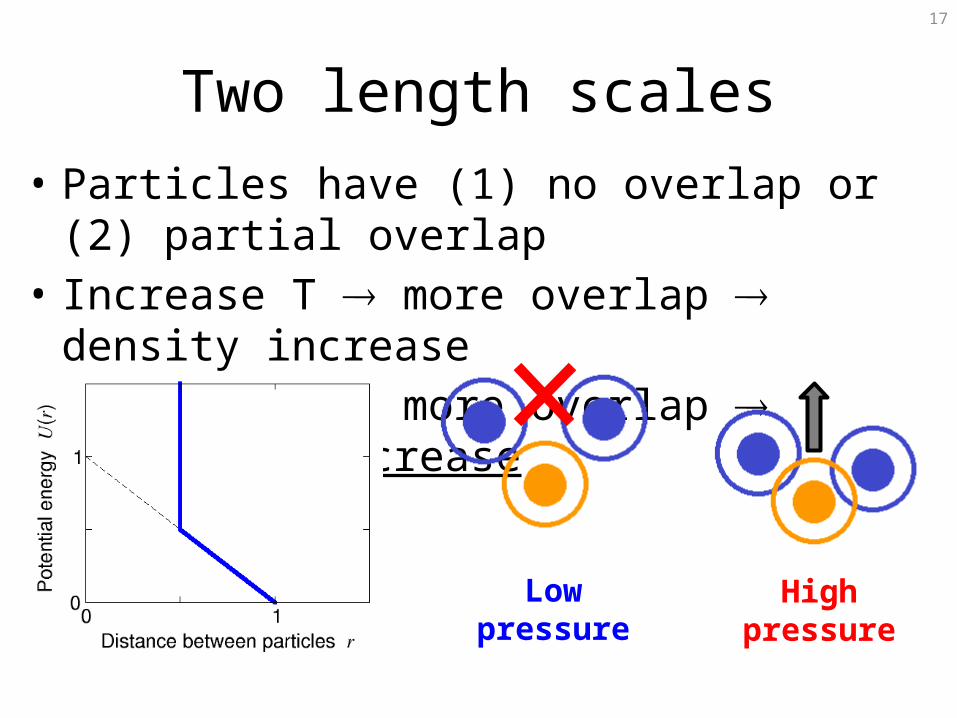
Two length scales• Particles have (1) no overlap or (2) partial overlap• Increase T more overlap density increase• Increase P more overlap diffusion increase
Low pressure High pressure

18
Two length scales• Particles have (1) no overlap or (2) partial overlap• Increase T more overlap density increase• Increase P more overlap diffusion increase
High pressureLow pressure
19
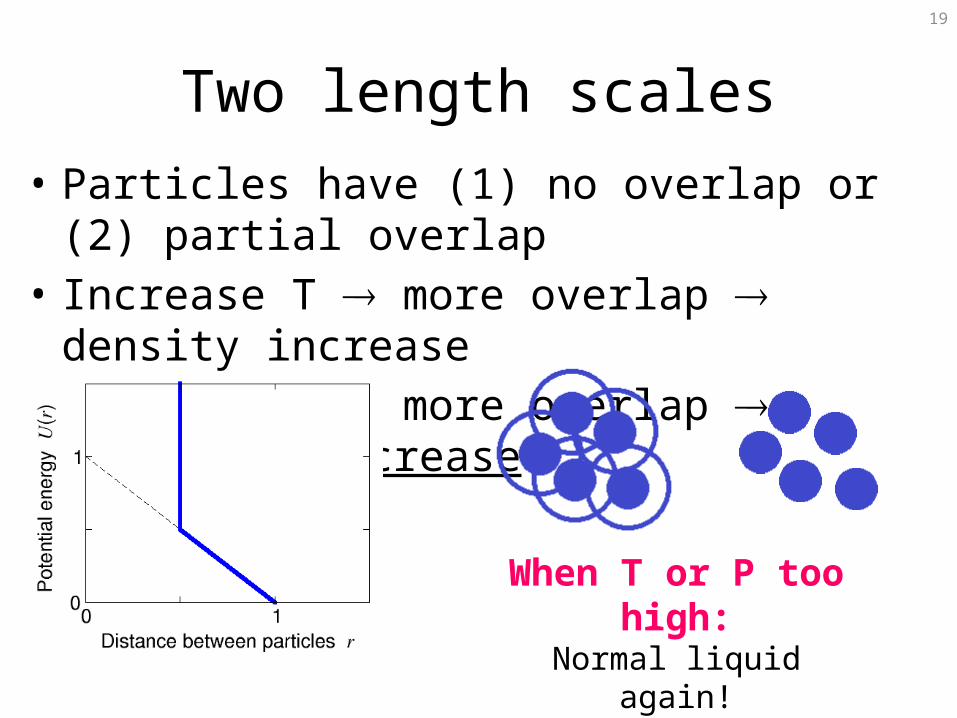
Two length scales• Particles have (1) no overlap or (2) partial overlap• Increase T more overlap density increase• Increase P more overlap diffusion increase
When T or P too high:Normal liquid again!
20
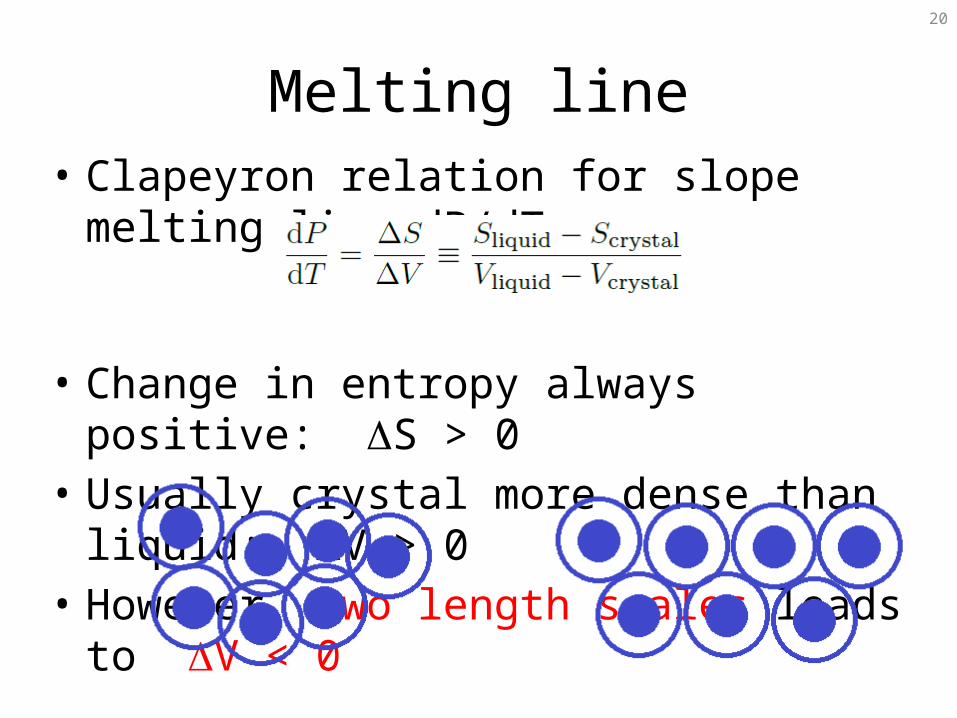
Melting line• Clapeyron relation for slope melting line dP/dT:
• Change in entropy always positive: S > 0• Usually crystal more dense than liquid: V > 0• However, two length scales leads to V < 0
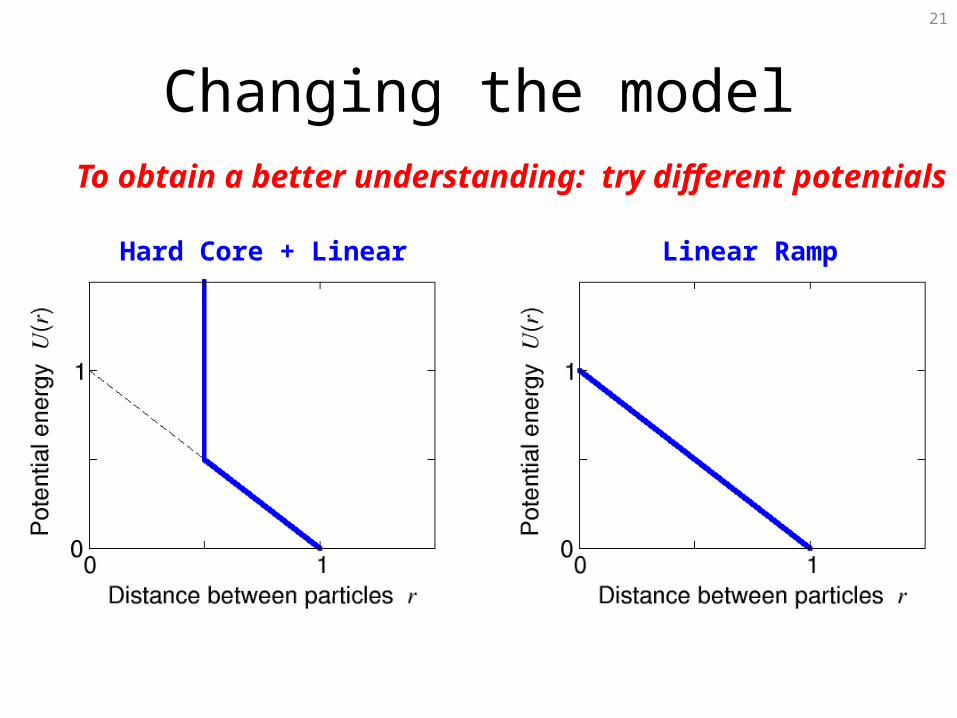
21
Changing the modelTo obtain a better understanding: try different potentials
Hard Core + Linear Ramp Linear Ramp
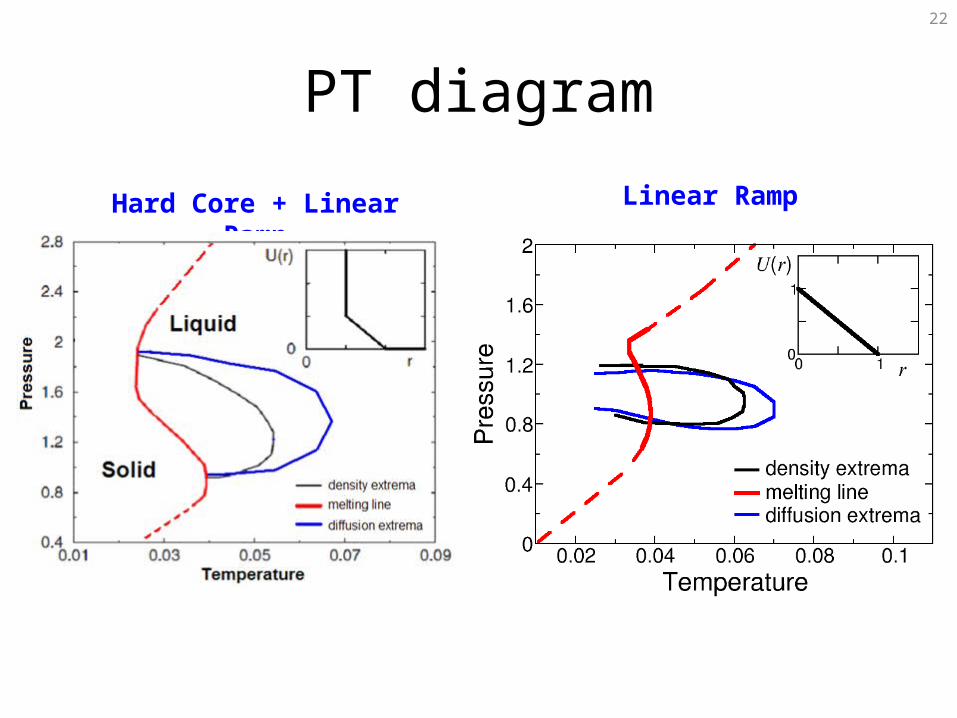
22
PT diagram
Hard Core + Linear Ramp Linear Ramp
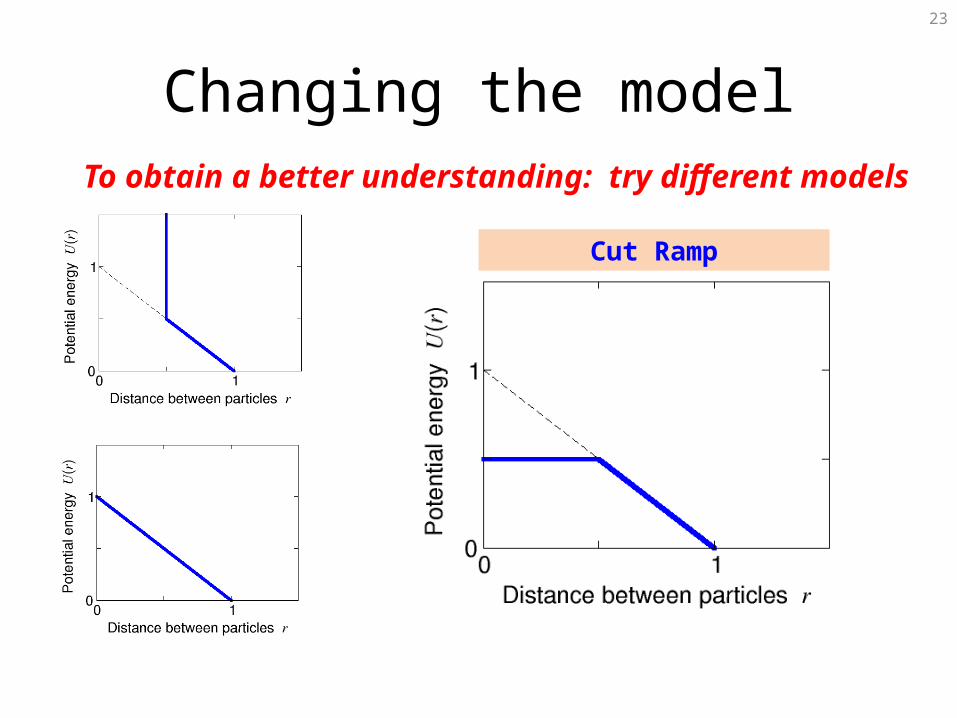
23
Changing the modelTo obtain a better understanding: try different models
Cut Ramp
24
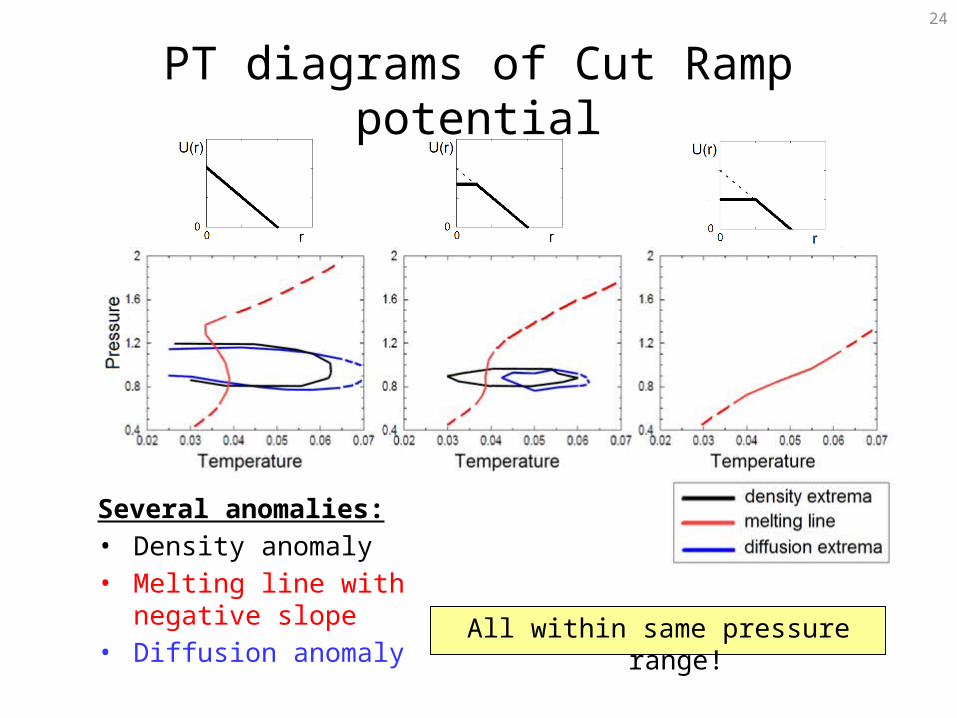
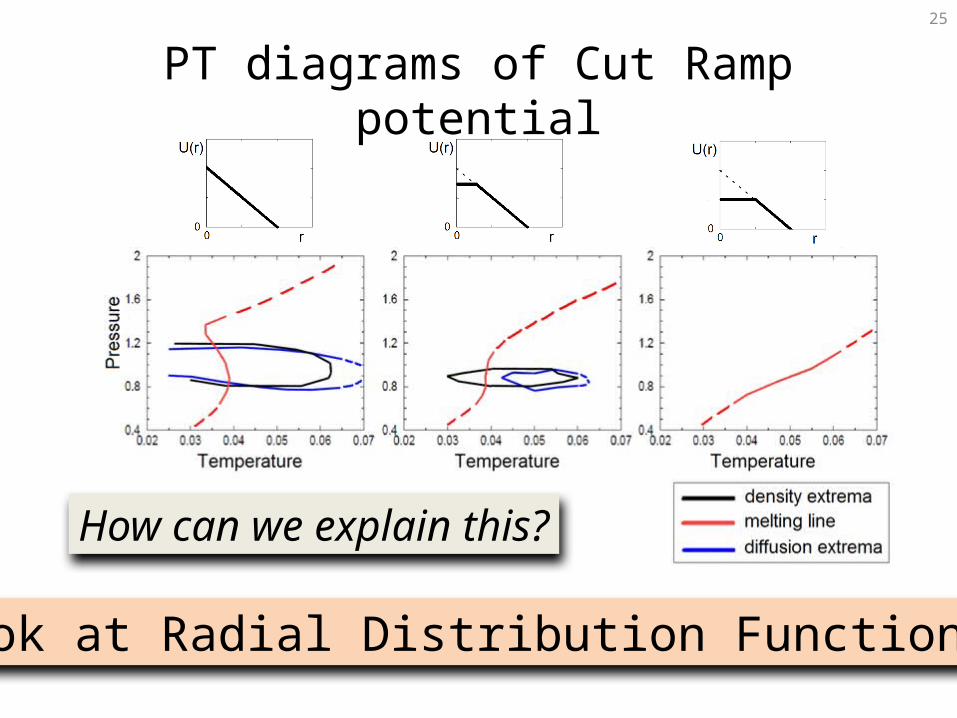
PT diagrams of Cut Ramp potential
Several anomalies:• Density anomaly• Melting line with negative
slope• Diffusion anomaly
All within same pressure range!
25
PT diagrams of Cut Ramp potential
How can we explain this?
Look at Radial Distribution Function!
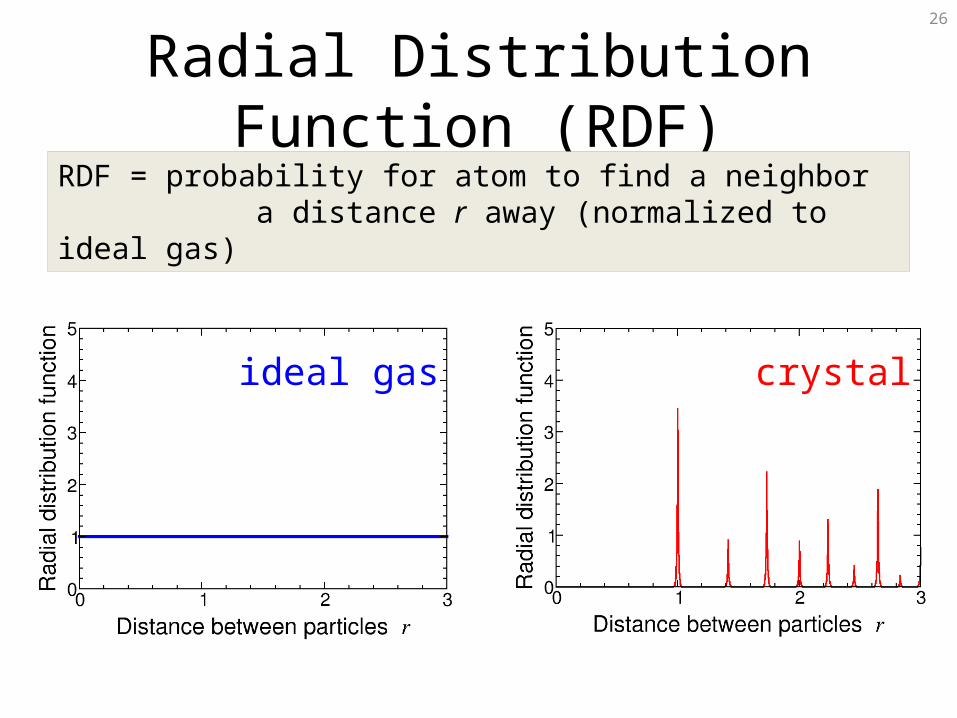
26
Radial Distribution Function (RDF)RDF = probability for atom to find a neighbor a distance r away (normalized to ideal gas)
ideal gas crystal

27
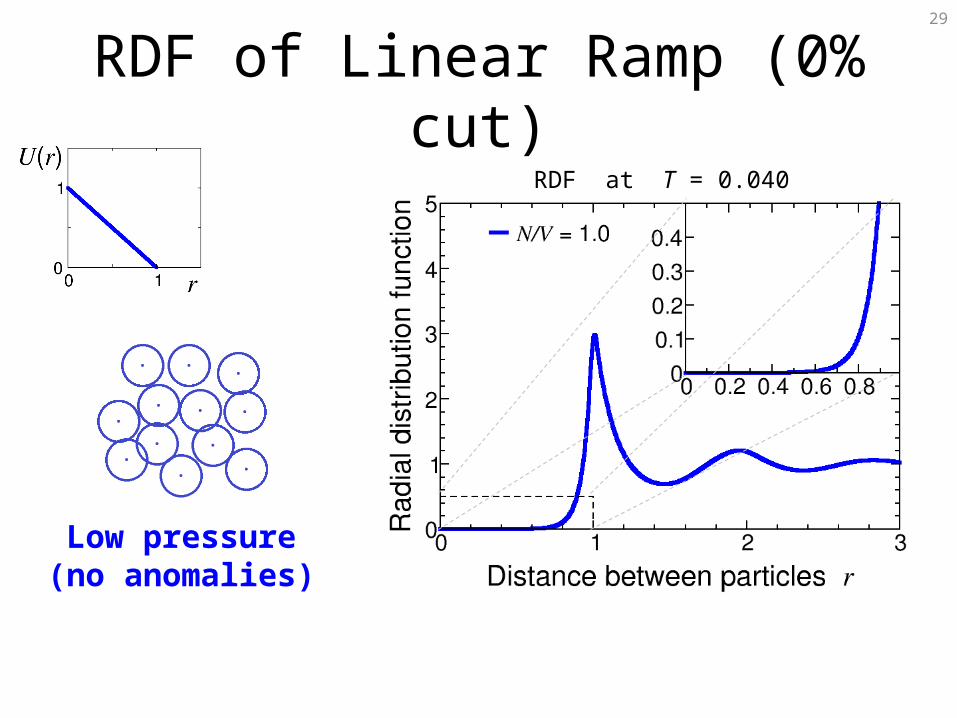
RDF of Linear Ramp (0% cut)
Low pressure(no anomalies)
RDF at T = 0.040

28
RDF of Linear Ramp (0% cut)
Low pressure(no anomalies)
RDF at T = 0.040
29
RDF of Linear Ramp (0% cut)
Low pressure(no anomalies)
RDF at T = 0.040
30
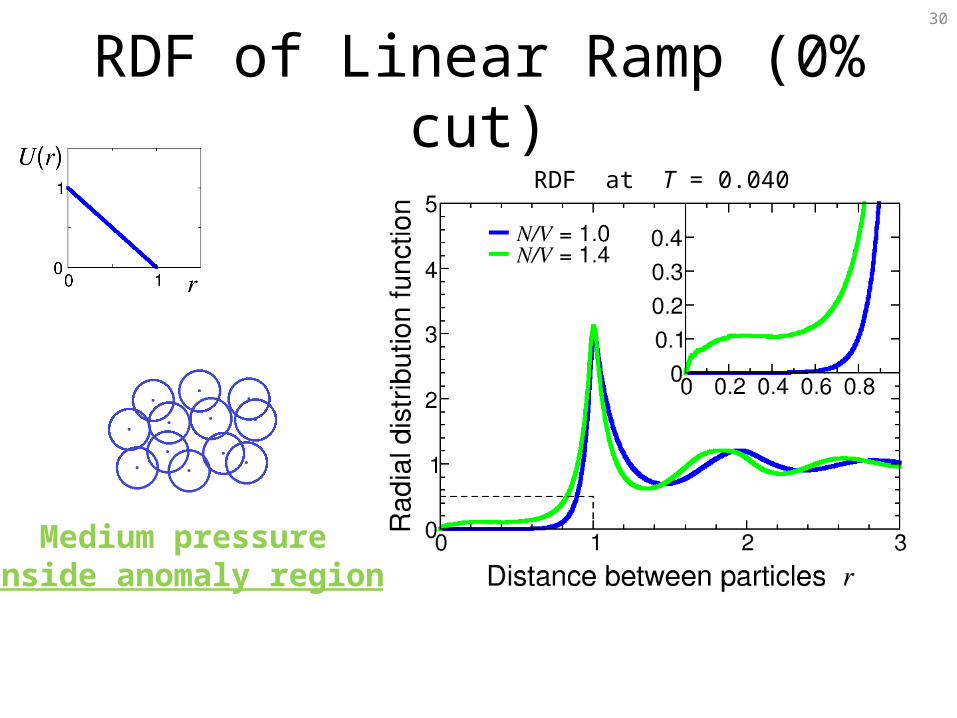
RDF of Linear Ramp (0% cut)
Medium pressure(inside anomaly region)
RDF at T = 0.040

31
RDF of Linear Ramp (0% cut)
High pressure(no anomalies)
RDF at T = 0.040
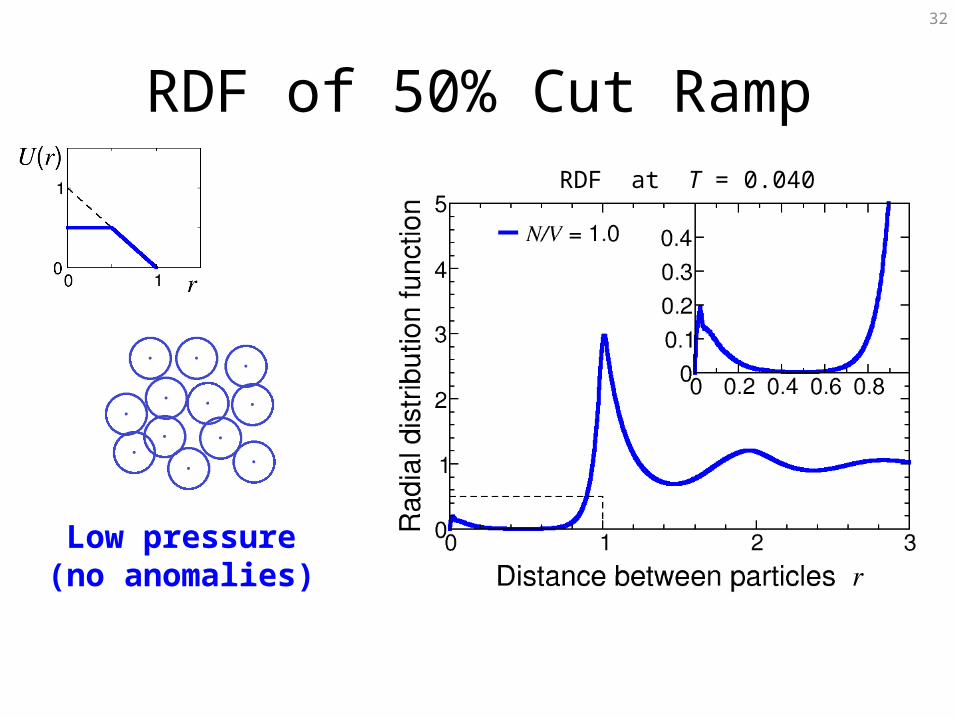
32
RDF of 50% Cut Ramp
Low pressure(no anomalies)
RDF at T = 0.040
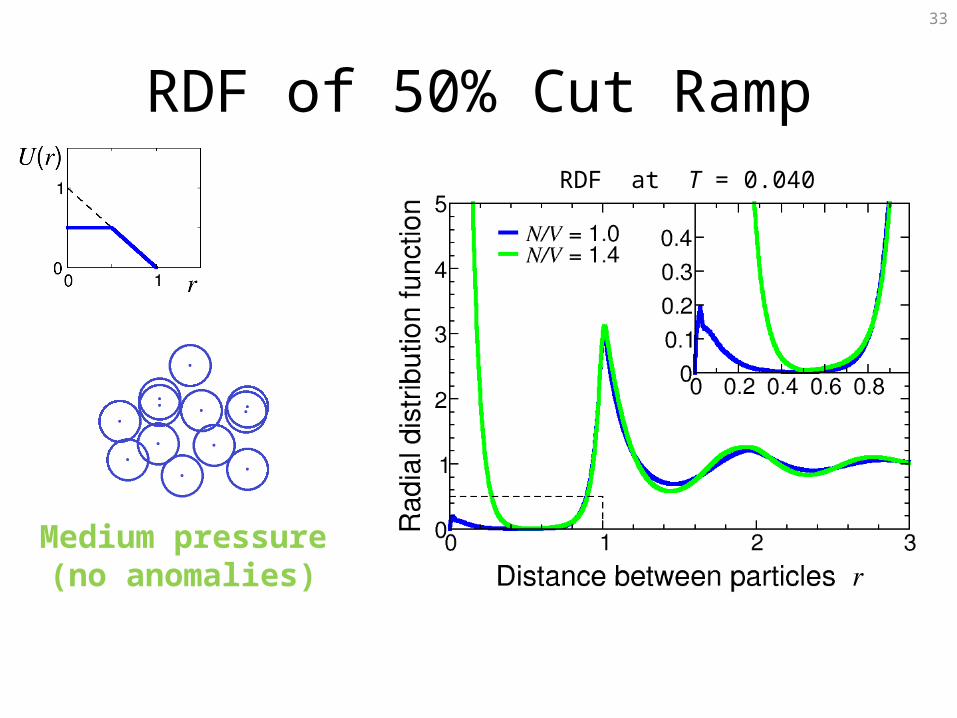
33
RDF of 50% Cut Ramp
Medium pressure(no anomalies)
RDF at T = 0.040
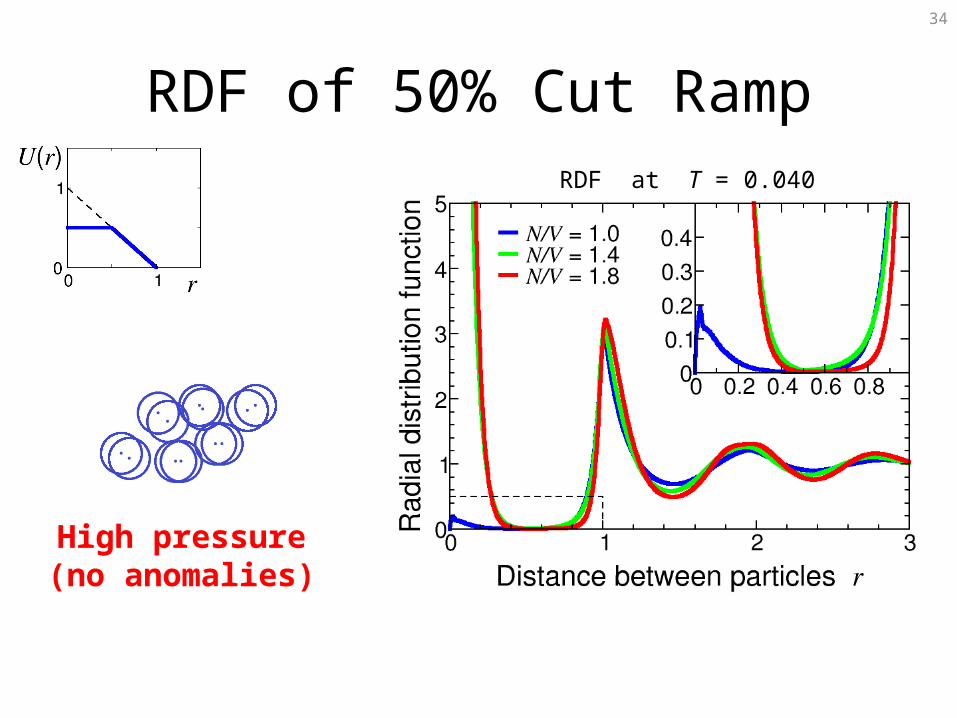
34
RDF of 50% Cut Ramp
High pressure(no anomalies)
RDF at T = 0.040
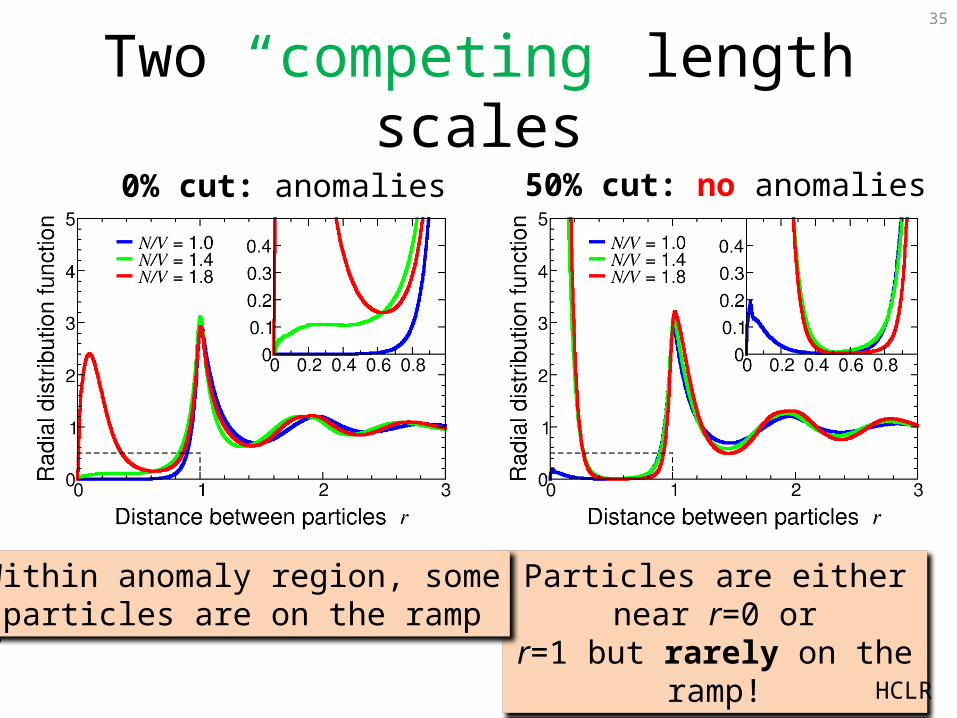
35
Two “competing” length scales
Particles are either near r=0 orr=1 but rarely on the ramp!
Within anomaly region, someparticles are on the ramp
0% cut: anomalies 50% cut: no anomalies
HCLR
36
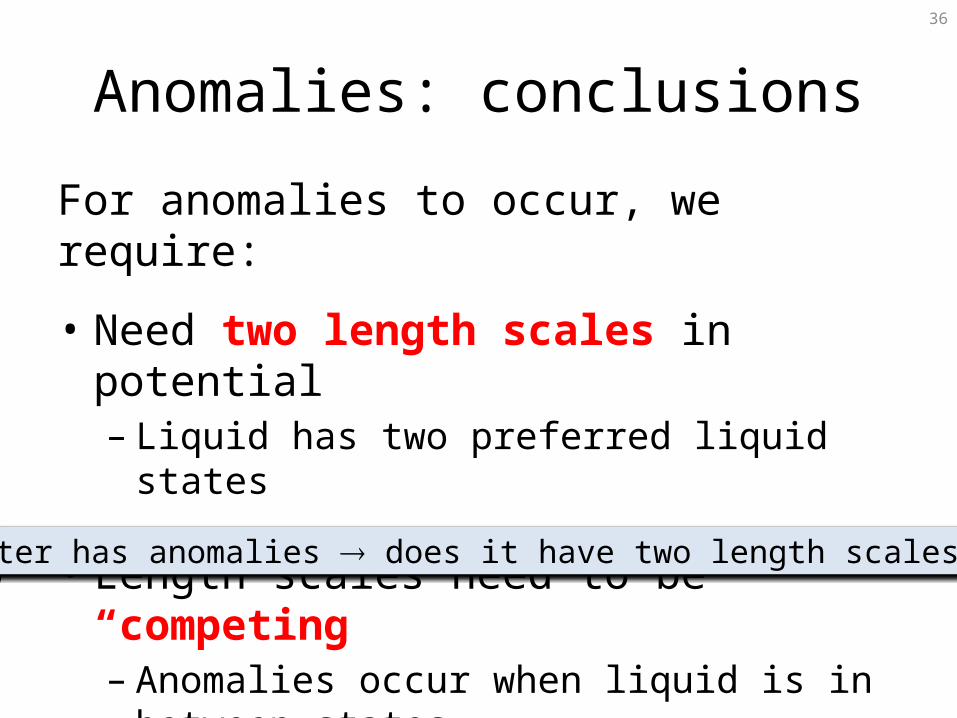
Anomalies: conclusions
For anomalies to occur, we require:
• Need two length scales in potential– Liquid has two preferred liquid states
• Length scales need to be “competing”– Anomalies occur when liquid is in between states
Water has anomalies does it have two length scales?
37
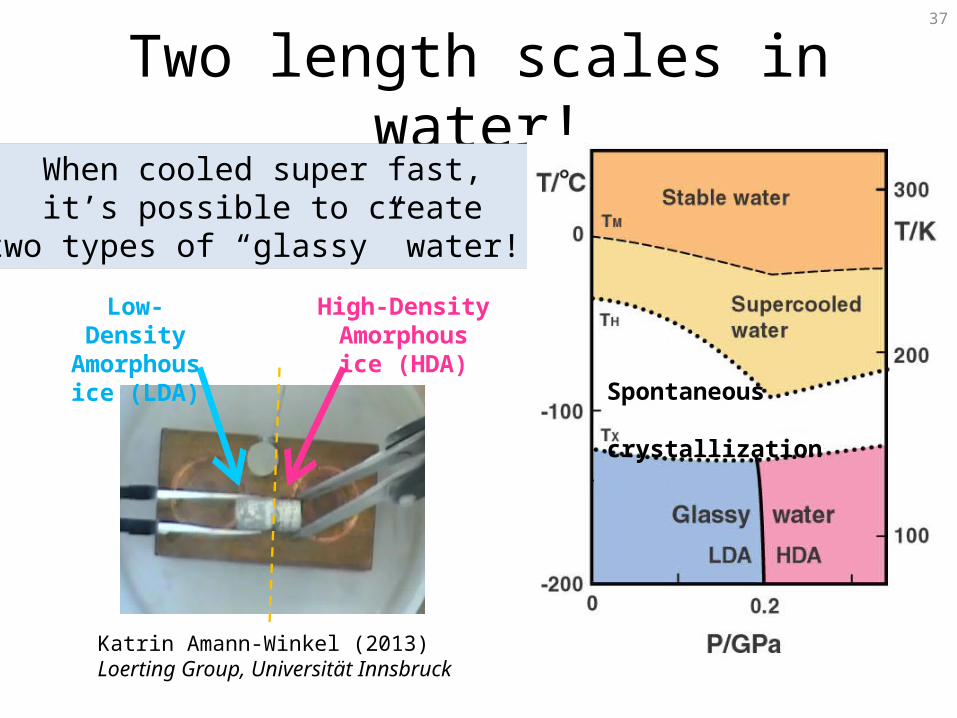
Two length scales in water!
High-DensityAmorphous
ice (HDA)
Katrin Amann-Winkel (2013)Loerting Group, Universität Innsbruck
Low-DensityAmorphous
ice (LDA)
When cooled super fast,it’s possible to create
two types of “glassy” water!
Spontaneous crystallization
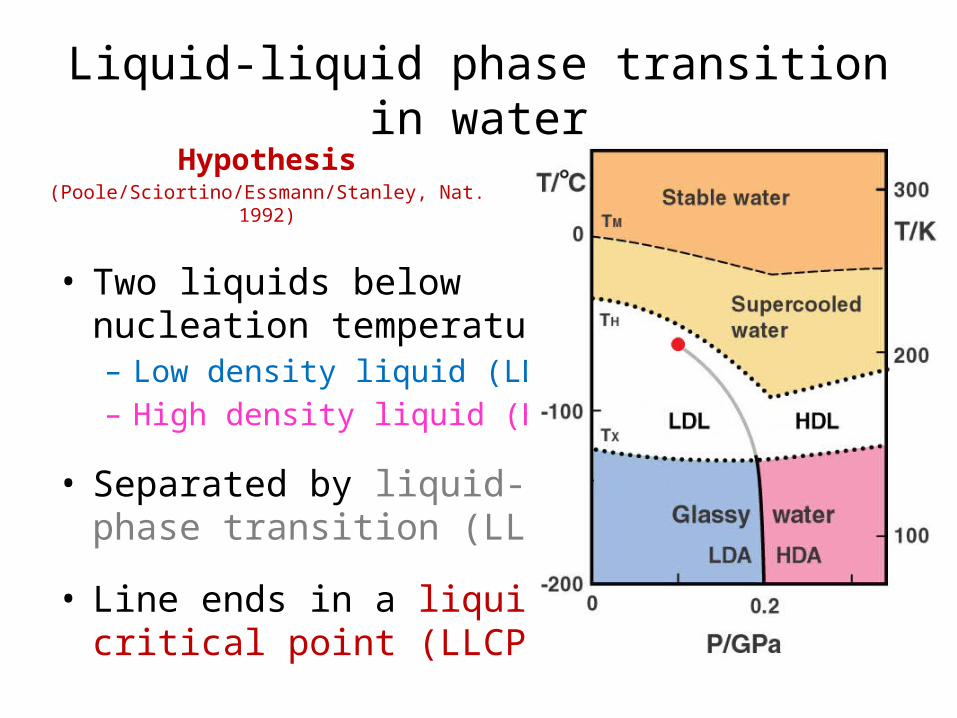
Liquid-liquid phase transition in water
• Two liquids belownucleation temperature:– Low density liquid (LDL)– High density liquid (HDL)
• Separated by liquid-liquidphase transition (LLPT) line
• Line ends in a liquid-liquidcritical point (LLCP)
Hypothesis(Poole/Sciortino/Essmann/Stanley, Nat. 1992)

39
Outline
• Anomalies in water and simple models
• Liquid-liquid phase transition in water(using ST2 model)
• Liquid-liquid phase transition in silica
• Conclusions
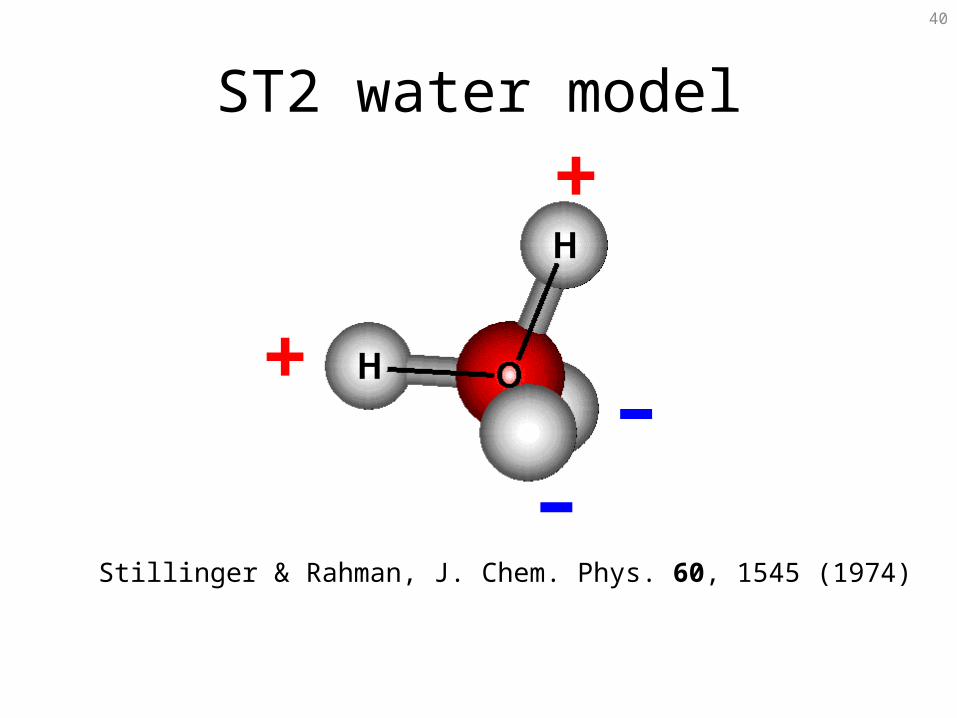
40
ST2 water model
+
+–
–Stillinger & Rahman, J. Chem. Phys. 60, 1545 (1974)
41
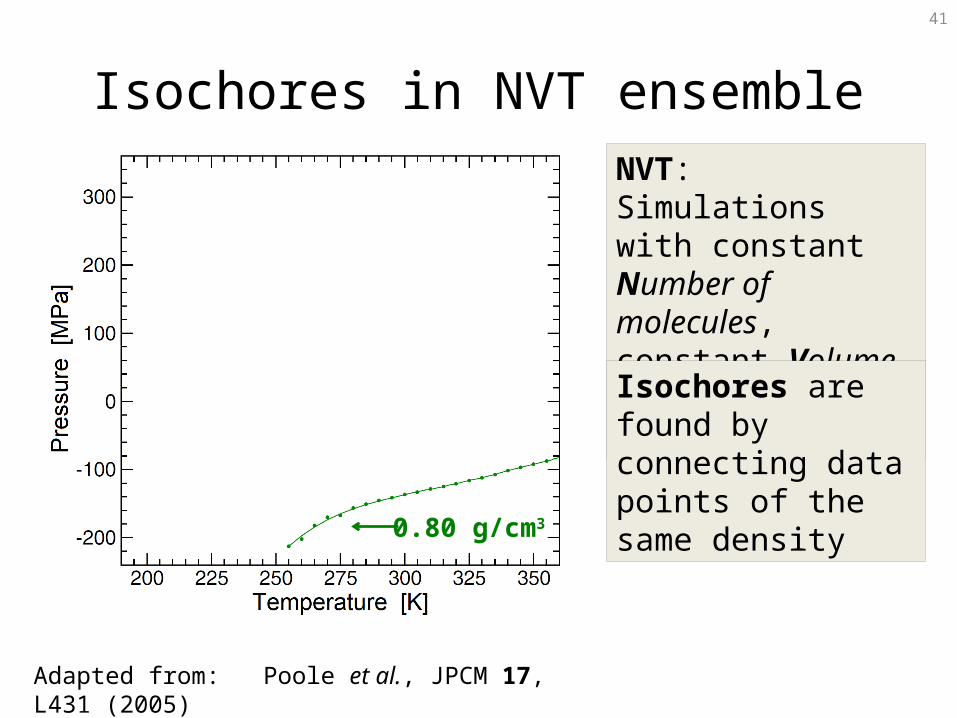
Isochores in NVT ensemble
Adapted from: Poole et al., JPCM 17, L431 (2005)
0.80 g/cm3
NVT: Simulations with constant Number of molecules, constant Volume, and constant Temperature
Isochores are found by connecting data points of the same density
42
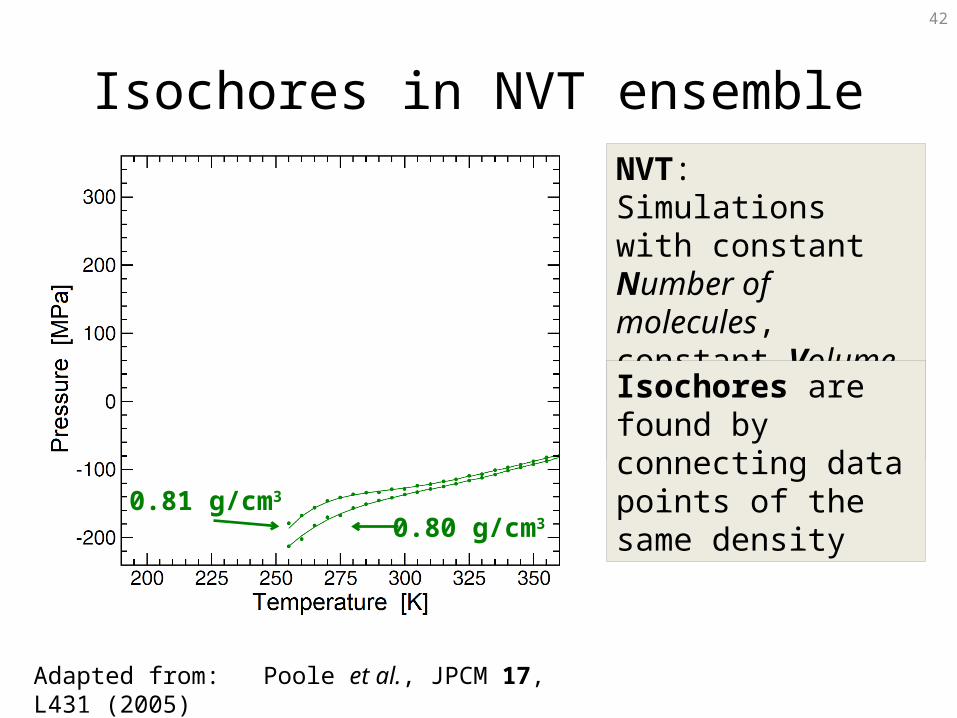
Isochores in NVT ensemble
Adapted from: Poole et al., JPCM 17, L431 (2005)
0.80 g/cm30.81 g/cm3
NVT: Simulations with constant Number of molecules, constant Volume, and constant Temperature
Isochores are found by connecting data points of the same density
43
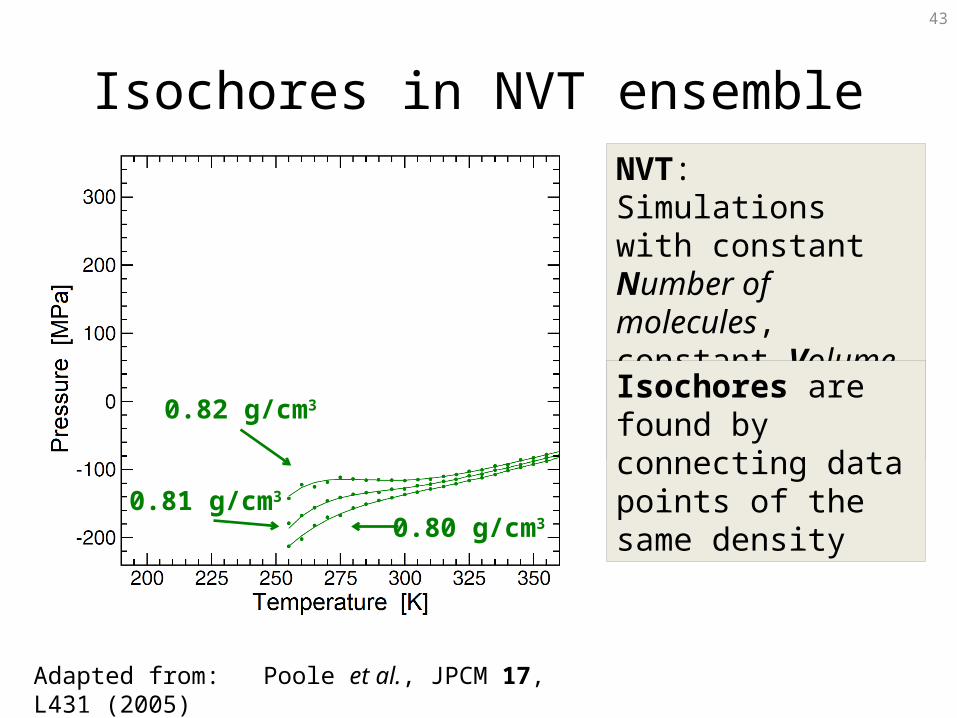
Isochores in NVT ensemble
0.80 g/cm30.81 g/cm3
0.82 g/cm3
Adapted from: Poole et al., JPCM 17, L431 (2005)
NVT: Simulations with constant Number of molecules, constant Volume, and constant Temperature
Isochores are found by connecting data points of the same density
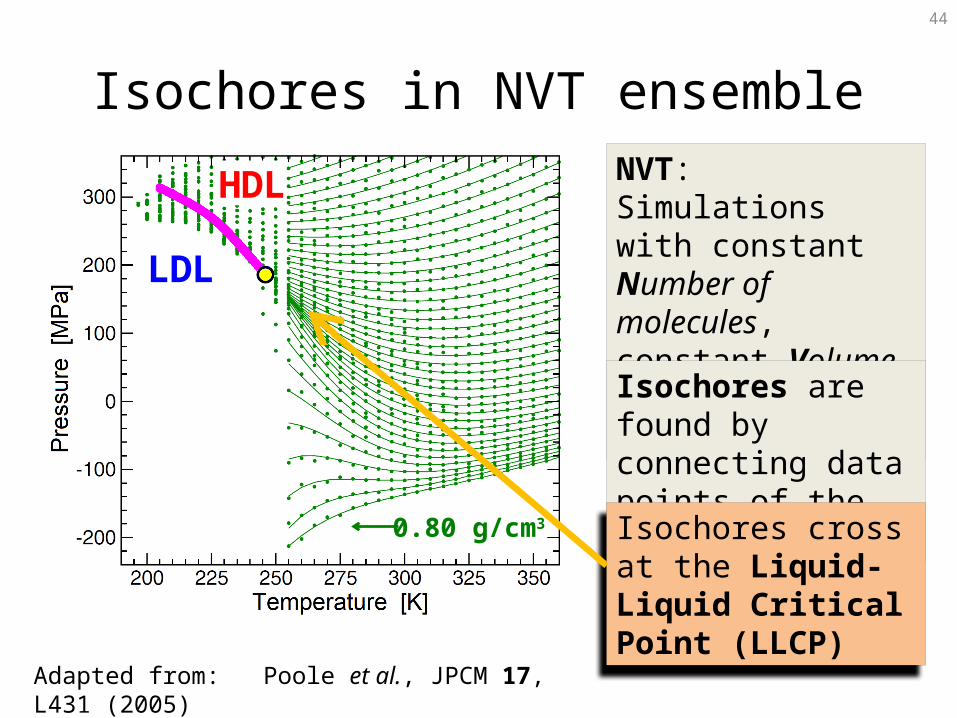
44
Isochores in NVT ensembleHDL
LDL
NVT: Simulations with constant Number of molecules, constant Volume, and constant Temperature
Isochores are found by connecting data points of the same density
Adapted from: Poole et al., JPCM 17, L431 (2005)
0.80 g/cm3 Isochores cross at the Liquid-Liquid Critical Point (LLCP)
45
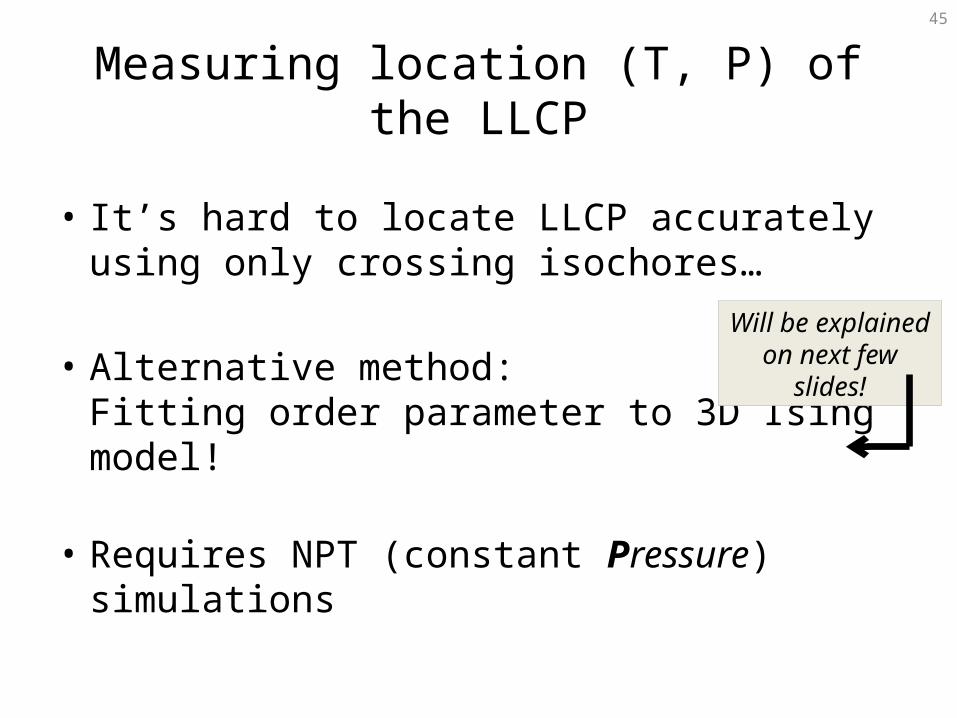
Measuring location (T, P) of the LLCP
• It’s hard to locate LLCP accurately using only crossing isochores…
• Alternative method:Fitting order parameter to 3D Ising model!
• Requires NPT (constant Pressure) simulations
Will be explained on next few slides!
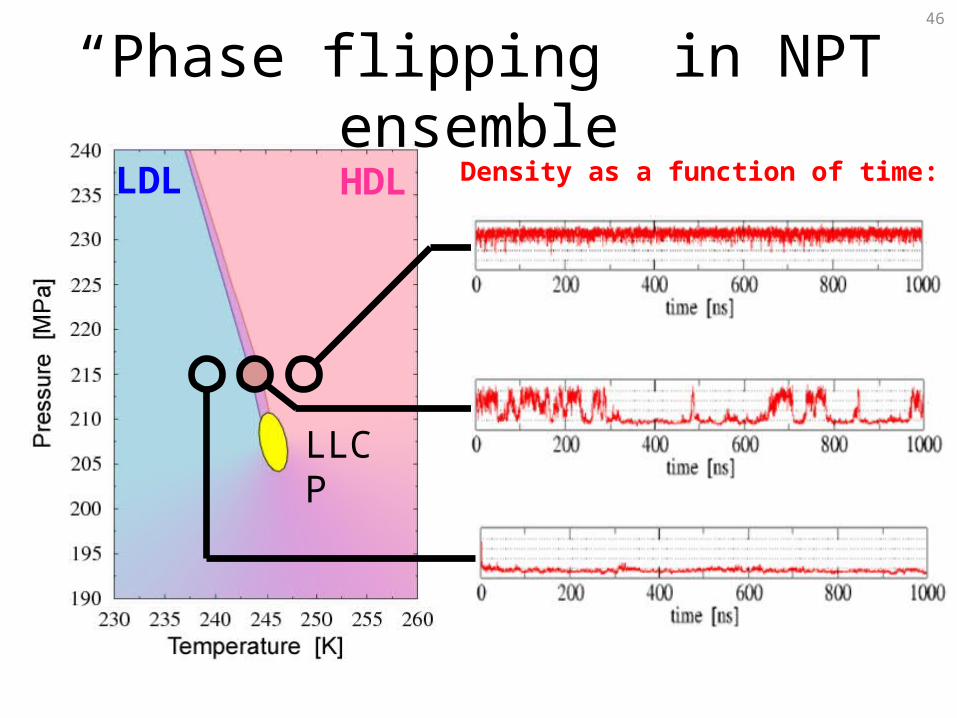
“Phase flipping” in NPT ensemble46
LDL HDL
LLCP
Density as a function of time:
47
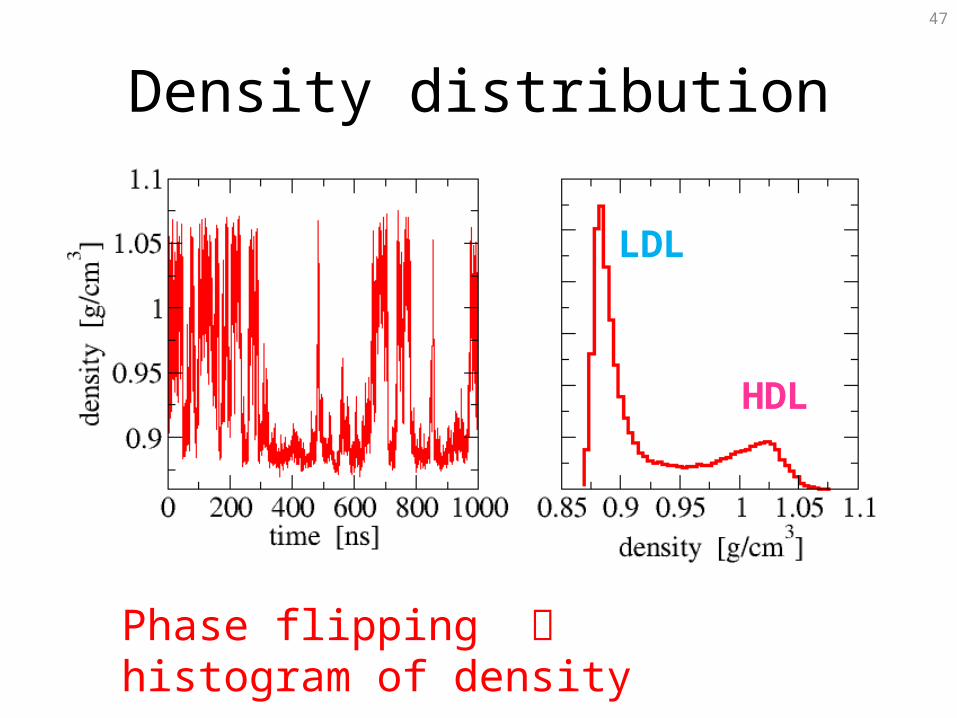
Density distribution
Phase flipping histogram of density
LDL
HDL
48
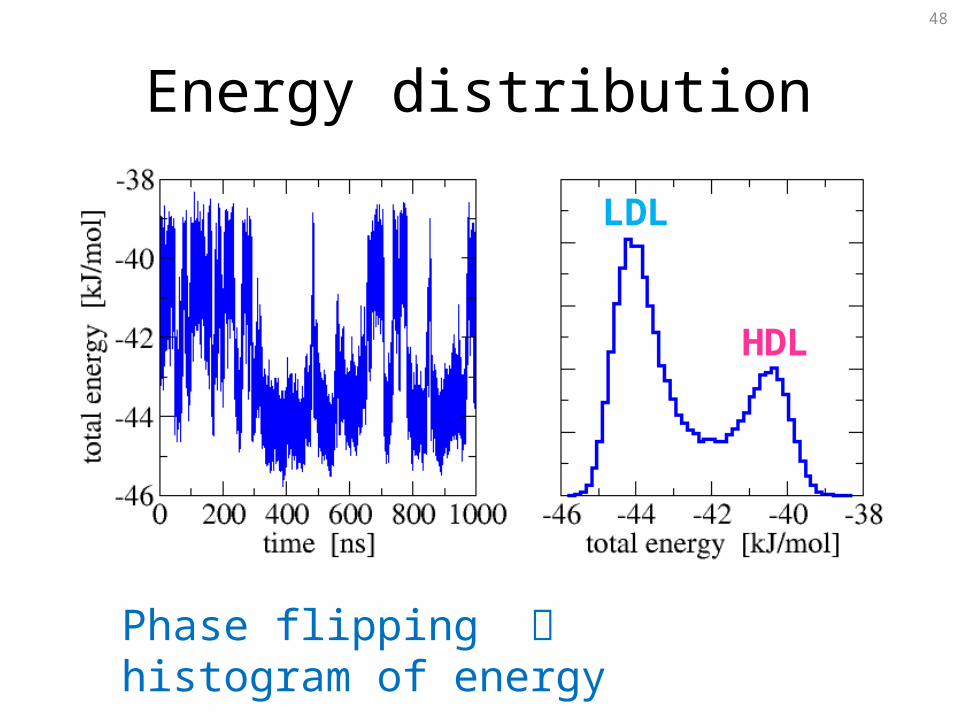
Energy distribution
Phase flipping histogram of energy
LDL
HDL
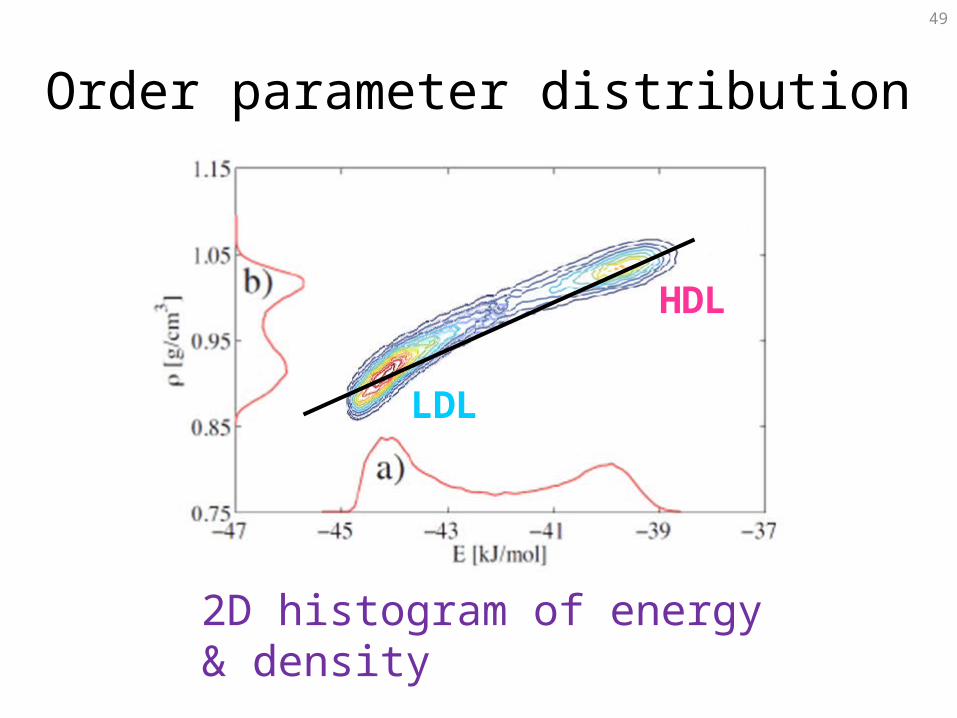
49
Order parameter distribution
2D histogram of energy & density
LDL
HDL
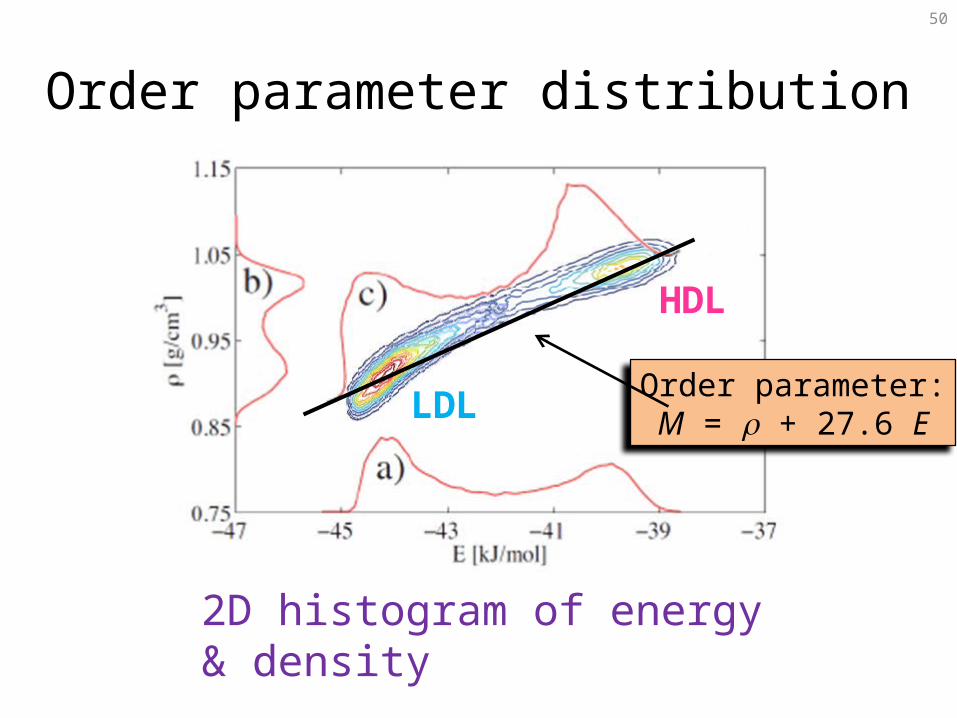
50
Order parameter distribution
2D histogram of energy & density
Order parameter:M = r + 27.6 ELDL
HDL
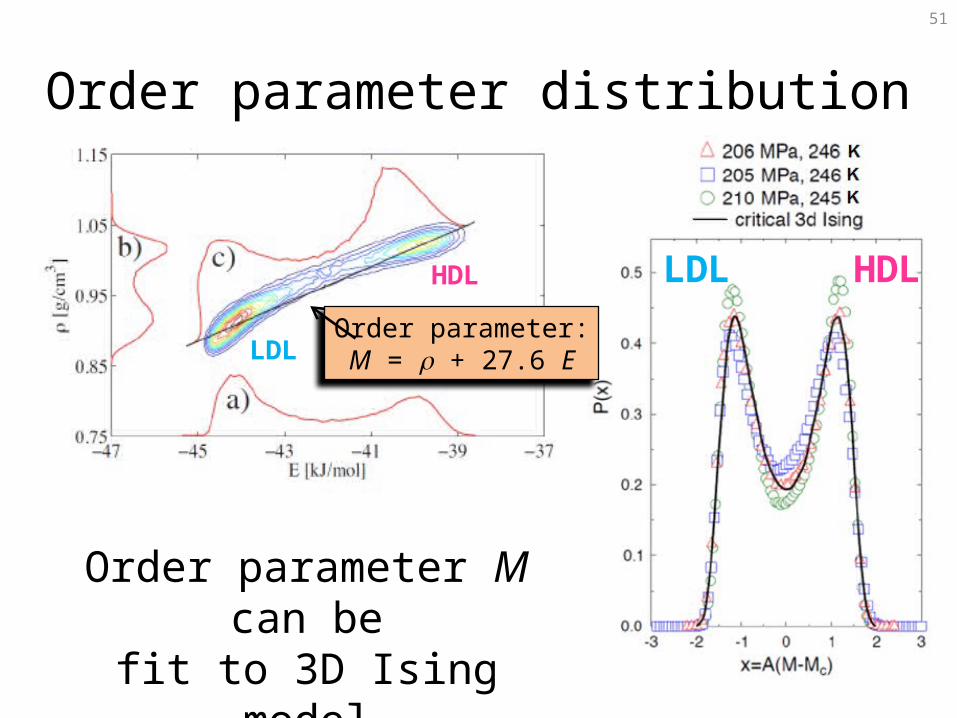
51
Order parameter distribution
Order parameter M can befit to 3D Ising model
Order parameter:M = r + 27.6 ELDL
HDL LDL HDL

52
Outline
• Anomalies in water and simple models
• Liquid-liquid phase transition in water
• Liquid-liquid phase transition in silica(using WAC model and BKS model)
• Conclusions

53
Two models of silica (SiO2)
WAC model• Woodcock, Angell, and
Cheeseman• Introduced 1976• Ions: Si+4 and O–2
• Simple 1:2 mixture of Si and O ions
• Each ion has a charge + electrostatics
• Repulsive potential between ionsto prevent Si-O fusion
BKS model• van Beest, Kramer, and
van Santen• Introduced 1990• Ions: Si+2.4 and O–1.2
54
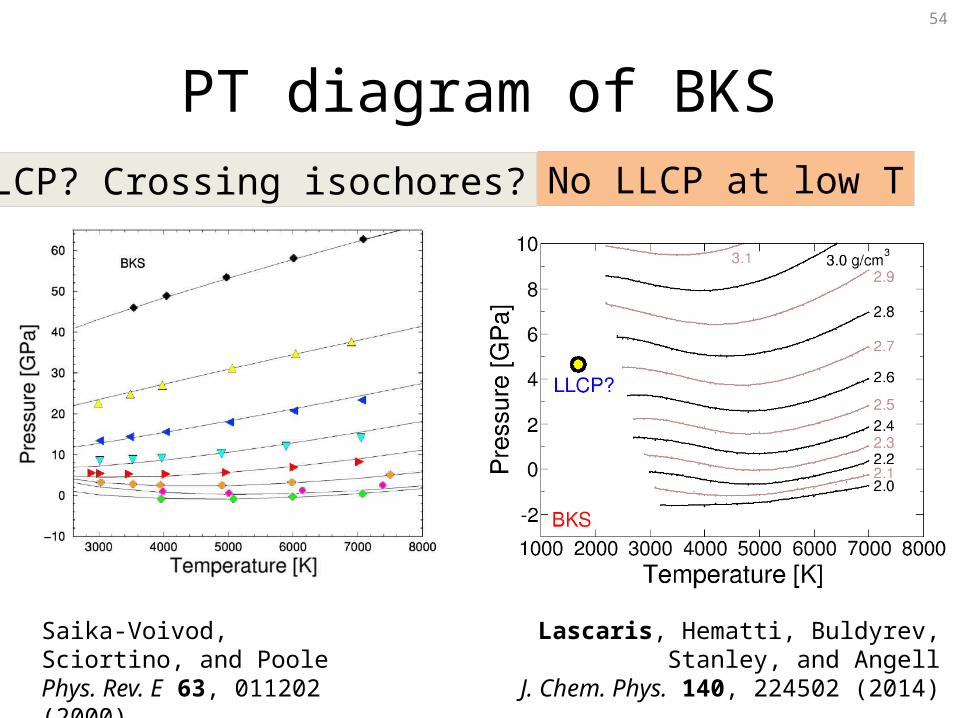
PT diagram of BKS
Saika-Voivod, Sciortino, and PoolePhys. Rev. E 63, 011202 (2000)
Lascaris, Hematti, Buldyrev, Stanley, and AngellJ. Chem. Phys. 140, 224502 (2014)
LLCP? Crossing isochores? No LLCP at low T
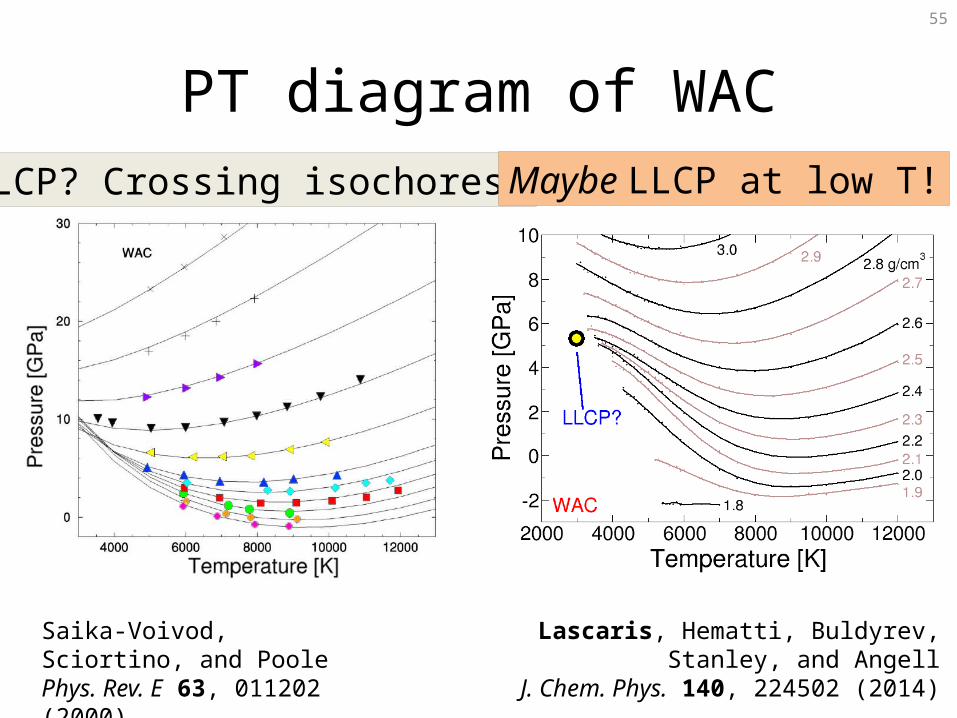
55
PT diagram of WAC
Lascaris, Hematti, Buldyrev, Stanley, and AngellJ. Chem. Phys. 140, 224502 (2014)
LLCP? Crossing isochores? Maybe LLCP at low T!
Saika-Voivod, Sciortino, and PoolePhys. Rev. E 63, 011202 (2000)
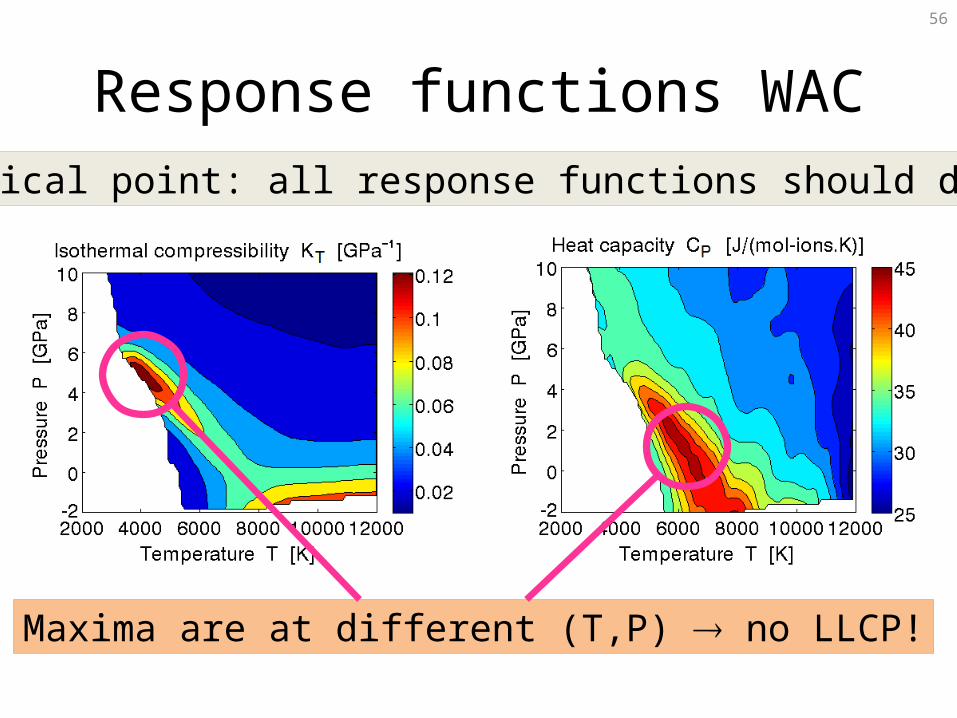
56
Response functions WACAt critical point: all response functions should diverge!
Maxima are at different (T,P) no LLCP!
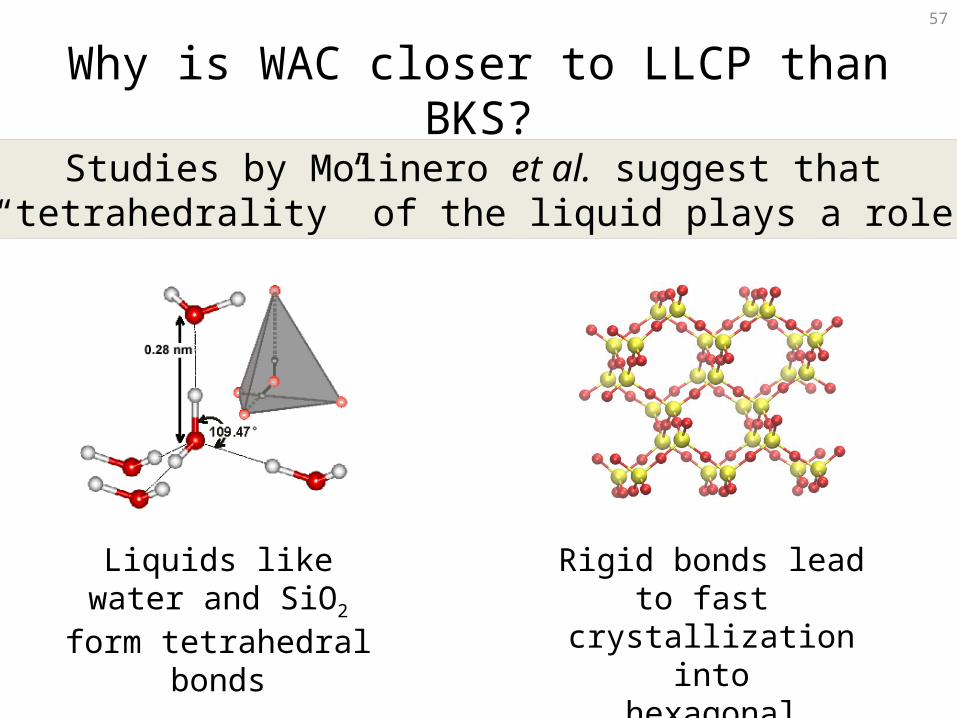
57
Why is WAC closer to LLCP than BKS?Studies by Molinero et al. suggest that
“tetrahedrality” of the liquid plays a role
Liquids like water and SiO2
form tetrahedral bondsRigid bonds lead to fast
crystallization intohexagonal crystal
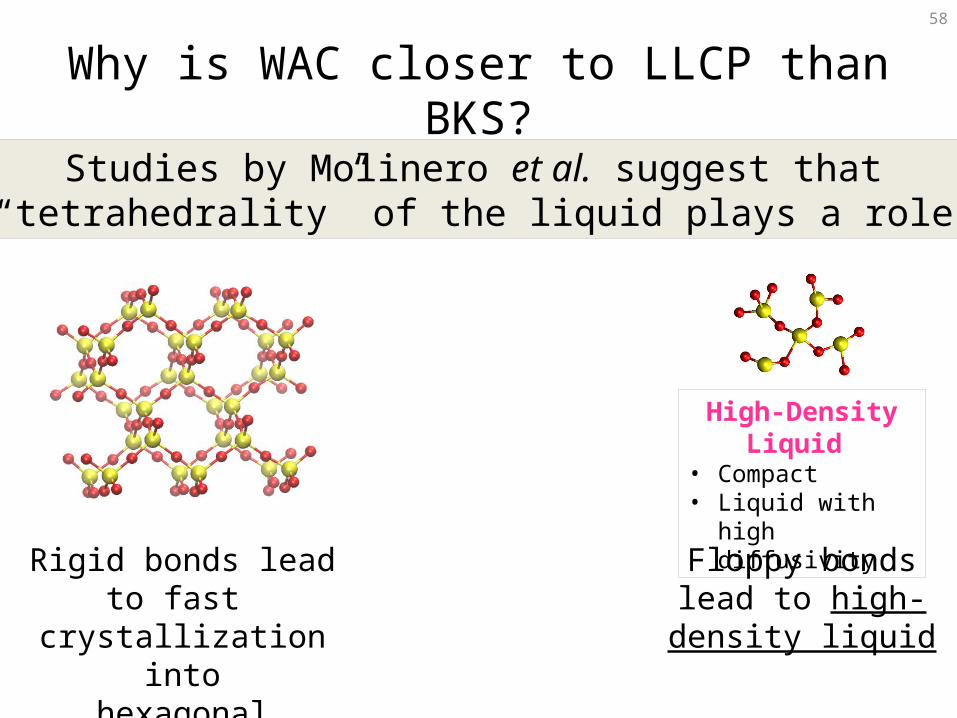
58
Why is WAC closer to LLCP than BKS?Studies by Molinero et al. suggest that
“tetrahedrality” of the liquid plays a role
Rigid bonds lead to fast crystallization intohexagonal crystal
High-Density Liquid • Compact• Liquid with
high diffusivity
Floppy bonds lead to high-density liquid
59
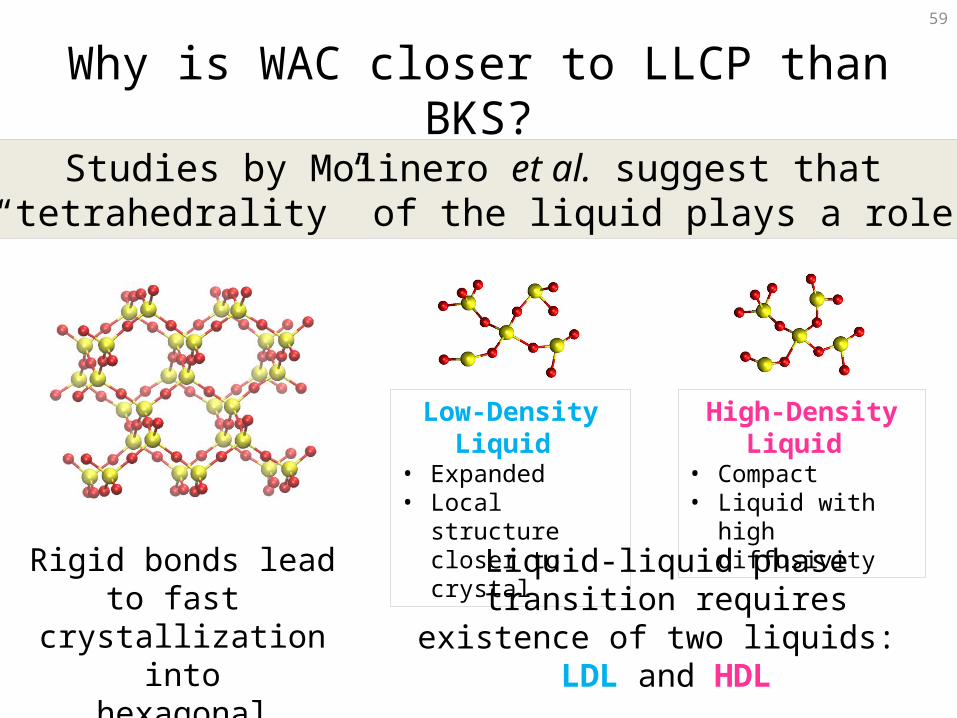
Why is WAC closer to LLCP than BKS?Studies by Molinero et al. suggest that
“tetrahedrality” of the liquid plays a role
Rigid bonds lead to fast crystallization intohexagonal crystal
High-Density Liquid • Compact• Liquid with
high diffusivity
Liquid-liquid phase transition requires existence of two liquids: LDL and HDL
Low-Density Liquid • Expanded• Local structure
closer to crystal
60
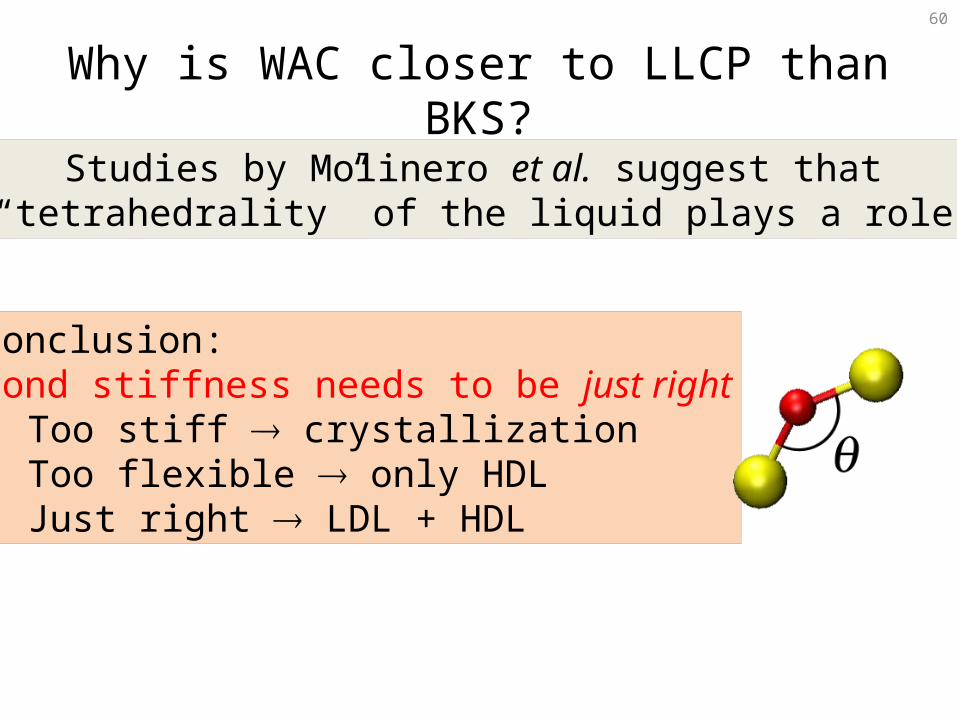
Why is WAC closer to LLCP than BKS?Studies by Molinero et al. suggest that
“tetrahedrality” of the liquid plays a role
Conclusion:bond stiffness needs to be just right• Too stiff crystallization• Too flexible only HDL• Just right LDL + HDL

61
Si-O-Si bond angle distributionDistribution WAC is sharper: stiff Distribution BKS more broad: floppy
Hard to compare: bond angle depends on temperature!
details
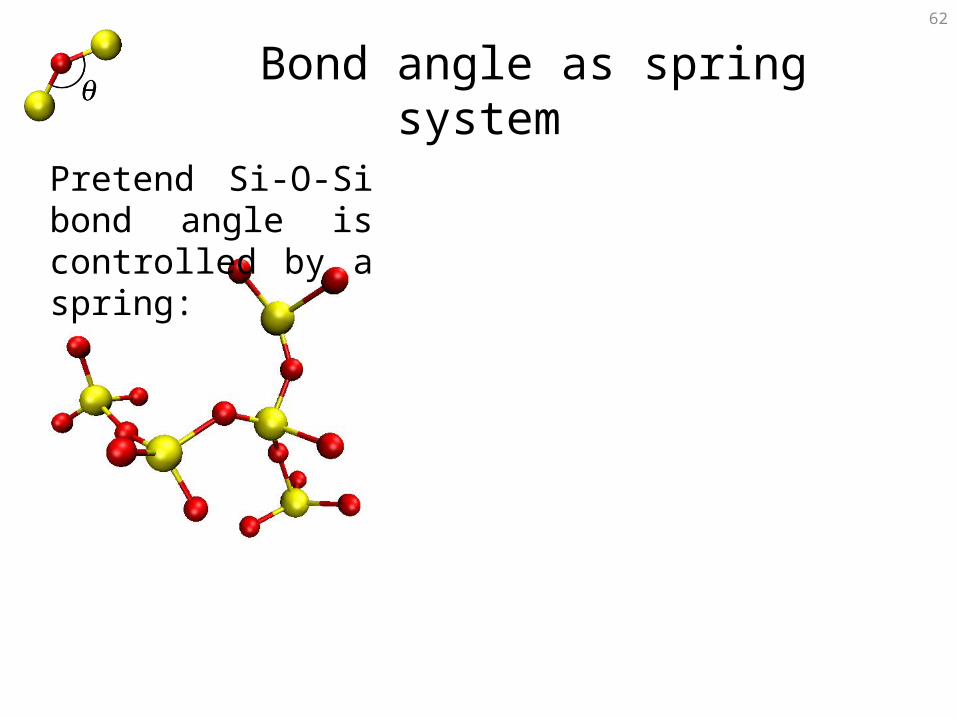
62
Bond angle as spring systemPretend Si-O-Si bond angle is controlled by a spring:
63
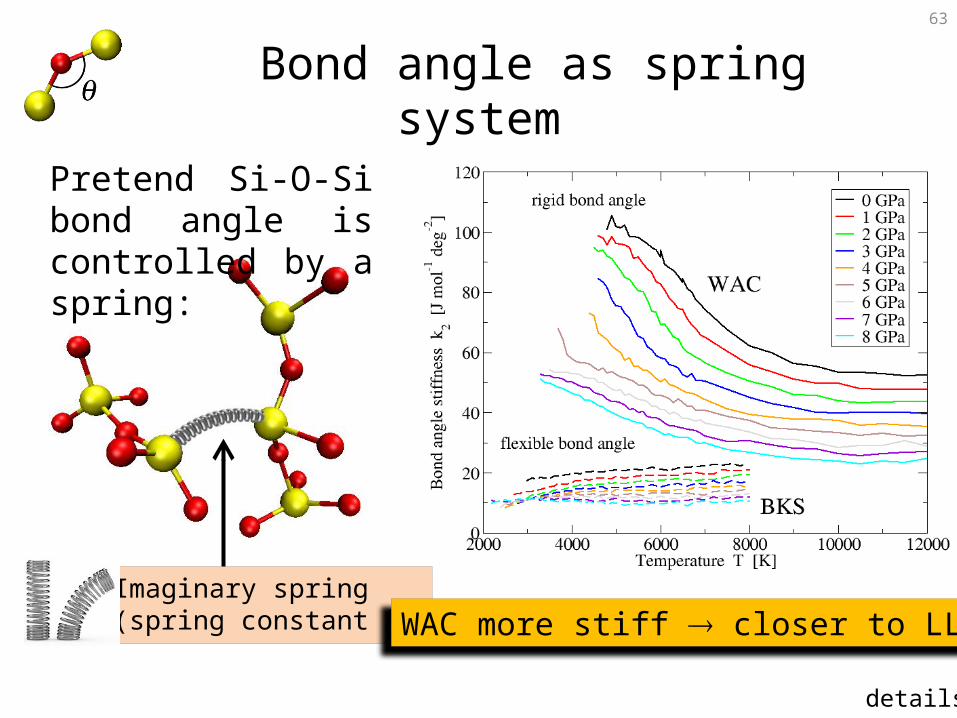
Pretend Si-O-Si bond angle is controlled by a spring:
Imaginary spring(spring constant k2) WAC more stiff closer to LLCP
details
Bond angle as spring system
64
Outline
• Anomalies in water and simple models
• Liquid-liquid phase transition in water
• Liquid-liquid phase transition in silica
• Conclusions
65
Conclusions (1)
• Simple models explain origin of anomalies:
– Two length scales• Low density structure (expanded)• High density structure (collapsed)
– Region with anomalies is where these structures energetically compete
66
Conclusions (2)
• Best way to locate liquid-liquid critical point (LLCP)is by fitting order parameter to 3D Ising
• We did not find LLCP in silica models WAC, BKS
• Liquid-liquid phase transitions might berelated to bond angle stiffness– Modeling liquid as network of springs might help
predicting if liquid has a LLCP
67
Also a big THANKS to my collaborators:– Gene Stanley (advisor)– Sergey Buldyrev– Austen Angell– Mahin Hemmati– Giancarlo Franzese– Tobias Kesselring– Hans Herrmann– Gianpietro Malescio
THANK YOU!
Liquid-Liquid Phase Transitions and Water-Like Anomalies in Liquids


