Page 1
International Journal of Economics, Commerce and Management United Kingdom Vol. III, Issue 1, Jan 2015
Licensed under Creative Common Page 1
http://ijecm.co.uk/ ISSN 2348 0386
LIQUIDITY MANAGEMENT AND PROFITABILITY ANALYSIS
OF PRIVATE COMMERCIAL BANKS IN BANGLADESH
Bijoy Chandra Das
Department of Finance & Banking, JatiyaKabiKaziNazrul Islam University, Mymensingh, Bangladesh
[email protected]
Md. Masud Chowdhury
Department of Finance & Banking, JatiyaKabiKaziNazrul Islam University, Mymensingh, Bangladesh
[email protected]
Md. Habibur Rahman
Department of Finance & Banking, JatiyaKabiKaziNazrul Islam University, Mymensingh, Bangladesh
[email protected]
Nirmal Kumar Dey
Department of Accounting & Information Systems, Jagannath University, Dhaka, Bangladesh
[email protected]
Abstract
This study aims to embody the liquidity management scenario of private commercial banks in
Bangladesh along with profitability analysis. Firstly some private commercial banks were
selected and divided them into three generations based on their establishment. Secondly
deposit, advance, profit, AD ratio & profit growth were considered as parameters to calculate
several techniques to analysis the liquidity and profitability. Finally this paper also represents the
regulatory issues, statistical analysis and the liquidity surplus or deficit scenario of the banks.
The study concluded that proper liquidity management can increase the profitability of the
Banks if other factors move positively. This research is conducted by considering the banking
condition of Bangladesh and it proves that excess liquidity reduces the profitability. Finally this
study indicates that how proper liquidity management helps to increase the banks’ profitability.
Keywords: Liquidity, profitability, liquid asset, cushion, credit
Page 2
© Bijoy, Md. Masud, Md. Habibur & Nirmal
Licensed under Creative Common Page 2
INTRODUCTION
Liquidity means how quickly an asset can be converted into cash or the marketability (capability
to convert an asset to cash very easily) of the assets to meet the short term financial
obligations. There are two types of assets such as liquid & illiquid. Firstly, liquid assets which
can be converted into cash very quickly in the market. Secondly, assets that cannot be
converted into cash very easily are known as illiquid. Liquid asset is much safer for the investors
than illiquid assets because it is much easier for the investors to obtain the money from the
investment. Commercial Banks maintain their liquidity position through their treasury division by
interbank transactions (borrowing and lending) with other financial entities. At the interbank
transaction, Banks usually conduct the call money transactions, Repo (Repurchase Agreement),
reverse Repo, buy or sell the money market securities.
Profitability refers to the net income of the company (Bank) where company’s revenues
exceed its expenses. Income is generated from the activities of the companies (Banks) and
expense is the cost of resources which are used to generate profit. Profitability is the main
objective of the companies. Businesses cannot survive in the market for the long run without
profitability. So evaluating past profitability, calculating current profitability and foretelling future
profitability is very important for the company. Revenue and expense are shown at the income
statement which refers to the profitability of the company while cash inflow & cash outflow are
shown at cash flow statement which refers to the liquidity of the company.
It has negative or inverse relationship between liquidity and profitability because huge
liquidity position decreases the profitability of the bank and vice-versa. But in some cases,
liquidity problem can create a panic to the depositor and banks can fall under trouble of
repayment of deposited money. It is a great example of banking liquidity crisis in 2007 at the
USA market. At the liquidity shortfall banks cannot increase the advance position to increase the
profitability. So that banks try to manage the liquidity position very efficiently. To increase the
profitability banks go to the risky investment because there is a positive relationship
between higher risk and higher return. On the other hand, higher risk endangers the liquidity of
the banks. When interest rate is lower, the liquidity position of any bank is higher and higher
liquidity position indicates the availability of capital base. Liquidity surplus can be occurred if
there is huge money at hand with too few investments in real sectors. As a result of economic
depression fund usually is invested in bad ventures and bad ventures cannot repay the money
of the banks because they do not do well in the business and banks suffer from liquidity position
at hand for further investment or repayment of the depositors’ money.
Generally banks lend mostly at illiquid assets which cannot be converted in cash very
easily but banks encourage collecting fund at short term basis which fund is cost free (current
Page 3
International Journal of Economics, Commerce and Management, United Kingdom
Licensed under Creative Common Page 3
account) or lower cost bearing (savings account or special notice account).Ensuring own
liquidity position under all conditions is the main dispute to the banks. Now a day, most of the
banks try to increase their efficiency for managing asset and liability of the banks, shortly said
liquidity position. So they go to the large investment at securities and advances which can be
securitized to recover borrowed funds. In 2013, political factor was fully liable for non-robust
investment at real sector. So business houses discouraged to increase their existing investment
and go to the new investment. Banks could not increase their advance position at that critical
time of investment and they suffered from huge liquidity problem which decreased the
profitability of the banks because we know that liquidity and profitability are inversely related. At
that time projected private sector’s credit growth rate was 16.50% which mentioned at the first
half yearly monetary policy of 2013-14. Unfortunately real private sector credit growth was
11.10%. So it is easily affirmed that Banks & other financial institutions have excess liquidity
which reduced the profitability.
Objectives of the Paper
There are several objectives of preparing this paper which are shown below:
To explore advance, deposit & profit of several commercial banks (generation based) of
our country.
To analyze the numerical data of the selected banks by using some ratios and statistical
measures.
Recap of this study unifies as follows. Second part of this study reviews the literature, part three
discusses the methodology of the study, part four shows the whole discussion and finally part
five concludes the research.
LITERATURE REVIEW
There are several research works on liquidity and profitability management of the commercial
banks internationally. Many studies have shown that liquidity problem decreases the profitability.
Other studies explain that available liquidity increases the profitability. At the literature review I
will deliver the most important and appropriate theories of the several researchers where
different researchers provide different explanations about this topic. Some of these researchers
try to define liquidity only or profitability and some try to create the relationship between liquidity
& profitability or differentiation between them.
According to Archer and D’Ambrosio, “liquidity means cash and cash availability, and
it is from current operations and previous accumulations that cash is available, to take care of
the claims of both the short-term suppliers of capital and the long-term ones”.
Page 4
© Bijoy, Md. Masud, Md. Habibur & Nirmal
Licensed under Creative Common Page 4
Shim and Siegel (2000, pp.46-47) told that accounting liquidity is the company’s capacity to
liquidate maturing short-term debt (within one year). Maintaining adequate liquidity is much
more than a corporate goal. It is a condition for the company that without which it could not be
reached the continuity of the business. Solvency and liquidity are two concepts that are closely
related and reflect upon the actions of company’s working capital policy. A low liquidity level
may lead to increase the financial costs and result in the incapacity to pay its obligations.
Another research was conducted by Chandra in 2001, normally a high liquidity is seen
as a sign of financial strength. However, some authors like AssafNeto believe that a high
liquidity can be as undesirable as a low one. This would be a consequence of the fact that
current assets are usually less profitable than fixed one. Money invested in assets generates
less revenue than fixed assets, thus representing an opportunity cost.
According to AssafNeto (2003, p.22), the greater the amount of funds invested in current
assets, the lower the profitability, and by the same time the less risky is the working capital
strategy. In this situation, the returns are lower in the case of a greater financial slack, in
comparison to a less liquid working capital structure. Conversely, a smaller amount of net
working capital, while sacrificing the safety margin of the company, by raising its insolvency’s
risk, positively contributes to the achievement of larger return rates, since it restricts the volume
of funds tied up in assets of lower profitability. This risk-return ratio behaves in a way that no
change in liquidity occurs without the consequence of an opposite move in profitability.
However, Hirigoyen (1985) argues that mid-term and long-term relationship between
liquidity and profitability could be positive, meaning that low liquidity would lead to lower
profitability due to a greater need for loans and low profitability would not generate sufficient
cash flow, thus forming a vicious circle. A company with low liquidity and high profitability will
have to increase its lending, resulting to increased financial costs. This would certainly lead to
increasing interest rates, given that resources cheap are depleting rapidly. In addition, enlarging
the level of the debt, company’s credit risk increases, causing increasing interest rates charged
by their financiers. Under these conditions, the company must plan to obtain from suppliers
more time, resulting in the acquisition of more expensive materials. Also, the enterprise will not
be able to enjoy discounts offered by anticipating financial payments instead bear interest and
late payment penalties for various bills, taxes and others. After all this process liquidity problems
might get bigger. Moreover, a firm that has low profitability and high liquidity does not generate
sufficient resources to finance expansion of its working capital needs, acquiring new assets,
overdue loans, etc. And finally the liquidity turns out to become lower. Thus Hirigoyen,
profitability and solvency are a necessary condition for the existence of a healthy company and
both of them are the subject to the strategy adopted in the medium and long term.
Page 5
International Journal of Economics, Commerce and Management, United Kingdom
Licensed under Creative Common Page 5
Concepts and definition
Liquid Assets of a Bank
Liquid asset is one kind of asset which can be converted into cash very hurriedly and which has
negligible impact to the price. Liquid assets are generally regarded in the same light as
cash because their prices are relatively stable when they are sold on the open market. For an
asset to be liquid it needs an established market with enough participants to absorb the selling
without materially impacting the price of the asset. There also needs to be a relative ease in
the transfer of the ownership and the movement of the asset. Liquid assets include most
stocks, money market instruments and government bonds. The foreign exchange market is
deemed to be the most liquid market in the world because trillions of dollars exchange hands
each day, making it impossible for any one individual to influence the exchange rate. Cash and
other financial assets that banks possess that can easily be liquidated and paid out as part
of operational cash flows. Examples of core liquidity assets would be cash, government bonds
and money market funds. Banks typically use forecasts to anticipate the amount of
cash that account holders will need to withdraw, but it is important that banks do not over-
estimate the amount of cash and cash equivalents required for core liquidity because unused
cash left in core liquidity cannot be used by the bank to earn increased returns.
Cash in hand: Amount of money of a bank, which stay in hand of that bank to meet
recent needs. Generally, bank keeps enough money in hand. As a result liquidity risk is
minimized.
Items in the process of collection: Some amount of money which keeps in the process
of making cash.
Figure 1 Liquid Assets of a Bank
Cash in hand
Items in the process of collection
Reserve in Bangladesh Bank
Balance with other banks
Page 6
© Bijoy, Md. Masud, Md. Habibur & Nirmal
Licensed under Creative Common Page 6
Reserve in Bangladesh Bank: Every schedule bank has reserve requirement where
every bank keeps 5% money on his total capital to the Bangladesh Bank. If a bank
needs of money, he can withdraw money from Bangladesh Bank’s reserve amount.
Balance with other banks: Every commercial bank has an account in other commercial
banks such as customer. If a bank needs of money, he can withdraw money from his
account. As a result liquidity risk is minimized.
Distinctiveness of Liquid Assets
There are three characteristics involved in the liquid assets which are ready market, stable price
and reversible.
Figure 2 Characteristics of Liquid Assets
a) Ready Market: It is one kind of market where liquid assets can be sold or converted in cash
without delay.
b) Stable Market: Liquid asset must have a reasonable stable price so that no matter how
quickly the asset must be sold or how large the sale is the market is deep enough to absorb the
sale without a significant decline in price.
c) Reversible: The seller can recover the original investment amount with little risk of loss.
Liquidity Cushion
A bank maintains reserve fund by holding money market instruments and highly liquid
investments in other sectors. By retaining cash reserves in money market instruments, urgent
demands of the customers on cash can be fulfilled by immediately sale of these securities.
Ready market
Stable priceReversible
Page 7
International Journal of Economics, Commerce and Management, United Kingdom
Licensed under Creative Common Page 7
Liquidity crisis
Liquidity crisis means negative financial situation of the banks or lack of cash flow of the banks.
Liquidity crisis arises when a solvent bank does not have enough liquid assets (i.e. cash or
easily cash convertible assets) at hand for meeting its urgent short-term financial obligations
such as repaying deposit amount, repaying loan amount, paying bills and paying stakeholders.
A bank is announced bankruptcy when it does not solve the problem of liquidity. An insolvent
bank can also have liquidity crisis but it can be mitigated by taking urgent effective actions which
will not prevent its business ultimate bankruptcy. Liquidity crisis of the whole economy creates
by reducing the number of lending in the economy or impede making loans altogether and on
the other hand some companies do not meet their financial obligations because of availability of
fund at hand.
Liquidity management& open market operation
Banks have to be required to keep a certain portion of their assets in the form of relatively
riskless instruments which is made for the monetary control purposes. Every bank has to
maintain the level of minimum reserve requirement with central bank and central bank holds the
right to change this requirement. It affects directly on the level of liquidity and the price of
shortterm funds of the banks. Minimum reserve requirement is one of the tools of open market
operations of the central bank by which the level of liquidity of the banks is manipulated by
buying and selling of the shortterm instruments. When the buying of treasury bills & treasury
bonds is increased, the yields of these securities will fall and relatively other securities will be
attractive.
Figure 3 Open Market Operations
Central Bank
Purchases Securities
Bank Reserve Increase
Available Loanable Funds Increase
Interest Rates Decline
Central Bank
Sells Securities
Bank Reserve Decrease
Available Loanable Funds Decrease
Interest Rates Increase
Page 8
© Bijoy, Md. Masud, Md. Habibur & Nirmal
Licensed under Creative Common Page 8
Fig.4 shows the process of open market operations of the central bank. Securities purchased
and securities sold are the two processes of open market of operations. When central bank
purchases securities from the market, the reserve requirement of the banks is increased. So the
loanable fund in the market is also increased and the credit facilities are decreased. As a result
the rate of interest will be decreased drastically. On the other hand, when central bank sells
securities to the market, the reserve requirement of the banks is decreased and then the
loanable fund of the banks is also decreased. So the rate of interest in the market will be
increased rapidly with the reducing of loanable fund in the market.
Types of Liquidity
There are several types of liquidity in banking sectors which are immediate liquidity, short-term
liquidity, long-term liquidity, contingent liquidity, economic cyclical liquidity.
Figure 4 Types of Liquidity
Immediate liquidity: When cash money is needed to pay in cheques to demandable
customers, it is called immediate liquidity.
Short-term liquidity: Short-term liquidity is used to meet the monthly liquidity requirements.
Based on the types of clients and on the seasonal variability, the necessity of these types of
liquidity can vary.
Long-term liquidity: Long-term liquidity is required to meet the cash demand for replacement
of fixed assets, retirement of the redeemable preferred shares or debentures and to acquire
new fixed assets and technical know-how.
Immediate liquidity
Short-term liquidity
Long-term liquidity
Economic cyclical liquidity
Contingent liquidity
Page 9
International Journal of Economics, Commerce and Management, United Kingdom
Licensed under Creative Common Page 9
Contingent liquidity: It arises depending on the happening of some unexpected events. It is
difficult to guess this unexpected situation but not impossible though the amount cannot be
exactly predicted. Contingent liquidity is also required to face the adverse situations created
by big bank robbery, fraud, arson or other accidents.
Economic cyclical liquidity: Based on good or bad economic situation, the supply of bank
deposit and the demand for loan varies. Due to this variation, the liquidity demand also
varies. But it is very difficult to identify the extent of such variation. Generally, difficult
national and international events such as political instability, war, the pressure created by
the different interest groups relating to the banking activities are the causes of economic
cyclical liquidity needs.
The demand and supply of liquidity
Every commercial bank needs enough liquid assets to meet the immediate financial needs of
the customers and bank collects funds to fulfill the demand of the customer. There are two types
of sources to squash the demand of spendable funds of the banks and sources are withdrawal
deposited money from the account and credit requests from the customers which may be in the
form of new loan request, renewals of expiring loan agreement or drawing upon existing credit
facilities. Other sources of liquidity demand include paying off previous borrowings such as
loans the bank may have received from other banks or from the central bank. Similarly payment
of income taxes or cash dividend to the shareholders rises to the demand for spendable fund.
The most important source for a bank is receipt of new customer deposits, both from newly
opened accounts and from new deposits placed in existing accounts. Another important
component in the supply of liquidity for the banks comes from customers repaying their loans
which provide fresh funds to meet new liquidity needs of the banks. On the other hand, bank
can generate funds from selling marketable securities such as treasury bills & treasury bonds,
from the investment portfolio. Banks can increase the flow of liquidity in from of revenues
generated by selling non deposit services and from borrowing from the money market through
treasury division.
Liquidity Risk
Liquidity risk occurs in the bank when the financial obligations of the customers are not fulfilled
within the required time period or inability to meet its obligations when they come due without
incurring unacceptable losses. Liquidity risk also arises from the failure to identify the changes
of the market conditions that affect the ability to liquidate the assets quickly and with least loss
in value. There are several sources to arise the liquidity risk if the banks which are identified
Page 10
© Bijoy, Md. Masud, Md. Habibur & Nirmal
Licensed under Creative Common Page 10
below: Unexpected change in cost of capital, abnormal behavior of financial markets, risk
arises from the secondary sources, macroeconomic imbalances.
Regulatory issues: Central Bank’s Liquidity Management
Liquidity management of the central bank is defined as the scaffold of the bank reserves
requirement in order to control the price especially short term interest rates for stability the price
level of the economy. Central Bank is the lender of last resort for the commercial banks as well
as the government of the country. All scheduled banks are required to maintain a minimum
reserve as cash form with the central bank (Bangladesh Bank) which is called Cash Reserve
Requirement (CRR) and reserve maintained as government securities such as treasury bills and
treasury bonds which is Statutory Liquidity Reserve (SLR). Every schedule bank of our country
has to maintain Cash Reserve Ratio (CRR) and Statutory Liquidity Reserve (SLR) on Total
Deposit amount of the bank with central bank. Now CRR is 6.50% for Conventional Banks and
Islamic Banks but SLR is 13.00% for Conventional Banks and 5.50% for Islamic Banks which
was 19.00% & 11.50% accordingly before. SLR requirement was changed by Bangladesh
Bank’s DOS Circular No.-01, dated 19/01/2014 and the effective date was 1st February, 2014.
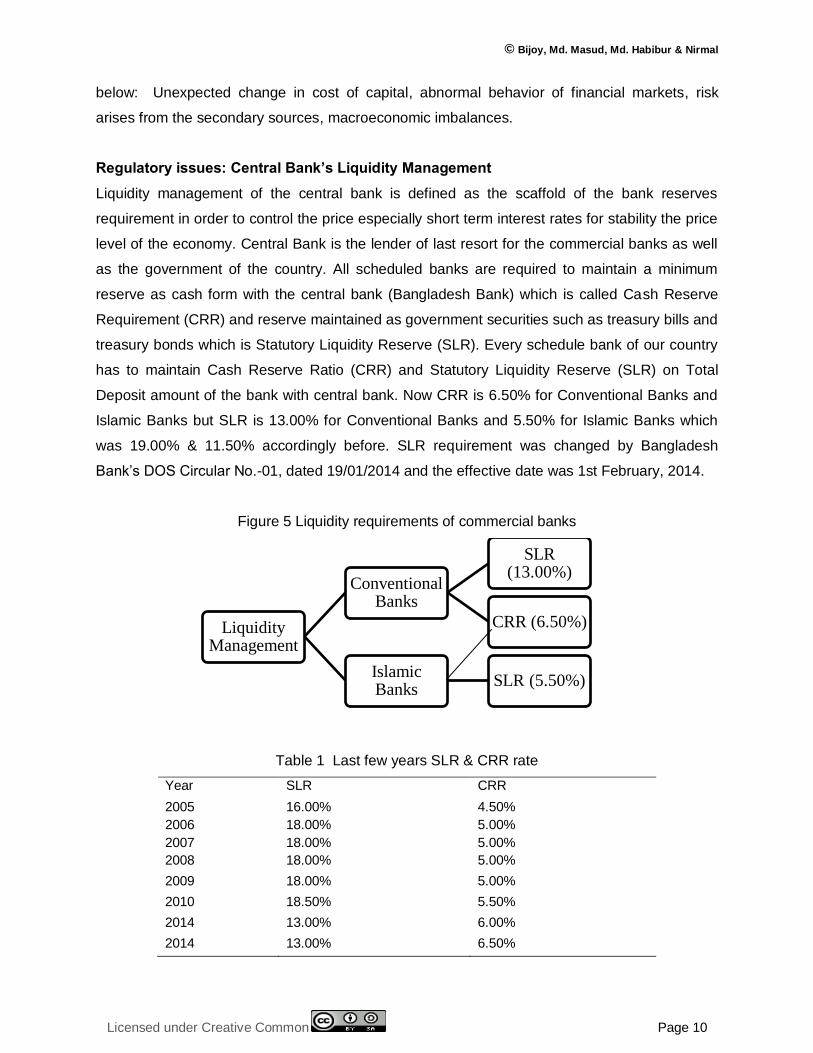
Figure 5 Liquidity requirements of commercial banks
Table 1 Last few years SLR & CRR rate
Year SLR CRR
2005 16.00% 4.50%
2006 18.00% 5.00%
2007 18.00% 5.00%
2008 18.00% 5.00%
2009 18.00% 5.00%
2010 18.50% 5.50%
2014 13.00% 6.00%
2014 13.00% 6.50%
Liquidity Management
Conventional Banks
SLR (13.00%)
CRR (6.50%)
Islamic Banks
SLR (5.50%)
Page 11
International Journal of Economics, Commerce and Management, United Kingdom
Licensed under Creative Common Page 11
Table 1 shows SLR and CRR level from 2005 to 2014. In 2005, SLR was 16.00% which was
lower than 2006-2009 but in 2010 it was 18.50% which was the highest. In 2014, SLR
requirement is reduced to 13.00%. Actually central bank separates the theme of SLR and CRR.
Before that CRR was included with SLR amount but after 2014 CRR and SLR are calculated
separately. On the other hand, the level of CRR was almost stable over the year although it was
4.50% in 2005, after that it was increased to 5.00% and lastly it is amended to 6.50%. At
present, SLR requirement is 13.00% and CRR is 6.50%.
After 2012 our economy suffered from huge liquidity problem because private and public
credit growth was declined level. At that time the political situation of the country was fully unrest
and economy faced a critical path with minimum level of investment in real sector. On the other
hand government failed to take positive action to increase the real sector investment. So central
bank decided to separate SLR and CRR requirements. In this process, bank has to maintain
SLR in the form of cash, foreign exchange reserve, and government securities. CRR is
maintained at cash form with Bangladesh Bank. Any bank can maintain whole 13.00%
(Conventional Banks) of SLR requirement by purchasing Treasury bills and Treasury bonds.
METHODOLOGY
Methodology refers to the indispensible part of the study and practices of collecting information
and arranging it in terms of the relevant issues of the study. I have collected data from several
sources such as primary source and secondary source. Primary data was collected from the
officials of the selected banks through face to face and telephonic conversation. Data are
collected from observing the financial statements from 2011 to 2013 of the selected banks. I try
to identify all the elements of the liquidity as well as profitability and prepare this paper.
Data
Deposit, advance & profit position, Advance Deposit Ratio (AD Ratio), number of branches of
these banks are considered to conduct this study. Three fiscal years such as 2011, 2012, 2013
are considered for deposit, advance & profit position, Advance Deposit Ratio and 2012, 2013
are considered for number of branches.
All the amount of deposit, advance, and profit are totally consolidated. Depend on this
information I have tried to compare among three generation banks’ liquidity and profitability
position by considering other factors such as AD ratio, changes the number of branches.
Tabular method, graph analysis, ratio analysis and statistical technique have been used at this
research work where required.
Page 12
© Bijoy, Md. Masud, Md. Habibur & Nirmal
Licensed under Creative Common Page 12
Figure 6 List of selected private commercial banks
EMPIRICAL STUDY
Theoretical analysis
Bangladeshi banking system is denominated by the commercial banks although there are some
specialized banks, finance companies, leasing companies as well as insurance companies.
Among all these banks, some are listed with Bangladesh Bank (central bank) and few are not
listed. Bangladesh Bank is the chief regulatory authority of the banking sector. Other than
central bank, there are 4 State Owned Commercial Banks, 5 specialized banks, 39 Private
Commercial Banks, 9 Foreign Commercial Banks. There are some non-listed finance
institutions such as Grameen Bank, Samabai Bank, Ansar-VDP Bank, and Karmasansthan
Bank. After 1971, State Bank of Pakistan was renamed Bangladesh Bank and started its
journey as the Central Bank of Bangladesh. At that time there were only 14 local commercial
banks and 3 foreign banks in our country. All banks were nationalized rather than foreign banks.
Main revolution at the banking sector in our country was occurred after 1981s when central
bank gave the licenses to private banks. After that private sector banking business flourished
slowly yet second generation banks had started their business. Although banking business was
grown rapidly after 1995 when second and third generation banks started their journey. At
present, the financial institutions in Bangladesh under the banking system are:
Bangladesh Bank (Central Bank)
Commercial Banks (Conventional Banks)
Islamic Shariah based commercial Banks
•Pubali Bank Limited
•United Commercial Bank Limited (UCBL)
•National Bank Limited
•The City Bank Limited
•International Finance Investment & Commerce
Bank Limited(IFIC)
First Generation Banks
•Prime Bank Limited
•Southeast Bank Limited
•Dutch Bangla Bank Limited
•Dhaka Bank Limited
•National Credit & Commerce Bank Limited
Second Generation Banks •Bank Ais Limited
•Mercantile Bank Limited
•BRAC Bank Limited
•Jamuna Bank Limited
•Trust Bank Limited
Third Generations Banks
Page 13
International Journal of Economics, Commerce and Management, United Kingdom
Licensed under Creative Common Page 13
Foreign Commercial Banks
Specialized Banks
Finance Companies
Insurance Companies
Leasing Companies
Non-schedule Banks
Company Background
Initially Pubali Bank Limited was started as Eastern Mercantile Bank Limited in the then East
Pakistan by some Bengali entrepreneurs in 1959. After the liberation war of Bangladesh this
Bank was nationalized as per the policy of the then Government and renamed as Pubali Bank.
In 1983, this Bank was denationalized as private bank and changed as Pubali Bank Limited.
Now it has 427 branches all over the nation and it is one of the largest commercial banks of our
country.
In 1983, United Commercial Bank Limited (UCBL) emerged its banking business as
private commercial bank for the purpose of developing our economic and after that it has been
able to establish itself as one of the best banks in Bangladesh. It has 139 branches through the
country. This bank is committed to provide customized & innovative product and service by
efficient Management. From the begging of the establishment this bank has been participating
in the development of trade, commerce and industry of our country by investing in network
expansion and new technology adoption to have competitive advantage.
National Bank Limited (NBL) was incorporated in 1983 as first private sector bank in
Bangladesh. It is one of the largest private sectors Bank with glorious financial performance.
Now there are 175 branches under this bank’s network and all branches are automated with
computer network. From the very beginning, NBL has been playing a vital role in the
development of the national economy. NBL was the first domestic bank in Bangladesh which
established agency arrangements with Western Union to facilitate the expatriate Bangladeshi
nationals for sending safe remittance and it was also the first domestic bank to host international
Master Card in our country.
The City Bank Limited is one of the oldest and largest banks in Bangladesh which was
established in 1983. It has five divergent units such as business unit, branch unit, risk unit,
operation unit and support to provide the all kinds of services to the customers. There are 94
online branches, 1 SME service centers and 11 SME/Agribranchs all over the country. Rather
than traditional banking the bank has more than 200 ATMs and more than 1000 sharing ATMs
to facilitate the customers to withdraw money, show balance and others urgent services.
Page 14
© Bijoy, Md. Masud, Md. Habibur & Nirmal
Licensed under Creative Common Page 14
International Finance Investment and Commerce Bank Limited (IFIC Bank) was incorporated in
1976 as a joint venture between the Government of Bangladesh and private sector’s sponsors
with the objective of working as a finance company within the country and setting up joint
venture banks/financial institutions aboard. It was converted to private commercial bank in 1983.
At present, the Government of Bangladesh holds 32.75% of total share capital of this bank,
11.31% is held by the directors and sponsors and the rest is held by the general public.
Prime Bank Limited was started its activities in 1995 by reputed personalities of
Bangladesh. It offers all sorts of corporate and personal banking services which covers all the
rules & regulations of Banking Company Act. Different types of products and services including
corporate banking, retail banking right from industry to agriculture and real state to software are
offered by this bank.
Southeast Bank Limited was launched in 1995 with a dream and a vision to become a
forerunner banking institution of the country and contribute significantly to the development of
our country’s economy. This bank is operated by efficient management team. They always
encourage the employees to work together for achieving the ultimate goal of the bank. There is
a commitment to the customer to provide quality and excellence service which is the trademark
of their identity
Dutch-Bangla Bank Limited (DBBL) was started its operation in Bangladesh as joint
venture basis. From the very begging of establishment this bank focuses on financing high-
growth manufacturing industries in Bangladesh. DBBL is one of the largest donors of Corporate
Social Responsibility (CSR) in Bangladesh. It is the first bank in Bangladesh which is fully
automated. This bank has the largest ATM network in Bangladesh. Consumer feels confidence
on this bank because of technological advancement and larger donation on several social
activities.
Dhaka Bank Limited was established in 1995 as public limited company. This bank has
78 Branches including 2 Islamic Banking Branches, 3 SME Service Centers, 1 Offshore Banking
Unit, 1 Kiosk along with 6 Branches under Dhaka Bank Securities Limited across the
country. The Bank offers the full range of banking and investment services for personal and
corporate customers by backing innovative technology. Excellence in Banking is their
commitment to the customers. At present, this bank offers the full range of online banking
services.
National Credit and Commerce Bank Limited was started its journey in 1985 as an
investment company. The main objective of the company was to assemble resources from
within and invest them in such a way for the development of the industry and play a vital role in
the formation of capital market of this country. This bank was converted into a private
Page 15
International Journal of Economics, Commerce and Management, United Kingdom
Licensed under Creative Common Page 15
commercial Bank in 1993 to serve the people of the nation from a bigger platform. Its various
deposit & credit products have designed for both corporate and individuals who feel coziness in
doing business with this Bank.
Bank Asia Limited was started its services with a vision to serve the people with modern
and innovative banking products and services at affordable charge. Being parallel to the cutting
edge technology the Bank is offering online banking with added delivery channels like ATM,
Tele-banking, SMS and Net Banking and as part of the bank's commitment to provide all
modern and value added banking services in keeping with the very best standard in a globalize
world. Bank Asia has been actively participating in the local money market as well as foreign
currency market without exposing the Bank to vulnerable positions.
Mercantile Bank Limited was incorporated in 2000 as a new commercial bank to provide
efficient banking products & services to the clients and for contributing to the socio-economic
development of the country. This Bank provides a broader range of financial services to its retail
customers and corporate clients.
BRAC Bank Limited is a scheduled commercial bank in Bangladesh which was
established as private commercial bank in 1999 under the Banking Companies Act, 1991 but it
started its activities in 2001 because it faced some legal obligation of high court of Bangladesh.
The main objective of this bank is to provide all sorts of banking products and services and
contribute to the development of Bangladesh. BRAC Bank aims to set standard as the market
leader in Bangladesh by providing efficient, friendly and modern fully automated online service
on a profitable basis. Within this short period of time it has created a unique image in the mind
of the people by contributing in the development of the country.
Jamuna Bank Limited (JBL) is a Banking Company which was registered under the
Banking Company Act, 1991 of Bangladesh and started its operation in 2001. The Bank
provides all kinds of support to trade, commerce, industry and overall business of the country
and contributes to the development of the nation. At present the Bank has real-time online
banking branches across the country by modern and innovative IT support. Besides traditional
delivery points, the bank has ATMs of its own, sharing with other partner banks and consortium
throughout the country.
Trust Bank Limited is one of the leading private commercial banks in our country. It was
established in 2000 as public limited company. The bank has 83 branches, 7 SME centers, 134
ATM Booths and 65 POS in 55 Branches throughout the country. The bank was sponsored by
the Army Welfare Trust (AWT). There are several modern corporate and consumer financial
products and services offered to the clients. Customers can now deposit or withdraw money
Page 16
© Bijoy, Md. Masud, Md. Habibur & Nirmal
Licensed under Creative Common Page 16
from any Branch of Trust Bank nationwide without needing to open multiple accounts in multiple
Branches.
Data Analysis
The banking sector of Bangladesh can be classified in four generations. First generation banks
were started their businesses between1982 to 1990, second generation banks were
incorporated between 1991 to 2000, third generation banks were licensed in the period of 2001
to 2010 and forth generation banks were started businesses after 2013. First generation,
second generation and third generation banks are considered to conduct this study. Firstly I
present all the information in a table and finally graphical presentation is conducted based on
this information.
Table 2 Deposit, advance & profit position of the banks (generation basis)
Generations
(Banks)
Deposit Advance Profit
2013 2012 2011 2013 2012 2011 2013 2012 2011
First 73979 63363 55002 65825 57595 47487 3013 2941 2967
Second 73697 66320 54675 58366 54982 47770 2905 2767 2831
Third 60596 51541 43987 45549 39905 36984 2118 1910 1859
(BDT in crore)
Table 2 shows the yearly position of total deposit, advance, and profit of the selected banks.
First column shows the generation basis banks’ names, second column shows the deposit
position of the banks over the three years, third column is for the advance position of the banks
and last column represents the profit position of the banks. We see that the deposit & advance
position show increasing trend over the year but profit position is not same. Above all
information is shown at several graphs:
Figure 7 Deposit position of the Banks Figure 8 Advance position of the Banks
0
20000
40000
60000
80000
2013 2012 2011
First
Second
Third0
20000
40000
60000
80000
2013 2012 2011
First
Second
Third
Page 17
International Journal of Economics, Commerce and Management, United Kingdom
Licensed under Creative Common Page 17
Figure 9 Profit position of the Banks
Figure 7 shows the deposit position of three generation banks. If we see the situation of first
generation banks, we can easily imagine that the deposit position is increasing over the year
and second, third generation banks’ deposit illustrates the same trend. First generation banks’
deposit position is highest compared to the other generation banks over the years. Fig.8 shows
the advance position of three generation banks. If we see the situation of the first generation
banks, we can easily imagine that the advance position is increasing over the year and second,
third generation banks’ advance illustrates the same trend. First generation banks’ advance
position is highest compared to the other generation banks over the years. Fig.9 shows the
profit position of three generation banks. If we see the situation of third generation banks, we
can easily imagine that the profit position is increasing over the year but first &second
generation banks’ profit is not same as third generation banks because profit position of first
&second is minimum in 2012.Third generation banks’ profit position is highest compared to the
other generation banks over the years.
Figure 10 Number of branches of the Banks
Figure 10 shows the number of branches of three generation banks. First generation banks
have highest numbers of branches and third generation banks have lowest number of branches.
So first generation banks earned highest profit over the years because there is a positive
relationship between numbers of branches with the profit position of the banks.
0
1000
2000
3000
4000
2013 2012 2011
First
Second
Third
0
200
400
600
800
1000
2013 2012
First
Second
Third
Page 18
© Bijoy, Md. Masud, Md. Habibur & Nirmal
Licensed under Creative Common Page 18
Ratio Analysis
Figure 11 illustrates AD ratio (generation based) of the banks where first generation banks’ AD
ratio is the highest among all. In 2013, first generation banks’ position is highest and third
generation banks’ position is the lowest. In 2012, first generation banks’ position is highest and
then second generation banks & third generation banks’. In 2011, third generation banks’ AD
ratio is minimum and second generation banks’ position is maximum. Overall analysis, it is
easily identified that first generation banks were very aggressive at lending business and these
banks broke the roles of central bank because banks cannot cross the limit of AD ratio which is
fixed at 85% on total deposit position of the banks. Compared other generation banks, third
generation banks were much more complied with the role of central bank. Fig.12 illustrates the
year based AD ratio of the banks. From this bar chart it is understood that banks were very
aggressive in 2011 because AD ratio at that time was 86% which is highest among three years.
In 2013, AD ratio position is lowest compared other years.
Figure 11 AD Ratio (generation based) of the Banks Figure 12 AD Ratio (year based) of the Banks
Figure 13. Liquidity gap
At liquidity gap analysis, deposit position of the banks is considered. At that time the liquidity
position was increasing very rapidly. So that it can be easily understood that banks carried huge
amount of money at hand and liquidity gap was increasing year to year.
0
0.2
0.4
0.6
0.8
1
2013 2012 2011
First
Second
Third0.75
0.80.85
0.9
2013 2012 2011
AD Ratio
AD Ratio
2013 2012 2011
Liquidity Gap 208272 181224 153664
0
50000
100000
150000
200000
250000
Page 19
International Journal of Economics, Commerce and Management, United Kingdom
Licensed under Creative Common Page 19
Estimating liquidity needs
Various kinds of experiments were made in estimating the quantum of liquidity for a particular
period. For that reason, bank fund managers estimate liquidity demand based on their past
experiences and knowledge. Among all these methods, the sources and uses of fund approach
is mostly used.
The sources and uses of fund approach
The more the deposits are, the more the liquidity will be. In other words, deposits will increase if
loans decrease. The less the deposits are, the less the liquidity will be. In the other words,
liquidity decreases with the increase in loans. The following table 3 shows the imaginary
sources and uses of fund: First generation banks
Table 3 The sources and uses of fund approach: First generation banks
(BDT in crore)
Period Deposit level Advance level Changes in
deposit
Changes in
Advance
Liquidity
surplus/deficit
2013 73979 65825 10161 8230 2386
2012 63363 57595 8361 10108 -1747
2011 55002 47487
Firstly in 2012, there was negative liquidity balance because first generation banks’ managers
were required to employ 2012 year’s balances in profitable investments. On the other hand,
banks suffered with huge liquidity position and they would manage the cheapest source to fulfill
the deficit liquidity in years 2013.
The following table 4 shows the imaginary sources and uses of fund: Second generation banks
Table 4 The sources and uses of fund approach: 2nd generation banks
(BDT in crore)
Period Deposit level Advance level Changes in
deposit
Changes in
Advance
Liquidity
surplus/deficit
2013 73697 58366 7377 3384 3993
2012 66320 54982 11645 7212 4433
2011 54675 47770
Secondly, there was positive liquidity balance in 2012 & 2013 and second generation banks
suffered with surplus liquidity position and they would manage the cheapest source to fulfill the
deficit liquidity over the years.
Page 20
© Bijoy, Md. Masud, Md. Habibur & Nirmal
Licensed under Creative Common Page 20
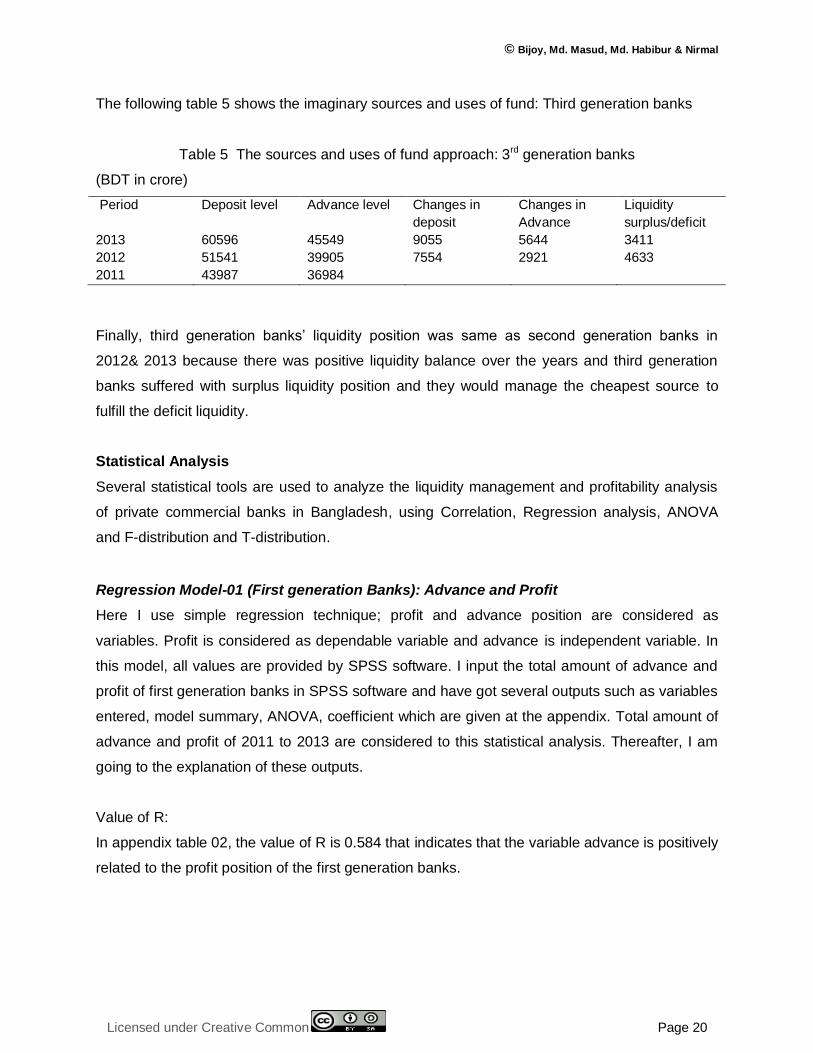
The following table 5 shows the imaginary sources and uses of fund: Third generation banks
Table 5 The sources and uses of fund approach: 3rd generation banks
(BDT in crore)
Period Deposit level Advance level Changes in
deposit
Changes in
Advance
Liquidity
surplus/deficit
2013 60596 45549 9055 5644 3411
2012 51541 39905 7554 2921 4633
2011 43987 36984
Finally, third generation banks’ liquidity position was same as second generation banks in
2012& 2013 because there was positive liquidity balance over the years and third generation
banks suffered with surplus liquidity position and they would manage the cheapest source to
fulfill the deficit liquidity.
Statistical Analysis
Several statistical tools are used to analyze the liquidity management and profitability analysis
of private commercial banks in Bangladesh, using Correlation, Regression analysis, ANOVA
and F-distribution and T-distribution.
Regression Model-01 (First generation Banks): Advance and Profit
Here I use simple regression technique; profit and advance position are considered as
variables. Profit is considered as dependable variable and advance is independent variable. In
this model, all values are provided by SPSS software. I input the total amount of advance and
profit of first generation banks in SPSS software and have got several outputs such as variables
entered, model summary, ANOVA, coefficient which are given at the appendix. Total amount of
advance and profit of 2011 to 2013 are considered to this statistical analysis. Thereafter, I am
going to the explanation of these outputs.
Value of R:
In appendix table 02, the value of R is 0.584 that indicates that the variable advance is positively
related to the profit position of the first generation banks.
Page 21
International Journal of Economics, Commerce and Management, United Kingdom
Licensed under Creative Common Page 21
Value of R square:
Here the value of R square comes 0.341 from table 02 in appendix, meaning that 34% changes
in profit is happening for the changes of the advance position. In addition, the least part (1-
0.341) = 0.659 is changed by other factors which are not considered.
Adjusted R square:
From the accepted data, the value of adjusted R square is -0.318 from table 02 in appendix. it
shows that how much dependent variable (profit) is changed for the changing of independent
variable (advance).
Standard Error of estimate:
Here the value is 41.85843 from table 02 in appendix that shows the amount of variability of
predicted result and the actual result acquired from the real observation.
Regression Sum of Square (SSR):
SSR value comes 906.538 from table 03 in appendix showing the extent to which we are able to
minimize the error through using the multiple regression tools.
Error Sum of Square (SSE):
Here Residual SSE value comes 1752.129 from table 03 in appendix showing the extent to
which error is remaining after the regression and can be minimized with the increment of the
profit (dependent variable).
Total Sum of Square (SST):
In this observation, the value is 2658.667 (table 03 in appendix) that comes after adding the
SSR 906.538 and SSE 1752.129.
Degrees of Freedom (df):
Here, SST has (n-1) degrees of freedom, SSR has p (number of independent variable) degrees
of freedom and SSE has (n-p-1) degrees of freedom. Hence, the mean square due to
regression (MSR) is SSR divided by p and the mean sum of square due to error (MSE) is SSE
divided by (n-p-1). Here, 1 is degrees of freedom for the numerator and 1 is degrees of freedom
for the denominator.
Page 22
© Bijoy, Md. Masud, Md. Habibur & Nirmal
Licensed under Creative Common Page 22
F-test:
If H0 is accepted, MSR provides an unbiased estimate of σ2, and the value of MSR or MSE
becomes larger. To determine how large values of MSR/MSE must be to reject H0, we make to
use of the fact that if H0 is true and the assumptions about the regression model are valid, the
sampling distribution of MSR/MSE is a F-distribution with p degrees of freedom in the numerator
and (n-p-1) in the denominator. The summary of F-test is given below:
F=MSR/MSE= 0.517 (table 03 in appendix)
With a level of significance α= 0.10, the tabulated value shows that one df in the numerator and
one df in the denominator, F = 1.844. With 0.517<1.844, we accept the null hypothesis and
alternative hypothesis is rejected. So there is no significant relationship exists between profit &
advance.
Moreover, the p-value (sig.) = 0.603 from table 03 in appendix also indicates that we can accept
H0 because the P-value is higher than α=0.05.
Regression analysis:
Regression analysis measures the nature of the relationship between dependent variable and
independent variable. It describes that the relationship is positive or negative between variables.
Regression equation: Ŷ = a + bX
Ŷ = 2841.617 + 0.002X (from table 04 in appendix)
The regression equation describes that there is positive relationship between profit and
advance.
Dependent variable (Ŷ): Profit
Independent variable (X): Advance
If advance = zero then Ŷ= 2841.617. Here, Ŷ= 2841.617 from table 04 in appendix, which is Ŷ,
intercept. It shows that profit of the banks will be 2841.617 if the banks will have no advance.
Now, the value of b or slope of X is 0.002, it means if the volume of advance increases by BDT
1 then the profit from advance of the banks will increase for BDT 0.002 assuming all other
variables are constant.
T-test:
The calculated value of t is 15.346 from table 04 in appendix and tabular value is 3.078 at 1 df
of area 0.01 which is less than calculated value of t. hence, the null hypothesis is rejected and
alternative hypothesis is accepted and concludes that there is a positive relationship between
profit and advance of the banks.
Page 23
International Journal of Economics, Commerce and Management, United Kingdom
Licensed under Creative Common Page 23
Regression Model-02 (Second generation Banks): Advance and Profit
Value of R:
In appendix table 06, the value of R is 0.352 that indicates that the variable advance is positively
related to the profit position of the first generation banks.
Value of R square:
Here the value of R square comes 0.124 from table 06 in appendix, meaning that 12.40%
changes in profit is happening for the changes of the advance position. In addition, the least part
(1-0.124) = 0.876 is changed by other factors which are not considered.
Adjusted R square:
From the accepted data, the value of adjusted R square is -0.752 from table 06 in appendix. It
shows that how much dependent variable (profit) is changed for the changing of independent
variable (advance).
Standard Error of estimate:
Here the value is 91.41292 from table 06 in appendix that shows the amount of variability of
predicted result and the actual result acquired from the real observation.
Regression Sum of Square (SSR):
SSR value comes 1182.345 from table 07 in appendix showing the extent to which we are able
to minimize the error through using the multiple regression tools.
Error Sum of Square (SSE):
Here Residual SSE value comes 8356.322 from table 07 in appendix showing the extent to
which error is remaining after the regression and can be minimized with the increment of the
profit (dependent variable).
Total Sum of Square (SST):
In this observation, the value is 9538.667 (table 07 in appendix) that comes after adding the
SSR 1182.345 and SSE 8356.322.
Degrees of Freedom (df): Here, SST has (n-1) degrees of freedom, SSR has p (number of
independent variable) degrees of freedom and SSE has (n-p-1) degrees of freedom. Hence, the
mean square due to regression (MSR) is SSR divided by p and the mean sum of square due to
Page 24
© Bijoy, Md. Masud, Md. Habibur & Nirmal
Licensed under Creative Common Page 24
error (MSE) is SSE divided by (n-p-1). Here, 1 is degrees of freedom for the numerator and 1 is
degrees of freedom for the denominator.
F-test:
If H0 is accepted, MSR provides an unbiased estimate of σ2, and the value of MSR or MSE
becomes larger. To determine how large values of MSR/MSE must be to reject H0, we make to
use of the fact that if H0 is true and the assumptions about the regression model are valid, the
sampling distribution of MSR/MSE is a F-distribution with p degrees of freedom in the numerator
and (n-p-1) in the denominator. The summary of F-test is given below:
F=MSR/MSE= 0.141 (table 07 in appendix)
With a level of significance α= 0.10, the tabulated value shows that one df in the numerator and
one df in the denominator, F = 1.844. With 0.141<1.844, we accept the null hypothesis and
alternative hypothesis is rejected. So there is no significant relationship exists between profit &
advance.
Moreover, the p-value (sig.) = 0.771 from table 07 in appendix also indicates that we can reject
H0 because the P-value is higher than α=0.05.
Regression analysis:
Regression analysis measures the nature of the relationship between dependent variable and
independent variable. It describes that the relationship is positive or negative between variables.
Regression equation: Ŷ = a + bX
Ŷ = 2593.054 + 0.004X (from table 08 in appendix)
The regression equation describes that there is positive relationship between profit and
advance.
Dependent variable (Ŷ): Profit
Independent variable (X): Advance
If advance = zero then Ŷ= 2593.054. Here, Ŷ= 2593.054 from table 08 in appendix, which is Ŷ,
intercept. It shows that profit of the banks will be 2593.054 if the banks will have no advance.
Now, the value of b or slope of X is 0.004, it means if the volume of advance increases by BDT
1 then the profit from advance of the banks will increase for BDT 0.004 assuming all other
variables are constant.
T-test:
The calculated value of t is 4.029 from table 08 in appendix and tabular value is 3.078 at 1 df of
area 0.01which is less than calculated value of t. Hence, the null hypothesis is rejected and
Page 25
International Journal of Economics, Commerce and Management, United Kingdom
Licensed under Creative Common Page 25
alternative hypothesis is accepted and concludes that there is a positive relationship between
profit and advance of the banks.
Regression Model-03 (Third generation Banks): Advance and Profit
Value of R:
In appendix table 10, the value of R is 0.988 that indicates that the variable advance is positively
related to the profit position of the first generation banks.
Value of R square:
Here the value of R square comes 0.976 from table 10 in appendix, meaning that 97.60%
changes in profit is happening for the changes of the advance position. In addition, the least part
(1-0.976) = 0.024 is changed by other factors which are not considered.
Adjusted R square:
From the accepted data, the value of adjusted R square is 0.952 from table 10 in appendix. It
shows that how much dependent variable (profit) is changed for the changing of independent
variable (advance).
Standard Error of estimate:
Here the value is 29.97829 from table 10 in appendix that shows the amount of variability of
predicted result and the actual result acquired from the real observation.
Regression Sum of Square (SSR):
SSR value comes 36749.969 from table 11 in appendix showing the extent to which we are able
to minimize the error through using the multiple regression tools.
Error Sum of Square (SSE):
Here Residual SSE value comes 898.698 from table 11 in appendix showing the extent to which
error is remaining after the regression and can be minimized with the increment of the profit
(dependent variable).
Total Sum of Square (SST):
In this observation, the value is 37648.667 (table 11 in appendix) that comes after adding the
SSR 36749.969 and SSE 898.698.
Page 26
© Bijoy, Md. Masud, Md. Habibur & Nirmal
Licensed under Creative Common Page 26
Degrees of Freedom (df):
Here, SST has (n-1) degrees of freedom, SSR has p (number of independent variable) degrees
of freedom and SSE has (n-p-1) degrees of freedom. Hence, the mean square due to
regression (MSR) is SSR divided by p and the mean sum of square due to error (MSE) is SSE
divided by (n-p-1). Here, 1 is degrees of freedom for the numerator and 1 is degrees of freedom
for the denominator.
F-test:
If H0 is accepted, MSR provides an unbiased estimate of σ2 , and the value of MSR or MSE
becomes larger. To determine how large values of MSR/MSE must be to reject H0, we make to
use of the fact that if H0 is true and the assumptions about the regression model are valid, the
sampling distribution of MSR/MSE is a F-distribution with p degrees of freedom in the numerator
and (n-p-1) in the denominator. The summary of F-test is given below:
F=MSR/MSE= 40.892 (table 11 in appendix)
With a level of significance α= 0.10, the tabulated value shows that one df in the numerator and
one df in the denominator, F = 1.844. With 40.892>1.844, we reject the null hypothesis and
alternative hypothesis is accepted. So there is a significant relationship exists between profit &
advance.
Moreover, the p-value (sig.) = 0.099 from table 11 in appendix also indicates that we can reject
H0 because the P-value is higher than α=0.05.
Regression analysis:
Regression analysis measures the nature of the relationship between dependent variable and
independent variable. It describes that the relationship is positive or negative between variables.
Regression equation: Ŷ = a + bX
Ŷ = 691.713 + 0.031X (from table 12 in appendix)
The regression equation describes that there is positive relationship between profit and
advance.
Dependent variable (Ŷ): Profit
Independent variable (X): Advance
If advance = zero then Ŷ= 691.713. Here, Ŷ= 691.713 from table 12 in appendix, which is Ŷ,
intercept. It shows that profit of the banks will be 691.713 if the banks will have no advance.
Page 27
International Journal of Economics, Commerce and Management, United Kingdom
Licensed under Creative Common Page 27
Now, the value of b or slope of X is 0.031 from table 12 in appendix, it means if the volume of
advance increases by BDT 1 then the profit from advance of the banks will increase for BDT
0.031 assuming all other variables are constant.
T-test:
The calculated value of t is 3.468 from table 12 in appendix and tabular value is 3.078 at 1 df of
area 0.01 which is less than calculated value of t. Hence, the null hypothesis is rejected and
alternative hypothesis is accepted and concludes that there is a positive relationship between
profit and advance of the banks.
CONCLUSION
Profit position of first & second generation’s banks was lower in 2012 than other years but third
generation banks’ profit position was in increasing trend. If we see the deposit and advance
position of all banks then we can easily imagine that deposit & advance position of all banks
were increasing. We know that profit position moves positively with the positive movement of
advances of the commercial banks but in 2012 first & second generation banks did not prove
this theory. There were several reasons behind this occurrence. Among all these; unrest
political situation, higher amount of default loan, decrease of loan rate, decrease the investment
scope and lack of emerging investor were the main reasons for decreasing the profit position of
the banks of first & second generation. On the other hand, first generation banks held the
highest advance deposit ratio and third generation banks held the lowest advance deposit ratio.
Second & third generation banks were expanding very fast than first generation banks
because the number of branches was increasing very faster of two generation banks. Other site,
increasing trend of profit was negative of first & second generation banks in 2012 but third
generation banks held the positive situation. In 2013 all banks of three generations kept positive
growth. At the liquidity gap position, 2013 held the highest position. There was negative liquidity
balance in 2012 because first generation banks invested more than deposit collection.
Better liquidity management depends on the market condition, internal regulations and
implementation of these regulations. If banks want to increase the profitability, liquidity should
be managed very efficiently. This research is conducted by considering the banking condition of
Bangladesh and it proves that excess liquidity reduces the profitability. Several techniques have
been used to find out this truth.
Page 28
© Bijoy, Md. Masud, Md. Habibur & Nirmal
Licensed under Creative Common Page 28
RECOMMENDATIONS
The management of liquidity is the most vital problem of the commercial banks. Few liquidity
management techniques are explained below:
Short term investment should be balanced with short term funds and long term
investment should be balanced with long term funds but most of the commercial banks
do not do this accurately because of unstructured financial market and unhealthy
competition among the banks. To minimize this risk banks should balance the maturity of
the deposit and advance as well as confirm fair competition to create structured financial
market.
Banks can arrange the repayment schedule at installment basis properly. It minimizes
the bank’s risk in loan repayment.
There are lopsided and lack of close observations to deposit &advance behavior of the
large customers. So banks need to ensure the precise supervision on deposit and
advance position which helps to manage the liquidity position with very well manner.
Front desk service has to be provided by very efficient and well behaved bank officials
and then the clients will unwearyingly wait before the desk without any complains to the
higher authority of the banks about the unavailability of money for settlement. So that it
does not create bad impression in the mind of the general public about the service of the
bank.
If banks create regular better linkage with banks, they can obtain usual and inclusive
information from the banks with detail amplifications regarding liquidity and others.
Collected information will help to understand and report about the bank’s liquidity
position.
To overcome the urgent liquidity crisis, banks should create good relationship with the
money market players. Banks have to take effective actions to sell government
securities such as treasury bills & treasury bonds and manage call money transactions
whenever required. If banks walk at this way, they can collect necessary funds and solve
the liquidity crisis. Banks can avoid liquidity crisis timely or handle more efficient way
which sell government securities with more fidelity, sincerity and immovability.
If the management and board of the bank are skilled and experienced of both deposits
and advance by professionally, bank can avoid many problems not to speak the liquidity.
If advance is not recovered in the right time with right amount, liquidity crisis hasto arise.
The advance portion of the banks can be converted into debenture and it can be sold in
the market. By this way liquidity can be managed by managerial strategy. By ensuring
Page 29
International Journal of Economics, Commerce and Management, United Kingdom
Licensed under Creative Common Page 29
advance recovery and advance conversion chance, liquidity crisis can be avoided or
minimized. So banks need to recruit experienced and trained bank personnel.
Banks can increase the profitability by following these suggestions:
Banks should find new lending sectors which can help to improve the profitability.
Bangladesh Bank should increase the lending rate to the borrowers and decrease the
deposit rate.
The productivity of manpower should be increased.
Bangladesh Bank should apply the new roles to manage the liquidity of the banks.
Non-interest expenses of the banks should be minimized.
LIMITATIONS OF THE RESEARCH
The research is conducted on fifteen private commercial banks out of fifty six banks. So this
research cannot give clear cut idea about the whole picture of banking sector of Bangladesh.
There are several limitations other than this such as:
Only three years’ data are not sufficient to conduct this study because it does not
represent the whole performance of the financial market.
Bank officials are reluctant to give the all information.
All liquidity ratios and profitability ratios are not considered because sufficient
information.
Only deposit, advance & profit position are considered which is not sufficient to analysis
the liquidity management of the banks.
REFERENCES
J. AloyNiresh, 2012, Trade-off between liquidity & profitability: A study of selected manufacturing firms in Sri lanka, Journal of Arts, Science & Commerce, Vol.– III, Issue–4(2).
Lamberg&Vålming, 2009, Impact of Liquidity Management on Profitability, Umeå School of Business, UMEA University, 15ph.
Van Horne & John, 2005, Fundamental of Financial Management, 12th Edition (Prentice Hall Financial Times, England)
TarronKhemraj, 2007, Monetary Policy and Excess Liquidity, Social and Economic Study, Vol. 56, No. 3, 101-127
A. R. Khan, 2000, BANK MANAGEMENT-A FUND EMPHASIS: Liquidity Management (Decent Book House & Publishers, Dhaka-1205)
Bangladesh Bank, www.bangladesh-bank.org, Regulationand Guidelines, Dhaka, Bangladesh
Pubali Bank Limited, www.pubalibangla.com, Bangladesh
United Commercial Bank Limited (UCBL), www.ucbl.com, Bangladesh
Page 30
© Bijoy, Md. Masud, Md. Habibur & Nirmal
Licensed under Creative Common Page 30
National Bank Limited, www.nblbd.com, Bangladesh
The City Bank Limited, www.thecitybank.com, Bangladesh
International Finance Investment & Commerce Bank Limited(IFIC), www.ificbank.com.bd, Bangladesh
Prime Bank Limited, www.primebank.com.bd, Bangladesh
Southeast Bank Limited, www.southeastbank.com.bd, Bangladesh
Dutch Bangla Bank Limited, www.dutchbanglabank.com, Bangladesh
Dhaka Bank Limited, http://dhakabankltd.com, Bangladesh
National Credit & Commerce Bank Limited, https://www.nccbank.com.bd, Bangladesh
Bank Asia Limited, www.bankasia-bd.com, Bangladesh
Mercantile Bank Limited, www.mblbd.com, Bangladesh
BRAC Bank Limited, www.bracbank.com, Bangladesh
Jamuna Bank Limited, www.jamunabankbd.com, Bangladesh
Trust Bank Limited, www.trustbank.com.bd, Bangladesh
Chicago Tribune, http://articles.chicagotribune.com/keyword/liquid-assets, USA.
Luckett,1980 Approaches to Bank Liquidity Management, Economic Review
ECB, Monthly Bulletin, May 2002,The liquidity management of the ECB
ObilorIbe, 2013, The Impact of Liquidity Management on the Profitability of Banks in Nigeria, Journal of Finance and Bank Management, 1(1), pp.37-48
Olagunju, David &Samuel, 2011, Liquidity Management and Commercial Banks' Profitability in Nigeria, Research Journal of Finance and Accounting, Vol 2, No 7-8
Bordeleau& Graham, 2010, The Impact of Liquidity on Bank Profitability, Journal of Banking and Finance, pp.10-38
Owolabi, Obiakor&Okwu, 2011, Investigating Liquidity-Profitability Relationship in Business Organizations: A Study of Selected Quoted Companies in Nigeria, British Journal of Economics, Finance and Management Sciences, Vol. 1 (2)
Bijoy, 2014, Investment in treasury bills and treasury bonds in 2013: A study of Bangladesh, International Journal of Economics, Finance and Management Sciences, Vol. 2, pp. 182-187
Grant, 2011, Liquidity transfer pricing: a guide to better practice (Liquidity Cushion), Bank for International Settlements, No 10, pp. 42
Zaheer&Farooq, 2014, Liquidity Crisis: Are Islamic Banking Institutions More Resilient?, IMF, UKaid
Accenture, 2011, Liquidity Risk Management and the Regulatory Environment, Liquidity Management Framework - Implementation challenges for banks
APPENDICES
Table - 01
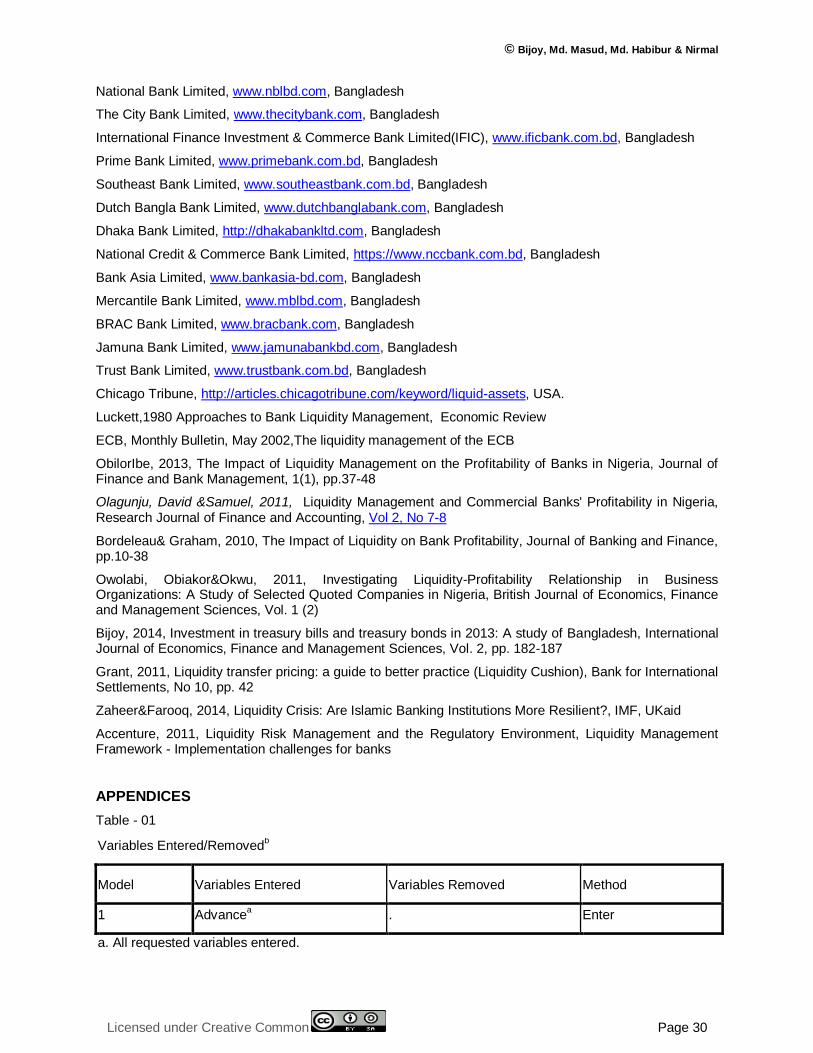
Variables Entered/Removedb
Model Variables Entered Variables Removed Method
1 Advancea . Enter
a. All requested variables entered.
Page 31
International Journal of Economics, Commerce and Management, United Kingdom
Licensed under Creative Common Page 31
Variables Entered/Removedb
Model Variables Entered Variables Removed Method
1 Advancea . Enter
b. Dependent Variable: Profit
Here, profit is dependent variable and advance is considered as independent variable. If advance is changed by one BDT then profit also changes by one BDT.
Table – 02
Model Summary
Model R R Square Adjusted R Square Std. Error of the Estimate
1 .584a .341 -.318 41.85843
a. Predictors: (Constant), Advance
Table – 03
ANOVAb
Model Sum of Squares df Mean Square F Sig.
1 Regression 906.538 1 906.538 .517 .603a
Residual 1752.129 1 1752.129
Total 2658.667 2
a. Predictors: (Constant), Advance
b. Dependent Variable: Profit
Table – 04
Coefficientsa
Model
Unstandardized Coefficients Standardized Coefficients
t Sig. B Std. Error Beta
1 (Constant) 2841.617 185.164 15.346 .041
Advance .002 .003 .584 .719 .603
a. Dependent Variable: Profit
Page 32
© Bijoy, Md. Masud, Md. Habibur & Nirmal
Licensed under Creative Common Page 32
Table - 05
Variables Entered/Removedb
Model Variables Entered Variables Removed Method
1 Advancea . Enter
a. All requested variables entered.
b. Dependent Variable: Profit
Here, profit is dependent variable and advance is considered as independent variable. If advance is changed by one BDT then profit also changes by one BDT.
Table - 06
Model Summary
Model R R Square Adjusted R Square Std. Error of the Estimate
1 .352a .124 -.752 91.41292
a. Predictors: (Constant), Advance
Table - 07
ANOVAb
Model Sum of Squares df Mean Square F Sig.
1 Regression 1182.345 1 1182.345 .141 .771a
Residual 8356.322 1 8356.322
Total 9538.667 2
a. Predictors: (Constant), Advance
b. Dependent Variable: Profit
Table - 08
Coefficientsa
Model
Unstandardized Coefficients Standardized Coefficients
t Sig. B Std. Error Beta
1 (Constant) 2593.054 643.608 4.029 .155
Advance .004 .012 .352 .376 .771
a. Dependent Variable: Profit
Page 33
International Journal of Economics, Commerce and Management, United Kingdom
Licensed under Creative Common Page 33
Table - 09
Variables Entered/Removedb
Model Variables Entered Variables Removed Method
1 Advancea . Enter
a. All requested variables entered.
b. Dependent Variable: Profit
Here, profit is dependent variable and advance is considered as independent variable. If advance is changed by one BDT then profit also changes by one BDT.
Table - 10
Model Summary
Model R R Square Adjusted R Square Std. Error of the Estimate
1 .988a .976 .952 29.97829
a. Predictors: (Constant), Advance
Table - 11
ANOVAb
Model Sum of Squares df Mean Square F Sig.
1 Regression 36749.969 1 36749.969 40.892 .099a
Residual 898.698 1 898.698
Total 37648.667 2
a. Predictors: (Constant), Advance
b. Dependent Variable: Profit
Table - 12
Coefficientsa
Model
Unstandardized Coefficients Standardized Coefficients
t Sig. B Std. Error Beta
1 (Constant) 691.713 199.451 3.468 .179
Advance .031 .005 .988 6.395 .099
a. Dependent Variable: Profit
Page 34
© Bijoy, Md. Masud, Md. Habibur & Nirmal
Licensed under Creative Common Page 34
Table - 13
(Fig in BDT in crore)
Generations (Banks) Deposit
2013 2012 2011
First 73,979.00 63,363.00 55,002.00
Second 73,697.00 66,320.00 54,675.00
Third 60,596.00 52,541.00 43,987.00
Total 208,272.00 182,224.00 153,664.00
Table - 14
(Fig in BDT in crore)
Generations (Banks) Advance
2013 2012 2011
First 65,825.00 57,595.00 47,487.00
Second 58,366.00 54,982.00 47,770.00
Third 45,549.00 39,905.00 36,984.00
Total 169,740.00 152,482.00 132,241.00
Table - 15
(Fig in BDT in crore)
Generations (Banks) Profit
2013 2012 2011
First 3,013.00 2,941.00 2,967.00
Second 2,905.00 2,767.00 2,831.00
Third 2,118.00 1,910.00 1,859.00
Total 8,036.00 7,618.00 7,657.00