83
1 LIQUIDITY MANAGEMENT OF CEMENT MANUFACTURING COMPANIES LISTED ON THE NAIROBI SECURITIES EXCHANGE BY ARTHEMON NIZIGIYIMANA UNITED STATES INTERNATIONAL UNIVERSITY SPRING 2014

1
LIQUIDITY MANAGEMENT OF CEMENT
MANUFACTURING COMPANIES LISTED ON THE
NAIROBI SECURITIES EXCHANGE
BY
ARTHEMON NIZIGIYIMANA
UNITED STATES INTERNATIONAL UNIVERSITY
SPRING 2014

2
LIQUIDITY MANAGEMENT OF CEMENT
MANUFACTURING COMPANIES LISTED ON THE
NAIROBI SECURITIES EXCHANGE
BY
ARTHEMON NIZIGIYIMANA
A Project Report Submitted to the Chandaria School of Business in Partial
Fulfillment for the Degree of Masters in Business Administration (MBA)
UNITED STATES INTERNATIONAL UNIVERSITY
SPRING 2014

3
STUDENT’S DECLARATION
I, the undersigned, declare that this is my original work and has not been submitted to any
other college, institution, or university other than the United States International University
in Nairobi for academic credit.
Signed: Date:
Arthemon Nizigiyimana (ID:638165)
This project has been presented for examination with my approval as the appointed
supervisor.
Signed: Date:
Dr. Amos Njuguna
Signed: Date:
Dean, Chandaria School of Business

4
COPYRIGHT
All rights reserved. No part of this report may be photocopied, recorded or otherwise
reproduced, stored in a retrieval system or transmitted in any electronic or mechanical means
without prior permission of the copyright owner.
Arthemon Nizigiyimana Copyright © 2014

5
ABSTRACT
The purpose of this study was to establish liquidity management measures of cement
producing firms listed on the Nairobi Securities Exchange (NSE).The study sought to
establish the measures of corporate liquidity management, the factors that affect liquidity
requirements and establish the relationship between liquidity and profitability in
manufacturing cement firms.
Purposive sample design was applied in this study which suited to the selected samples of top
cement companies of Kenyan Cement Industry namely Athi River Mining, Bamburi Cement
and East African Portland Cement. Secondary data extracted from the income statements,
balance sheets of sampled firms from the company annual report accessible from the Nairobi
Securities Exchange database and the website were used covering a period of five years
starting from 2008 to 2012. Data was analyzed by use of descriptive statistics and
relationship drawn using multiple regression analysis.
This study showed that liquidity is measured by Current Ratio, Quick Ratio and Cash Ratio.
The research findings revealed that the mean values of current ratio was 1.71 which is below
the standard conventional rule of 2:1.This indicated that on average the listed cement
companies might find difficult to meet their short term maturing obligations. However, with
the maximum of 2.22 for the current ratio showed that some of the companies were doing
very well liquid wise, as they were not likely to encounter any difficulty in meeting their
short term obligations. On an average the quick ratio was 1.09 which was satisfactory
compared to the standard conventional rule of 1:1.
The findings of this study further showed that liquidity measured by current ratio is
influenced by cash conversion cycle measured by inventory turnover, receivables collection
period and payables payment period. Regression analysis was carried out to examine the
relationship between liquidity and cash conversion cycle. The results revealed that variation
in current ratio was explained by the number of days of cash conversion cycle. The findings
showed that a satisfactory cash conversion cycle had a positive impact on current ratio while
unsatisfactory cash conversion cycle had a negative impact on liquidity measured by current
ratio.

6
There exists a relationship between liquidity and profitability indicators. The investigation
using both correlation and regression analysis revealed that liquidity ratios measured by
Current Ratio, Quick ratio and cash conversion cycle have a relationship with profitability
measured by return on capital employed. The findings revealed that Current Ratio and Quick
Ratio were positively associated with return on capital employed while cash conversion cycle
was negatively associated with Return on Capital Employed.
The study concluded that liquidity position based on quick ratio was more satisfactory in case
of BMBC and EAPC and unsatisfactory in case of ARML. Cash conversion cycle was on
decreasing trend. Cash conversion cycle was satisfactory in case of BMBC and EAPC and
had a positive impact on liquidity. Cash conversion cycle was unsatisfactory in case of
ARML and had a negative impact on liquidity. The analysis showed that BMBC and EAP
were able to meet their short term obligations over the study period but ARML was unable to
meet its short compulsions.
This study recommends that to ensure better liquidity management, that is shorter cash
conversion cycle, which would invariably lead to better profitability in the cement industry,
the duration of time that goods are held in inventory should be reduced. This can be
accomplished by improving the inventory control process .Also accounts receivables should
be collected more quickly by improving the efficiency of the collection process as debt
should be collected in line with the agreed credit terms. Managers should try to delay
payables because it will provide them opportunities to invest in different profitable areas thus
increasing the firm‟s profitability.

7
TABLE OF CONTENTS
STUDENT’S DECLARATION……………………………………………………….……ii
COPYRIGHT………………………………………………………………………….……iii
ABSTRACT…………………………………………………………………………….…....iv
TABLE OF CONTENT……………………………………………………………….…....vi
AKNOWLEDGEMENT……………………………………………………………..…….iX
LIST OF TABLES…….………………………………………..……………….…………..X
LIST OF ABBREVIATIONS……………………………………………………………..Xii
CHAPTER ONE……………………………………………………………………………..1
1.0 INTRODUCTION……………………………………………………………………… 1
1.1 Background of the Study………………………………………………………………….1
1.2 Statement of the Problem…………………………………………………………….........4
1.3 Purpose of the Study……………………………………………………………………....4
1.4 Research Questions ……………………………………………………………………….4
1.5 Importance of the Study…………………………………………………………………. .5
1.6 Scope of the study……………………………………………………………………… ...6
1.7 Definition of the Terms……………………………………………………………… .......6
1.8 Chapter Summary…………………………………………………………………………7
CHAPTER TWO……………………………………………………………..………....…...8
2.0 LITERATURE REVIEW………………………………………………..……………...8
2.1 Introduction……………………………………………………………………...………...8
2.2 Measures of Corporate Liquidity Management………..…………………………….……8
2.3 Factors that Affect Liquidity Requirement of Cement Manufacturing Firms.…………..12

8
2.4 Relationship between Liquidity and Profitability in Cement Manufacturing Firms.........16
2.5 Chapter Summary ………………………………….……………………………………20
CHAPTER THREE………………………………………………………………………...21
3.0 RESEARCH METHODOLGY…………………………………………………...…...21
3.1 Introduction………………………………………………………………………………21
3.2 Research Design………………………………………………………………………….21
3.3 Population and Sampling Design………………………………………………………...22
3.4 Data Collection Methods………………………………………………………...………24
3.5 Research Procedures …………………………………………………………………….24
3.6 Data Analysis Method……………………………………………………………………25
3.7 Chapter Summary……………………………………………………………………......27
CHAPTER FOUR…………………………………………………………………..…........28
4.0 RESULTS AND FINDINGS……………………………………………………….......28
4.1 Introduction………………………………………………………………………………28
4.2 Description of the Companies………………………………………………..……..........28
4.3 Descriptive Statistics………………………………………………………………..........31
4.4 Measures of Liquidity Management………………………………………………..........32
4.5 Factors that Affect Liquidity Requirement of a Cement Manufacturing Firm..................34
4.6 Relationship between Liquidity and Profitability Analysis………………………...........39
4.7 Chapter Summary…………………………………………………………………..........47
CHAPTER FIVE……………………………………………………………………...........48
5.0 DISCUSSION,CONCLUSIONS AND RECOMMENDATIONS…………………...48
5.1 Introduction…………………………………………………………………………..….48
5.2 Summary…………………………………………………………………………………48

9
5.3 Discussion………………………………………………………………………………..51
5.4 Conclusions……………………………………………………………………….……...58
5.5 Recommendations………………………………………………………………………..59
REFERENCES……...………………………………………………………………..……..61
APPENDIX………………………………………………………………………………….70

10
ACKNOWLEDGEMENT
I appreciate Dr Amos Njuguna for his timely and wise counsel during the preparation of this
project report. I also express my appreciation for my family and friends for their support and
encouragement in the course of my studies. May God almighty bless you all.
I give all glory to God.
Arthemon Nizigiyimana
USIU, Spring 2014

11
LIST OF TABLES
Table 4.1: Turnover in Kshs‟000‟……………………………………………………………29
Table 4.2: Profit after Tax in Kshs‟000‟……………………………………………………..29
Table 4.3: Total Assets in Kshs‟000‟………………………………………………………...30
Table 4.4: Total Liabilities…………………………………………………………………...30
Table 4.5: Shareholders Funds in Kshs‟000‟………………………………………………...31
Table 4.6: Trends in the Liquidity and Profitability Ratios (2008-2012)……………………31
Table 4.7: Descriptive Statistics based on Current Ratio……………………………………32
Table 4.8: Liquidity Position based on Quick Ratio…………………………………………33
Table 4.9: Descriptive Statistics based on Age of Inventory………………………………...34
Table 4.10: Descriptive Statistics based on Age of Receivables days……………………….35
Table 4.11: Descriptive Statistics based on Age of Payables………………………………..35
Table 4.12: Summary of CR and CCC of ARML…………………………………………...36
Table 4.13: Model Summary of dependent variable (CR)…………………………………...37
Table 4.14: Summary of CR and CCC of BMBC…………………………………………...37
Table 4.15: Model Summary of dependent variable (CR)…………………………………...38
Table 4.16: Summary of CR and CCC of EAPC…………………………………………….38
Table 4.17: Model Summary of dependent variable (CR)…………………………………...39
Table 4.18: Summary of financial ratios of ARML………………………………………….39
Table 4.19: Model Summary of dependent variable (ROCE)……………………………….40
Table 4.20: ANOVA of dependent variable (ROCE)………………………………………..40

12
Table 4.21: Regression coefficient of dependent variable (ROCE)...……………………….41
Table 4.22: Summary of financial ratios of BMBC…………………………………………42
Table 4.23: Model Summary of dependent variable (ROCE)……………………………….42
Table 4.24: ANOVA of dependent variable (ROCE)………………………………………..43
Table 4.25: Regression coefficient of dependent variable (ROCE)…………………………43
Table 4.26: Summary of financial ratios of EAPC…………………………………………..44
Table 4.27: Model Summary of dependent variable…………………………………………45
Table 4.28: ANOVA of dependent variable (ROCE)………………………………………..45
Table 4.29: Regression Coefficients of dependent variable (ROCE)………………………..46

13
LIST OF ABBREVIATIONS
ANOVA : Analysis of Variance
ARML : Athi River Mining Cement Limited
BMBC : Bamburi Cement Limited
CA : Current Assets
CCC : Cash Conversion Cycle
CL : Current Liabilities
CR : Current Ratio
EAPC : East African Portland Cement Company Limited
KNBS : Kenya National Bureau of Statistics
MS : Mean Square
NSSF : National Social Security Fund
PAT : Profit after Tax
PPP : Payables Payment Period
QR : Quick Ratio
RCP : Receivables Collection Period
ROCE : Return on Capital Employed
SS : Sum of Squares

14
CHAPTER ONE
1.0 INTRODUCTION
1.1 Background to the Study
The construction industry in Kenya is growing quickly averaging a growth rate of 14.2%
from 2006 to 2011.During the same period, the economic growth of the country as measured
by Gross Domestic Product rate (GDP) was 4.3% decreasing to 4.38% in 2011 from 6.33%
in 2006 (Dyer and Blair, 2012).The rise of oil price, the financial crisis of 2007, the 2008
post -election instability in the country and a high inflation weakened the economic
performance from 2006 to 2011.
In Kenya, demand for cement is correlated to the economic performance of the country. The
consumption of cement products grew more than twice the rate of GDP growth from 2006 to
2011. Growing with the building industry, the consumption of cement increased with a rate
of 14.1% during the period, with consumption attaining 3.43 million tons in 20011,up from
1.57 million tons in 2006 (Kenya National Bureau of Statistics, [KNBS] ,2012).
The main drivers of the increase in consumption were increase demand for housing, the
boom for business construction fuelled by risen foreign investment, government and donor –
funded spending on the country‟s huge infrastructure projects. Consequently, cement
consumption per capita consumption, increased at an average rate of 10.7% for the period to
83.9 kilograms in 2011 from 50 kilograms in 2006 despite stagnation in annual increase of
the population (KNBS, 2012).
According to Dyer and Blair (2012) the production of cement grew at a rate of 11.6% from
2006 to 2011 to 4.9 millions of tons in 2011 from 2.41 million of tons in 2006.The
production increase was caused by new entrants in the industry and expansion of capacity by
existing cement companies to counter attack rival firms. During the period the cement
products was oversupplied due to increase in cement production. Based on the rate of
industry capacity utilization which was given at around 72%, the excessive supply could be
higher were established capacity fully used. The cement firms of Kenya comprise six firms
situated in three different locations in the country. These companies are Bamburi Cement

15
Limited (BMBC), Athi River Mining Limited (ARML), East African Portland Cement
Company Limited (EAPC), National Cement Company Limited (NCC), Mombasa Cement
Limited (MCL) and Savannah Cement Company (SCC).
As at end 2011, cement exports averaged 21.1% of total cement production over the period
2006-20011.Key export markets included Uganda, Tanzania, the Democratic Republic of
Congo (DRC) and other East and Central African countries. Imported cement accounted for a
marginal 2% of total cement consumed during the period indicating the country‟s overall
reliance on locally produced cement. In 2011, cement import duty under the East African
Community Common External Tariff was lowered by 10% to 25% despite stiff opposition
from industry players. Should the suspension of the 10% import duty remain, the quantum of
cheap cement imports particularly from low cost producers such as Egypt, India, China and
Pakistan could increase considerably, further widening the demand-supply mismatch
(KNBS,2012).
Liquidity management is a concept that is receiving serious attention all over the world
especially with the current financial crisis (Owolabi, 2011).The objective of business owners
and managers is to conceive a strategy of managing their day to day operations in order to
meet their obligations as they fall due and increases profitability and shareholders value.
Liquidity management affects corporate performance. Liquidity management requires
maintaining liquidity in day to day operations to ensure its smooth running and meet its
obligations when they fall due (Eljelly, 2004). Efficient management of liquidity plays a key
role in the successful operating of a company. A company should ensure that it possess
sufficient liquidity to meet its short term obligations. Studying liquidity is important to both
the internal and the external analysts because of its close relationship with day to day
operations of a firm (Bhunia, 2010). The Challenge in liquidity management is to achieve
desired balance between profitability and liquidity (Raheman and Nasr,2007). The
requirement for liquidity of a business depends on its nature and there is no specific rule on
determining the optimal level of funds that a firm can maintain to ensure positive impact on
its net income (Panigrahi , 2013) .
16
The management of liquidity is among the four cardinal decision areas of financial
management, for which every business oriented organization has to determine (Pandey,
2005). The liquidity components of a firm‟s financial management deal with the liquidity
aspect of a firm and therefore fundamental for the effective and efficient operations as well
as the sustainability of its business continuance (Enyi, 2006).
Poor management of liquidity in terms solvency, operating efficiency and profitability is
imputable to inadequate financial performances (Bhunia, 2006).Management of liquidity is a
very sensitive area in the field of managing finances.
The management of liquidity determines to a large extent the quantity of profit that results as
well as the wealth of stakeholders (Ben, 2008). A company in order to survive must remain
liquid as failure to meet its compulsions in due time results in bad credit rating by the short
term creditors, reduction in the value of reputation in the market and may ultimately lead to
bankruptcy (Bhavet,2011). Thus a good and firm financial management policy seeks to
maintain adequate liquidity in order to meet its short-term maturing obligations without
diminishing profitability. However the principal focus of most organizations is profitability
maximization while the concern for efficient management of liquid assets is neglected. This
perspective is justified by the belief that profitability and liquidity are conflicting objectives.
Therefore a company can only pursue one at the expense of the other, in consonance with the
tradeoff theory of liquidity and profitability.
According to Padachi (2006) a firm is required to maintain a balance between liquidity and
profitability while conducting its daily activities. Profitability is directly affected by both
inadequate and surplus liquidity (Ogundipe, Idowu and Ogundipe, 2012). For instance, when
the “necessary” level of liquid assets is exceeded, their surpluses when the market risks
remain stable, become a source of ineffective utilization of resources which has an adverse
effect on profitability.

17
1.2 Statement of the Problem
Over the years, the manufacturing sector has been a victim of high production costs which
invariably reduces profitability. As argued by Akinbuli (2006), poor management is the main
reason for business failure as many corporate organizations went into liquidation because of
poor management. Peavler (2009) observed that most failed businesses were due to cash flow
problems. The importance of cash flow is particularly pertinent when access to cash is
difficult and expensive.
According to Basno and Dardac (2004 the required liquidity for each company depends on
the balance sheet situation of the company. To assess the liquidity state, special importance is
held by the way in which there are classified organizational liabilities and assets (Basno and
Dardac, 2004).
Studies were made in order to observe the interaction between these two variables, such as
Lazaridis and Tryfonidis (2005) who found a relationship between liquidity management
efficiency and profitability. Companies enjoy better pricing when they hold enough cash to
purchase from suppliers and thus they may enhance their profit. So having enough liquidity
also affects the profitability of the firm. Siddiquee and Khan (2008) observed that firms
which are better at managing liquidity are found to be able to make cyclical moves to build
competitive advantage. They are also better at generating fund internally and also face lesser
trouble while seeking external sources of financing.
The problem to be addressed by this study is to evaluate liquidity measures and the
relationship between liquidity and profitability of cement manufacturing companies listed on
the Nairobi Securities Exchange (NSE).
1.3 Purpose of the Study
The purpose of the study was to establish liquidity management measures of cement
producing companies listed on the Nairobi Securities Exchange (NSE).
1.4 Research Questions
The study was guided by three key research questions namely:

18
1.4.1 What are the measures of corporate liquidity management relevant for cement
manufacturing firms?
1.4.2 What are the factors that affect liquidity requirement of cement manufacturing firms?
1.4.3 Is there any relationship between liquidity and profitability in cement manufacturing
firms?
1.5 Importance of the Study
The findings of the study will benefit the following constituents:
1.5.1 Managers
Having an understanding of a company‟s liquidity position will help the managers to link
liquidity management efficiency and profitability of their firms. Managers will be sensitized
on the need to learn corporate finance for decision making on liquidity matters and for the
effective run of the cement manufacturing firms.
1.5.2 Investors
The findings of this study clearly show the investors how liquid and profitable the cement
industry in Kenya is.
1.5.3 Creditors
The findings of this study will inform creditors the performance of cement industry in Kenya
before lending the finance.
1.5.4 Government
The findings of this study will help the government of Kenya know how much the cement
industry contributes to the national treasury and whether the cement companies pay taxes on
time.
19
1.5.6 Researchers and Scholars
The findings of this study will add knowledge in the area of liquidity management and will
be useful to researchers and scholars.
1.6 Scope of the Study
The study focused on cement manufacturing companies located in Kenya .The cement
industry comprises six cement companies of which only three are quoted on Nairobi
Securities Exchange .These three listed cement companies were selected for a period of 2008
to 2012 on the basis of availability of data. This is in consideration of time and cost
constraints as the research was intended to take place within four months after the approval
of the proposal. The research was focused on management of liquidity and liquidity-
profitability tradeoff. The study used secondary data which was obtained through annual
reports of the three listed cement companies. The use of secondary data enabled the
researcher to collect reliable information from the target population .The annual reports
enabled the researcher to save time in data collection, they were cost effective and contained
the required information.
1.7 Definition of the terms
1.7.1 Liquidity
Liquidity is the ability to meet expected and unexpected demands for cash through ongoing
cash flow or the sale of an asset at fair market value (Barad , 2010).
1.7.2 Liquidity Management
Liquidity management has been defined as to involve managing the money of the firm in
order to attain maximum interest income on idle funds (Johnson and Aggarwal, 2008).
1.7.3 Manufacturing Firms
Manufacturing industry refers to any business that transforms raw materials into finished or
semi-finished goods using machines, tools and labor. Manufacturing sectors include
production of food, chemicals, textiles, machines and equipment (Laura, 2009).

20
1.7.4 Stock Exchange
Organized and regulated financial market where securities (bonds, notes, shares) are bought
and sold at prices governed by the forces of demand and supply (Hans and Alissa ,2008).
1.7.5 Profitability
Profitability is the capacity to make benefit from all the business operations of an
organization, company, firm, or an enterprise. It shows how efficiently the management can
make profit by using all the resources available in the market (Sandhar, 2013).
1.7.6 Cash Conversion Cycle
Cash conversion cycle measures the time lag between cash outflow for purchase of
inventories and collection of receivables from debtors (Padachi, 2006).
1.8 Chapter Summary
This chapter is an introduction to the research project. It mentioned that the purpose of the
study is liquidity management and investigation of the relationship between liquidity and
profitability. The background of the study as well as the research objectives has been stated.
The scope of the study was determined and a definition of key terms provided.
The research will be useful to managers, investors, Creditors, Government, policy regulators,
future researchers and will also contribute to the general body of knowledge. Chapter two
provides literature review of the subject under study. Chapter three covers the research
methodology, chapter four analyzes the research findings and presents the results while
chapter five provides discussions on the research findings, the conclusions drawn from the
study findings, the recommendations for improvement and recommendations for further
research.

21
CHAPTER TWO
2.0 LITERATURE REVIEW
2.1 Introduction
This chapter reviews literature on liquidity management and profitability. Section 2.2
addresses measures of corporate liquidity management, section 2.3 discusses factors that
affect liquidity requirement, section 2.4 deals with relationship between liquidity and
profitability in cement manufacturing firms and section 2.5 summarizes the chapter.
2.2 Measures of Corporate Liquidity Management
2.2.1 Current Ratio
The liquidity ratio establishes a relationship between cash and other current assets to current
obligations and provides a quick measure of liquidity (Pandy, 2005). The current ratio
compares the proportion of current assets available to cover current compulsions (Amalendu,
2011).The current ratio is used to ascertain whether a firm's short-term assets are readily
available to pay off its short-term obligations .The higher the current ratio, the better for a
company.
The current ratio is used in financial reporting and is easy to understand. But it can be
misleading in a positive or negative sense. A high current ratio is neither necessarily good,
nor a low current ratio is necessarily bad (Owolabi,2012). As opposed to popular perception,
the widespread current ratio, as an indicator of liquidity, is flawed because it is conceptually
based on the liquidation of all of a firm's current assets to meet its current compulsions. In
practice, this is not likely to happen. Investors must look at a firm as a going concern. It is the
time it takes to convert a firm's working capital assets into cash to pay its current
compulsions that is important to its liquidity. In summary, the current ratio can be
"misleading." When looking at the current ratio, it is essential that a firm's current assets can
cover its current compulsions; however, investors should know that this is not the whole
story on firm liquidity. They should try to understand the types of current assets the firm has
and how quickly these can be transformed into cash to meet current obligations ( Loth,
2012).
22
2.2.2 Quick Ratio
The quick ratio is a more conservative indicator of liquidity than the current ratio as it
removes inventory from the current assets used in the ratio's computation. By removing
inventory, the quick ratio focuses on the more-liquid assets of a business. Quick ratio will
help know whether to disburse their current debt, exclude to sell any inventory. It is
important for an organization to concern on this because, if it needs to sell inventory, it also
needs a buyer of that inventory (Chinmoy , 2009).
The use of this ratio is similar to the current ratio in that it gives users an idea of the ability of
a firm to meet its short-term obligations with its short-term assets. Another useful advantage
is to compare the quick ratio with the current ratio. If the current ratio is higher, it is a clear
indication that the firm's current assets depend on inventory. While considered more tight
than the current ratio, the quick ratio, because of its accounts receivable elements, suffers
from the same deficiencies as the current ratio – even though somewhat less. While
theoretically possible, as a going concern a firm must focus on the time it takes to convert its
working capital assets to cash - that is the true measure of liquidity (Ogundipe,2012).
2.2.3 Cash Ratio
The cash ratio is most conservative of current ratio and quick ratio. As the name implies, this
ratio is simply the proportion of cash and equivalents compared to current liabilities and
looks only at the assets that can be most easily used to pay off short-term debt, and it
disregards receivables and short-term investments (Thomson, 2011). The argument for using
the cash ratio is that receivables and short-term investment often cannot be liquidated in a
timely manner. Receivables can be sold, or monetized, but the firm will not be able to get the
full value of the receivables sold. Due to their high liquidity, short–term treasuries are
considered cash equivalents, not short-term investments.
2.2.4 Operating Cash Flow Ratio
The operating cash flow ratio is one of the most important cash flow ratios. Cash flow is an
indication of how much money moves into and out of the business. Operating cash flow
relates to cash flows that a firm accrues from operating activities to its current debts. It
23
measures how liquid a company is in the short run since it relates to current debt and cash
flows from operations (Peavler, 2009). If the operating cash flow is below 1, the firm has
generated less cash in the period than it needs to pay off its short-term obligations. This may
require more capital. Therefore investors and analysts typically prefer higher operating cash
flow ratios.
Financial ratios focus on balance sheet and income statements. However the statement of
cash flows can provide useful information from ratio analysis. Balance sheet ratios provide a
date-in-time perspective, whereas the statement of cash flows represents activity for a
continuous period. The statement of profit and loss accounts report the results of operations
for a period of time, but do not disclose changes in resources from activities in financing and
investing. The statement of cash flow complements the balance sheet and income statement
by providing additional information concerning an organization‟s capacity to operate
efficiently, to finance growth, and to pay its compulsions (Wells, 2005).
The aim of liquidity management is to maintain adequate control over cash position to keep
the firm sufficiently liquid and to use excess cash in some profitable ways (Ben, 2009).In this
sense cash management is the back bone of liquidity management as it affects corporate
profitability. The surplus cash needs to be invested in short term securities pending when it is
needed. The big problem faced by most companies is the ability to determine the minimum
cash level required by the company. Minimum cash level helps management to maintain
enough cash to meet its day-to-day operating activities. To avoid breaks or gaps in the
trading cycle due to lack of funds, administrators must compute the cash amount best suited
to their level of activity, plan the timing of the relevant payments and collections and draw
up a policy of investment in assets with high liquidity that can be transformed into cash at a
low transactional cost to serve as support for the treasury funds maintained by the firm.
Holding inadequate amount in cash or cash equivalent may disturb the normal flow of
business operations (Obida, 2011). Furthermore, the wrong safety margin may result in
financial problems, with companies unable to meet needs that may arise at any given time or
unable to take advantage of unexpected investment opportunities. Maintaining a cash surplus
therefore has a number of advantages. It allows companies to carry on the normal

24
transactions that arise in the course of their operations and avoid any treasury gaps. It also
assists them cover any unexpected needs for cash by acting as a preventive balance.
Akinsulire (2006) opines that liquidity management involves the efficient collection,
disbursement and temporary investment in cash. Having liquid assets available constitutes an
opportunity cost for a company, as the return on those assets is lower than the return on
productive investments, but there may still be transaction costs arising from the sale or
purchase of financial assets, and disadvantages in terms of taxation.
Optimal cash balance means a position when the cash balance amount is on the most ideal
position so that the firm has the ability to invest the surplus for a return profit and at the same
time have enough liquidity for future needs. The purpose is to minimize the sum fixed costs
of transactions and the opportunity cost of holding cash balances (Owolabi, 2011).
Acharya, Almeida, Campello (2013) use this insight to derive additional predictions about
the choice between cash and credit lines. They show that the most efficient allocation of
liquidity is one in which firms with idiosyncratic liquidity risk use credit lines, while firms
with correlated liquidity risks use cash in addition to credit lines. Provided that firms‟
exposure to aggregate risk is observable, their model predicts that firms with greater
aggregate risk exposure should hold more cash for their liquidity management, and that
aggregate cash holdings should increase with economy-wide aggregate risk.
There is some evidence that excess cash leads to value destruction. Firms that hold excess
cash are more likely to attempt acquisitions of other firms. These acquisitions are more likely
to be diversifying, and tend to lead to declines in operational performance and destruction of
shareholder value. Harford, Mansi, and Maxwell (2008) find that wasteful investments
occurring because of excess cash are more likely to happen when firms have poor corporate
governance.

25
2.3 Factors that Affect Liquidity Requirement of Cement Manufacturing Firms
2.3.1 Nature and Size of Business
The liquidity needs of a firm are basically influenced by the nature of its business (Pandy,
2005). Companies involved in trading and financial services generally have a low investment
in fixed assets, but require a large investment in current assets. Firms involved in retail stores
must carry large stocks of a variety of goods to satisfy the varied demand of buyers.
Manufacturing companies and construction firms also have to invest significantly in working
capital but only a nominal amount in fixed assets. However public utilities have a limited
need for working capital and have to invest substantially in fixed assets. Their requirements
for working capital are nominal because they have cash sales only and they supply services
only. Therefore the amount of cash tied up with debtors or in inventories is very small. The
needs for working capital of most of the manufacturing concerns fall between the two
extreme requirements of public utilities and trading companies.
2.3.2 Inventory Turnover
Inventory turnover establishes relationship between the costs of goods sold and average
inventory. Inventory turnover measures the speed of converting stock into sales. A high
inventory turnover demonstrates efficient management of inventory because more frequently
the inventory is sold, the lesser amount of cash is required to finance stock. A low ratio of
inventory turnover shows inefficient management of inventory, over investment in stock,
slow business, and bad quality of goods that lead to decrease profit as compared to total
amount of investment (Raheman, 2007).
Age of inventory shows duration of inventory in a company. It explains moving position of
inventory over the year. If age of inventory is minimum it means firms activity position are
satisfactory, they are able to sell their goods within shorter period of time which illustrates
sound liquidity position of the firm. If age of inventory is too high, it shows slow moving of
stock due to lower demand of product or excessive production by firm, due to stocking
policy, which affected directly liquidity position of the firm. Inventory is one of the major
items in current assets, which indicates investment of working capital in stock (Amalendu,
2006).
26
2.3.3 Receivables Collection Period (RCP)
RCP ratio is computed by dividing trade receivables by turnover and multiply the result by
365.This ratio indicates number of days it takes a company to recover its credit sales .The
shorter the period the better for the company. Account receivables with longer recoverable
period pose the risk of bad debt for the company and also affect liquidity in the short run
(Pandy, 2005).
Age of receivables ratio indicates the efficiency of the credit and collection policy of the
company and it will directly affect its liquidity position. It is a test of pace in which
receivables are converted into cash. Lower the receivables to sales ratio, better is the liquidity
of debtors and it means prompt payment by the customers (Bhunia, 2006).
2.3.4 Payables Payment Period (PPP)
PPP ratio is computed by dividing average trade payables by cost of goods sold and multiply
the result by 365. This ratio indicates the number of days the organization is required to settle
its short term liabilities. The longer the period the better for the organization as it gives the
organization leverage to recover its receivables. Where the period is shorter than the
receivable collection period it puts pressure on the liquidity of the organization (Okwu,2011).
Age of payables indicates efficiency of the credit and payment policy of the organization and
liquidity position directly depends on this period. Higher the payables payment period the
longer is the age of payables as well as better is the management of liquidity whereas shorter
the age of payables indicates inefficient and poor payment policy that is accountable to
decrease current obligations burden and suffering condition of liquidity position
(Amalendu,2006).
2.3.5 Credit Terms
The credit policy of a firm affects the size of liquidity by influencing the level of trade
receivables. Even if the credit terms granted to customers to a great extent depend upon the
practices of the industry or trade to which the firm operates, yet it may endeavor to shape its
credit policy within such restrictions. A long collection period means tying funds in

27
receivables amount. Slow collection procedures increase the chances of bad debts. The
shorter the receivables collection period, the better is the liquidity of receivables. Liquidity
requirements of a company are also affected by credit terms granted by its suppliers. Higher
the credit payment period better is the liquidity management. A short creditor period shows a
poor payment policy that will affect negatively liquidity position. A company enjoying
liberal credit terms will need less liquidity (Solomon, 2012).
2.3.6 Operating Efficiency
Operating efficiency means optimum use of resources. An organization can minimize its
needs for liquidity by controlling efficiently its operating costs. By increasing operating
efficiency the use of liquidity will improve and pace of cash cycle will be accelerated. Better
use of resources improves profitability and relieves the pressure on liquidity. Operating
efficiency is measured by using the Total asset to Sale ratios. This measures the proportion of
investment in assets that is required to generate the annual sales level. If the percentage is
very high, it probably shows that an organization is not being aggressive in its sales efforts
(Owolabi, 2011).
2.3.7 Price Levels Changes
Generally, rising price levels requires a higher investment in current assets. With increasing
prices the same levels of current assets requires increased investment. However, companies
which can immediately revise prices of their merchandise upwards may not face severe
working capital difficulties in periods of rising price. The impact of increasing price level
may, however, be felt differently by different companies due to fluctuation in individual
prices. It is possible that some firms may not be affected by increasing the rising price levels,
whereas others may be seriously affected by it (Padachi, 2006).
A company needs liquidity to operate profitably. The working capital of a company reflects
the short-term uses of cash. Apart from the investment in fixed assets such as buildings, plant
and equipment, funds are also required to meet day to day operating expenses and for
amounts invested in current assets. Over a period of one year there is a continuing cycle of
these assets. Cash is utilized to acquire stock, which on being sold results in cash receipt,

28
either immediately or later in case the sales are on credit. The rate of turnover of current
assets in relation to total sales of a given time period is critical to the total funds used in
those assets (Sebastian,2010).
The amount to be invested in current assets is affected by many factors and may vary over a
period of time. Production cycle, production policies, credit terms, growth and expansion
needs, and inventory turnover are some of the critical factors influencing the determination of
working capital. The management should ensure the adequacy and efficiency in the use of
working capital in order to maintain a required level of liquidity needed to meet the
company‟s compulsions as at when due. For this objective different ratios can be periodically
calculated and compared against the norms established in this respect (Amalendu, 2011).
For management efficiency of working capital, cash management is as important as the
management of other items of current assets like inventories and receivables. Too little cash
may place the company in an illiquid position, which may force the suppliers and other
claimants to stop transacting with the company. Too much cash results in funds lying idle,
thereby decreasing the overall return on capital employed below the acceptable level. An
adequate amount of funds is always needed to meet any unforeseen contingencies and also
liabilities as well as day-to-day operating expenditure of the company (Vijayakumar,2011).
2.3.8 Cash Conversion Cycle (CCC)
Liquidity management is necessary for all businesses, small, medium or large. Because, it
means collecting cash from customers in time to ensure no difficulty in paying short term
debts. Therefore, when a business does not manage its liquidity well, it will have cash
shortages and will result in difficulty in paying obligations. In this regard Ali Uyar (2009)
opines that, in addition to profitability, liquidity management is vital for ongoing concern.
Cash conversion cycle can either be positive or negative. A positive result shows the number
of days a firm must borrow or tie up capital while waiting for customer payment. A negative
result portrays the number of days a firm has received cash from sales before it must pay its
creditors (Hutchison, 2007).The ultimate objective of every manufacturing firm is having

29
low cash conversion cycle, if possible negative. Because the shorter the cash conversion
cycle, the more efficient the firm in its cash flow management.
2.4 Relationship between Liquidity and Profitability in Cement Manufacturing Firms
2.4.1 Concept of Liquidity
Liquidity is the ability of a firm to meet its expected and unexpected demands for funds
through ongoing cash flow or the sale of an asset at fair market value. Liquidity risk is the
risk which at some time a firm will not have sufficient cash or liquid assets to meet its cash
compulsions (Panigrahi,2013).
The objective of business owners and managers is to devise a strategy of managing their day
to day operations in order to meet their obligations as they fall due and increase owner‟s
wealth. The management of liquidity, in most cases, is considered from the perspective of
working capital management because the indices used for evaluating corporate liquidity are
components of working capital (Azam, 2011).
A study of liquidity is important to both the internal and the external analysts because of its
relationship with daily business operations. Requirement of liquidity of a firm depends on the
peculiar nature of the firm and there is no specific rule to determine the optimal level of
liquidity that a firm can maintain for its operations (Sandhar, 2013).
The management of liquidity determines to a great extent the growth of a firm. Inadequate
liquidity or excess liquidity may be injurious to the operations of a firm. There is controversy
in the subject of management of liquidity period. Larger companies focus on higher sales
with fewer on cash basis which leads to greater cash flow problems and seasonality while
smaller firms concern is stock management and credit management policies (Janglani, 2013).
2.4.2 Concept of Profitability
Profitability measures efficiency of management in the use of organizational resources in
adding value to the business. It may be considered as a relative term measurable in terms of
profit and its relation with other components that can directly influence the profit. It is the
relationship of income to some balance sheet measure which demonstrates the relative

30
capacity to earn income on assets. Regardless of the fact that profitability is an essential
aspect of business, it may be faced with weakness such as window dressing of the financial
transactions and the utilization of different accounting principles (Obida, 2012).
Companies are concerned with their performance in terms of profitability (Jamali, 2007).
Profitability indicates how efficiently the management can make profit by utilizing the
resources available in the business environment. Ratios of profitability are useful tools in
financial ratio analysis (Asad, 2012). These ratios help determine the firm's bottom line.
They indicate a firm's overall performance and efficiency. The efficiency of management and
profitability are taken to be positively associated: Poor current profitability may threaten
current management efficiency and vice versa; poor management efficiency may threaten
profitability (Silky, 2013). Profitability is related to the objective of shareholders‟ wealth
maximization, and investment in current assets is made only if an acceptable expected return
is obtained. Profitability can also be termed as the rate of return on investment. If there will
be an unjustifiable overinvestment in current assets then this would affect negatively the rate
of return on investment (vishnani and Shah, 2007. The concept of profitability may be
considered in two senses: public profitability and commercial/private profitability. Even
though the use of public profitability is based on economists notion of cost and benefits, i.e.,
the true opportunity cost and the benefits for the society as a whole, appears to be a more
appropriate indicator of performance of public and commercial companies.
2.4.3 Liquidity-Profitability Tradeoff
Dong (2010) pointed out that company‟ profitability and liquidity are affected by working
capital management in his study. Pooled data were selected for carrying out the research for
the period of 2006-2008 to assess firms listed in stock market of Vietnam. He used the
variables that included profitability, cash conversion cycle and its components and the
relationship that exists between these variables. The findings were that the relationships
among these variables were strongly negative. This indicated that reduction in the
profitability occur due to increase in cash conversion cycle. It was also found that if the
number of days of account receivable and inventories were shrunk then the profitability will
increase numbers of days of accounts receivable and inventories.

31
Saswata Chatterjee (2010) was concerned on the importance of current assets in the
successful running of any business. It poses direct impacts on the profitability liquidity. It
was observed in business that most of the organizations increase the margin for the profits
and losses because this act decreases the size of working capital relative to sales. However if
the organization wants to increase or improve its liquidity, then it has to increase its working
capital. In the response of this policy the company has to decrease its sales and therefore the
profitability will be affected due to this action. For this objective, 30 United Kingdom based
firms were selected which were listed in the London Stock exchange. The data covered a
period of three years from 2006 to 2008. The research analyzed the impact of the liquidity on
the profitability. The dimensions of liquidity management included in this research were
quick ratios, current ratios, cash conversion cycle, average days of payment, inventory
turnover, and average collection period. The research found that a shorter conversion cycle
was linked to better performance of the companies. Garcia-Teruel and Martinez-Salano
(2004) examined the effect of liquidity on profitability using a sample of 8872 small and
medium size Spanish companies and found that a shorter cash conversion cycle can improve
the company‟s profitability.
Mahmood and Qayyum, (2010) reported that to increase profitability of a firm and ensuring
enough liquidity to meet short term liabilities as they fall due are two main goals of liquidity
management.
Eljelly (2004) studied the relationship between liquidity and profitability by using regression
correlation analysis. He found that the cash conversion cycle was of more importance as a
measure of liquidity than the current ratio that impacts profitability. Raheman (2007)
examined the effect of different variables of liquidity management including current ratio,
quick ratio, cash ratio, the receivables collection period, inventory turnover in days, payables
payment period, cash conversion cycle on the net operating profitability of Pakistani
companies. By using Pearson‟s correlation and regression analysis he found a strong negative
relationship between cash conversion cycle and profitability. He also noted that as the cash
conversion cycle increases, it leads to reduction in profitability of the company and managers
can create a positive value for the shareholders by minimizing the cash conversion cycle.

32
Gill, Biger, and Mathur (2010) examined 88 companies of Network. The study covered three
years from 2005 to 2007.To establish the relationship of profitability with liquidity
management, they considered independent variables as accounts receivables, accounts
payables, cash conversion cycle and inventory while dependent variable was gross operating
profit. The regression analysis was utilized to carry out the study. They concluded that if the
collection period of accounts receivable is greater, then profitability will decrease.
Izadinia and Taki (2010) examined the impact of liquidity management on profitability
potential of firms listed in Tehran Stock Exchange during the period of 2001-2008. In their
research, the dependent variable included, return on total assets considered as measure of
profitability potential. The findings denoted that there is a significant negative relationship
between return on assets with cash conversion cycle which is a factor that influence the level
of liquidity in an organization. They also stated that high investment in inventory and
accounts receivable will lead to a decreased profitability of the firms.
An organization in order to remain in business and sustain its operations as a going concern
must remain liquid and meet its compulsions as and when they become due. Even though
organizations traditionally are focused on long term capital budgeting and capital structure,
the recent trend is that many of them across different industries focus on liquidity
management efficiency (Barad, 2010). When there is a poor liquidity management, cash may
be unnecessarily tied up in idle assets. This will decrease liquidity of the organization and it
will not be in a position to invest in productive assets like plant and machinery. The
profitability of the organization will also be affected (Panigrahi, 2013).
Singh and Pandey (2008) proposed that, for the successful activities of any business
organization, fixed and current assets play a key role, and that the management of liquidity is
important as it has a direct influence on liquidity and profitability. They examined the
liquidity management elements and found a significant impact of liquidity management on
profitability. Kevin and Young (2009) took a hard look at the way organization manages its
funds. They reported that a lot of capital tied up in receivables and inventory could be turned
into cash by challenging the liquidity management practices and policies of the organization.

33
2.5 Chapter Summary
Chapter Two looked at the literature review on liquidity management and profitability of
manufacturing companies. Literature was examined on measures of liquidity, factors that
influence liquidity requirement and relationship between liquidity and profitability. The
following chapter that is chapter three deals with research methodology that was used in this
study particularly the research design, the population, research procedures, data collection
and analysis.

34
CHAPTER THREE
3.0 RESEARCH METHODOLGY
3.1 Introduction
This chapter presents the research methodology that was used in this study. Section 3.2
discusses the research design, section 3.3 the population to be studied, sample and sampling
techniques are identified. Section 3.4 is data collection methods, section 3.5 is research
procedures and section 3.6 is the data analysis. Section 3.7 summarizes the chapter.
3.2 Research Design
Research design is concerned with producing a plan that guides the research process (Wilson,
2010). Blumberg (2005) also highlighted the fact that an essential part of research design is
that of a time-based plan which constitute longitudinal and cross sectional research design.
According to Cooper and Schindler (2008), research design is „‟the blueprint for the
collection, measurement and analysis of data,‟‟ but warn that it is a wide-ranging concept.
The research design is the strategy or plan which is used to acquire participants or subjects,
and how to collect what type of data from them, in order to arrive at conclusions about the
initial research question. Research design sets the scope of the study specifying whether it
needs to be descriptive, explanatory (or causal) or predictive.
This study applied a descriptive research design. According to Cooper and Schindler (2008),
a descriptive study tries to discover answers to the questions who, what, when, where and
sometimes, how. Descriptive research is used when the researcher attempts to describe or
define a subject often by creating a profile of a group of problems, people or events. The
study used secondary data that was obtained from financial statements of cement
manufacturing companies listed on Nairobi Securities Exchange.
This approach helped the researcher to gain knowledge about the relationship between
liquidity and profitability of a cement manufacturing firm in Kenya. As the study needed
historical financial data, which are from corporate reports, accessing publicly available data
was assumed as suitable method for the accuracy of the data. In this research the dependent
35
variable is defined as the profitability of the cement manufacturing companies. The
independent variable is liquidity which was measured in terms of financial ratios.
3.3 Population and Sampling Design
3.3.1 Population
Defining a population is not always straightforward; it largely depends on the research
questions and the context of the study. Wilson (2010) contends that definition of population
should establish the types of cases that compose the population of interest such as
individuals, firms, households and the like. In this view, the population is a clearly defined
group of research subjects that is being sampled, which implies the entire set of cases from
which the sample is drawn. Consistently, Cooper and Schindler (2011) give a more
comprehensive definition of the population and define population as “the total collection of
elements, about which we wish to make some statistical inferences”. The population of
interest in this study consisted of three cement manufacturing companies and was obtained
from Nairobi Security Exchange.
3.3.2 Sampling Design
3.3.2.1 Sampling Frame
The literature shows that sampling frame is a reflection of population. It is a complete list of
the population of interest in the study area. This is not necessarily the complete population of
the country or area being studied, but is restricted to the eligible population. Cooper and
Schindler (2011) noted that the sample frame is the list of cases from which the sample is
actually drawn. In this case the sampling frame must be representative of the population in
terms of the characteristics under investigation. The sample frame for this study included
cement manufacturing firms listed on Nairobi Stock Exchange.
3.3.2.2 Sampling Techniques
Sampling is the part of statistical practice concerned with taking up a subset of cases from a
chosen sample frame or entire population of individuals intended to yield some knowledge
about the population of interest. Samples can be used to make inference about a population or
to make generalizations in relation to existing theory (Tabachnick and Fidell, 2007).
Different studies rarely survey the entire population for at least three reasons: the cost is too

36
high, it is a time consuming exercise, and the dynamic nature of the population of which the
individuals make up, may change over time (Wilson, 2010). Some of the clearly feasible
advantages of sampling are lower cost, faster data collection, and since the data set is smaller,
it is possible to ensure homogeneity and improve the accuracy of the data (Cooper and
Schindler, 2011).
There are several alternative procedures of taking a sample from a population or sample
frame. Basically, the two broad types of sampling are the probability (random) and non-
probability (non-random) sampling (Wilson, 2010). The probability sampling allows the
employment of tests of statistical significances that permit inferences to be made about the
population from which the sample was selected (Bryman and Bell, 2007; Tabachnick and
Fidell, 2007). Moreover, the probability sampling means that every case in the population or
in the sampling frame has an equal chance of being included in the sample and it has the
greatest freedom from bias although it may represent the most costly sample in terms of time
and energy for a given level of sampling error (Zikmund, 2003). There are several different
types of probability sampling techniques such as simple randomly sampling, systematic
sampling, stratified random sampling, cluster sampling and multi-stage sampling (Wilson,
2010). However this study adopts a quantitative methodology in view of the nature of the
variables used for analyses. There are only three cement companies listed on Nairobi
Securities Exchange. Hence a census research method was carried out purposively using
these three listed cement manufacturing companies.
3.3.2.3 Sample Size
Different scholars indicate different procedures to determine sample size. Blumberg, Cooper
and Schindler (2008) indicate that the sample size can be dictated by considering the cost
implied to collect data, greater accuracy and the speed required for data collection. However,
Sekaran (2006) argues that the sample size is governed by the extent of precision and
confidence desired, but concludes that the eventual choice is usually a trade-off between
confidence and precision. This view-point is supported by Cooper and Schindler (2011) who
recommend that since researchers can never be 100 percent certain that a sample reflects its
population; they must decide how much precision they need and in making this decision,
they must consider at least four factors: the confidence needed in data, the margin of error

37
that can be tolerated, the types of analysis to be performed, the level of variability in the
population on the characteristic of interest.
In this study, a sample size is determined after considering accessibility, convenience, cost
and availability of the information. For the objective of this study, a list of three cement
companies listed on Nairobi Securities Exchange was purposefully selected.
3.4 Data Collection Methods
Malhotra and Birks (2006) distinguish between primary and secondary data collection and
consider primary data as information collected by the researcher in an effort to address or
resolve the specific problem they identified for the research project. They define secondary
data as information that has been collected for other purposes.
This study adopted a quantitative methodology in view of the nature of the variables used for
analyses. The study used secondary data to achieve the objective of the research. The
secondary data was extracted from the annual financial statements of the sampled companies
using the websites.
3.5 Research Procedures
The study used three listed cement companies of Kenyan Cement Industry namely Athi River
Mining Limited (ARML), Bamburi Cement Limited (BMBC), East African Portland Cement
Company Limited (EAPC).The data required for this study has been collected from the
published annual reports of the selected listed companies and website. Data was collected
using data collection sheet. Data was analyzed through descriptive statistics, regression and
correlation analysis to find out relationship between liquidity and profitability. Listed
companies were appropriate for the study since they are public entities operating under strict
governance regulations, making their financial and accounting disclosures largely reliable.
The research covered a period of five years from 2008 to 2012.The techniques used in this
research were ratio analysis, percentage method, mean, standard deviation, coefficient of
variation, correlation coefficient and regression coefficient .

38
3.6 Data Analysis Method
Importantly, the data should be accurate, complete and suitable for further analysis (Sekaran
and Bougie, 2010).Researcher has to record and arrange the data and then apply various
descriptive and inferential statistics or econometrics concepts to explain the data and draw
inferences (Saunders, 2009).
According to Lind (2008), researchers can use number of descriptive statistics concepts to
explain data such as frequency distributions or cumulative frequency distributions, frequency
polygons, histograms, various types of charts like bar charts and pie charts, scatter diagrams,
box plots etc.
Pearson Coefficient of Correlation is the most commonly used measure of finding correlation
between two or more variables. A correlation exists between two variables when one of them
is related to the other in some way. The value of coefficient of correlation r always lies
between -1 and +1 inclusive. If it lies near to -1, it shows a strong negative correlation but if
it lies near to +1, it shows a strong positive correlation (Rubin, 2007).
Regression models can be used in an explanatory study where researcher is interested in
predicting the value of dependent variable based on the value of independent variable.
Researcher can use simple linear regression, if the number of independent variables in the
study is only one while in case of more than one independent variables in the study,
researcher has to make use of multiple regression models (Wagner, 2007).
In this study, a total number of three successful cement manufacturing companies were
identified during the year of determination (2008-2012).The name of successful firms are
Athi River Mining Limited (ARML), Bamburi Cement Limited (BMBC), East African
Portland Cement Company Limited (EAPC).Profitability of selected companies was
considered as dependent variable. The independent variables are current ratio, quick ratio and
cash conversion cycle, which were taken as the main independent variables to test their
impact on return on capital employed. The dependent variable in the study is corporate
profitability which is measured here by the Return on Capital Employed (ROCE) and is

39
defined as ROCE=Profit before Interest and Tax (PBIT)/Capital Employed. Multiple
regression analysis used the following model:
ROCE = £ + ß1CR + ß2 QR + ß3 CCC
Where £, ß1, ß2, and ß3 are the parameters of the ROCE
Current Ratio (CR)=Current Assets/Current Liabilities
Quick Ratio= (Cash&Equivalents+Short term Investments+Accounts receivables)/Current
Liabilities
Cash Conversion Cycle = Receivables Collection Period + Inventory Turnover Period –
Payables deferral Period
The cash conversion cycle is calculated thus:
Cash Conversion Cycle = Receivables Collection Period + Inventory Turnover Period –
Payables payment period
The variables of cash conversion cycle were defined as the following:
Receivables Collection Period = (Accounts receivables/Sales)*365
Inventory Turnover Period = (Inventories/Cost of sales) *365
Payables payment period =(Accounts Payables/Cost of Goods Sold)*365.
Cash conversion cycle may be either negative or positive. A positive cash conversion cycle
shows the number of days a firm must borrow or tie up capital while waiting for payment
from customers. A negative cash conversion cycle shows the number of days a firm has
received cash from sales before it must pay its creditors (Hutchison, 2007).The objective of
every manufacturing firm is having low cash conversion cycle, preferably negative. Because
the shorter the cash conversion cycle, the more efficient the firm in managing the cash flow.
A regression analysis of the factors that affect liquidity management in cement companies
was used to investigate the impact of cash conversion cycle on current ratio which is a
measure of liquidity. Cash conversion cycle was seen as one of the factors that influence

40
liquidity requirement of a firm. Current ratio is taken as dependent variable influenced by
cash conversion cycle which is taken as independent variable and represents operating
decisions related to the level of current assets and liabilities.
Descriptive techniques are used. Quantitative data analysis is performed by descriptive
statistics where SPSS and Microsoft excel were used to obtain percentages, tabulations and
measures of central tendency. Tables are drawn to represent the data collected for ease
understanding and analysis. The data is analyzed through the regression analysis to find out
the impact of liquidity on profitability and the impact of cash conversion cycle on current
ratio. Multiple correlation analysis was used to find out the relationship between profitability
and liquidity.
3.7 Chapter Summary
This chapter provided a summary of the research methodology that was used in this study.
The chapter described the research design, population and sampling design. Data collection
method and data analysis have been mentioned in this chapter. Results and findings will be
discussed in the next chapter, which is chapter four.
41
CHAPTER FOUR
4.0 RESULTS AND FINDINGS
4.1 Introduction
This chapter presents the research findings and analysis of the results. The findings are
presented based on the research questions as mentioned in chapter one. The data used in this
study was extracted from the financial statements of selected firms from the Company
Annual Report accessible from the Nairobi Securities Exchange database. Descriptive
statistics was presented in section 4.2, Section 4.3 examined measures of liquidity
management. Section 4.4 addressed factors influencing liquidity management and
relationship between liquidity and profitability analysis was addressed in section 4.5.
Multiple regressions and multiple correlations were used to analyze and interpret the results.
4.2 Description of the Companies
Bamburi Cement Limited (BMBC) was established in 1951 with first plant located in
Mombasa starting cement manufacture in 1954. The company was listed on the Nairobi
Securities Exchange in September 1970.BMBC is the largest cement producer (KNBS,
2012).BMBC shareholders are Old Mutual Life Insurance Company, key local institutions
such as the National Social Security Fund (NSSF), Kenya Reinsurance Corporation, Fincem
Holding Limited and Kencem Holding Limited through Lafarge Group (the world largest
cement manufacturer) owns 58.6% of BMBC.
Athi River Mining Limited (ARML) started its activities in 1974 and was listed on the
Nairobi Stock Securities in 1997. The company is currently the third leading cement
manufacturer in Kenya in terms of market share .The top ten shareholders of ARML largely
include institutions which have a combined shareholding of 64 %.
East Africa Portland Cement Company Limited (EAPC) is the oldest cement producer in
Kenya and was established in 1933.EAPC commenced its activities as a trading company,
importing cement for early construction work in East Africa in 1956 built its first factory in
Athi River. The structure of EAPC‟s shareholding is largely institutionally, with the

42
company‟s top ten shareholders owning a combined 96.1 percent shares in the company. The
treasury and NSSF are the company‟s shareholders holding 27 percent and 25.3 percent
respectively.
4.2.1 Turnover
Table 4.1: Turnover in Kshs ‘000’
Company
Name
2008 2009 2010 2011 2012 Growth rate
ARML 4,619,473 5,144,822 5,964,670 8,180,992 11,400,569 147%
BMBC 27,467,000 29,994,000 28,075,000 35,884,000 37,491,000 36%
EAPC 7,204,479 8,101,377 9,408,711 10,172,140 8,614,806 20%
Table 4.1 shows that from 2008 to 2012, the turnover of the companies in study has shown a
growth rate of around 147 percent, 36 percent and 20 percent for Athi River Mining Limited,
Bamburi Cement Limited and EAPC respectively .The turnover of ARML Company showed
a steady fast growth than other companies. From the above table, it is clear that ARML
controls the market in term of turnover.
4.2.2 Profit after Tax
Table 4.2: Profit after Tax in Kshs ‘000’
Company
Name
2008 2009 2010 2011 2012 Growth rate
ARML 503,454 645,774 1,075,268 1,150,498 1,245,638 147%
BMBC 3412,000 6,970,000 5,299,000 5,859,000 4,882,000 43%
EAPC 536,652 1,834,054 (284,051) 1,717 (821,486) -253%
Table 4.2 shows a growth rate of 147 percent for ARML and 43 percent for BMBC from
2008 to 2012. The EAPC has shown a negative growth of 253 percent from 2008 to
2012.From the above table, it is clear that ARML is leading in term of profitability during the
period under study.

43
4.2.4 Total Assets
Table 4.3: Total Assets in Kshs’000’
Company
Name
2008 2009 2010 2011 2012 Growth rate
ARML 6,352,478 12,141,091 16,564,900 20,515,940 26,953,100 324%
BMBC 28,215,000 32,112,000 33,306,000 33,502,000 43,038,000 53%
EAPC 9,073,345 12,035,963 12,037,565 13,530,871 14,091,006 55%
Table 4.3 shows that the growth rate of total assets was 324 percent in case of ARML
company which is more than three times of the growth rate of assets in last five years. The
growth rate of total assets was 53 percent for BMBC and 55 percent for EAPC. This also
showed a steady growth of these companies for the period of the study. From the above table,
it is clear that ARML is leading in terms of total assets during the period under study.
4.2.5 Total Liabilities
Table 4.4: Total Liabilities in Kshs’000’
Company
Name
2008 2009 2010 2011 2012 Growth rate
ARML 4,224,935 8,012,161 11,638,041 14,413,414 19,832,580 369%
BMBC 11,613,000 11,171,000 11,680,000 9,328,000 12,177,000 5%
EAPC 5,046,596 5,933,711 6,336,364 7,827,953 9,251,616 83%
Table 4.4 shows that the growth rate of total liabilities of Athi River Mining Limited was 369
percent which is more than three times of the growth of liabilities from 2008 to 2012.
Bamburi Cement showed a growth rate of 5 percent. The growth rate of EAPC was 83
percent from 2008 to 2012.

44
4.2.6 Shareholders Funds
Table 4.5: Shareholders Funds in Kshs ‘000’
Company
Name
2008 2009 2010 2011 2012 Growth rate
ARML 2,127,531 4,128,930 4,945,425 5,998,657 7,013,771 230%
BMBC 16,602,000 20,941,000 21,626,000 24,174,000 30,861,000 86%
EAPC 4,026,749 6,102,252 5,701,201 5,702,918 4,839,390 20%
Table 4.5 shows that from 2008 to 2012, the shareholders‟ funds have shown a growth rate of
230 percent for Athi River Mining Limited Company, which is more than twice the growth
rate of equity during the study period. The equity growth of Bamburi Cement was 86 percent.
The equity growth of EAPC was 20 percent during the study period.
4.3 Descriptive Statistics.
Trends in the liquidity and profitability ratios from 2008 to 2012 are presented in table
4.6.
Table 4.6: Trends in the Liquidity and Profitability Ratios (2008-2012)
Year Current Ratio
Return on Capital
Employed Quick Ratio
Cash Conversion
Cycle(in days)
2008 1.71 25% 1.02 52
2009 1.89 20% 1.32 42
2010 1.69 14% 1.2 26
2011 1.66 16% 1.02 33
2012 1.58 12% 0.89 46
The average current ratio of selected companies is explained in table 4.6.The ratio ranged
between 1.71 and 1.58 with a decreasing trend during the study period except in year 2009.
On average, the ratio is below the standard conventional rule of 2:1 which means that the
selected companies did not maintain the standard of 2:1

45
The average quick ratio of selected companies is also manifested in the table 4.6. The ratio
showed progressive and fluctuating trend during the study period. The ratio showed that
during the study period selected companies maintained the quick ratio according to the norms
except in 2012, where the average ratio of 0.89 was below the standard conventional rule of
1:1.
The Cash Conversion Cycle (CCC) of selected firms was shown in table 4.6. The CCC was
on decreasing trend during the whole period under study. This showed that selected firms
were better managing the length of time between when they made payment and when they
received cash inflow. The Return on Capital Employed (ROCE) of selected firms was
depicted in table 4.6.The results showed a decreasing trend in profitability during the study
period.
4.4 Measures of Liquidity Management
4.4.1 Liquidity Position based on Current Ratio
Descriptive statistics are depicted in Table 4.7.
Table 4.7: Descriptive Statistics based on Current Ratio
ARML BMBC EAPC
Computed industry
average/Standard
Mean 1.17 2.22 1.7 2:1
Standard Deviation 0.35 0.42 0.4 0.39
Coefficient of Variation (%) 0.3 0.18 0.25 0.24
Table 4.7 shows that current ratio of BMBC during the period of study is satisfactory as its
mean value is 2.22 which is slightly higher than the standard conventional rule of 2:1 which
is taken as yardstick. This indicates the company is able to meet its matured current
obligations in every year under the study period. This ratio in case of ARML and EAPC is
1.17 and 1.7 respectively. This ratio is poor because it is below the standard conventional
rule of 2:1 throughout the study period. This shows that they have not been able to meet their
short term obligations over the study period.
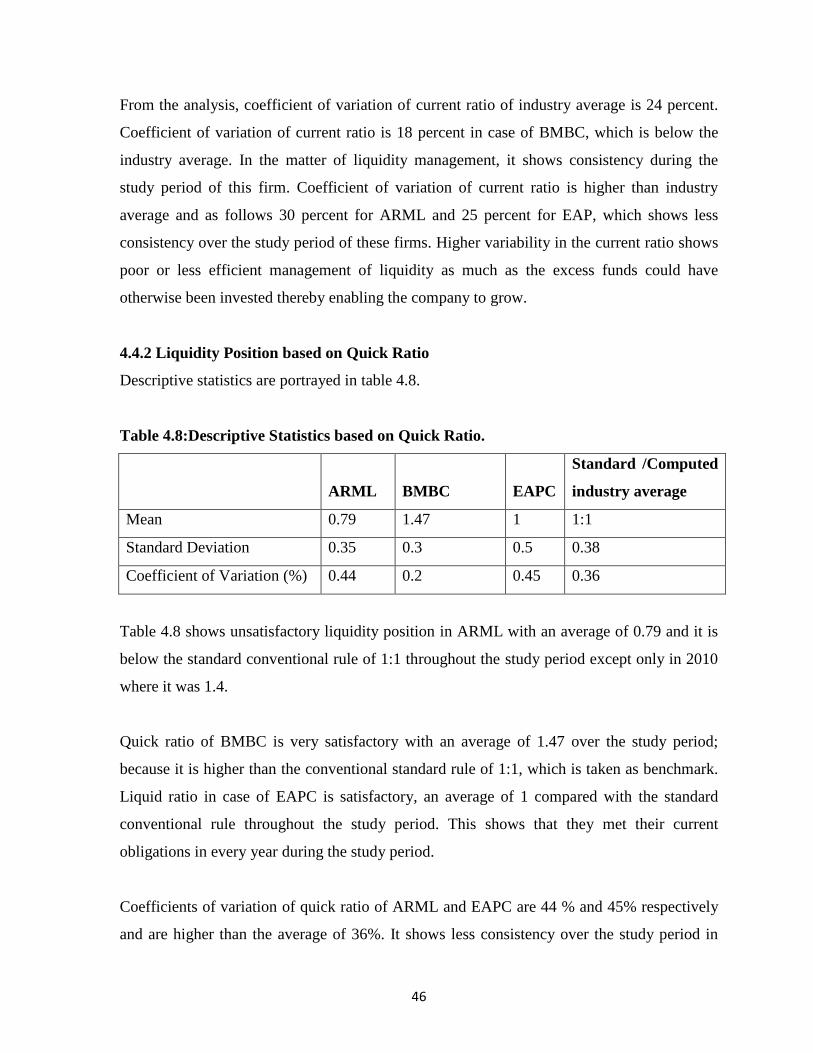
46
From the analysis, coefficient of variation of current ratio of industry average is 24 percent.
Coefficient of variation of current ratio is 18 percent in case of BMBC, which is below the
industry average. In the matter of liquidity management, it shows consistency during the
study period of this firm. Coefficient of variation of current ratio is higher than industry
average and as follows 30 percent for ARML and 25 percent for EAP, which shows less
consistency over the study period of these firms. Higher variability in the current ratio shows
poor or less efficient management of liquidity as much as the excess funds could have
otherwise been invested thereby enabling the company to grow.
4.4.2 Liquidity Position based on Quick Ratio
Descriptive statistics are portrayed in table 4.8.
Table 4.8:Descriptive Statistics based on Quick Ratio.
ARML BMBC EAPC
Standard /Computed
industry average
Mean 0.79 1.47 1 1:1
Standard Deviation 0.35 0.3 0.5 0.38
Coefficient of Variation (%) 0.44 0.2 0.45 0.36
Table 4.8 shows unsatisfactory liquidity position in ARML with an average of 0.79 and it is
below the standard conventional rule of 1:1 throughout the study period except only in 2010
where it was 1.4.
Quick ratio of BMBC is very satisfactory with an average of 1.47 over the study period;
because it is higher than the conventional standard rule of 1:1, which is taken as benchmark.
Liquid ratio in case of EAPC is satisfactory, an average of 1 compared with the standard
conventional rule throughout the study period. This shows that they met their current
obligations in every year during the study period.
Coefficients of variation of quick ratio of ARML and EAPC are 44 % and 45% respectively
and are higher than the average of 36%. It shows less consistency over the study period in

47
these firms. In case of BMBC, coefficient of variation of quick ratio is twenty percent and is
lower than computed industry average. In the matter of liquidity management, it shows
consistency in this firm over the study period because it is below the average coefficient of
variation of 36%.
4.5 Factors that Affect Liquidity Requirement of a Cement Manufacturing Firm
4.5.1 Liquidity Position based on Age of Inventory
Descriptive statistics is tabulated in Table 4.9
Table 4.9: Descriptive Statistics based on Age of Inventory
ARML BMBC EAPC
Computed industry
average
Mean 109 77.64 68.9 85.18
Standard Deviation 22.78 15.42 13.1 17.1
Coefficient of Variation (%) 0.21 0.20 0.19 0.20
Maximum 148 101 83 111
Minimum 93 61 52 69
As per Table 4.9, age of inventory shows very satisfactory trend in case of BMBC and EAPC
under the study as compared to grand average of 85.18. Age of inventory in case of ARML is
higher than the computed average throughout the study period due to inefficient inventory
control policy.
Coefficient of variation of the age of inventory of BMBC is 20% and EAPC 19% which
shows consistency in the case of liquidity management because the computed coefficient of
variation is 20%. Coefficient of variation in case of ARML is 21 percent .This indicates less
consistency in liquidity management.

48
4.5.2 Liquidity Position based on Age of Receivables
Descriptive statistics is shown in table 4.10.
Table 4.10: Descriptive Statistics based on Age of Receivables days
ARML BMBC EAPC Computed industry average
Mean 74 21.2 28.4 41.2
Standard Deviation 8.38 5.46 4.4 6.08
Coefficient of Variation (%) 0.11 0.257 0.155 0.174
Maximum 83 28 79 63
Minimum 62 15 35 37
Table 4.10 shows that the age of receivables fluctuates between 62 days to 83 days with an
average of 74 days for ARML. This shows that the receivable collection period was
unsatisfactory. This ratio is satisfactory in case of BMBC and EAPC because its average
during period of study comes to 21.2 days and 28.4 days respectively.
Table 4.10 shows perfect consistency in case of these companies because in the industry, as a
whole, coefficient of variation is 17.4%.While coefficient of variation of the age of
receivables of ARML and EAPC is 11% and 15.5% respectively. There is consistency in case
of these firms. In case of BMBC, the coefficient of variation is 25.7% which is greater than
the coefficient of variation of the whole industry. There is less consistency in case of this
firm.
4.5.3 Liquidity Position based on Age of Payables:
Age of creditors of operating three cement companies is furnished in table 4.11.
Table 4.11: Descriptive Statistics based on Age of Payables
ARML BMBC EAPC
Computed
industry average
Mean 105 80.22 74.1 86.4
Standard Deviation 14.24 16.35 3.3 11.3
Coefficient of Variation (%) 0.14 0.2 0.044 0.1
Maximum 125 103 71 100
Minimum 90 57 4 50

49
Table 4.11 shows that average age of creditors in case of ARML is very high (105 days),
which indicates better management of the liquidity. Table 4.11 also exposed that BMBC and
EAPC have shortened period. It indicates very satisfactory short-term liquidity for ARML
and poor short-term liquidity for BMBC and EAPC.
Coefficient of variation of age of creditors of EAPC is 4.4% lower than whole industry
average of 10%. It is an indication of consistency in this firm. In liquidity management
perspective, it shows more consistency in this firm during the study period because it is lower
than the industry average which is ten percent. There is lower variability in the age of
creditors indicating efficient management of payables payment period.
ARML and BMBC show coefficient of variation of payables of 14% and 20 % respectively.
These coefficients are higher than whole industry average. In liquidity management
perspective, it is an indication of less consistency in these firms over the study period
because it is higher than the coefficient of variation of the industry which is 10 percent. It is
clear that there is a higher variability in the age of payables indicating poor payables
management.
4.5.4 Impact of Cash Conversion Cycle on Liquidity measured by Current Ratio
4.5.4.1 Impact of Cash Conversion Cycle on Current Ratio in ARML
Results of regression analysis have been depicted in Table 4.13
Table 4.12:.Summary of CR and CCC of ARML
Year Current Ratio Cash Conversion Cycle
2008 1.02 75
2009 1.03 89
2010 1.75 78
2011 0.84 51
2012 1.22 96

50
Table 4.12 shows that the current ratio of ARML was below the ideal rule of thumb 2:1.This
indicated an unsatisfactory liquidity position of the company during the years of study. Table
4.12 also shows that cash conversion cycle of ARML was on increasing trend from 75 days
in 2008 to 96 days in 2012 except in 2011 where it was 51 days. This indicated that the
company was taking longer to recover cash.
Table 4.13: Model summary of dependent variable (CR)
Model R R Square Adjusted R
square
Standard Error of the
estimate
1 0.36
0.13
-0.16
0.38
Table 4.13 shows that the value of R² is 13percent.This indicates that about 13% of variation
in current ratio is explained by the independent variable included in the model which is cash
conversion cycle. This result indicates that cash conversion cycle influences the level of
current ratio.
4.5.4.2 Impact of Cash Conversion Cycle on Current Ratio in BMBC
Results of regression analysis have been depicted in Table 4.15
Table 4.14:Summary of CR and CCC of BMBC
Year Current Ratio Cash Conversion Cycle
2008 1.84 47
2009 2.58 31
2010 1.72 -12
2011 2.62 18
2012 2.35 9
Table 4.14 shows that the current ratio of BMBC was on steady growth from 1.84 in 2008 to
2.35 in 2012 except in 2010 where it was 1.72.For the last two years of the study period, the
current ratio of the company was higher than the ideal rule of thumb 2:1.This indicated a

51
satisfactory liquidity position of the company. Table 4.14 also shows that cash conversion
cycle of BMBC was on decreasing trend from 47 days in 2008 to 9 days in 2012. This
indicated that the company was shortening the period to recover cash. In 2010, the company
received cash from sales 12 days before it paid its creditors.
Table 4.15: Model summary of dependent variable (CR)
Model R R Square Adjusted R
square
Standard Error of the
estimate
1 0.20
0.04
-0.28
0.47
Table 4.15 shows that the value of R² is 4%.This indicates that about 4% of variation in
current ratio is explained by the independent variable included in the model which is cash
conversion cycle. This result indicates that cash conversion cycle influences the level of
current ratio.
4.5.4.3 Impact of Cash Conversion Cycle on Current Ratio in EAPC
Results of regression analysis have been depicted in Table 4.17
Table 4.16: Summary of CR and CCC of EAPC
Year Current ratio Cash Conversion Cycle
2008 2.3 35
2009 2.1 4
2010 1.6 13
2011 1.5 31
2012 1.2 34
Table 4.16 shows that the current ratio of EAPC was on decreasing trend during the period of
the study. This indicates that the liquidity position of the company has been degrading over
the years. Table 4.16 also shows that the cash conversion cycle of the company was on
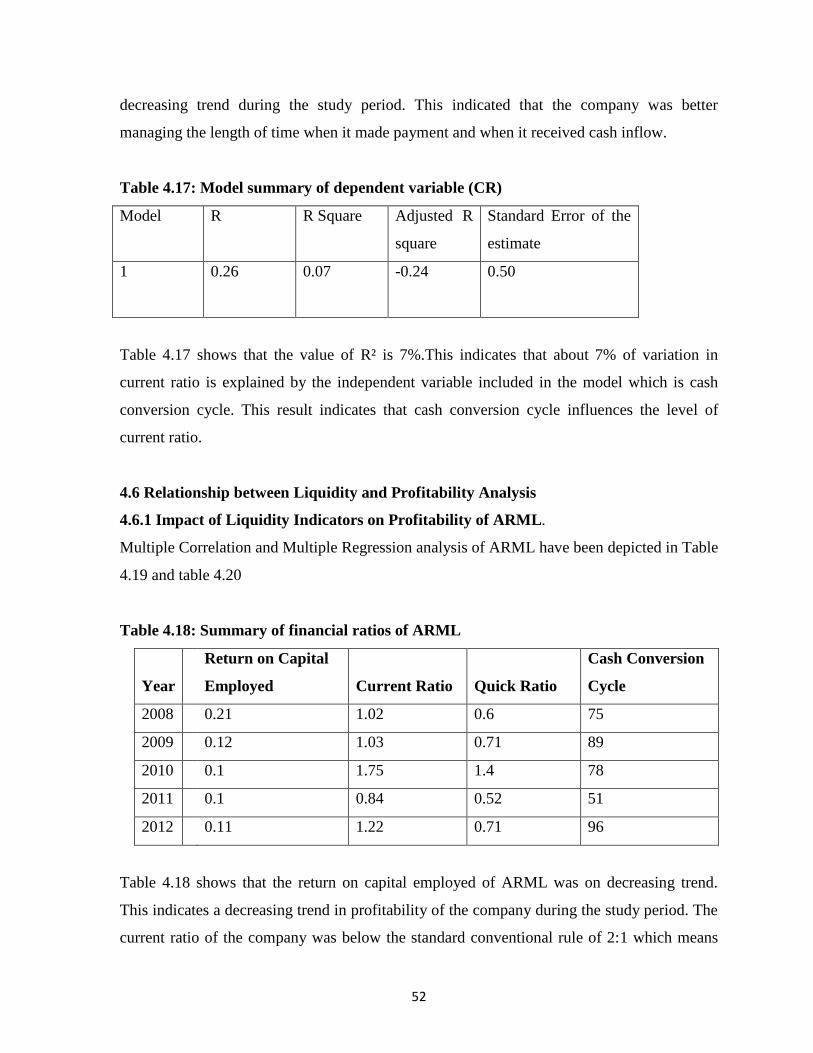
52
decreasing trend during the study period. This indicated that the company was better
managing the length of time when it made payment and when it received cash inflow.
Table 4.17: Model summary of dependent variable (CR)
Model R R Square Adjusted R
square
Standard Error of the
estimate
1 0.26
0.07
-0.24
0.50
Table 4.17 shows that the value of R² is 7%.This indicates that about 7% of variation in
current ratio is explained by the independent variable included in the model which is cash
conversion cycle. This result indicates that cash conversion cycle influences the level of
current ratio.
4.6 Relationship between Liquidity and Profitability Analysis
4.6.1 Impact of Liquidity Indicators on Profitability of ARML.
Multiple Correlation and Multiple Regression analysis of ARML have been depicted in Table
4.19 and table 4.20
Table 4.18: Summary of financial ratios of ARML
Year
Return on Capital
Employed Current Ratio Quick Ratio
Cash Conversion
Cycle
2008 0.21 1.02 0.6 75
2009 0.12 1.03 0.71 89
2010 0.1 1.75 1.4 78
2011 0.1 0.84 0.52 51
2012 0.11 1.22 0.71 96
Table 4.18 shows that the return on capital employed of ARML was on decreasing trend.
This indicates a decreasing trend in profitability of the company during the study period. The
current ratio of the company was below the standard conventional rule of 2:1 which means

53
that the liquidity position of the company was unsatisfactory. Quick ratio of the company
was unsatisfactory during the study period except in 2010 where it was higher than the ideal
rule of thumb i.e 1:1.The cash conversion cycle of ARML was on increasing trend from 75
days in 2008 to 96 days in 2012 except in 2011 where it was 51 days. This indicated that the
company was taking longer to recover cash.
Table 4.19: Model Summary of dependent variable (ROCE)
Model R R Square Adjusted R
square
Standard Error of the
estimate
1 0.41 0.17 2.32 0.08
Table 4.19 provides R and R² values. R value is 0.41 which represents multiple correlations
between variables. R² value is 0.17 and indicates how much of the dependent variable
(ROCE) can be explained by the independent variables (CR,QR, CCC).This shows that there
is a relationship between return on capital employed and current ratio, quick ratio and cash
conversion cycle.
Table 4.20 ANOVA of dependent variable (ROCE)
Model Df SS MS F Sig
Regression 3 0.001478359
0.000492786
0.06842694
0.968487379
Residual 1 0.007201641
0.007201641
Total 4 0.00868
Sum of squares (SS).Mean Square (MS)
The overall significance of the model was assessed by Analysis of Variance or ANOVA
(Table 4.20).The results indicate that our model is statistically insignificant as exemplified in
the F value of 0.068 and a P-value superior to 5%.
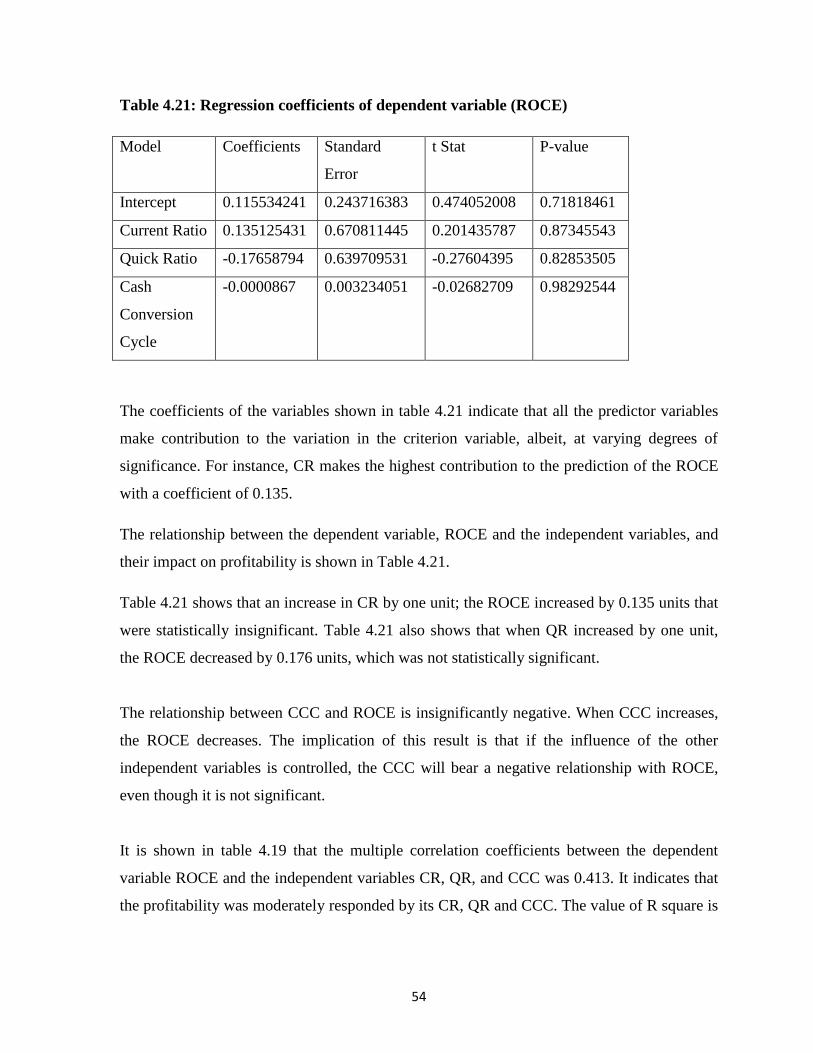
54
Table 4.21: Regression coefficients of dependent variable (ROCE)
Model Coefficients Standard
Error
t Stat P-value
Intercept 0.115534241 0.243716383 0.474052008 0.71818461
Current Ratio 0.135125431 0.670811445 0.201435787 0.87345543
Quick Ratio -0.17658794 0.639709531 -0.27604395 0.82853505
Cash
Conversion
Cycle
-0.0000867 0.003234051 -0.02682709 0.98292544
The coefficients of the variables shown in table 4.21 indicate that all the predictor variables
make contribution to the variation in the criterion variable, albeit, at varying degrees of
significance. For instance, CR makes the highest contribution to the prediction of the ROCE
with a coefficient of 0.135.
The relationship between the dependent variable, ROCE and the independent variables, and
their impact on profitability is shown in Table 4.21.
Table 4.21 shows that an increase in CR by one unit; the ROCE increased by 0.135 units that
were statistically insignificant. Table 4.21 also shows that when QR increased by one unit,
the ROCE decreased by 0.176 units, which was not statistically significant.
The relationship between CCC and ROCE is insignificantly negative. When CCC increases,
the ROCE decreases. The implication of this result is that if the influence of the other
independent variables is controlled, the CCC will bear a negative relationship with ROCE,
even though it is not significant.
It is shown in table 4.19 that the multiple correlation coefficients between the dependent
variable ROCE and the independent variables CR, QR, and CCC was 0.413. It indicates that
the profitability was moderately responded by its CR, QR and CCC. The value of R square is

55
0.17.This means that 17 percent of variation in ROCE was explained by the independent
variables CCC, CR and QR
4.6.2 Impact of Liquidity Indicators on Profitability of BMBC
Table 4.23 and table 4.25 show multiple regressions and multiple correlations analysis of
BMBC.
Table 4.22: Summary of financial ratios for BMBC
Year
Return on Capital
Employed Current Ratio Quick Ratio
Cash Conversion
Cycle
2008
0.36 1.84 1.08 47
2009
0.35 2.58 1.71 31
2010
0.3 1.72 1.25 -12
2011
0.31 2.62 1.78 18
2012
0.21 2.35 1.55 9
Table 4.22 shows a decreasing trend in profitability of BMBC during the study period.
Liquidity position of the company was satisfactory as it is shown by the increasing trend of
quick ratio which was higher than the standard conventional rule of 1:1. Cash conversion
cycle was on decreasing trend and shows that the company was better managing the length of
time between when it made payment and when it received cash.
Table 4.23: Model summary of dependent variable (ROCE)
Model R R Square Adjusted R
square
Standard Error of the
estimate
1 0.999869 0.999738 0.99895 0.001925
Predictor: CR, QR, CCC. Dependent Variable: ROCE

56
Table 4.23 shows that R value is 0.99 and shows a high degree of correlation between
variables.R² is 0.99 and indicates that 99% of variation in ROCE is explained by the
independent variables CR, QR and CCC.
Table 4.24: ANOVA of dependent variable (ROCE)
Model Df SS MS F Sig
Regression 3 0.014116294 0.004705431 1269.643469 0.020627
Residual 1 3.70610444 3.70610444
Total 4 0.01412
Table 4.24 assesses the overall significance of the model. The results indicate that the model
is statistically significant as exemplified in the F value of 1269.6 and a P-value below to 5 %.
Table 4.25: Regression coefficients of dependent variable (ROCE)
Model Coefficients
Standard
Error
t Stat
P-value
Intercept
0.443821
0.005524275
80.34017231
0.007923644
Current Ratio
-1.03924
0.021536076
-48.2557550
0.013190731
Quick Ratio
1.383215
0.029529677
46.8415168
0.013588866
Cash Conversion
Cycle
0.007124
0.000123163
57.84390274
0.011004727
The coefficients of the variables shown in table 4.25 indicate that all the predictor variables
make contribution to the variation in the criterion variable, albeit, at varying degrees of
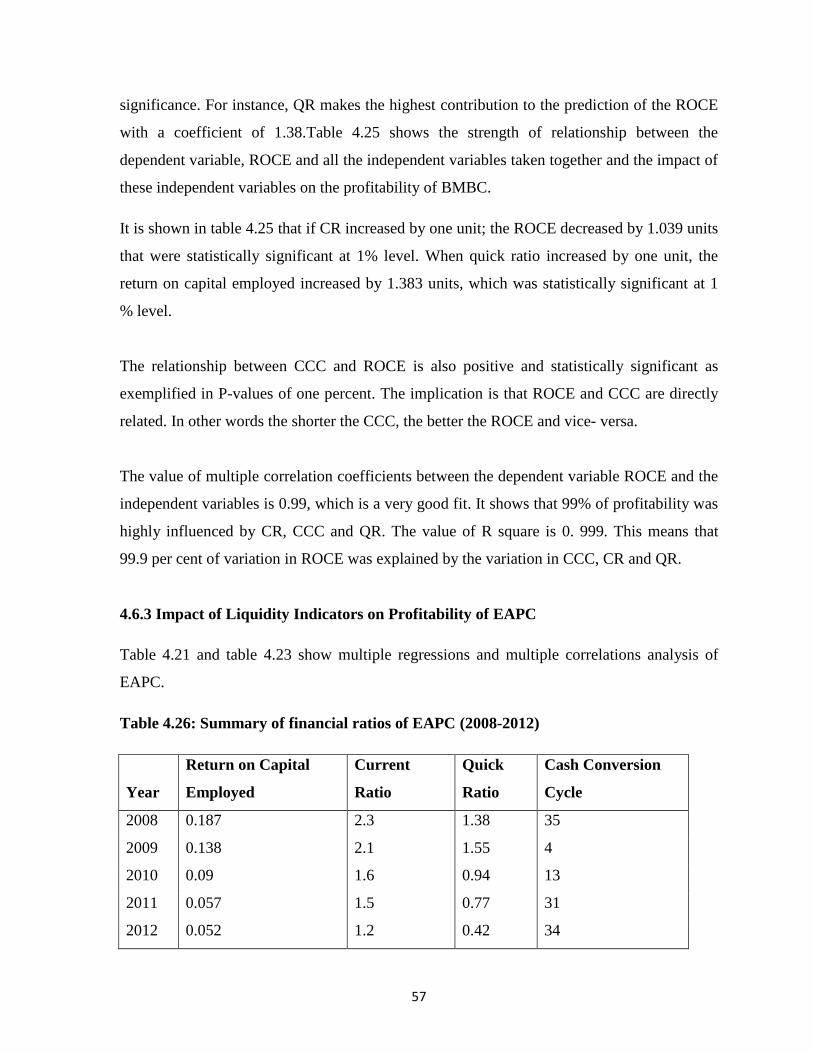
57
significance. For instance, QR makes the highest contribution to the prediction of the ROCE
with a coefficient of 1.38.Table 4.25 shows the strength of relationship between the
dependent variable, ROCE and all the independent variables taken together and the impact of
these independent variables on the profitability of BMBC.
It is shown in table 4.25 that if CR increased by one unit; the ROCE decreased by 1.039 units
that were statistically significant at 1% level. When quick ratio increased by one unit, the
return on capital employed increased by 1.383 units, which was statistically significant at 1
% level.
The relationship between CCC and ROCE is also positive and statistically significant as
exemplified in P-values of one percent. The implication is that ROCE and CCC are directly
related. In other words the shorter the CCC, the better the ROCE and vice- versa.
The value of multiple correlation coefficients between the dependent variable ROCE and the
independent variables is 0.99, which is a very good fit. It shows that 99% of profitability was
highly influenced by CR, CCC and QR. The value of R square is 0. 999. This means that
99.9 per cent of variation in ROCE was explained by the variation in CCC, CR and QR.
4.6.3 Impact of Liquidity Indicators on Profitability of EAPC
Table 4.21 and table 4.23 show multiple regressions and multiple correlations analysis of
EAPC.
Table 4.26: Summary of financial ratios of EAPC (2008-2012)
Year
Return on Capital
Employed
Current
Ratio
Quick
Ratio
Cash Conversion
Cycle
2008 0.187 2.3 1.38 35
2009 0.138 2.1 1.55 4
2010 0.09 1.6 0.94 13
2011 0.057 1.5 0.77 31
2012 0.052 1.2 0.42 34
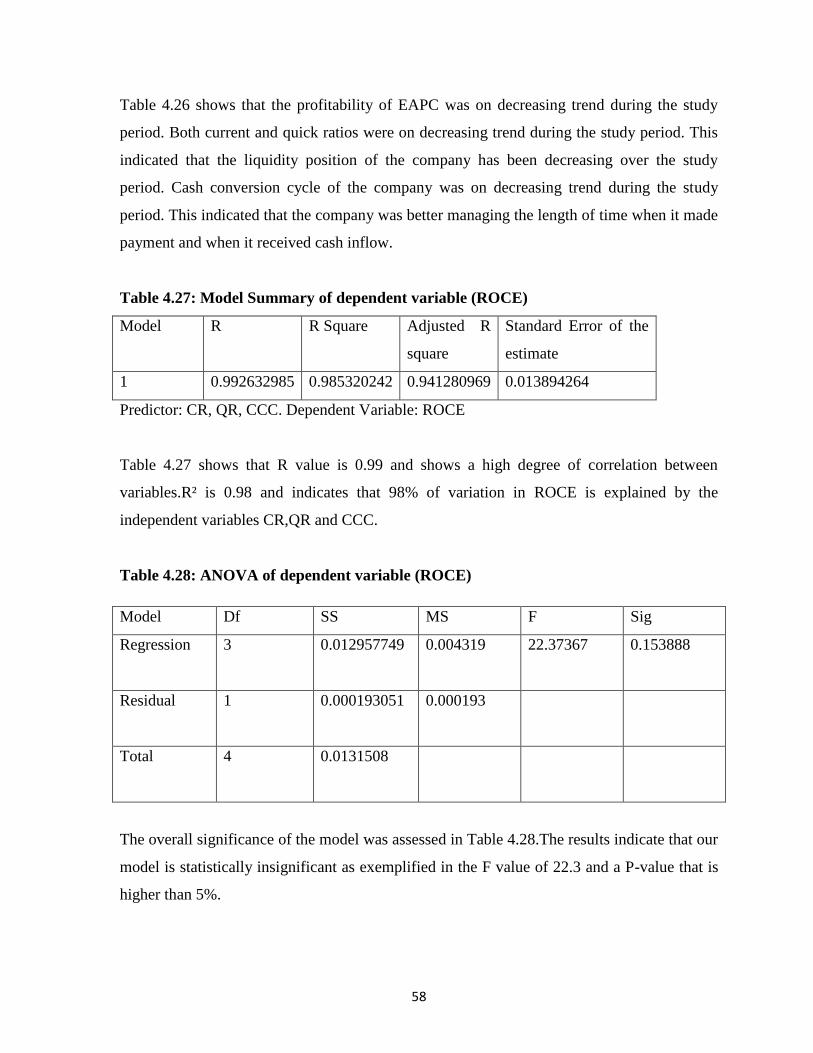
58
Table 4.26 shows that the profitability of EAPC was on decreasing trend during the study
period. Both current and quick ratios were on decreasing trend during the study period. This
indicated that the liquidity position of the company has been decreasing over the study
period. Cash conversion cycle of the company was on decreasing trend during the study
period. This indicated that the company was better managing the length of time when it made
payment and when it received cash inflow.
Table 4.27: Model Summary of dependent variable (ROCE)
Model R R Square Adjusted R
square
Standard Error of the
estimate
1 0.992632985 0.985320242 0.941280969 0.013894264
Predictor: CR, QR, CCC. Dependent Variable: ROCE
Table 4.27 shows that R value is 0.99 and shows a high degree of correlation between
variables.R² is 0.98 and indicates that 98% of variation in ROCE is explained by the
independent variables CR,QR and CCC.
Table 4.28: ANOVA of dependent variable (ROCE)
Model Df SS MS F Sig
Regression 3 0.012957749
0.004319
22.37367
0.153888
Residual 1 0.000193051
0.000193
Total 4 0.0131508
The overall significance of the model was assessed in Table 4.28.The results indicate that our
model is statistically insignificant as exemplified in the F value of 22.3 and a P-value that is
higher than 5%.

59
Table 4.29: Regression coefficients of dependent variable (ROCE)
Model Coefficients
Standard
Error
t Stat
P-value
Intercept
-0.21683497
0.066651972
-3.25324
0.189852
Current Ratio
0.38295527
0.165623171
2.312208
0.259865
Quick Ratio
-0.28712787
0.184977877
-1.55223
0.364345
Cash Conversion
Cycle
-0.00231341
0.001869269
-1.2376
0.432652
The coefficients of the variables shown in table 4.29 indicate that all the predictor variables
make contribution to the variation in dependent variable albeit, at varying degrees of
significance. For instance, CR makes the highest contribution to the prediction of the ROCE
with a coefficient of 0.38. But the P- values of all the predictor variables indicate
insignificant impact on ROCE at 5 percent.
Table 4.29 shows the relationship between the dependent variable, ROCE and the
independent variables, CR, QR and CCC and the impact of these independent variables on
dependent variable. Table 4.29 shows that when CR increased by one unit, the ROCE
increased by 0.383units that was statistically insignificant. The table also shows that when
QR increased by one unit, the ROCE decreased by 0.2871 units, which was not statistically
significant.
From the table 4.29, the regression coefficient relating CCC to ROCE is -0.00231.The result
confirms a negative relationship between cash conversion period and firm profitability.

60
From the analysis, the multiple correlation coefficients between the dependent variable
ROCE and the independent variables CR, QR, and CC is 0.99. It shows that the dependent
variable was highly responded by its independent variables. It is also proved by the value of
R square that 98 per cent of variation in ROCE was explained by the variation in CCC, CR
and QR.
4.7 Chapter Summary
Chapter four provided the study findings on measures of liquidity management and factors
that affect liquidity management in listed cement companies on NSE. It also provided the
findings on relationship between liquidity and profitability in these companies.
The objective of this study was to examine the liquidity management efficiency and the
relationship between liquidity and profitability. The findings of the study revealed that
correlation and regression results are significantly positive associated to the profitability of
the company.
The next chapter presents a discussion of the findings based on the research questions, the
conclusions derived from the findings and recommendations for improvement and further
research.

61
CHAPTER FIVE
5.0 DISCUSSION, CONCLUSIONS AND RECOMMENDATIONS
5.1 Introduction
This chapter presents the summary of the findings of the study. Section 5.2 presents the
summary of the research methodology and research findings, section 5.3 discusses the major
research findings related to the objective of the study, section 5.4 presents conclusions on the
findings of the study and section 5.5 provides the recommendations for improvement and
further research.
5.2 Summary
The main purpose of this present study was to establish liquidity management measures of
cement producing companies listed on the Nairobi Securities Exchange (NSE).The study also
examined the relationship between liquidity and profitability. The study sought to answer the
questions of:
i) What are the measures of liquidity management in listed cement manufacturing firms on
NSE?
ii) What are the factors that affect liquidity management of listed cement manufacturing
firms on NSE?
iii) Is there any relationship between liquidity and profitability in listed cement
manufacturing firms on NSE?
Three Kenyan cement companies listed on Nairobi Securities Exchange have been
purposefully selected for the study purpose. The companies are (i) Athi River Mining
Limited (ARML) (ii) Bamburi Cement Limited (BMBC) and (iii) East African Portland
Cement Company Limited (EAPC).
The study related to a period of five years starting from 2008 and ending to 2012.For the
purpose of the study only secondary data have been used. The study was based on the
secondary data obtained from the financial statements of the respective companies. During

62
the analysis in this study, various accounting and statistical tools and techniques were
applied. Accounting techniques included ratio analysis, while among statistical techniques
the Mean, Standard Deviation, Coefficient of Variation, multiple correlations, multiple
regression analysis and coefficient of determination (R²) were applied. These techniques
were used at different places in the light of required analysis.
The measures of liquidity management were examined under the following subsections,
liquidity position based on current ratio and liquidity management based on quick ratio. The
research findings revealed that the mean values of current ratio was 1.71 which is below the
standard conventional rule of 2:1.This indicated that on average the listed cement companies
might find difficult to meet their short term maturing obligations. However, with the
maximum of 2.22 for the current ratio showed that some of the companies were doing very
well liquid wise, as they were not likely to encounter any difficulty in meeting their short
term obligations. On an average the quick ratio was 1.09 which was satisfactory compared to
the standard conventional rule of 1:1.
Factors that affect liquidity requirement of cement manufacturing firms were examined
during this study under the following subsection, liquidity position based on age of
inventory, liquidity position based on age of receivables, liquidity position based on payables
and impact of cash conversion cycle on level of liquidity measured by current ratio.
The study revealed that age of inventory for BMBC and EAPC was 78 days and 69 days
respectively and was very satisfactory compared to industry average of 85 days. These
companies showed efficient management of inventory because more frequently the stocks are
sold, the lesser amount of money is required to finance the inventory. Compared to industry
average, age of inventory of ARML was 109 days and was unsatisfactory .This indicated an
inefficient management of inventory. Age of receivables was 21 days and 28 days for BMBC
and EAPC respectively and was satisfactory compared to industry average of 41 days. This
showed that the companies collected receivables earlier than required.
Age of receivables was 74 days for ARML and was unsatisfactory compared to the industry
average. This showed that customers took more time to pay their debts than required.

63
Age of payables was 105 days and was satisfactory in case of ARML compared to industry
average of 86 days. Age of payables was unsatisfactory in case of the remaining companies
Age of payables was 80 days for BMBC and 74 days for EAPC.
Regression analysis was carried out to examine the relationship between current ratio and
cash conversion cycle. In case of ARML, the results of regression analysis revealed that
about 13% of variation in liquidity measured by current ratio was explained by the number of
days of cash conversion cycle. During the period of the study, the average current ratio was
1.17 and the average number of days of cash conversion cycle was 78 days while the CCC
industry average was 40 days. This showed that the cash conversion cycle was not
satisfactory and had a negative impact on current ratio.
In case of BMBC, the results of regression analyses revealed that about 4% of variation in
liquidity measured by current ratio was explained by the number of days of cash conversion
cycle. During the period of study average current ratio was 2.22 and the average number of
days of cash conversion cycle was 19 days while the CCC industry average was 40 days.
This showed that the cash conversion cycle was satisfactory and had a positive impact on
liquidity measured by current ratio.
In case of EAPC, the findings revealed that about 7% of variation in current ratio was
explained by number of days of cash conversion cycle. During the period of study the
average current ratio was 1.74 and the average number of days of cash conversion cycle was
23 days while the industry average was 40 days. This showed that the cash conversion cycle
was satisfactory and had a positive impact on current ratio.
The study revealed that the cement company listed on NSE generated a mean return on
capital employed of about 17% with a minimum of 12% and a maximum of 25%. The
investigation using both correlation and regression analysis revealed that liquidity ratios
measured by current ratio and quick ratio had a positive relationship with profitability
measured by return on capital employed. The findings of this study also revealed that cash
conversion cycle had a negative relationship with profitability.

64
5.3 Discussion
5.3.1 Measures of Liquidity Management
From the analyses, traditional liquidity measures namely current ratio and quick ratio were
used as independent variables. This is consistent with the findings of Sayeda T.( 2011) who
studied Liquidity Management of Cement Industry of Bangladesh using Current Ratio and
Quick ratio which are measures of liquidity of a Firm. The computation of these liquidity
ratios is also consistent with the findings of Panigrahi (2013) who studied Liquidity
Management of Indian Cement Companies using Current Ratio and Quick Ratio as measures
of liquidity. According to Panigrahi adequate liquidity and its careful management can make
significant difference between the success and failure of a firm. Quick ratio will help know
whether can disburse their current debt, exclude to sell any inventory. It‟s essential for a firm
to concern on this because, if they need to sell inventory, they also need a customer to
purchase that inventory (Chinmoy, 2009).
Liquidity ratio shows the liquidity management strategy and the higher it is the more liquid is
an organization (Bolek, 2012).Some current assets are either temporary or permanent. The
temporary part of current assets may be financed by short term liabilities while the permanent
part may be financed by equity. The more equity is utilized to finance temporary current
assets the more relaxed the liquidity management policy and the higher the level of current
ratio. When permanent current assets are financed by short term liabilities, then the CR is
lower.
Liquidity ratios assess a company‟s capability to meet the payment obligations by comparing
the cash and near-cash with the payment obligations. If the coverage of the latter by the
former is not sufficient, it shows that the company might face difficulties in meeting its
immediate financial obligations. This can, in turn, affect the company's business operations
and profitability. Liquidity management is vital for every organization that means to pay
current obligations on business, the payment obligations comprise operating and financial
expenses that are short term but maturing long term debt. Liquidity ratios are used for
liquidity management in every company in the form of current ratio, quick ratio and Acid test
ratio that greatly affect on profitability of company. So business has sufficient liquid assets

65
(Cash, Bank) to meet the payment schedule by comparing the cash and near-cash with the
payment obligations. Liquidity ratios work with cash and near-cash assets of a business on
one side, and the immediate payment obligations (current liabilities) on the other side. The
near-cash assets mainly comprise inventories of finished goods, raw materials and
receivables from customers. The payment obligations include operating and financial
expenses that must be paid shortly, maturing installments under long-term debt and dues to
suppliers (Amalendu, 2011).
For manufacturing operations to be run effectively and efficiently, optimum cash
management techniques must be adopted as cash shortage can disrupt the firm‟s
manufacturing operation, while excessive cash can simply remain idle, without contributing
anything in terms of return towards the firm‟s profitability (Damilola,2006).
Many organizations that are profitable on paper are forced into cash management assumes
more importance than other current assets because cash is the most significant asset that a
firm holds. Cash is unproductive unlike fixed assets or inventories if it does not produce
goods for resale notwithstanding management‟s considerable time is devoted to managing it.
The importance of managing cash to a manufacturing concern as identified by Alfred (2007)
are: Management of cash aids the achievement of liquidity and control, it brings about proper
planning with regard to cash disbursement and receipts over cash positions to keep the firm
sufficiently liquid and to use excess cash in some profitable venture, the management of cash
is also significant since we cannot rightly predict accurately cash flow behavior in the future,
through cash management appropriate strategies are developed thereby providing innovation
for cash receipts and payments, it also aids maintaining adequate control over cash position
to keep the firm sufficiently liquid and to use excess of cash in some profitable ventures.
The primary purpose of cash management is therefore to reduce cost. However, a cost-
benefit analysis of cash management is also needed. Such costs of cash management include
cost of interest payments, cost of collection, cost of disbursement of funds, etc.
66
5.3.2 Factors that affect Liquidity Management
From the analysis, the findings of this study show that corporate liquidity is influenced by
cash conversion cycle (CCC) .Cash conversion cycle is a factor which determines the level
of liquidity of a firm. Regression analysis showed that current ratio increased with a decrease
in the number of cash conversion cycle. The results are consistent with the findings of
Monika Bolek (2013) who studied liquidity management of firms listed on Stock Exchange
of Poland and found a negative relationship between current ratio and cash conversion cycle.
The results of this study revealed that the CCC portrayed and averaged 40 days with a
standard deviation of 18 days. This indicated that on average it took 40 days before cash is
collected from the sales measured from when the inventory is actually paid for in the cement
manufacturing industry. The implication of this is that a firm with a relatively shorter period
of cash conversion cycle is more liquid. Hence, shortening the firm‟s cash conversion cycle
is potential way for the firm to create additional shareholder‟s wealth. This is in line with
Rahemen and Nasr (2007) who found a strong negative relationship between cash conversion
cycle and liquidity. This is also consistent with the findings of many other studies over the
world including Lazaridis and Tryfonidis (2006) that a decrease in the cash conversion cycle
will generate more liquidity for a company. The authors also found that the longer a firm
delays its payments the higher level of liquidity it reserves and uses in order to increase
profitability.
To manage the cash conversion cycle requires good inventory, credit and collection
management policies. Therefore cash conversion cycle comprises three elements, namely;
inventory, accounts payable and accounts receivable. For better liquidity management and to
ensure short cash conversion cycle, it is paramount to assess, manage and take appropriate
actions to improve each components (Thachappilly, 2009). According to Bodie and Merton
(2000), a firm can decrease its need for working capital by making inventory control process
efficient so that there is reduction in the amount of times goods remain in inventory, making
account receivable process efficient to ensure timely receipt of money and managing the
accounts payable.

67
The cash conversion cycle is a dynamic factor that influences corporate liquidity indicating
the number of days it takes a firm to recover the cash it has spent in an operating cycle.
According to Bolek and Wolski (2010), a low cash conversion cycle shows that the firm can
recover its cash from the sales of its products faster. The more cash the firm has, the more
liquid it will be in the dynamic sense of liquidity. A high cash conversion cycle shows that it
takes the company to recover cash from operating process, which indicates liquidity
problems. A low cash conversion cycle is connected to reducing inventories, faster
receivables collection, and extent payment terms. A negative cash conversion cycle shows
that the firm‟s suppliers are financing its growth in sales, usually at zero cost. Based on
theoretical analysis, it can be seen that current ratio depends more on the structure of balance
sheet items while cash conversion cycle is more related to turnover (Monika, 2012).
There are many factors that ascertain the financial performance and solidity of a firm. These
comprise analysis of working capital, cash conversion cycle and liquidity analysis. Proper
assessment and management of these factors are must as they are key components for smooth
running and for proactive approach towards growth and expansion of a company. Operating
capital also referred to working capital is the basis and use of short-term capital including
current assets and current liabilities. A higher working capital would mean that the firm has
more cash or current assets to expand its activities. Similarly too low working capital would
delay the growth of the company and may bring difficulties to company in paying its
obligations (Buchmann and Jung, 2010)
Chiou and Cheng (2006) reported that further to firm features, working capital is also
associated to the financial situation, especially the fluctuations in the business indicators. An
improper management of working capital, that is allocating excessive funds than the desired
level, will turn management into inefficient and will subsequently decrease the profits of
short-term investments. Appropriating working capital is an essential element while making
financial decision as working capital is an investment in asset that requires proper and
suitable financial arrangements and planning. Zariyawati (2009) confirmed that the key
requirement for managing working capital consists of proper maintenance and management
of liquidity in day to day operations to ensure its smooth running and to maintain its liquidity
in day-to-day operation to ascertain its smooth running and convene its debts.

68
From the analysis, cash conversion cycle of selected firms was on decreasing trend during
the whole period under study. This revealed that selected firms were better managing the
length of time between when they made payment and when they received cash inflow.
According to Uyar (2009) managing current assets and liabilities that is liquidity
management is essential for the successful management of a company. Not managing the
liquidity well leads the company to external financing, which might not always be possible
for a company. This can be evaluated through the cash conversion cycle of the company.
Cash conversion cycle shows the working capital efficiency. It is a good indicator of the
wellbeing of a firm (Harper, 2010). Working capital shows the length of time that exists
between when cash outflows a firm at the beginning of production process and when it
inflows. Company first buys inventory from its suppliers in the form of either raw materials
or finished goods, even if the inventory is in the form of finished goods, it may stay on the
shelf for some time before it is sold. A company usually buys its inventory on credit, which
suggests that it does not have to pay cash immediately at the time of purchase. The inventory
is often sold on credit when it is delivered. The cash cycle of a company is the length of time
when the process is initiated by the purchase of the inventory and is concluded when the cash
is received from the sale of completed good transformed from the raw material. CCC
therefore is a measure of average number of days of operating capital being provided in the
operating cycle (Berk and De Marzo, 2007)
According to Uyar (2009) Cash Conversion Cycle is a useful way of evaluating the liquidity
of a company. It assesses the time lag between payments in cash for purchasing inventories
and funds receivables collection from the customers. Cash Conversion Cycle is mentioned in
the context of working capital management. Cash Conversion Cycle is a comprehensive
measure of working capital as it indicates the time between the purchase of raw material and
the collection of funds from the finished goods sold to customers. Thus it measures the time a
fund has been invested in working capital by the company. The company‟s objective should
be to shorten the Cash Conversion Cycle without negatively affecting operations. Profits will
be improved, since the longer the Cash Conversion Cycle the more the need for costly
external borrowing.
69
5.3.3 Relationship between Liquidity and Profitability
This study showed that the multiple correlation coefficients between the dependent variable,
return on capital employed (ROCE) and the independent variables Current Ratio (CR), Quick
Ratio (QR) and Cash Conversion Cycle (CCC) were strongly correlated. Findings of this
study showed that correlation and regression outputs are highly positive associated to the
profitability. The study used both correlation and regression analysis and revealed that
liquidity ratios measure by Current Ratio (CR),Quick Ratio (QR) and Cash Conversion Cycle
(CCC) have a strong relationship with profitability measured by Return on Capital Employed
(ROCE).
The findings are consistent with the findings of Owolabi, Obiator and Okwu (2011)
investigating liquidity and profitability relationship in business organization using some
selected quoted companies in Nigeria and they concluded that a positive relationship exists
between the two variables in processing and manufacturing companies respectively. The
findings are also similar to that of Vijaykumar (2011) study the management of corporate
liquidity and profitability in Indian auto mobile companies and conclude that Indian auto
mobile has been able to achieve high scores on the various components of liquidity
management which has a positive impact on its profitability. Amalendu and Sri (2011) also
carried out a research on the importance of liquidity management on profitability in steel
companies in India using, Return on Capital Employed (ROCE) as a measure of profitability
and Current Ratio (CR), Quick Ratio (QR) as measure of liquidity and concluded that there
was positive relationship between CR,QR and ROCE.
This study also revealed that CR and QR are positively associated with ROCE, while CCC is
negatively associated with ROCE. This study found a negative relationship between cash
conversion cycle and profitability of the company. This complies with the finding of
Tryfonidis (2006) and many others. The findings also concur with those of Jelly (2004),who
reported that cash conversion cycle is a better measure of liquidity than current ratio and it
has a negative relationship with profitability. Nobanee (2009), Chaterjee (2010), Nobanee et
al. (2010), Akgun and Meltem (2010) and Rezazade and Heidarian (2010) have all reported a
negative relationship between CCC‟s components with profitability. One of the effective
ways for shortening CCC is to shorten the period of receivable accounts, delaying the

70
payment of payable accounts and inventories. By shortening CCC, firm profitability
improves.
The findings of this study are also consistent with those of Mathuva (2009) who examined
the influence of liquidity management components on corporate profitability by using a
sample of 30 manufacturing companies listed on NSE for the periods 1993 to 2008. His study
used Pearson and Spearman‟s correlations, the pooled ordinary least square (OLS), and the
fixed effects regression models for data analysis. The key findings of his study were that
there existed a highly significant negative relationship between profitability and the time it
takes for companies to collect cash from their customers.
The implication of this is that a company with a relatively shorter period of cash conversion
cycle is more profitable. Hence, shortening the company's CCC is a potential way for the
company to create additional shareholder‟s wealth. This is consistent with Nasr (2007) who
found a strong negative relationship between profitability and cash conversion cycle.
For conventional measure of liquidity, profitability is positively related to current ratio.
Liquidity ensures the management of current assets and liabilities in a way that the short-term
obligations are met along with not overinvesting in current assets.
The findings of this study showed a significant correlation between liquidity and
profitability. Raheman and Nasr (2007) pointed out that the ultimate objective of any
company is to optimize profit, but protecting the liquidity of a company is an imperative
purpose too. Attracting this balance is difficult as if measures are undertaken to increase
liquidity by availing current assets would negatively impact profitability as this would restrict
investment. But if resources are invested to earn greater profits, it would lower liquidity.
However, the challenge is that compromising on liquidity by increasing the profits of a
company can put the company in trouble. Hence, there should be a well- designed trade- off
between these two essential objectives of the companies. Achievement of one at the expense
of the other should not be done as both have significant importance in the company. A firm
cannot survive for a longer period of time, unless it does not give due importance to the profit
as it is the core purpose of any business. On another hand too much emphasize on
profitability at the cost of liquidity may run the company in serious troubles of insolvency.
71
Thus liquidity management should be given proper consideration as it ultimately affects both
profitability and liquidity of the company.
5.4 CONCLUSIONS
5.4.1 Measures of Liquidity Management
From the analysis, current and quick ratios were computed to determine liquidity position of
the companies under study. Current ratio showed the ability of a company to satisfy current
liabilities utilizing current assets. Quick ratio depicted the ability to satisfy current liabilities
using the most liquid of current assets.
The study revealed that Bamburi Cement Company had satisfactory current and quick ratio
during the study period. This indicated that the company had a satisfactory liquidity position.
The current ratio of ARML and EAPC was unsatisfactory because it was lower than the
conventional standard rule. These firms must ensure that they have sufficient liquid resources
to meet the short term obligations as required. If the firm operates strictly on cash basis or it
is able to pay its creditors after it collects from its customers, then the situation is in favor of
the firm. Otherwise, any moment the present situation may create serious financial troubles
for the firm which may even lead it towards liquidation.
5.4.2 Factors that affect Liquidity Management
The findings of the study carried on the three selected cement companies revealed that
corporate liquidity is influenced by level of cash conversion cycle measured by inventory
turnover, receivables collection period, and payables payment period. The longer the cash
conversion cycle the more the firm must invest in working capital, while the shorter cash
conversion cycle, the fewer funds are tied up in the working capital .Corporate liquidity is
influenced by the cash cycle because cash cycle measures the average amount of time that
cash is tied up in operations process. Therefore, a firm with a short cash cycle is expected to
have higher levels of cash. The study further concludes that the shorter the cash conversion
cycle, the more efficiently cash is managed and ultimately the more liquid the firm is. On the
other hand, the longer the cash conversion cycle, less cash is available in the firm.

72
5.4.3 Relationship between Liquidity and Profitability
This analysis has shown degree of relevance of liquidity and profitability in the three selected
quoted companies. From the analysis, a positive relationship exists between liquidity and
profitability in a company in the cement industry. The regression results indicated that CCC
has a negative relationship with profitability that as CCC increases, profitability decreases.
This means that firms with high cash conversion cycle earn lower profits as compared to
firms with low cash conversion cycle.
5.5 Recommendations
5.5.1 Recommendation for improvement
5.5.1.1 Measures of Liquidity Management
Firms should maintain the ideal current and liquid ratio, which is not there in case of some of
the firms we have analyzed. Liquidity plays a key role in the successful operating of a
business company. A company should ensure that it does not suffer from lack-of or excess
liquidity to meet its short-term obligations. A study of liquidity is important to both the
internal and the external analysts because of its close relationship with day-to-day operating
activities. Liquidity requirement of a company depends on the nature of the company and
there is no specific rule on determining the optimal level of liquidity that a company can
maintain to ensure positive impact on profitability. One should try to maximize or minimize
the liquidity ratios; one should try to optimize them in relation to the firm‟s goals, which in
case of a commercial organization is probably the maximization of profit on total assets
employed. The lower the liquidity ratios are, the more vulnerable the firm is to pressure from
creditors which it is unable to meet their requirements.
5.5.1.2 Factors that affect Liquidity Management
The study recommends that to ensure better cash management, that is shorter CCC, which
would invariably lead to better liquidity in the cement industry, the duration of time that
goods are held in inventory should be reduced. This can be accomplished by improving the
inventory control process. Also, accounts receivable should be collected more quickly by
improving the efficiency of the collection process as debt should be collected in line with the

73
agreed credit terms. Managers should focus on reducing cash conversion cycles and try to
collect receivables as soon as possible because it is better to receive inflows sooner than later.
Managers should reduce inventory periods and try to delay payables because it will provide
them opportunities to invest in different profitable areas thus increasing the firms‟
profitability.
5.5.1.3 Relationship between Liquidity and Profitability
It is very clear that the efficient management of liquidity has a positive effect on the firms‟
profitability. So this study clearly asserts that, listed firms in the cement industry in Kenya
have enough scope to enhance their profitability by handling their liquidity in more efficient
ways. Especially, the inventory turnover if handled efficiently can produce a significant
positive impact on profitability of the firm. Thus this study finds enough evidences that a
firm is likely to enjoy better profitability if the firm manages its liquidity with better
efficiency and focuses on cash position with more care.
5.5.2 Recommendation for Further Research
Future research should put effort in increasing the trend of analysis to determine the effect of
cash management on profitability overtime and also use a different model to prove the
significant negative relationship between cash conversion cycle and profitability .The scope
of further research may be also extended to the working capital components management
including marketable securities.
The study was based on three listed companies of the Cement Industry in Kenya. Similar
study should be done on the same topic to cover all cement companies operating in cement
industry of Kenya.

74
REFERENCES
Acharya, Viral, Heitor A.& Murillo C.(2013).Aggregate Risk and the Choice between Cash
and Lines of Credit. Journal of Finance, Vol 68 (5), 2059-2116.
Akinbuli, S.F (2006).Financial Accounting. Principles and Application. Lagos: BPrint
Publishers.
Almeida, Heitor, Murillo C.& Michael S.W.(2011).Corporate Financial and Investment
Policies when Future Financing is not Frictionless. Journal of Corporate Finance,
Vol 17, 675-693.
Amalendu, B.I & Sri, B.B (2011).Importance of Liquidity Management on Profitability.
Asian Journal of Business Management, Vol 3 ( 2), 108-117.
Amarjit G, Nahum B & Neil, M. (2010).The Relationship between Working Capital
Management: Evidence from the United States. Business and Economic Journal, Vol
20 (10), 1-9.
Azam,D. M. & Haider, S. I. (2011). Impact of Working Capital Management on Firms
Performance: Interdisciplinary Journal of Contemporary Research in Business, Vol.
3(5), 481-492.
Barad, Mahesh M. (2010). A Study of Liquidity Management of Indian Steel Industry.
Basno &Dardac (2004). The Analysis of the Banking Liquidity Risk. Journal of
International Business and Economics, Vol 1(7), 95-98.
Ben-Caleb, E. (2009). Working Capital Management and Profitability of Listed Companies
in Nigeria: Nigeria Research Journal of Accountancy, Vol 1 (1) , 44-57.
Berk&Demarzo (2007). Corporate Finance Solutions, 2nd
Ed.

75
Bhavet (2011) .Management of Liquidity. A Case Study of Tisco Ltd. International Journal
of Research in IT & Management, Vol 1 (2),11-18 .
Bhunia A. (2011).Liquidity Management Efficiency of Indian Steel Companies (a Case
Study). Far East Journal of Psychology and Business,Vol 3 ( 3),15-20
Bhunia, A.& Khan I.U. (2011).Liquidity Management Efficiency of Indian Steel Companies:
A Case Study. Far East Journal of Psychology and Business, Vol 3 ( 3), 3-13.
Bhunia, A., Khan, I & Mukhuti, S, (2011). A Study of Managing Liquidity. Journal of
Management Research, Vol 3 ( 3),25-44.
Bhunia, A.(2006).Liquidity Management of Public Sector Iron and Steel Enterprises in India.
Peleman Industries Inc, U.S.A., pp 4.
Bhunia, A. (2010). A Trend Analysis of Liquidity Management Efficiency in Selected
Private Sector Indian Steel Industry. International Journal of Research in Commerce
and Management, Vol 1(5), pp 213.
Blumberg, B., Cooper, D.R.& Schindler, P.S. (2008) .Business Research Methods,
Berkshire: McGraw-Hill.
Blumberg B, DC Cooper & PS Schindler ( 2005). Business Research Methods. McGraw-
Hill.
Bodie,Z.&Merton, R.C.(2000).Finance, International Edition, Prentice-Hall, New Jersey.
Bolek M.,Wolski R.(2012).Profitability or Liquidity: Influencing the Market Value. The
Case of Poland. International Journal of Economics and Finance, Vol 4 (9), pp 182.
Bryman, A. & Bell, E.( 2007). Business Research Methods, Oxford University Press.
Bryman, A., & Bell, E. (2003). Business Research Methods. UK: Oxford University Press.

76
Campello,M., Erasmo G., John R. G,& Campbell R. H. (2011).Liquidity Management and
Corporate Investment during a Financial Crisis.
Chinmoy, G.(2009).Liquidity Management of Indian Cement Companies: A comparative
Study. Journal of Banking and Finance, Vol 33 (11), 49-84.
Cooper, C. R., & Schindler, P. S. (2008).Business Research Methods (10th
Ed.). Boston:
McGraw-Hill.
Cooper, R .D., & Schindler, P.S. (2011). Business Research Methods (11th
Ed.) McGraw-
Hill. Publications. New York, United States.
Cooper, D. R., & Schindler, P. S. (2006). Business Research Methods (9th
Ed.). USA:
McGraw-Hill.
Cunha&Igor (2013). Easy come Easy go :Cheap Cash and bad Corporate Decisions.
Working Paper.
Damilola, D.A.(2006). Corporate Finance: Issues, Investigations, Innovations and
Applications, High Rise Publications, Lagos, Nigeria.
Dash, M. & Hanuman R. (2008). A Liquidity-Profitability Trade-Off Model for Working
Capital Management.
Dong, H.P. and Su, J. (2010). The Relationship between Working Capital
Management and Profitability: A Vietnam Case. International Research Journal of
Finance and Economics, Vol. 49, pp. 59-67.
Duchin, R.( 2010).Cash Holdings and Corporate Diversification, Journal of Finance,
Vol. 65, pp.955–992.
Dyer&Blair (2012).Kenya Cement Industry Overview, December 2012.

77
Eljelly A. (2004). Liquidity-Profitability Tradeoff: An Empirical Investigation in an
Emerging Market. International Journal of Commerce and Management, Vol.14 (2),
pp.48-61.
Enyi, P.E. (2006). Applying Relative Solvency to Working Capital Management: The
BreakEven Approach. In Gopala K.M.G.(2006) (Ed).Toward Better working Capital
Management. Punjagutta, the Icfai University press .
Erel, Isil, Yeejin J.& Michael S. W.(2013). Do Acquisitions Relieve Target Firms‟ Financial
Constraints? Journal of Finance,Vol.67,1045-1082.
Foley, Hartzell, Titman &Twite(2007). Cash Holding and Corporate Diversification.
Garcia-T., P.J.& Martinez.P. (2007).Effects of Working Capital on SME Profitability.
International Journal of Managerial Finance, Vol. 3 (2), 164 – 177.
Gill, A., Biger, N., Mathur, N. (2010). The Relationship between Working Capital
Management and Profitability: Evidence From The United States. Business and
Economics Journal, Vol. 20 (10), 1-9.
Harford, Jarrad , Sattar A. Mansi& William F. M. (2008).Corporate Governance and Firm
Cash Holdings in the U.S.. Journal of Financial Economics , Vol. 87, 535–555.
Hans C.&Alissa K. (2008).The Role of Stock Exchanges in Corporate Governance.
Hutchison, P.D, Farris II, M.T.& Anders, S.B.(2007).Cash to Cash Analysis and
Management. The CPA Journal, Vol. 77 (8), 42-47.
Ippolito, Filippo & Ander .P.O ( 2012). Corporate Liquidity, Discussion Paper.
Izadinia, N. & Taki, A. (2010). Investigation of the Impact of Working Capital Management

78
on the Profitability Potential of the Companies Listed in Tehran Stock Exchange.
Journal of Science Research Financial Accounting, Vol.3 (10), 120-139.
Jamali, A. H. & Asad, A. (2012). Management Efficiency and Profitability in Indian
Automobile Industry: From Theory to Practice. Indian Journal of Science and
Technology , Vol.1(3), 2321-4155.
Johnson C.&Aggarwal A. (1988).Cash Management. Accountancy, Vol 102 (1144), 81-86.
Kevin & Young (2009). Liquidity Management of Indian Cement Companies.
Kenya Export Processing Zones Authority ( 2004).
KNBS (2012).Kenya National Bureau of Statistics Economic Survey 2012
KPMG (2005).Working Capital Management Survey: How do European Companies Manage
their Working Capital?
Lamberg, S. & Valming, S. (2009). Impact of Liquidity Management on Profitability:A
Study of the Adaptation of Liquidity Strategies in a Financial Crisis. Umea. Umea
School of Business .
Laura, Alfaro &Anusha C.(2009). India Transfromed. Insigths from the Firm Level 1988-
2005.India Policy Forum 6 (2009). Featured in The Economist. Economics focus.
Lazaridis,I.&Tryfonidis, D.(2005).The Relationship between Working Capital Management
and Profitability of Listed Companies in the Athens Stock Exchange.
Lazardis, I. and Tryfonidis, D. (2007).The Relationship between Working Capital
Management and Profitability of Listed Companies in Athens Stock Exchange.
Journal of Financial Management and Analysis, Vol. 19 (1), pp. 1-12.
Lind, D. A., Marchal, W. G., &Wathen, S. A. (2008). Statistical Techniques
79
in Business & Economics .13th
Ed. USA: McGraw-Hill.
Mahmood & Qayyum. A. (2010). Working Capital Management and Corporate Performance
of Manufacturing Sector in Pakistan, International Research Journal of Finance and
Economics, Vol. 47,1450-2887.
Mathuva, D.M. (2009).The Influence of Working Capital Management Components on
Corporate Profitability: A Survey on Kenyan Listed Firms. Research Journal of
Business Management, Vol. 4 (1), pp. 1-11
Malhotra, N & Birks, D.(2006). Marketing Research. An Applied Approach.3rd
Ed.Essex:
Pearson Education Limite.
Masson, D.J., Orus, J.G., Flagg, M.J. & Mavrovitis, B.P. (1995).The Treasurer Handbook of
Financial Management. Treasurer Management Association, Irwin, Illinoi , U.S.A.
Morellec, Erwan, Boris N.& Francesca Z.(2013).Competition, Cash Holdings, and
Financing Decisions, Working Paper.
Nobanee, H.&Maryam, A.(2009). A Note on Working Capital Management and Corporate
Profitability of Japanese firms.
Nobanee, H., Modar A&Maryam, A.(2010).Cash Conversion Cycle and Firm’s Performance
of Japanese Firms.
Ogundipe, E.O., Idowu, A, & Ogundipe, L.O (2012).Working Capital Management, Firm‟s
Performance and Market Valuation in Nigeria. International Journal of Social and
Human Sciences, Vol 6, 143-147
Owolabi, S. A., Obiakor, R. T. & Okwu, A. T. (2011). Investigating Liquidity- Profitability
80
Relationship in Business Organization: A Study of Selected Quoted Companies in
Nigeria. British Journal of Economics, Finance and Management Sciences, Vol.1(
2),11-22.
Owolabi, S. A., & Obida, Solomon S.(2012). Liquidity Management and Corporate
Profitability: Case Study of Selected Manufacturing Companies Listed on the
Nigerian Stock Exchange. Journal of Business Management Dynamics, Vol 2 (2), 10-
25.
Padachi, K. (2006). Trends in Working Capital Management and Its Impact on Firms‟
Performance: An Analysis of Mauritian Small Manufacturing Firms. International
Review of Business Research Papers, Vol.2 ( 2), 45 -58
Pandy, I.M. (2005).Financial Management, New Delhi, India. Vikas Publishing House.
Panigrahi ,A.K., (2013). Relationship between Inventory Management and Profitability.
Pass, L.C.& Pike, H.R.,(1984).An Overview of Working Capital Management and Corporate
Financing, Managerial Finance.
Peavler, R. (2009).Cash Management is Important for Your Small Busines.
Raheman, A. & Nasr, M. (2007).Working Capital Management and Profitability: Case of
Pakistani Firms. International Review of Business Research Papers, Vol 3 ( 1), 279-
300.
Richard, L.(2012). The Working Capital Position.
Rubin, D. B. (2007). The Design versus the Analysis of Observational Studies for Causal
Effects: Parallels with the Design of Randomized Trials. Statistics in Medicine,
26(1),20–30.
Sayeda, T.Q.(2011).Effects of Working Capital Management and Liquidity. Journal of
Business and Technology (Dhaha).

81
Sekaran, U. (2006). Research Methods for Business .A Skill Building Approach. (2nd
Ed).
United States of America: John Wiley & Sons, Inc.
Simranjeet, K. S. & Silky, J.(2013). A study on Liquidity and Profitability of Selected Indian
Cement Companies: A Regression Modeling Approach. International Journal of Economics,
Commerce and Management, Vol 1 ( 1), 1-24.
Singh & Pandey (2009). Liquidity Management of Indian Cement Companies.
Sing, J.P &Pandey, S.(2008).Impact of Working Capital Management in the Profitability of
Hindalco Industries Limited. The IUP Journal of Financial Economics, Vol 36 (4),
62-72
Siddiquee, M.&Khan, S.M (2008).Analyzing Working Capital Performance: Evidence from
Dhaka Stock Exchange(DSE) Ltd. The Journal of Nepalese Business Studies, Vol 3
(1),37-48
Saswata .C.(2010).Analysis of Liquidity, Profitability and Working Capital Management: An
Empirical Study on Listed Companies on Huma Khan. International Journal of
Research in Commerce and Management, Vol 3 (11),116-119
Sebastian, G. (2010).A Theory of Corporate Financial Decisions with Liquidity and Solvency
Concerns. Journal of Financial Economics, 99 (2011), 365-384.
Soku, B. (2011). Financial Flexibility and Capital Structure Decision.
Tabachnick, B.G., & Fidell, L.S. (2007). Using Multivariate Statistics, 5th
Ed. Boston:
Pearson Education, Inc.
Thomson, R.(2011) . Liquidity Ratio Analysis. Stock Investor Pro, 2011.
Triola, M. F. (2008). Elementary Statistics Using the Ti-83/84 Plus Calculator, 2nd
Ed.

82
USA: Addison Wesley.
Van Binsbergen, J. H., J. Graham & J. Yang ( 2010), The Cost of Debt. Journal of Finance,
Vol 65 (6), 2089-2136
Van H., J.C & Wachowitz, J.M (2004).Fundamental of Financial Management. 12th
Ed. New
York: Prentice Hall Publishers.
Vasile, D. (2003). The Analysis of the Banking Liquidity Risk. Journal of International
Business and Economics ,Vol14(1),164-177
Vishnani, S. & Shah, B. K. (2007). Impact of Working Capital Management Policies on
Corporate Performance. An Empirical Study. Global Business Review December
2007, Vol 8 (2), 267-281.
Uyar,A.(2009).The relationship of Cash Conversion Cycle with Firm Size and Profitability:
An Empirical Investigation in Turkey. International Research Journal of Finance and
Economics, Vol 1(24), 186-193
Wagner, J.& T.E.Raghunathan ( 2007). Bayesian Approaches to Sequential Selection of
Survey Design Protocols 200 . Proceedings of the American Statistical Association,
Survey Research Methods Section, pp. 3333-3340.
Wilson, J.(2010). Essentials of Business Research: A Guide to Doing Your Research Project.
Thachappilly, G.(2009).‟‟Financial Ratio Analysis for Performance Check: Financial
Statement Analysis with Ratios Can Reveal Problem Areas‟‟. Journal of Financial
Ratio Analysis for Performance Evaluation, Vol 2(1), 2222-2839
Zikmund, W. G. (2000). Business Research Methods, 6th
Ed. USA: Harcourt.
Zikmund, W.G.,Babin, B.J., Carr, J. C. & Griffin, M. (2009).Business Research Methods,8th
Ed. USA: South-Western College Publishing.
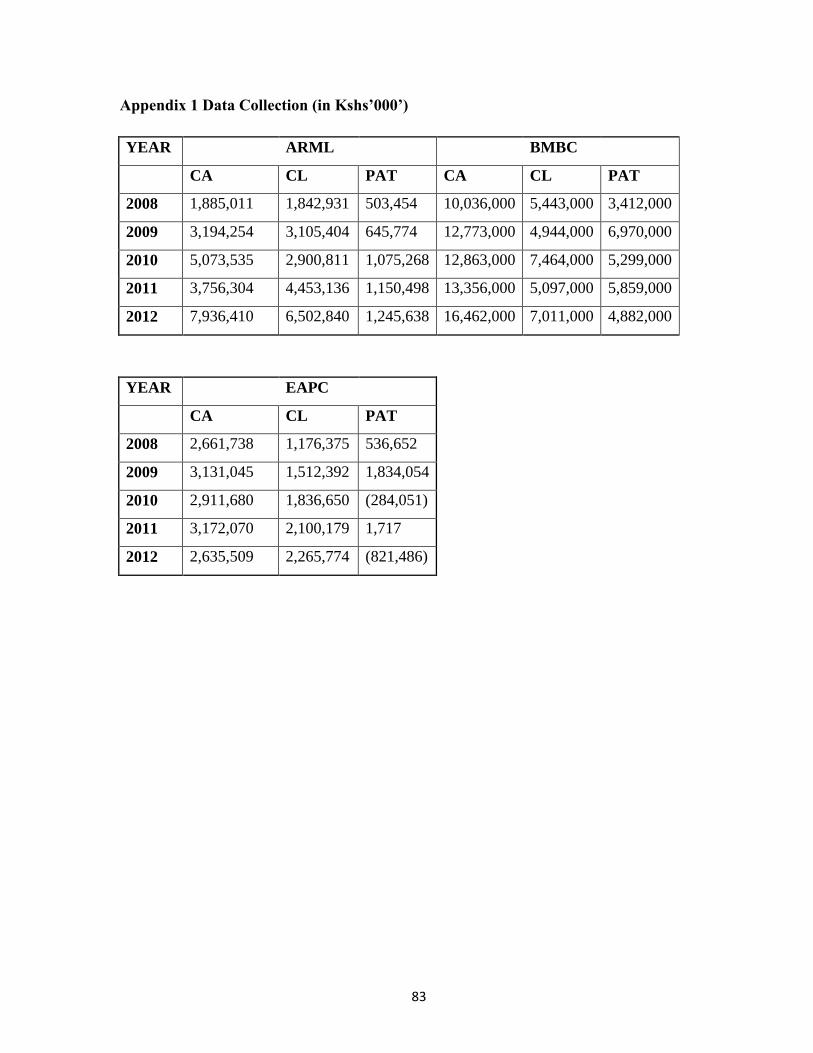
83
Appendix 1 Data Collection (in Kshs’000’)
YEAR
ARML
BMBC
CA CL PAT CA CL PAT
2008 1,885,011 1,842,931 503,454 10,036,000 5,443,000 3,412,000
2009 3,194,254 3,105,404 645,774 12,773,000 4,944,000 6,970,000
2010 5,073,535 2,900,811 1,075,268 12,863,000 7,464,000 5,299,000
2011 3,756,304 4,453,136 1,150,498 13,356,000 5,097,000 5,859,000
2012 7,936,410 6,502,840 1,245,638 16,462,000 7,011,000 4,882,000
YEAR EAPC
CA CL PAT
2008 2,661,738 1,176,375 536,652
2009 3,131,045 1,512,392 1,834,054
2010 2,911,680 1,836,650 (284,051)
2011 3,172,070 2,100,179 1,717
2012 2,635,509 2,265,774 (821,486)


