111
1 COUNTRY PROFILE FOR ZIMBABWE 2016

1
COUNTRY PROFILE FOR
ZIMBABWE
2016

Table of ContentsLIST OF FIGURES.................................................................................................................iii
LIST OF TABLES...................................................................................................................iv
COUNTRY FACT SHEET........................................................................................................v
LIST OF ACRONYMNS..........................................................................................................vi
EXECUTIVE SUMMARY.......................................................................................................vii
1. INTRODUCTION AND BACKGROUND..........................................................................1
1.1 Introduction..........................................................................................................................1
1.2 Background..........................................................................................................................1
1.3 Purpose of the report..........................................................................................................2
1.4 Objective..............................................................................................................................3
1.5 Structure of the report.........................................................................................................3
2. OVERVIEW OF ZIMBABWE............................................................................................5
2.1 Demographics.....................................................................................................................6
2.2 Language.............................................................................................................................7
3. ECONOMIC OUTLOOK...................................................................................................8
3.1 Recent developments and prospects.............................................................................13
3.2 Fiscal policy.......................................................................................................................15
3.3 Monetary policy.................................................................................................................15
3.4 Emerging markets and developments in the corridor...................................................17
3.4.1 Global Economic Developments.................................................................................17
3.4.2 Developments in the Corridor......................................................................................19
4. TRADE INDUSTRY........................................................................................................24
4.1 Exports Performance........................................................................................................24
4.2 Imports Performance........................................................................................................30
4.3 Nature and Volume of Trade between South Africa and Zimbabwe..........................33
4.3.1 Exports from South Africa to Zimbabwe......................................................................34
4.3.2 Imports from Zimbabwe to South Africa.......................................................................35
4.4 Trade Policy.......................................................................................................................36
4.4.1 WTO commitments.......................................................................................................36
i

4.4.2 ACP-EU Cotonou Agreement......................................................................................36
4.4.3 Regional trade integration............................................................................................37
4.4.4 Bilateral trade agreements...........................................................................................39
4.5 Restrictions and associated Legislation.........................................................................39
4.6 Document requirements for importation and exportation.............................................40
4.6.1 Importation process and documents............................................................................40
4.6.2 Exportation process and documents............................................................................43
4.7 Cost and Estimate Import Duration.................................................................................43
5. PASSENGER TRANSPORT..........................................................................................45
5.1 Modal share analysis........................................................................................................45
5.2 Passenger volumes and movement trends...................................................................46
5.3 Cross-Border Operators profile.......................................................................................48
6. THE ROAD TRANSPORT ENVIRONMENT..................................................................51
6.1 Infrastructure......................................................................................................................51
6.2 Road Transport Legislation..............................................................................................52
6.2.1 Speed Limits....................................................................................................................52
6.2.2 Traffic Fines.....................................................................................................................53
6.2.3 Vehicle Dimensions and Weights Restrictions............................................................54
6.3 The Regulatory Framework.............................................................................................55
6.4 Requirements for Cross Border transportation.............................................................56
7. THE BUSINESS ENVIRONMENT..................................................................................58
7.1 Road User Charges..........................................................................................................58
7.2 The Business Environment..............................................................................................62
8. CONCLUSION................................................................................................................68
9. CONTACT DETAILS OF RELEVANT AUTHORITIES..................................................71
9.1 Contact Details of Major Stakeholders...........................................................................71
10. REFERENCE..................................................................................................................72
ii

LIST OF FIGURESFigure 1: Map of Zimbabwe...............................................................................................................5Figure 2: Population growth pattern................................................................................................6Figure 3: Age Structure.....................................................................................................................6Figure 4: Drive to recovery post 2009 by mining...........................................................................9Figure 5: Zimbabwe GDP Annual growth rate...............................................................................9Figure 6: Comparative GDP Figures............................................................................................10Figure 7: Inflation rates..................................................................................................................11Figure 8: Freedom Trends and Country Comparisons...............................................................13Figure 9: The NSC Road Network.................................................................................................21Figure 10: Imports and Exports evolution....................................................................................24Figure 11: Exports Destinations.....................................................................................................25Figure 12: Sectoral Breakdown of exports...................................................................................26Figure 13: Exports Developments.................................................................................................26Figure 14: Exports by Sector..........................................................................................................27Figure 15: Constraints to Export....................................................................................................28Figure 16: Zimbabwe’s trade with South Africa...........................................................................29Figure 17: Exports by destination..................................................................................................30Figure 18: Zimbabwe Imports.......................................................................................................30Figure 19: Imports Developments.................................................................................................31Figure 20: Import destinations.......................................................................................................32Figure 21: Zimbabwe’s trade balance with South Africa............................................................33Figure 22: Imports and Exports between South Africa and Zimbabwe...................................33Figure 23: Overlapping Membership.............................................................................................38Figure 24: Shipment process.........................................................................................................40Figure 25 : Passenger arrivals from Zimbabwe into South Africa..............................................47Figure 26: Passenger departures from South Africa into Zimbabwe........................................48Figure 27: Monthly statistics of bus and taxi operators..............................................................50Figure 28: Institutional relationship................................................................................................56Figure 29: N1 National route..........................................................................................................58Figure 30: Zimbabwe and comparator economies on the ease of doing business...............62Figure 31: Ranking on topics........................................................................................................63Figure 32: Time, cost of income per capita..................................................................................64Figure 33: Ranking on ease of trading across borders..............................................................66Figure 34: Trade facilitation indicators..........................................................................................67
iii

LIST OF TABLESTable 1: Policies to strengthen banking sector.............................................................................16Table 2: Global Economic Growth Rates (%)..............................................................................18Table 3: Western Corridors Cluster...............................................................................................19Table 4: Eastern Corridors Cluster................................................................................................19Table 5: Southern Corridors Cluster.............................................................................................20Table 6: North South Corridor........................................................................................................20Table 7: Border posts......................................................................................................................20Table 8: Average daily Vehicle-Kilometres in the North South Corridor..................................22Table 9: Export Receipts (US).......................................................................................................25Table 10: Imports to Zimbabwe................................................................................................31Table 11: Types of commodities exported to Zimbabwe............................................................34Table 12: Types of commodities imported from Zimbabwe........................................................35Table 13: Import process................................................................................................................44Table 14: Total travellers................................................................................................................45Table 15: Road users per country.................................................................................................45Table 16: Foreign travellers............................................................................................................46Table 17: Passenger movement between South Africa and Zimbabwe..................................46Table 18: Operator permits............................................................................................................48Table 19: Permits issued for freight transport..............................................................................49Table 20: Fines................................................................................................................................53Table 21 : Load Limits.....................................................................................................................54Table 22: Dimensional Limits.........................................................................................................55Table 23: N1 Tariffs (Pretoria – Beitbridge).................................................................................59Table 24 Freight Cross-Border Charges........................................................................................61Table 25: Bus Passenger Cross-Border Charges......................................................................61Table 26: Taxi Passenger Cross-Border Charges......................................................................61Table 27: Comparison with other countries..................................................................................64Table 28: Indicators of trading across borders.............................................................................65Table 29: Stages and documents for trading across borders.....................................................65Table 30: Contact Details................................................................................................................71
iv
COUNTRY FACT SHEETCOUNTRY ZIMBABWE
Political System RepublicPresident Robert MugabeLocation Southern Africa, north of the Tropic of
Capricorn between the Limpopo and Zambezi rivers.
Area (sq km) Total: 390,580Land: 386,670Water: 3,910
Land Boundaries (km) Botswana - 813Mozambique - 1,231South Africa - 225Zambia - 797
Capital City HarareClimate Tropical; moderated by altitude; rainy season
(November to March)Terrain Mostly high plateau with higher central
plateau (high veld); mountains in eastNatural Resources Platinum, diamonds, coal, iron ore, copper,
zinc,chrome, gold, silver, magnesium limestone, arable land
Population 14 150 000 where 52% are women and 48% are men
Language Chewa, Chibarwe, English, Kalanga, Koisan, Nambya, Ndau, Ndebele, Shangani, Shona, sign language, Sotho, Tonga, Tswana, Venda and Xhosa.
Currency US Dollars, Rand, Pula, British Pound.Provinces Bulawayo Metropolitan, Harare Metropolitan,
Manicaland, Mashonaland Central, Mashonaland East, Mashonaland West, Masvingo, Matebeleland North,Matabeleland South and Midlands
Main source of revenue Taxes which contributed 93.6% of total revenue in Q1 2014
Main Exports Minerals and TobaccoMost Productive Sectors Agriculture, Mining, Financial Services and
TelecommunicationsLand Wealth 8.6 million hectares of potentially arable land
and more than 5 million hectares of forests, national parks, and wildlife estates
Economically Active Population 5,120,540 of which 11.1% classified as unemployed
GDP growth rate 4.5% in 2013Total Foreign Debt US$8.934 billion
v

LIST OF ACRONYMNSACP Africa, Caribbean and Pacific Trade
BBR Beitbridge-Bulawayo Railway Company
BOT Build Operate and Transfer
C-BRTA Cross-Border Road Transport Agency
COMESA Common Market for Eastern and Southern Africa
DBSA Development Bank off Southern Africa
EPA Economic Partnership Agreement
ESA Eastern and Southern African countries
EU European Union
GDP Gross Domestic Product
MoU Memorandum of Understanding
NCC National Competitiveness Commission
NPMC National Pricing and Monitoring Commission
NSC North South Corridor
OECD Organisation for Economic Co-operation and Development
PTCOM Protocol on Transport Communications and Meteorology
RECs Regional Economic Communities
RBZ Reserve Bank of Zimbabwe
SA South Africa
SACU Southern African Customs Union
SADC Southern African Development Communities
SARS South African Revenue Services
SEZ Special Economic Zones
TKC Trans-Kalahari Corridor
WTO World Trade Organisation
ZAMCO Zimbabwe Asset Management Corporation
ZIA Zimbabwe Investment Authority
vi

ZINARA Zimbabwe National Road Administration
EXECUTIVE SUMMARYThis Country Profile Report provides information on Zimbabwe that is relevant to cross-
border road transport operators, regulatory authorities and other stakeholders with interest in
cross-border business between Zimbabwe and South Africa. The report provides an update
of recent developments in Zimbabwe with regards to the performance of the economy, road
transport related issues including relevant legislation and policies that affects cross-border
operations. It also covers passenger transport statistics and freight volumes conveyed
between South Africa and Zimbabwe.
The aim of the Cross-Border Road Transport Agency (C-BRTA) is to profile all the Southern
African Development Community (SADC) Member States that South Africa has bilateral road
transport agreements with. The long-term objective is to broaden the scope and profile all
the SADC Member States.
Zimbabwe experienced a deteriorating economic, political and social environment since
2000. The deep and long economic and social crisis was characterised by a hyper
inflationary environment, deindustrialisation marked by a sharp drop in capacity utilisation
and closure of industries, large scale job losses, poor service delivery as a result of the
‘brain drain’ and a sharp drop in Gross Domestic Product (GDP). Following the introduction
of the multiple currency system in 2009 the economy rebound with growth at an average rate
of 11.0% per annum.
The economic recovery was also underpinned by the mining and agriculture sectors, which
accounted for 93.5% of export revenues between 2009 and 2013. GDP growth however,
decelerated sharply from 11.9% in 2012 to 4.5% in 2013 and 3.1% in 2014, but is expected
to marginally improve to 3.2% in 2015. The growth in 2015 was underpinned by strong
performance in agriculture. The tourism sector is expected to benefit from the
implementation of the tourism policy, launched in July 2014 to promote both international
and domestic tourism in the country. The policy articulates tourism development and
marketing and promotion strategies.
To address the declining economy, the government developed several short, medium and
long term policies and programmes which includes aid coordination and debt management,
promotion of domestic and foreign investment, private and productive sector support and
trade promotion, youth and women economic empowerment, promotion of value-addition
and entrepreneurship in the informal economy, local economic development, beneficiation
and competitiveness enhancement, reorienting training and skills development,
vii

infrastructure (energy, water, transport) rehabilitation as well as exploring new opportunities
in the green economy.
The transport sector faces challenges owing to resource constraints, obsolete equipment,
corruption, mismanagement, vandalism and absence of a robust corporate governance
policy. Currently there is no effective and efficient public transport system in the country. The
private transportation system is under stress from overregulation and corrupt practices. This
negatively impacts the ability of the nation to efficiently move people resulting in poor
productivity and employment generation.
Several projects are identified to strengthen infrastructure. These road rehabilitation plans
include road construction, overlays, reseals and re-gravelling activities. The identified
projects are the Beira-Zimbabwe road, the Plumtree-Bulawayo-Harare-Mutare road using
the loan which was secured from the Development Bank of South Africa and the Beitbridge
Masvingo-Harare-Chirundu upgrade.
There is growth in the tourism sector in Zimbabwe and this may positively impact demand for
cross-border passenger transport services. On the other hand, the economic decline in
Zimbabwe creates huge opportunities for the local industry and transport operators as it
translates to increased demand for imported goods. It is envisaged that this may increase
the demand for cross-border transport services.
Additionally, the fact that there is a net growth in imports into Zimbabwe means that the
country is importing more than what it is exporting. The effect of this is that there are more
commodities transported into Zimbabwe than there are commodities transported from
Zimbabwe. This means that there is more demand for cross-border road transport for
inbound trips, than there is for outbound trips.
Meanwhile, South Africa remains Zimbabwe’s largest trading partner, accounting for about
40% of the total exports and 60% of total imports. Zimbabwe and South Africa are set to
introduce the Zimbabwe-South Africa Simplified Trade Regime as a means of facilitating and
formalising small-scale trade between the two countries. It is anticipated that this would
boost the demand for cross-border road freight transport and also passenger transport
demand. Lastly, the C-BRTA, the DoT and the Minister of Transport shall continue to work
with other stakeholders in the cross-border value chain towards the reduction of constraints
that negatively affect cross-border operations between South Africa and Zimbabwe. It is
important for transport operators and the local industry to take note of the envisaged
developments and economic trends in Zimbabwe.
viii
1. INTRODUCTION AND BACKGROUND
1.1 IntroductionThe aim of this Country Profile report is to provide a consolidated platform for the
dissemination of information that is useful to key stakeholders in the cross border
environment, particularly cross border road transport operators, regulatory authorities and
trading parties. It is anticipated that information captured in this Country Profile will be used
to support informed decision making and identification of opportunities by all parties cited
above, in respect to the Zimbabwean segment of the cross border industry.
The basis for this report is informed by the legislated mandate of the C-BRTA where the
Agency is mandated to: provide advice to key public and private industry stakeholders on
various matters including challenges facing the industry and possible solutions, disseminate
relevant information to stakeholders, improve the unimpeded flow by road of freight and
passengers in the region, reduce operational constraints for the cross-border road transport
industry and commitment to empower the cross-border road transport industry to maximise
business opportunities. It is therefore envisaged that, by providing this information to the
stakeholders, the Agency will be advancing its mandate and also advancing the interests of
the industry stakeholders as well.
1.2 BackgroundThe C-BRTA is a regulatory authority founded in terms of the Cross-Border Road Transport
Act No 4 of 1998, as amended, for the purpose of facilitating unhindered movement of
persons, services and goods between South Africa and neighbouring countries in the region.
The core mandate of the Agency is to:
Improve the unimpeded flow of freight and passengers in the region;
Introduce regulated competition in respect of cross-border passenger road transport;
Reduce operational constraints for the cross-border road transport industry as a
whole;
Liberalise market access progressively in respect of cross-border freight road
transport;
Enhance and strengthen the capacity of the public sector in support of its strategic
planning, enabling and monitoring functions; and
1

Empower the cross-border road transport industry to maximise business
opportunities and to incrementally regulate themselves to improve safety, security,
reliability, quality and efficiency of services.
The C-BRTA Act defines the four core functions which support delivery of the mandate of the
Agency: regulatory, facilitation, advisory and conducting law enforcement in a cooperative
and coordinated manner with regards to cross-border road transport. With regard to its
advisory function, the Agency is required to provide advice to the transport industry
stakeholders pertaining to cross border transport matters. Such advice serves as input to
strategic planning, and assists in decision making and planning processes of cross border
road transport operators.
Additionally, there are other instruments that also provide the broader context of the
mandate of the Agency and these include: the SADC Protocol on Transport,
Communications and Meteorology (PTCM), the Southern African Customs Union (SACU)
Memorandum of Understanding (MoU) on Road Transportation, Trans-Kalahari Corridor
MoU and Bilateral Cross-Border Road Transport Agreements with Malawi, Mozambique,
Zambia and Zimbabwe.
South Africa and Zimbabwe are both signatories to the SADC PTCM and have bilateral
agreements on the cross-border movement of passengers and freight as indicated. These
instruments provides for the Agency’s broader strategic mandate of regulating and improving
the unimpeded flow of cross-border road transport in the region for improved efficiency,
market access and economic development.
The C-BTRA’s mission is to regulate and facilitate unimpeded flow of cross-border road
transport in a manner that optimises mobility and accessibility with a view to achieve the
seamless integration of SADC. It is anticipated that this would culminate in the improvement
of trade, productivity and competitiveness of the region and thus bolstering job opportunities
and ultimately contribute towards regional prosperity and poverty reduction.
1.3 Purpose of the reportThe purpose of this report is to provide up to date information about Zimbabwe focusing on
road transport environment, regulatory requirements of cross-border transportation, imports
and exports trends, economic developments and ease of doing business. By providing
information on these parameters to relevant stakeholders it is anticipated that the information
2

will be used for purposes of future planning, identification of business opportunities, finding
solutions to overcome challenges that may be experienced on key corridors linking South
Africa and Zimbabwe.
The direct impact of this will be improvement in business operations, savings on time and
costs and therefore improving productivity in their respective areas of business. For
instance, if transport operators are adequately provided with all relevant information prior to
a journey, they will definitely plan better for every trip undertaken, optimizing travel times and
even return loads. Such information will also be useful for where and when they are
transporting perishable and urgent consignments, particularly towards enhancing faster and
efficient transportation of the goods.
1.4 ObjectiveThe objectives of this country profile are to:
Provide relevant information that can be used by cross border road transport
operators in conducting their business;
Help transport operators to understand better the countries that they do business in,
in order to position themselves for the evolving realities of competing in a global
context;
Assist relevant stakeholders know and understand the requirements of doing
business in Zimbabwe; and
Provide information with respect to possible opportunities for South African cross
border road transport operators.
It is envisaged that through the information contained in this report, operators will be able to
benefit from the knowledge of the operating environment in Zimbabwe. By doing so, the C-
BRTA will also be making progress in regard to providing advice to industry stakeholders to
make informed decision.
1.5 Structure of the reportThe report is divided into nine chapters for ease of articulation of most areas of interest to
cross-border road transport industry stakeholders. The sections have been sequenced to
enhance flow as follows:
Chapter 1: The introductory chapters encapsulate the background, and the overall
objectives of the report;
3
Chapter 2: Overview of Zimbabwe;
Chapter 3: Economic Developments: provides an overview of the economy;
Chapter 4: Trade Industry: explores the imports and exports between South Africa
and Zimbabwe, legislation guiding operators and documents required for importation;
Chapter 5: Passenger Transport: looks at the volumes and trends of passengers
travelling between Zimbabwe and South Africa;
Chapter 6: Road Transport Environment: gives information on the different aspects
of road transport in Zimbabwe, including relevant legislation, regulatory framework,
transport agreements as well as requirements for cross-border transportation; and
Chapter 7: Business Environment: assesses the ease and cost of doing business in
Zimbabwe also looking at Road User charge;
Chapter 8: Conclusion; and
Chapter 9: Contact Details for relevant regulatory authorities.
4

2. OVERVIEW OF ZIMBABWE Zimbabwe, officially the Republic of Zimbabwe, is a landlocked country located in southern
Africa, between the Zambezi and Limpopo rivers. It is bordered by South Africa to the south,
Botswana to the southwest, Zambia to the northwest and Mozambique to the east. The
capital city is Harare.
Figure 1: Map of Zimbabwe
Source: http://www.mapsofworld.com
Zimbabwe was historically the site of many prominent kingdoms and empires, as well as a
major route for migration and trade. It was formerly known as Southern Rhodesia (1898),
Rhodesia (1965), and Zimbabwe Rhodesia (1979). Zimbabwe was first demarcated by Cecil
Rhodes' Company during the 1890s, becoming the self-governing colony of Southern
Rhodesia in 1923. In 1965 the conservative white minority government unilaterally declared
5

independence as Rhodesia but the United Kingdom did not recognise the act and demanded
more complete voting rights for the black African majority in the country. The state endured
international isolation and a 15-year guerrilla war with Black Nationalist forces; this
culminated in a peace agreement that established universal enfranchisement and
sovereignty in April 1980.
The name "Zimbabwe" is based on a Shona term for Great Zimbabwe, an ancient ruined city
in the country's south-east whose remains are now a protected site. There are two theories
on the origin of the word. Many sources hold that the word is derived from dzimba-dza-
mabwe, translated from the Karanga dialect of Shona as "large houses of stone" (dzimba =
plural of imba, "house"; mabwe = plural of bwe, "stone"). The Karanga-speaking Shona
people are found around Great Zimbabwe in the modern-day province of Masvingo. Others
claim that "Zimbabwe" is a contracted form of dzimba-hwe which means "venerated houses"
in the Zezuru dialect of Shona, and is usually applied to chiefs' houses or graves.
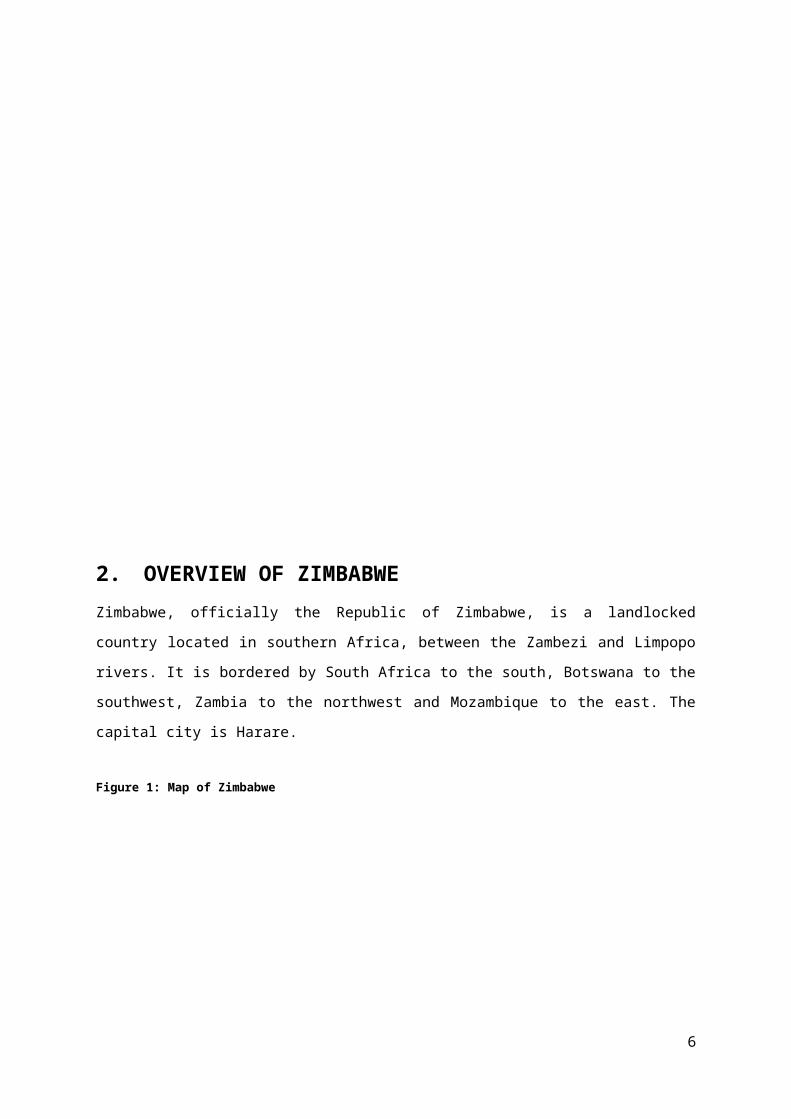
2.1 DemographicsZimbabwe has a total population of 14.15 million and the growth pattern is depicted in figure
2 below, with the age structure shown in figure 3.
Figure 2: Population growth pattern
Source: World Bank Data 2014
Figure 3: Age Structure
6

Source: ZIMSTAT, 2014, Quarterly Digest of Statistics
The population is split between the minority ethnic groups including white Zimbabweans,
who make up less than 1% of the total population. They are mostly of British origin, but there
are also Afrikaner, Greek, Portuguese, French and Dutch communities. The white population
dropped from a peak of around 278,000 or 4.3% of the population in 1975 to possibly
120,000 in 1999 and was estimated to be no more than 50,000 in 2002. The 2012 census
lists the total white population at 28,782 or .22% of the population. Most emigration has been
to the UK (between 200,000 and 500,000 Britons are of Rhodesian or Zimbabwean origin),
South Africa, Botswana, Zambia, Canada, Australia and New Zealand. Coloureds form 0.5%
of the population, and various Asian ethnic groups, mostly of Indian and Chinese origin, are
also 0.5%.
The fact that there is a sizable population in the active age-group indicates that there is
potential for sustained increase in cross-border travel. Given the thriving economic
conditions and longstanding relations and travel road passenger travel patterns between
South Africa and Zimbabwe, this indicates that the demand for cross-border road passenger
transport will remain stable or increase in the future. To this end, cross-border operations are
likely to remain sustainable and viable between the two countries.
2.2 LanguageZimbabwe has 16 official languages and under the constitution, an Act of Parliament may
prescribe other languages as officially recognised languages. English is the main language
7
used in the education and judiciary systems. The Bantu languages Shona and Sindebele are
the principal indigenous languages of Zimbabwe. Shona is spoken by 70% of the population,
Sindebele by 20%. Other minority Bantu languages include Venda, Tsonga, Shangaan,
Kalanga, Sotho, Ndau and Nambya. Less than 2.5%, mainly the white and Coloured (mixed
race) minorities, consider English their native language.
3. ECONOMIC OUTLOOKZimbabwe was one of the most prosperous economies in Africa, but the country has
suffered over the last ten years due to failed economic policies and natural disasters. In
2008 the economy collapsed, and at the end of 2008 the inflation rate was the highest in the
world for an independent country. The economy showed signs of improving with the
establishment of the Government of National Unity in February 2009 and the adoption of
macroeconomic stabilisation policies including the multi-currency regime. The adoption of a
multi-currency regime and discontinuation of the devalued currency helped restore price
stability.
The recovery was also due to:
Mining and Agriculture; where the mining sector became the leading export sector,
largely due to high mineral prices and expanded platinum, diamonds and gold output
as seen on Figure 4. Mining became the most dynamic sector, replacing the role of
agriculture in the pre-crisis Zimbabwe. The average share of GDP of mining grew
from an average 10.2% in the 1990s to an average 16.9% from 2009-2011.
Strong external demand for primary commodities supported higher production levels,
which recovered the pre-2000 levels in terms of value.
Growth in overall investment from 2% of GDP in 2008 to 9% of GDP.
8
Figure 4: Drive to recovery post 2009 by mining
Source: ZIMSTAT, 2014
The GDP growth was 6.3% in 2010, 9.6% in 2011 and 11.9% in 2012, mostly due to
expansion in the mining and agriculture sectors as shown in Figure 5 below. However, GDP
growth decelerated sharply from 11.9% in 2012 to 4.5% in 2013 and 3.1% in 2014. Real
GDP is projected to marginally improve to 3.2% in 2015. This projected marginal
improvement will be on the back of planned investments in agriculture, mining,
communications and other infrastructure projects, including in the water and energy sectors.
Figure 5: Zimbabwe GDP Annual growth rate
Source: ZIMSTAT
9
Despite the strong 2009-2012 economic rebound, the decline in growth is due to depressed
mining and manufacturing sectors. The mining sector is dampened by easing international
prices, weak investment and rising production costs. The manufacturing sector is expected
to remain sluggish at 1.4% in 2015, reflecting competitiveness pressures, subdued
investment and further tightening of credit conditions. Agriculture which posted a robust 23%
growth in 2014 could slow down to less than 3.5% in 2015 due to inadequate financing and
flooding in some areas. The deceleration trend is threatening negative growth in 2015.
When comparing the economy of Zimbabwe with other countries it shows that Zimbabwe is
growing at a smaller rate and the size of its GDP is the lowest at 14.1 as per the below
figure.
Figure 6: Comparative GDP Figures
South Africa393
Nigeria304
Egypt269
Angola135
Kenya52.2
Mozamb.17.2
Zimbabwe14.1Botswana
19.2Tanzania
34.9Zambia24.6
0
1
2
3
4
5
6
7
8
9
10
1 2 3 4 5 6 7 8
GDP
Grow
th
2014
(%
)
AvgGDP Growth 2011-13 (%)
Source: J. Wade 2014
Inflation developments are influenced by the USD/ZAR exchange rate, international oil
prices and local utility charges. Persistent liquidity shortages combined with low effective
demand and a weak South African Rand will dampen inflationary pressures in the economy.
The country experienced a decline in money supply in 2013. At the same time, the South
African Rand depreciated by about 20% in 2013. In 2013, inflation averaged about 2.1%, it
closed 2014 at -0.8% and slipped further into the negative, to -1.3% in January 2015
reflecting continued weakening of the South African Rand and depressed aggregate
demand.
10

Figure 7: Inflation rates
Source: GoZ, Ministry of Finance and Economic Development, 2014, Treasury State of the Economy Report May 2014
Zimbabwe’s economic freedom score is 38.2, making its economy the 175th freest in the
2016 Index. Its score has increased by 0.6 points from last year. Economic growth and the
restoration of monetary stability have staved off complete collapse in Zimbabwe, but
rampant corruption and government mismanagement have turned a once-diversified
economy with well-developed infrastructure and an advanced financial sector into one of
Africa’s poorest and most repressed. The lack of property rights, reflected most vividly in a
land redistribution program that gutted the agricultural sector, has suppressed
entrepreneurial activity.
The index scores nations on the following 10 broad factors of economic freedom:
Business Freedom (37.6): it is a quantitative measure of the ability to start, operate,
and close a business that represents the overall burden of regulation as well as the
efficiency of government in the regulatory process;
Trade Freedom (50.2): a composite measure of the absence of tariff and non-tariff
barriers that affect imports and exports of goods and services. Different imports
entering a country can, and often do, face different tariffs;
Monetary Freedom (79.1): combines a measure of price stability with an assessment
of price controls. Both inflation and price controls distort market activity. Price stability
without microeconomic intervention is the ideal state for the free market;
11

Government Size/Spending (73.6): This component considers the level of
government expenditures as a percentage of GDP. Government expenditures,
including consumption and transfers, account for the entire score;
Fiscal Freedom (60.8): a measure of the tax burden imposed by government;
Property Rights (10.0): The property rights component is an assessment of the ability
of individuals to accumulate private property, secured by clear laws that are fully
enforced by the state;
Investment Freedom (10.0): In an economically free country, there would be no
constraints on the flow of investment capital. Individuals and firms would be allowed
to move their resources into and out of specific activities internally and across the
country’s borders without restriction;
Financial Freedom (10.0): is a measure of banking efficiency as well as a measure of
independence from government control and interference in the financial sector;
Freedom from Corruption (21.0): Corruption erodes economic freedom by introducing
insecurity and uncertainty into economic relationships. The higher the level of
corruption, the lower the level of overall economic freedom and the lower a country’s
score; and
Labour Freedom (30.0): a quantitative measure that looks into aspects of the legal
and regulatory framework of a country’s labour market.
The 10 factors are averaged equally into a total score. Each one of the 10 freedoms is
graded using a scale from 0 to 100, where 100 represent the maximum freedom. A score of
100 signifies an economic environment or set of policies that is most conducive to economic
freedom.
Zimbabwe is ranked last out of 46 countries in Sub-Saharan Africa, and its overall score
remains far below the world and regional averages. Zimbabwe has experienced five
consecutive years of improvements in economic freedom as seen in Figure 8 below. Over
the past five years, economic freedom in Zimbabwe has improved by 15.5 points, the largest
improvement of any nation. The biggest score gains have been in monetary freedom and the
control of government spending. A move to dollarize the economy has brought the
hyperinflation of 2008 and 2009 under control
12
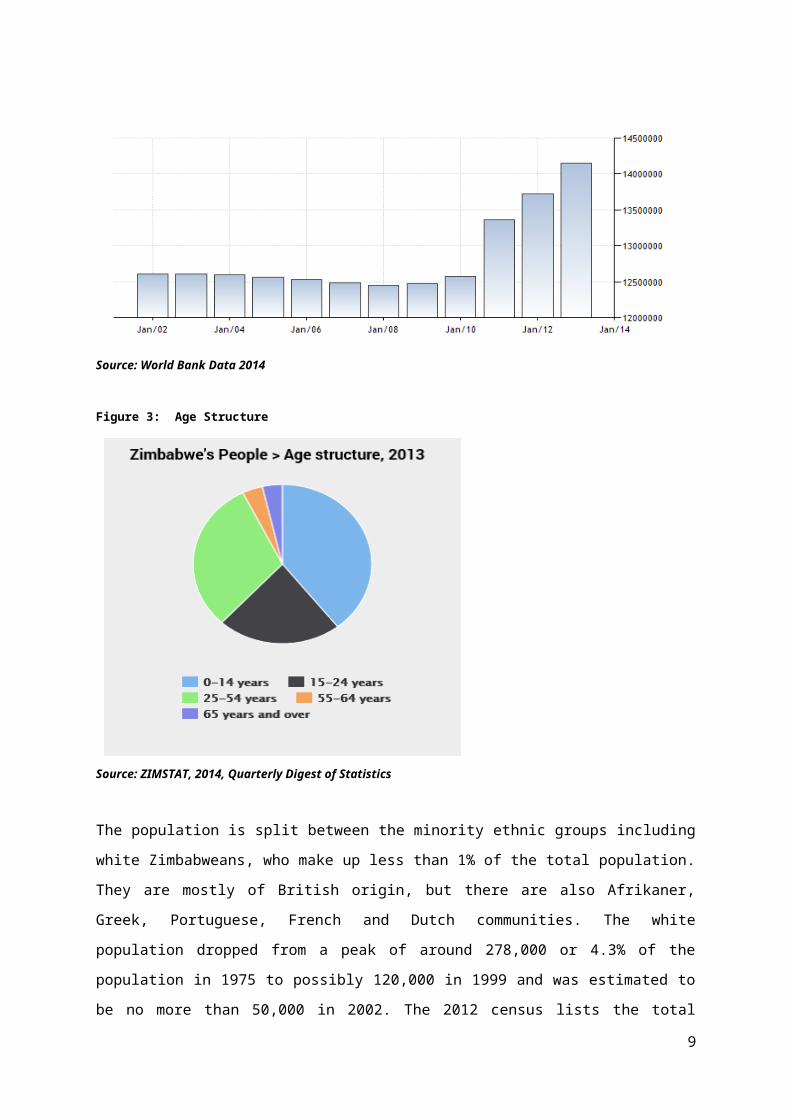
Figure 8: Freedom Trends and Country Comparisons
Source: 2015 Index of Economic Freedom
The external position remains under pressure. Exports contracted by 8.7% in 2014, and are
expected to remain depressed in 2015. Imports declined by 7.4% in 2014. The current
account is estimated at 22% of GDP and could narrow to 19% in 2015. It is largely financed
by short term capital inflows and remittances. Reserves are inadequate while foreign direct
investment (FDI) levels remain persistently low.
3.1 Recent developments and prospectsEconomic growth in 2014 was underpinned by strong performance in agriculture, which grew
by an estimated 23.4%. This helped to counteract the adverse effects of a drop in mineral
commodity prices, which has resulted in the growth of the mining sector declining by an
estimated 2.1%.
13

Tobacco production increased significantly in 2014 as the number of growers and the
acreage increased. The increase in producer prices also boosted sales prospects for the
2014/15 agriculture season and production of the main crops – maize, tobacco and cotton –
is expected to remain on an upward trend. Overall, agricultural growth for 2015 is projected
at 3.4%. The mining sector is expected to rebound in the medium term due to the planned
completion of the merger and consolidation exercise in the diamond sector, as well as
finalisation of the amendments to the Mines and Minerals Act and the new mining fiscal
regime.
Production in the manufacturing sector is expected to decline further due to import
competition and the financial problems of companies. Manufacturing sector activity
continues to be weighed down by out-dated plants and machinery, cheap imports, the high
cost of production and liquidity constraints. Capacity utilisation has shed 3.3 % points, from
39.6% in 2013 to 36.3% in 2014 due to erratic power supplies, lack of capital, higher input
costs, obsolete machinery and dilapidated infrastructure.
The tourism sector is expected to benefit from the implementation of the tourism policy,
launched in July 2014 to promote both international and domestic tourism in the country. The
policy articulates tourism development and marketing and promotion strategies.
The Univisa pilot project between Zimbabwe and Zambia, which was launched on 28
November 2014 to promote the uninterrupted movement of tourists between the two
countries, is already under implementation. Under the pilot project, tourists from 40 eligible
countries only have to obtain one visa at a cost of USD 50 to visit both countries for a period
of 30 days. As a result, tourist arrivals are expected to increase to about 2.1 million in 2015
from 2 million in 2014. This translates into tourist sector growth of 4.7% in 2015, compared
to 3.9% in 2014.
The overall economic outlook in the short to medium term is sluggish owing mainly to the
continued liquidity crunch, policy inconsistency and the unsustainable external account and
debt situation. The government needs to implement policy reforms to ease the high cost of
doing business, achieve fiscal and external sustainability, reduce financial weaknesses and
unlock the potential for inclusive and pro-poor growth.
It is important for transport operators and the local industry to take note of the economic
trends in Zimbabwe particularly in regard to sectoral performance. Noting that while there is
growth in the tourism sector which may positively impact demand for cross-border
14

passenger transport services, other sectors like mining, agriculture and manufacturing are
on the decline. The decline negatively affects the availability of return loads for transport
operators.
On the other hand, the economic decline in Zimbabwe creates huge opportunities for the
local industry and transport operators as it translates to increased demand for imported
goods. The increase in demand for the goods may mean that transport operators may
optimise the high demand towards rationalising transportation rates in their favour (based on
urgency of the consignments).
3.2 Fiscal policyThe constrained fiscal space has forced the government to adopt a contractionary fiscal
policy stance causing the country to be less competitive and unattractive to marshal
resources for both public and private sectors, including concessional funding support.
Financial restrictions and the national debt have negatively affected the country’s access to
international funding and Public Enterprises ability to access competitive markets for
minerals, resulting in sub competitive prices being realised. Lack of private and public sector
investment is one of the biggest setbacks to stimulate economic growth and generate
employment. The government has implemented a cash budgeting framework, which helps
to keep the deficit at a relatively low level.
The credibility of fiscal policy has been compromised by underperformance on the revenue
side. As a result, fiscal policy does not reflect the key development priorities and social
objectives articulated in the Zimbabwe Agenda for Sustainable Socio-Economic
Transformation (Zim Asset).
3.3 Monetary policyThe use of the multi-currency regime limits the use of monetary policy instruments and
results in the Reserve Bank of Zimbabwe (RBZ) losing control over money supply, interest
rates and the exchange rate. The role of the RBZ is therefore largely limited to banking
supervision and the smooth operation of the national payment system to ensure financial
stability. The Bank has therefore, implemented the following measures to strengthen the
banking sector in the following Table.
15

Table 1: Policies to strengthen banking sector
POLICY OBJECTIVES PROGRESS TO DATE
Interbank/Aftrades facility To improve the circulation of
liquidity within the banking
sector to mitigate against
bank failures as a result of
temporary liquidity
challenges
Issuance of Aftrades started on
19 March 2015;
Target is to raise US$200
million;
Five banks have invested in
Aftrades
Zimbabwe Asset Management Corporation (ZAMCO)
To mitigate against Non
Performance Loans from
dragging down the economy.
ZAMCO has acquired US$ 157
million
Absolute amnesty on importers
To allow importers to start on
a clean slate by acquitting
Bills of Entry with a value
close to USD5.8 billion.
The policy achieved its
intended objective since banks
were granted the authority to
acquit all outstanding advance
payments covering the period
2009 to end of December
2013. To date, USD5.6 billion
has been cleared under the
amnesty.
Extension of Absolute amnesty on exporters
To identify non-recoverable
exports of $108 million with a
view to allowing exporters to
start on a clean slate.
$104 million worth of CDI
export forms were acquitted by
31 March 2015.
The use of multi-currencies in business transactions by Zimbabwe reduces the risk of the
negative effects of currency fluctuations on South African business including cross-border
operations. South African business may opt to be paid in the Rand currency or other
currencies that will be performing higher than the Rand at any given time in order to
maximise earnings on business transactions.
16
3.4 Emerging markets and developments in the corridor
3.4.1 Global Economic DevelopmentsGlobal economic activity remains moderate, characterised by uneven prospects among
countries and regions of the world. Economic activity in advanced economies is on a
rebound, while growth prospects for some large emerging market and developing economies
have somewhat weakened. In particular, the depreciation of currencies, coupled with the
redistributive and differential effects accompanying the decline in oil prices, has significantly
transformed the global economic landscape in the recent past.
3.4.1.1 Impact of Developments Advanced EconomiesEconomic activity in advanced economies gathered momentum in 2015, largely benefiting
from stronger recovery in the US, which instituted tight monetary policy measures. In this
regard, the US economy is projected to expand from a growth of 2.4% in 2014 to 2.5% in
2015. On the other hand, advanced economies in the Euro-area continue to pursue
accommodative monetary policy measures, a development that has occasioned capital flight
and the subsequent appreciation of the US$.
On the back of the expansionary monetary policy stance adopted by Eurozone countries,
interest and inflation rates have remained close to sub-zero levels. Consequently, advanced
economies are projected to grow from 1.8% in 2014 to 2.1% in 2015 and 2.4% in 2016.
Consequently, Zimbabwe continues to suffer from the negative effects of the US dollar
appreciation, which has undermined export competitiveness on the back of relatively high
domestic cost structures currently obtaining in the economy.
3.4.1.2 Emerging Market and Developing EconomiesMajor emerging market economies and oil exporters are experiencing a slowdown in
economic activity on account of the widespread depreciation of currencies coupled with
general commodity price deflation. Despite structural adjustments and policy efforts to
address financial vulnerabilities, economic growth in China is expected to decelerate from
7.4% in 2014 to 6.8% and 6.3% in 2015 and 2016 respectively.
The slowdown in China’s economic activity is attributed to the decline in fixed investment
growth. In India, activity is buoyed by stronger confidence, as government implements a
reform agenda with oil prices helping to contain vulnerabilities. As a result, economic growth
in India is projected to increase from 7.3% in 2014 to 7.5% in 2015 before stabilizing at 7.5%
in 2016.
17

Broadly, the decline in global oil prices has benefited Asian economies as evidenced by
improving fiscal and current account balances which facilitated the easing of monetary policy
in India, Pakistan and Sri Lanka. Economic activity in emerging market and developing
economies is projected to slow-down from 4.6% in 2014 to 4.2% in 2015 before somewhat
rebounding to 4.7% in 2016. The crash in the Chinese stock market experienced in the first
week of July, 2015 that resulted in a loss of US$3.2 trillion by investors, presents downside
risk to the Asian giant’s growth prospects. As a result, the demand for commodities may
remain subdued, with dampening effects on the recovery of commodity prices. This is likely
to have repercussions on commodity dependent economies such as Zimbabwe, through
lower export and fiscal revenues.
3.4.1.3 Sub-Saharan AfricaSub-Saharan African countries are projected to realise an economic slow-down from 5.0% in
2014 to 4.4% in 2015 before recovering to 5.1% in 2016. Oil producing economies notably,
Angola and Nigeria have experienced declining oil revenues with negative repercussions on
profitability and fiscal revenues. Table 2 below shows global economic growth for the various
regions of the world.Table 2: Global Economic Growth Rates (%)
Source: World Economic Outlook Update (July 2015), ZIMSTAT and RBZ projections
18

It is anticipated that the Zimbabwean economy may peak-up in 2016. This might increase
the demand for cross-border transport services. However, the projected growth is subject to
many factors including political stability and availability of electricity. It is therefore ideal that
a cautious approach be taken, when considering making investments in Zimbabwe or cross-
border road transport operations to Zimbabwe.
3.4.2 Developments in the CorridorSADC has configured corridors into “clusters”, that is, grouping of countries served by a set
of corridors which share ports and or other transport and logistics infrastructure in order to
facilitate joint planning, implementation, coordination, monitoring and reporting of regional
trade, transport facilitation and implementation of infrastructure projects.
The "Corridor Cluster" is used as an organisational vehicle for consultations and convening
technical and ministerial meetings that address the common issues across a set of corridors
shared by countries. The corridor clusters established in SADC are as presented in Tables
3- 6 below.
Table 3: Western Corridors Cluster
Table
4:
Eastern Corridors Cluster
CORRIDOR PORT MEMBER STATESDar es Salaam Corridor Dar es Salaam DR Congo, Malawi, Tanzania, ZambiaMtwara Development Corridor
Mtwara Malawi, Mozambique, Tanzania, Zambia
Nacala Development Corridor
Nacala Malawi, Mozambique, Zambia
Beira Development Corridor
Beira Mozambique, , Zimbabwe
Limpopo Development Corridor
Maputo Mozambique, Zimbabwe
Table 5: Southern Corridors Cluster
CORRIDOR PORT MEMBER STATES
19
CORRIDOR PORT MEMBER STATESLobito/Benguela Lobito Angola, DR Congo, Zambia
Bas Congo Matadi/Banana DR Congo, AngolaMalange Luanda Angola, DR CongoNamibe Namibe Angola, NamibiaTrans Cunene Walvis Bay Namibia, Angola, South AfricaWalvis Bay-Ndola-Lubumbashi (Trans Caprivi)
Walvis Bay Namibia, Zambia, DR Congo
Trans Kalahari Walvis Bay Botswana, Namibia, South AfricaTrans Orange Cape Town Namibia, South Africa
Maputo Development Corridor
Maputo Mozambique, Swaziland, South Africa
Manzini-Durban Durban Swaziland, South AfricaMaseru-Durban Durban Lesotho and South AfricaPhalaborwa-Richards Bay Richards Bay South Africa, Swaziland
Table 6: North South Corridor
CORRIDOR PORT MEMBER STATESNorth South Corridor Durban DRC, Botswana, Malawi, Mozambique, South
Africa, Tanzania, Zambia, Zimbabwe
The NSC is the busiest transport network across the 27 countries that make up the tripartite
region in terms of both traffic and freight volumes. It aims to bring together the initiatives
which are taking place along this corridor and identify missing links. The border posts on the
corridor are shown in Table 7.
Table 7: Border posts
Source: Economic benefits of an efficient North-South corridor; 2014
The North South Corridor (NSC) cuts across 8 countries with a total of 10,647 km of road. It
runs between the port of Dar es Salaam in Tanzania to the Copper belt of Zambia and
Democratic Republic of Congo and down through Zimbabwe and Botswana to the ports in
Southern Africa, taking in ‘spur’ connections to Malawi and Mozambique in the east as seen
in Figure 9.
20

Figure 9: The NSC Road Network
Source: www.tmsagis.co.za
Current traffic on the North-South Corridor is characterised by exports of mining and
agricultural products and imports of manufactured goods. The main operating feature of the
regional road transport routes which affects transport efficiency, costs and tariffs, is the
severe imbalance of freight flows, leading to empty return hauls. This imbalance is seasonal
and an empty return haul by road doubles the cost of transport. Traffic data collected in 2013
shows a summary of the average daily vehicle-kilometres by country as seen in Table 8.
This shows that the roads in South Africa carry about 70% of the total number of vehicle-
kilometres in the North-South Corridor. The number of medium and heavy goods vehicles,
expressed as a percentage of the total vehicle-kilometres for each country, varies from about
6.9% in Botswana to 34% in Zambia. The data for the Democratic Republic of Congo were
of low reliability.
21

Table 8: Average daily Vehicle-Kilometres in the North South Corridor
Source: Economic benefits of an efficient North-South corridor; 2014
The Government identified several road projects to strengthen infrastructure with assistance
from investors in 2014. The road rehabilitation plans involves road construction, overlays,
reseals and re-gravelling in addition to routine maintenance activities. The projects include:
The Beira-Zimbabwe mega road upgrades project and the construction of a second
bridge over River Pungue. The project involves two weigh bridges, three toll plazas,
six police checkpoints and 50 public transport stops. Once completed the bridge will
have two lanes and be 250 metres long;
The project also includes work on the rehabilitation and upgrading of a 288 kilometre
road between the port of Beira and border town of Machipanda and neighbouring
Zimbabwe. The road construction project will open landlocked countries that use the
port of Beira for foreign trade. These countries are Zimbabwe, Malawi, Zambia,
Botswana and DR Congo. Once completed, the country will be expecting an average
daily traffic of more than 3 000 vehicles;
The rehabilitation of the 820km highway from Plumtree-Bulawayo-Harare-Mutare
through a loan of $206 million from the Development Bank of South Africa (DBSA) to
fund the Infralink Project. The work entails rehabilitation, widening shoulder ceilings
and resurfacing the Plumtree to Harare and Harare to Mutare highways, including
installing nine toll plazas at a cost of $3m each;
The dualisation of all major roads to improve safety and infrastructure. These are:
o The multi-billion dollar Beitbridge-Masvingo-Harare-Chirundu highway upgrade;
22

o The rehabilitation of the Harare-Nyamapanda highway; which forms part of
the on-going programme to improve the country’s road network. The highway
is one of the country’s busiest roads, the road will be widened and there will
be a construction of a dual carriage way;
o The Bulawayo-Beitbridge Road is set to undergo a major facelift under a
regional initiative, North-South Corridor, targeting five roads in Zimbabwe,
Malawi and Botswana. The rehabilitation would be done concurrently, but in
two parts consisting of the Bulawayo to Gwanda and the 200km Gwanda to
Beitbridge roads. Three regional blocs are working on a NSC to unlock the
economic potential of landlocked countries in Southern and Eastern Africa;
and
o The $440m for Bulawayo- Victoria Falls upgrade.
23
4. TRADE INDUSTRYZimbabwe’s strong recovery from the hyperinflation and economic contraction during 2000-
2008 had encouraged hopes for its return to the strong socio-economic performance, and
middle-income prospects, of the 1990s. However, since 2012 the rebound has slowed, held
back by deteriorating terms of trade, adverse weather and continued political uncertainty.
Figure 10 below shows Zimbabwe exports and imports as a percentage of GDP, where 2011
it was the highest and there was a decrease in 2012.
Figure 10: Imports and Exports evolution
Source: ITC Trade Map
Total exports for 2013 were US$2.8 billion, against US$3.2 billion realised in 2012, and
US$4.430 billion in 2014. Imports continue to grow faster than exports, totalling US$6.6
billion in 2013, against US$6.1 billion realised in 2012. The fast growth in imports against the
sluggish growth in exports widens the current account deficit.
4.1 Exports PerformanceExports are an important source for liquidity and therefore account for over 50% of the total.
Recent data indicates a 0.4% growth in export receipts for the six months, January-June
2015. Total exports for this period amounted to US$1.23 billion, compared to US$1.22 billion
recorded in the corresponding period in 2014 as shown below in Table 9.
24
Table 9: Export Receipts (US)
Source: ZimStat, 2015
In terms of trading partners for the period January to June 2015, the country’s major export
market destinations were South Africa- accounting for 68%; Mozambique - 16%; and the
United Arab Emirates - 8% as shown below in Figure 11.
Figure 11: Exports Destinations
Source: ZimStat, 2015
The exports basket is dominated by mineral exports, at US$653 million, followed by tobacco
US$321 million among others. The sectoral breakdown of exports is indicated in the Pie
Chart below.
25

Figure 12: Sectoral Breakdown of exports
Source: ZimStat, 2015
For the rest of 2015, exports were projected to decline by 5%, owing to softening commodity
prices as well as some decline in agricultural output of our cash crops such as tobacco and
cotton as shown in Figure 13
Figure 13: Exports Developments
Source: Zimstat, 2015
The exports are driven by primary commodities with agriculture generating US$9.2 billion
(65.2%), horticulture and hunting weighing in with US$4 billion (28.3%) and the
26
manufacturing sector contributed the balance of US$0.9 billion (6.4%) as shown below in
Figure 14.
Figure 14: Exports by Sector
Source: World Bank data: Zimbabwe
The major constraints to export in Zimbabwe include lack of financing, lack of foreign
demand and high costs of transport followed by red tape in customs are amongst the top
constraints as illustrated in figure 15 below
27

Figure 15: Constraints to Export
Source: World Bank data: Zimbabwe
South Africa remains Zimbabwe’s largest trading partner, accounting for about 40% of the
total exports and 60% of total imports. Zimbabwe and South Africa are set to introduce the
Zimbabwe- South Africa Simplified Trade Regime as a means of facilitating and formalising
small-scale trade between the two countries. Under the agreement, qualifying goods worth
USD 1 000 or below will be allowed to pass border points duty-free, with no need to provide
certificates of origin for their goods as long as they are on the list of products agreed on by
the two countries.
It is anticipated that this would boost the demand for cross-border road freight transport and
also passenger transport demand. Transport operators should look into potential business
generation from this move and devise mechanisms to tap into this market. Overall
performance of the business can be optimised through cargo/ consignment consolidation
with a view to enhance viability and productivity.
During the last two years, Zimbabwe’s trade with South Africa was in excess of R20 billion
rising from R16, 2 billion in 2010 and R15.1 billion in 2009. However, in 2012, South Africa
slipped to fourth position despite a growing import bill with the regional powerhouse.
Zimbabwe exports to South Africa for 2012 were ZAR2.9 billion which was lower than the
28

2011 figure of ZAR3.1 billion. In terms of imports, Zimbabwe’s imports from South Africa
have been increasing. Zimbabwe imports from South Africa increased by 149% from ZAR7.3
billion in 2006 to ZAR18.2 billion in 2012.
Figure 16: Zimbabwe’s trade with South Africa
Source of data: http://www.sars.co.za
The main export products to South African include mineral products which in 2012
constituted about 43% of Zimbabwe’s total exports to South Africa. Other products which top
the list of Zimbabwe exports to South Africa are beverages, tobacco and manufactured
tobacco substitutes, precious metals and base metals.
The European Union (EU) is the country’s second biggest trading partner. The country
ratified an interim Economic Partnership Agreement (EPA) with the European Union (EU) in
March 2012. As a result of an appreciating US dollar relative to the South African rand, there
has been a loss in external competitiveness. The external position remains risky, with large
current account deficits and low international reserves. Both the trade and current account
balances remained negative with a slight improvement in 2015.
Zimbabwe’s main export items include platinum, cotton, tobacco, gold, ferroalloys and
textiles/clothing. These items are exported to countries such as the Democratic Republic of
the Congo, South Africa, Botswana, China, Netherlands and Italy.
29

Figure 17: Exports by destination
Source: WorldBank data: Zimbabwe
4.2 Imports PerformanceImports in Zimbabwe decreased to 522.62 USD Million in December from 560.68 USD
Million in November of 2014 as per Figure 18.
Figure 18: Zimbabwe Imports
Imports for the six months to June 2015 stood at US$3.1 billion compared to US$3 billion
recorded in the corresponding period in 2014 as shown in Table 10 below. This represents a
2% increase in imports over the first six months of last year.
30

Table 10: Imports to Zimbabwe
MONTH 2014 2015January 487 819 582.57 538 124 910.64February 478 794 479.89 503 084 161.49March 499 943 511.22 529 084 460.45April 491 606 257.48 465 892 773.90May 510 058 767.96 473 375 364.50June 528 100 342.45 555 077 091.55Total 2 996 322 941.58 3 064 638 762.52
Food imports are projected to increase by 64% in 2015, mainly on account of maize, given
the less than anticipated 2014/15 season harvest following the drought. Imports of wheat
are also projected to remain high in 2015, reflecting low domestic production levels, against
the background of declining hectarage under the irrigated winter crop. Major challenges
include power supply interruptions and the cost of power.
Overall, imports growth is projected to be about 6% in 2015 as shown below in Figure 19.
Figure 19: Imports Developments
The major sources of imports during the first six months of the year were South Africa, 40%;
followed by Singapore, 20%; and China, 7% and India, 7% as shown in Figure 20. The
country imports machinery and transport equipment, chemicals, fuels and food products.
31

Figure 20: Import destinations
Source: ZimStat, 2015
The trade balance between Zimbabwe and South Africa has over the years been in favour of
South Africa. Zimbabwe has always imported more than it exported to South Africa since
2006. Zimbabwe’s trade deficit with South Africa increased more than seven-fold over the
past four years to hit R15, 3 billion (about US$2 billion) according to statistics from SARS.
This is due to Zimbabwe's exports to SA declining over the last few years.
As seen earlier in 2012, Zimbabwe exported goods worth R2.9 billion to South Africa, while
importing R18.2 billion worth of goods from the southern neighbour. Figure 21 below shows
that since 2006, Zimbabwe’s imports from South Africa have been rising, exports declining
thereby resulting in the widening of the trade balance between the two countries in favour of
South Africa.
32
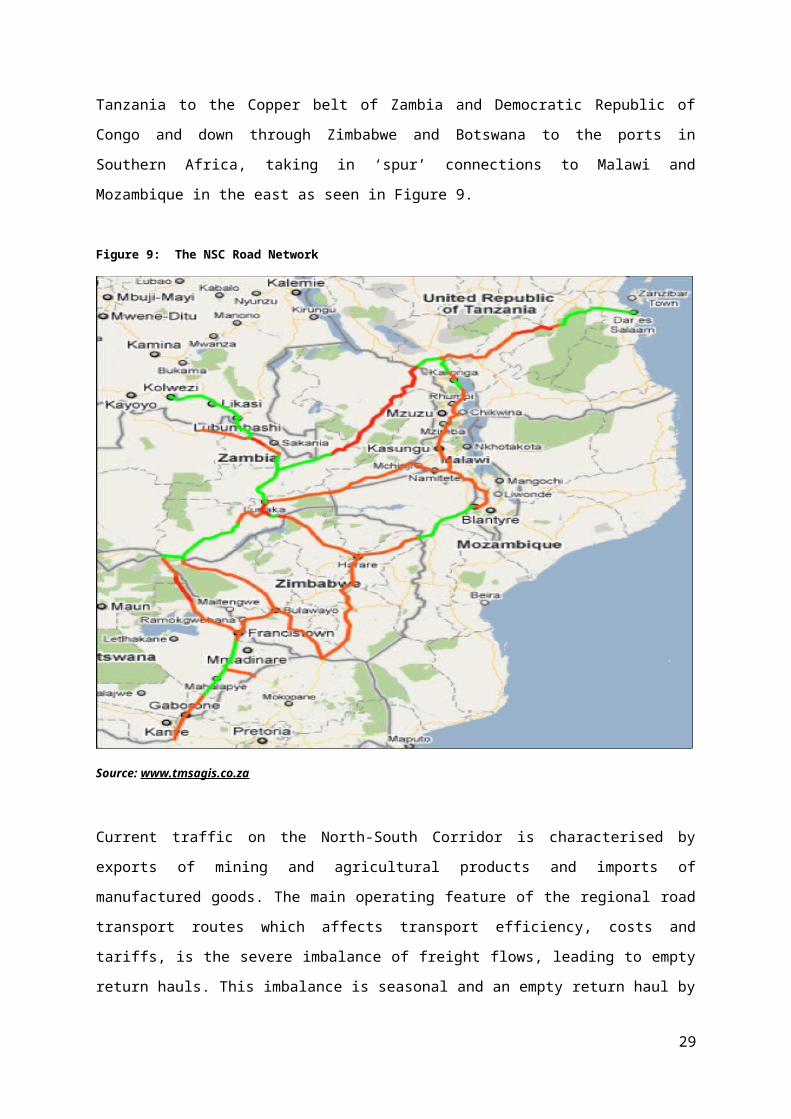
Figure 21: Zimbabwe’s trade balance with South Africa
Source: http//www.sars.co.za
4.3 Nature and Volume of Trade between South Africa and Zimbabwe
Total trade between South Africa and Zimbabwe increased from R26, 79 billion in 2014 to
R29, 99 billion in 2015. Figure 22 below shows how trade between South Africa and
Zimbabwe has steadily increased since 2011, it shows the total value, in Rand value, of
South African exports to Zimbabwe (Zimbabwe imports), and imports from Zimbabwe
(Zimbabwe exports).
Figure 22: Imports and Exports between South Africa and Zimbabwe
2011 2012 2013 2014 2015 -
5,000,000,000.00
10,000,000,000.00
15,000,000,000.00
20,000,000,000.00
25,000,000,000.00
30,000,000,000.00
35,000,000,000.00
ExportsImportsTotal Trade
33

Tables 11 and 12 below illustrate the nature of cargo traded between South Africa and
Zimbabwe. The tables also show the annual share of the different commodities as a
percentage of the total traded.
4.3.1 Exports from South Africa to Zimbabwe As evidenced in Table 11 below, the bulk of what is exported is products of chemical and
allied industries, machinery and mechanical appliance, vehicles, aircraft and transport
equipment, prepared foodstuff and plastics and rubber. These goods make up the top five
most exported commodities comprising 63.7% of total exports to Zimbabwe in 2015.
Table 11: Types of commodities exported to Zimbabwe
COMMODITY SHARE OF TOTAL EXPORTS FROM SOUTH AFRICA TO ZIMBABWE
2011 2012 2013 2014 2015
Vegetable products 4.87% 4.93% 8.70% 9.58% 6.51%Animal or vegetable fats & oils 7.64% 8.44% 4.81% 3.99% 3.72%Prepared foodstuffs; beverages, spirits & vinegar; tobacco
9.08% 9.87% 10.04%
9.63% 8.96%
Mineral products 7.56% 4.45% 4.30% 5.02% 5.03%Products of the chemical or allied industries 16.01
%16.05%
18.11%
17.85%
19.85%
Plastics & articles thereof; rubber 6.37% 6.85% 7.46% 7.65% 8.00%Raw hides & skins, leather, furskins 0.13% 0.13% 0.13% 0.10% 0.15%Wood & articles of wood; wood charcoal; cork
0.66% 0.76% 0.63% 0.68% 0.72%
Pulp of wood or of other fibrous cellulosic material; waste & scrap of paper or paperboard
3.96% 3.78% 3.95% 4.03% 4.06%
Textiles & textile articles 1.67% 1.55% 1.67% 1.49% 1.45%Footwear, headgear, umbrellas 0.39% 0.39% 0.46% 0.34% 0.38%Articles of stone, plaster, cement, asbestos, mica or similar materials; ceramic products; glass & glassware
1.41% 1.69% 1.66% 1.70% 1.93%
Natural or cultured pearls, precious or semi-precious stones
0.02% 0.00% 0.01% 0.06% 0.17%
Base metals & articles of base metal 9.82% 10.50%
8.92% 9.50% 10.05%
Machinery & mechanical appliances; electrical equipment
18.24%
18.99%
17.40%
16.16%
16.89%
Vehicles, aircraft, vessels & associated transport equipment
8.14% 7.49% 7.47% 7.77% 7.27%
Optical, photographic, cinematographic, measuring, checking, precision, medical or surgical instruments
1.13% 1.13% 1.25% 1.05% 1.18%
34

Miscellaneous manufactured articles 1.30% 1.36% 1.38% 1.54% 1.74%Works of art, collectors pieces & antiques 0.01% 0.00% 0.00% 0.01% 0.00%Other unclassified goods 0.08% 0.05% 0.03% 0.06% 0.02%Special classification of original equipment components/parts for motor vehicles
0.02% 0.00% 0.00% 0.00% 0.00%
4.3.2 Imports from Zimbabwe to South Africa Table 12 below shows South Africa’s total imports from Zimbabwe, from 2011 to 2015. The
top five commodities imported from Zimbabwe in 2015 accounted for 92.4% of total imports.
These include base metals at 43.5%, mineral products at 23.2%, prepared foodstuffs at
14.98%, and textiles at 5.96% and vegetable products at 4.72%.
Table 12: Types of commodities imported from Zimbabwe
COMMODITY SHARE OF TOTAL IMPORTS
2011 2012 2013 2014 2015
Live animals, animal products 0.115% 0.037% 0.048% 0.184% 0.082%Vegetable products 2.874% 3.179% 4.867% 8.654% 4.717%Animal or vegetable fats & oils 0.011% 0.003% 0.000% 0.001% 0.001%Prepared foodstuffs; beverages, spirits & vinegar; tobacco
17.907%
16.433%
17.757%
32.916%
14.981%
Mineral products 38.320%
44.389%
47.345%
16.107%
23.190%
Products of the chemical or allied industries
0.509% 0.400% 0.523% 0.692% 0.333%
Plastics & articles thereof; rubber 0.408% 2.317% 1.986% 2.038% 0.489%Raw hides & skins, leather, furskins 0.538% 0.759% 1.722% 3.195% 1.722%Wood & articles of wood; wood charcoal; cork
1.753% 2.093% 1.953% 4.393% 1.442%
Pulp of wood or of other fibrous cellulosic material; waste & scrap of paper or paperboard
0.165% 0.408% 0.340% 0.589% 0.407%
Textiles & textile articles 15.536%
10.278%
12.602%
12.863%
5.966%
Footwear, headgear, umbrellas 0.402% 0.547% 0.711% 0.894% 0.573%Articles of stone, plaster, cement, asbestos, mica or similar materials; ceramic products; glass & glassware
0.313% 0.217% 0.378% 0.667% 0.265%
Natural or cultured pearls, precious or semi-precious stones
10.690%
9.546% 1.901% 0.943% 0.086%
Base metals & articles of base metal 8.356% 6.383% 4.711% 8.966% 43.521%
Machinery & mechanical appliances; electrical equipment
1.434% 1.950% 2.102% 5.272% 1.634%
Vehicles, aircraft, vessels & associated transport equipment
0.162% 0.321% 0.249% 0.172% 0.058%
Optical, photographic, cinematographic, 0.056% 0.084% 0.062% 0.245% 0.047%
35

measuring, checking, precision, medical or surgical instrumentsMiscellaneous manufactured articles 0.371% 0.439% 0.531% 0.815% 0.218%Works of art, collectors pieces & antiques 0.078% 0.087% 0.095% 0.180% 0.106%Other unclassified goods 0.002% 0.129% 0.116% 0.212% 0.162%
4.4 Trade PolicyZimbabwe is a member of the WTO, the ACP-EU Cotonou Agreement, regional trade
arrangements (SADC, Common Markets for Eastern and Southern Africa (COMESA) as well
as bilateral trade agreements with neighbouring countries, i.e. the Trade Agreement Group,
which includes Botswana, Namibia, Malawi, Zambia and South Africa. All the arrangements
provide frameworks for further liberalisation of trade, and Zimbabwe has made commitments
within each of these arrangements towards that objective.
4.4.1 WTO commitmentsThe birth of WTO in 1995 coincided with the end of Zimbabwe’s economic reform period,
during which it carried out autonomous and unilateral trade liberalisation policies. By the time
commitments made under WTO came into effect, Zimbabwe already had a much more
liberal trade policy. Controls on imports and foreign exchange had been removed, tariffs
reduced, the domestic market de-controlled and the environment for foreign direct
investment improved. Zimbabwe viewed trade liberalisation within WTO as a complementary
and supportive international instrument to support national efforts.
It was expected that Zimbabwe’s trade and investment liberalization would result in
economic growth, employment creation, increased exports and integration of the country into
the world economy. As a developing country, Zimbabwe enjoyed some concessions
regarding compliance, longer implementation periods, and exemption from some
commitments, grace periods and technical support towards meeting its obligations. Five
years after the implementation of the WTO agreement, Zimbabwe was faced with challenges
of negotiating new commitments in the WTO Doha Round.
4.4.2 ACP-EU Cotonou AgreementAfter independence, Zimbabwe became a signatory of the Lomé Convention that provided
the basic framework for economic cooperation between the EU and 71 Africa, Caribbean
and Pacific Trade (ACP) countries. The ACP were given trade cooperation based on
nonreciprocal tariff preferences therefore guaranteeing better market access and market
36
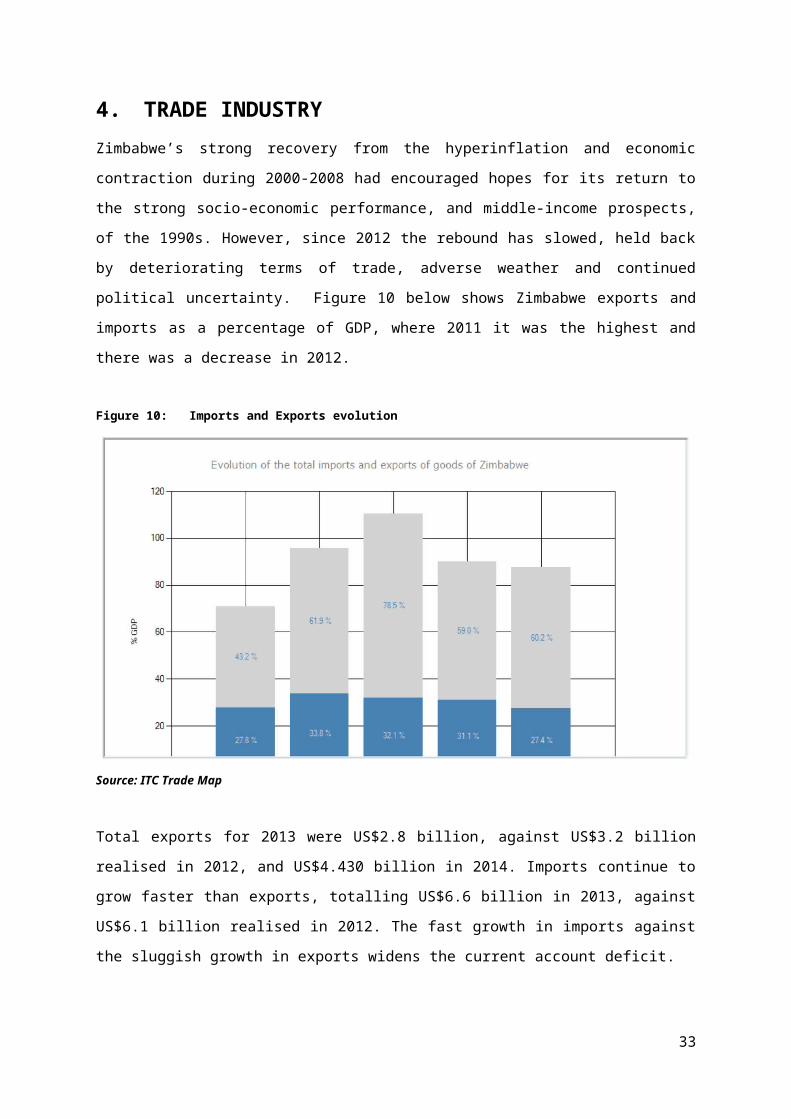
prices to goods originating from ACP countries. The impact of preferential market access
has generally been positive for Zimbabwe.
In the four consecutive years from 1994, Zimbabwe enjoyed a balance of trade surplus in its
trade with the EU. Exports to the EU currently account for about 36 per cent of the country’s
total exports and cover both traditional and non-traditional product lines. Major agricultural
export products to the EU are tobacco, cotton, meat products, tree plants, and cut flowers.
Under the Convention’s Beef and Veal Protocol, Zimbabwe has a preferential tariff quota
that allows it to export 9 100 tonnes of beef into the EU annually. Under the Sugar Protocol,
Zimbabwe’s preferential tariff quota stands at 30 225 tonnes annually supplemented by a
variable Special Preferential Sugar quota.
The current diplomatic row between Zimbabwe and the EU has culminated in the imposition
of “smart sanctions” which is based on the ACP-EU Cotonou Agreement, where Zimbabwe
has violated article 9 of the Agreement, which deals with maintenance of the rule of law,
human rights, democracy and good governance. This might lead to deterioration in export
market access for the country since the EU is Zimbabwe’s main market especially for
agricultural products.
4.4.3 Regional trade integrationRegional integration within SADC and COMESA is another important platform through which
Zimbabwe is undertaking further trade liberalisation measures. Regional Economic
Communities (RECs) are the key-building blocs for economic integration and key actors in
ensuring political stability in their geographical areas. The RECs have the immense
challenge of raising the standard of living of the people of Africa and contributing towards the
progress and development of the continent by achieving economic growth, promoting peace
and security and evolving common political values as well as systems and institutions
among African countries (Ndumo, A: 2009).
Zimbabwe is a member of both COMESA and SADC. It first joined SADC which was
established in 1992 and in 1994 joined COMESA. SADC is a development community with a
broad range of objectives varying from self-sustained development, economic growth and
poverty alleviation to common political values, systems and institutions. Zimbabwe supplies
a variety of products to SADC, including tobacco, cotton, oil cake and soya beans, maize,
live bovine animals, coniferous wood, cotton seeds, light manufactures and imports in
exchange fuels, vehicles, explosives, chemicals machinery, plastics, paper and steel.
37
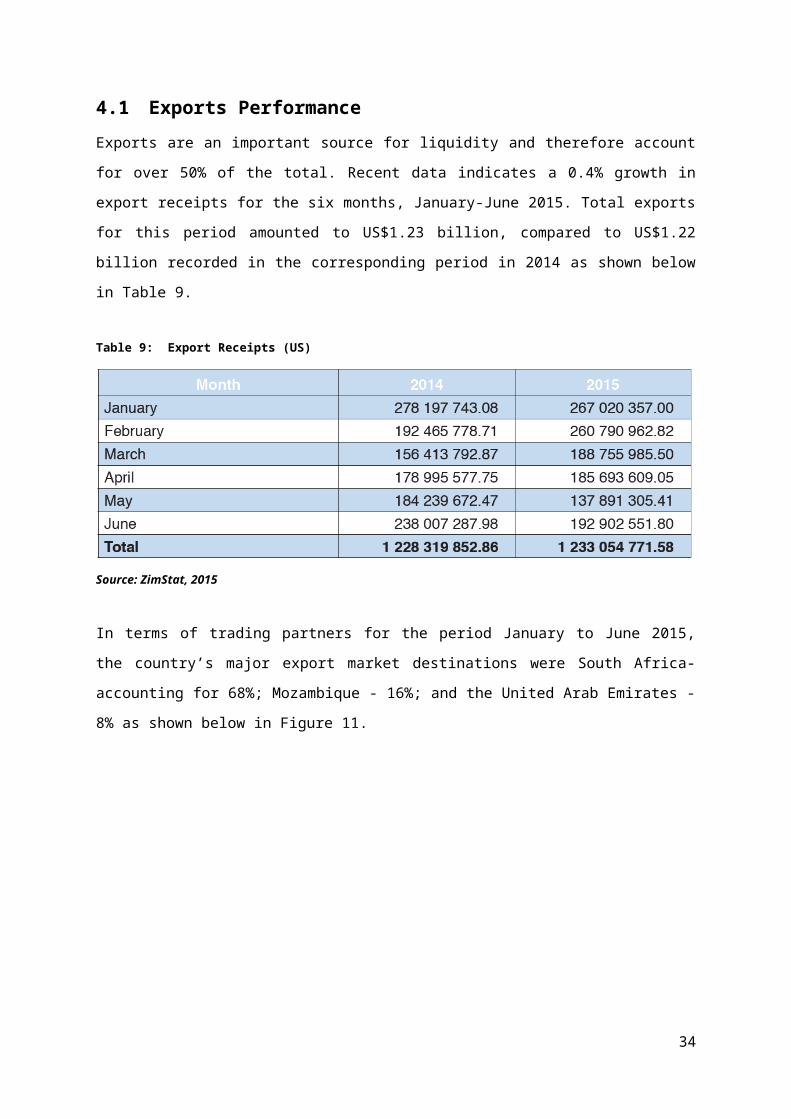
COMESA is a free trade area with twenty member states stretching from Libya to Swaziland.
COMESA’s main focus is on strengthening regional integration through promotion of cross-
border trade and investment. It has programmes on trade and transport facilitation, trade in
services, free movement of persons and investment. In November 2000, COMESA launched
its free trade area with duties on a wide range of goods reduced to zero. Trade with
COMESA countries is characterised by a huge surplus trade balance that has existed since
COMESA was founded. Zimbabwe’s major imports from COMESA include food and live
animals, crude materials, manufactures, beverages and tobacco, while its exports are
dominated by food products, manufacturing, chemicals, transport equipment and machinery.
The overlap as illustrated in Figure 23 below creates uncertainty as to which tariff rates and
rules of origin should be applied to trade between two countries that belong to both
organisations, these disparities in tariff structures poses a challenge to any harmonisation
initiative. It also puts financial strain on Zimbabwe, as it has to pay subscriptions towards
sustaining two parallel secretariats and sometimes-similar programmes.
Figure 23: Overlapping Membership
Source: Convergence of COMESA-SADC-EAC Regional Frameworks: 2009
The problems of overlap and conflicting obligations are exacerbated by the choice of
Economic Partnership Agreement (EPA) negotiating bloc. Zimbabwe as a member of both
SADC and COMESA is also a member of the ESA-EPA. If Zimbabwe wants to remain part
of the ESA-EPA configuration, then it will have to adopt the COMESA CU, as this is what the
ESA configuration is premised on. If it chooses to pursue the CU of SADC however, it
cannot therefore remain a member of the ESA-EPA configuration, as it is meant to form part
of the separate COMESA CU.
38
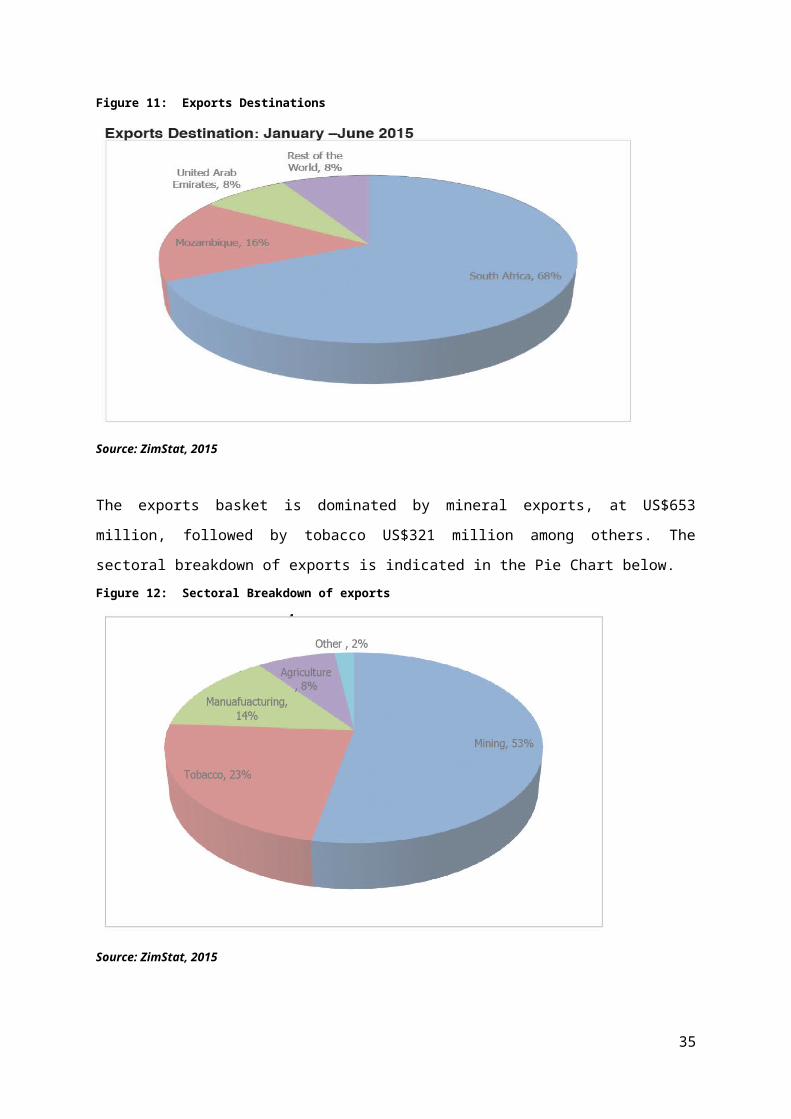
Overlapping membership presents further challenges particularly when trading blocs move
towards deeper level of integration. For example, under the SADC protocol on trade,
Zimbabwe is obliged to remove tariff barriers to South Africa, a fellow SADC member.
However, because of its COMESA membership, it is to implement a CET in line with the
COMESA Customs Union (CU), which excludes and discriminates against South Africa. In
essence, Zimbabwe has agreed to simultaneously promote free trade with South Africa and
maintain COMESA tariffs against the same country. This indicates that belonging to an
additional RTA increases bilateral trade because the other regional blocs’ trade rules and
regulations may undermine the full implementation of the other trade rules and regulations.
4.4.4 Bilateral trade agreementsThe Trade Agreement between South Africa and Zimbabwe accords preferential treatment
to goods and services in the form of rebates on duty and duty-free market entry. Some
products including textile and clothing are subject to quotas and rules of origin when entering
the two markets. Agreements with Botswana and Namibia are based on the same
framework. The goods and services are allowed tariff- and surcharge-free between
Zimbabwe and Botswana and between Zimbabwe and Namibia. In each of the two
agreements, access of goods and services is subject to a 25 per cent minimum local
content.
4.5 Restrictions and associated Legislation The Zimbabwe Revenue Authority (ZIMRA) is mandated with the enforcement of import and
export restrictions and prohibitions. This is meant to protect the consumer against:
Dangerous and harmful drugs;
Hazardous substances;
Expired drugs;
Pornographic, objectionable or undesirable materials;
Harmful substances which include skin lightening creams, soaps and lotions;
Destruction of fauna and flora; and
Extinction of endangered species.
Other controls are meant to protect revenue; conserve foreign currency; maintain export
standards or intellectual property against infringement of rights such as trademarks,
copyrights, designs or patents.
The following are restricted goods which require licence or permit:
39
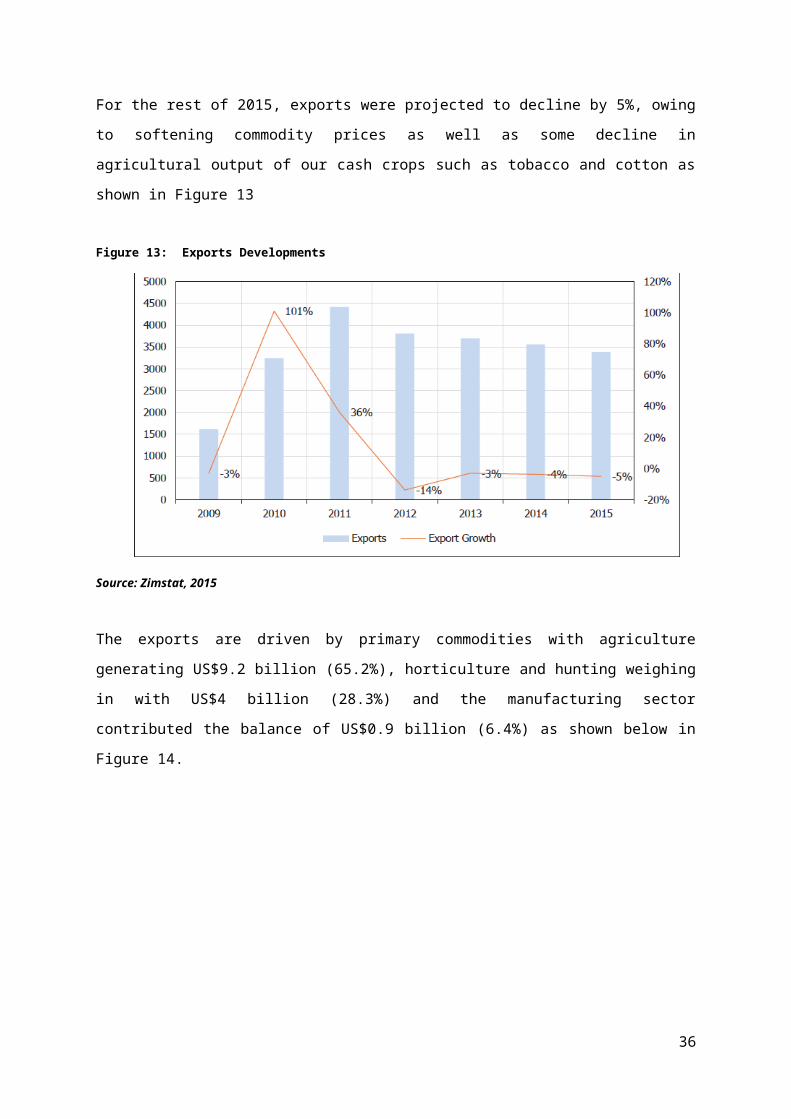
Live animals – health certificate required along with complete and valid inoculations;
Agricultural produce;
Plants and plant products, soil medium, invertebrates;
Firearms and ammunition (Hunting weapons permissible only with authorisation
obtainable from Ministry of Interior);
Relics and national monuments;
Local and Foreign currency; and
Stills and all apparatus or parts of apparatus capable of being used for the production
or refining of alcohol.
The goods whose importation or exportation is absolutely prohibited are:
Pornographic materials;
Flick knives/lock blades;
Skin lightening creams containing hydroquinone and mercury;
Base, counterfeit or forged coins or currency;
Prison- made and penitentiary-made goods;
Spirituous beverages which contain preparations, extracts, essences or chemical
products which are noxious or injurious;
Any goods which are indecent, obscene or objectionable;
Any goods which might tend to deprave the morals of the inhabitants, or any class of
the inhabitants, of Zimbabwe; and
Any goods the importation of which is prohibited by or under the authority of any
enactment.
4.6 Document requirements for importation and exportation
4.6.1 Importation process and documentsThe Government of Zimbabwe has signed on 16/03/15 a 4-year Consignment-Based
Conformity (CBCA) contract with a French global company, Bureau Veritas. This contract
provides the pre-shipment services of the listed products in the country of export and
issuance of certificates of conformity based on the national and international quality, safety,
health and environment standards in line with the WTO agreements. The process is outlined
in Figure 24:
Figure 24: Shipment process
40

From the 16th of May 2015 any consignment on the category list not accompanied with the
required CBCA certificate will be refused from entering the country. This is an interim
measure, while the establishment of the Zimbabwe Quality Standards Regulatory Authority
is being finalised. The verification will take place in the country of export where upon
satisfactory verification, a CBCA certificate will be issued for the consignment. This
certificate shall be presented for Customs clearance on arrival in Zimbabwe. The items in the
category list are:
Food and Agriculture;
Building and civil engineering;
Timber and timber products;
Petroleum and fuel;
Packaging material;
Electrical/electronic appliances;
Body care;
Automotive and transportation;
Clothing and textile;
Engineering equipment;
Mechanical appliances; and
Toys.
The clearance of importations is done by a Bill of Entry which is processed in the Automated
System for Customs Data (ASYCUDA) system. The importer should have a Business
Partner Number which is activated for Customs purposes.
The following documents are required when clearing commercial importations:
Bill of Entry (Form 21): This Bill is lodged through the ASYCUDA World system. This
is an internet based system where clearing agents and registered companies submit
41

their clearance documents electronically. All the supporting documents should be
scanned and submitted as attachments online (in ASYCUDA) together with the bill of
entry. If importer has no tax clearance certificate (ITF 263) Informal Cross Border
Trader's Tax of 10% of the value for duty purposes will be due and payable together
with any duties and other charges which may be due before goods can be released
by ZIMRA.
Payments are done by way of bank deposits into the ZIMRA account where the
amount will be credited to the agent's or importer's account with ZIMRA. Documents
are processed, assessed and if correct a Delivery Release Order is issued
authorising the collection of goods from the carrier or detention. If there is need to
inspect the goods, an Examination Order is issued and an inspection carried out to
verify the quantities, classification, origin, values or any aspect that needs
clarification. After assessment, two sets of documents in hard copies must be
submitted for final release of the goods;
Commercial invoices;
Cargo release order;
Value Declaration Forms;
Bill of Lading;
Packing List;
Road manifest;
Transit entry documents (South Africa’s form SAD500);
Value Declaration Form;
Insurance Statement; and
SADC -Certificates of Origin.
Where goods are imported from SADC, COMESA or any Member State with which
Zimbabwe has a bilateral trade agreement, preferential rates of duty will be applicable if the
correct certificates of origin are attached.
Zimbabwe has the following trade agreements: COMESA, SADC, Zimbabwe-Malawi Trade
Agreement, Zimbabwe-Botswana Trade Agreement, Zimbabwe-Mozambique Trade
Agreement, Zimbabwe-South Africa Trade Agreement and Zimbabwe-Namibia Trade
Agreement. A certificate of origin signed by the exporter or manufacturer of the goods and
duly authenticated by the relevant authority in the country of export should be produced.
For goods to be exported from Zimbabwe, the exporter and the goods should be registered
with ZIMRA under the relevant trade agreement.
42
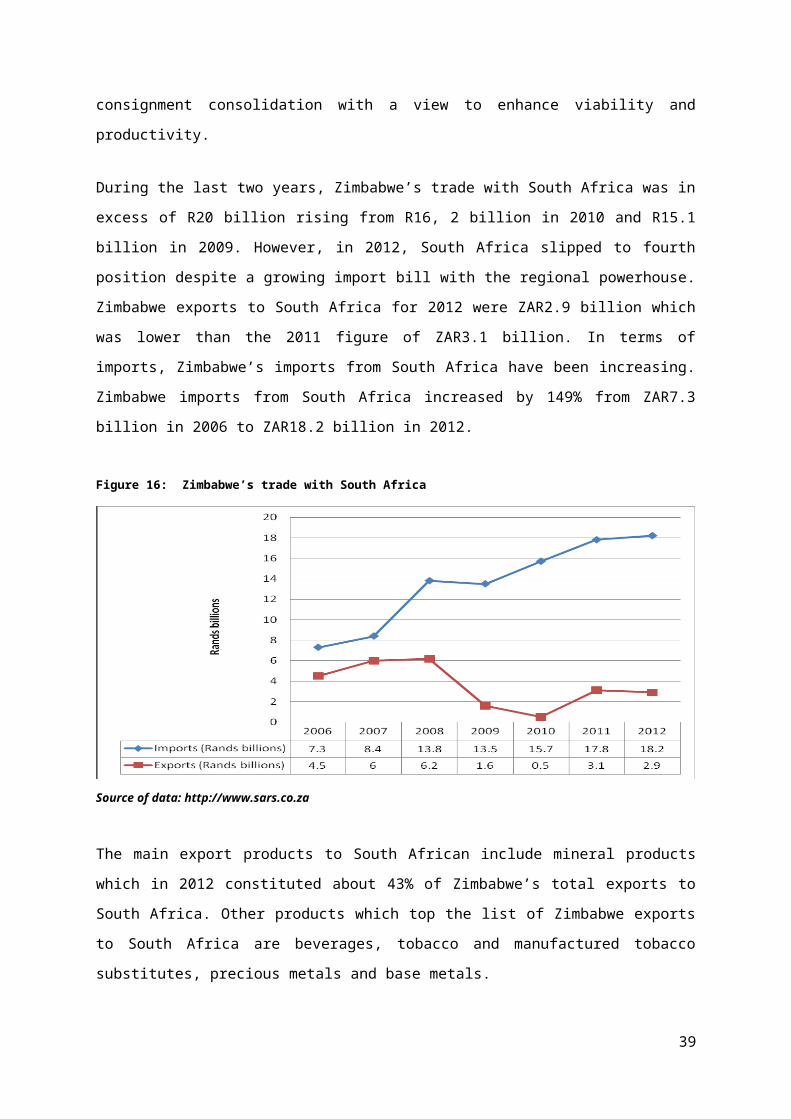
Port charges invoices (where applicable);
Original permits;
Licences, Duty Free Certificates, Rebate Letters, Value Rulings (where applicable);
and
Agent / Importer’s Worksheet.
Duty is calculated on the basis of Cost, Insurance and Freight (CIF) value of the imported
goods up to the point of entry into Zimbabwe. Insurance and Freight inside Zimbabwe is
excluded from the Value for Duty Purposes (VDP). The CIF value of the imported goods is
an aggregate of the cost of goods, insurance, freight and any other charges incurred outside
Zimbabwe.
Private importations which are not merchandise can be cleared on Form 49 (receipt). The
importer completes a declaration form called Form 47 and submits invoices for the goods
and the following supporting documents applicable depending on how goods are transported
to Zimbabwe:
Rail Advice Notes - transport by rail;
Bill of Lading; and
Freight Statement.
4.6.2 Exportation process and documentsDocumentation for exportation needs to be done by either a registered importer or a
registered clearing agent. No duties are payable on export but clearance fees are due and
payable. A Bill of Entry (Form 21) is lodged through the ASYCUDA World system with the
following supporting documents attached to the entry:
Exchange Control CD1 forms which are obtained from commercial banks;
Suppliers’ invoices;
Consignment notes; and
Copies of Export Permits/Licences (where applicable).
4.7 Cost and Estimate Import DurationThe cost of importing goods and the number of days it takes to import is shown below in
Table 13.Table 13: Import process
IMPORT PROCESS FEE IN US DOLLARS NUMBER OF DAYS
43
Customs clearance and inspection 350 6
Documents preparation 360 42
Inland transportation and handling 5.000 14
Ports and terminal handling 450 9
Total 6.160 71
Source: Doing Business: Zimbabwe 2015
44

5. PASSENGER TRANSPORT
The commercial conveyance of passengers by road between South Africa and Zimbabwe is
carried out by taxis, buses and tour operators. All commercial passenger operators, both in
South Africa and Zimbabwe have to have valid cross-border road transport permit in order to
transport passengers across the South African and Zimbabwean borders.
The statistics used to analyse passenger volumes and trends was obtained from data
collected by the South African Department of Home Affairs (DHA) in 2014. The data used for
analysis is comprised of mode of transport used, passengers in transit and passengers
arriving in and those departing from South Africa.
5.1 Modal share analysisA total of 10 701 742 South African travellers were recorded in 2014 made up as shown in
Table 14.
Table 14: Total travellers
This shows that most South African residents used road transport to arrive (63.8%) and
leave (64.4%) the country. Amongst the road users over half of South Africans used the
Lesotho and Swaziland ports of entry as shown in Table 15.
Table 15: Road users per country
45
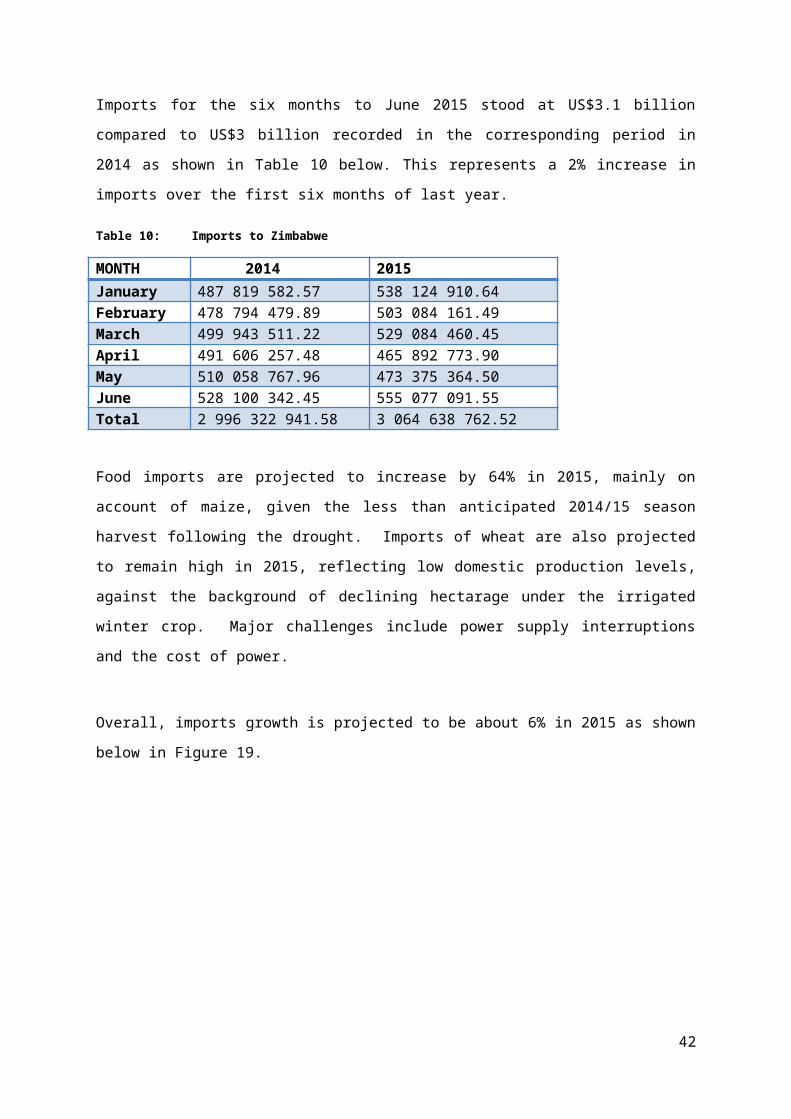
ROAD PERCENTAGE(ARRIVALS) PERCENTAGE(DEPARTURES)Botswana 15,6 15,3
Lesotho 28,4 29,1
Mozambique 21 20,9
Namibia 4.7 4.6
Swaziland 23,3 23,1
Zimbabwe 7,1 7
Source: StatsSA Tourism
Meanwhile, foreign travellers were recorded at 29 608 721 compared to the 2013 volume of
28 353 119 showing road as the mode of travel mostly used. Most of the travellers were from
Zimbabwe followed by Lesotho, as shown in Table 16.
Table 16: Foreign travellers
ROAD PERCENTAGE(ARRIVALS) PERCENTAGE(DEPARTURES)Botswana 10,8 11,7
Lesotho 26,9 26,4
Mozambique 17,1 17,5
Namibia 1,5 1,7
Swaziland 15,6 16,5
Zimbabwe 28,1 26,3
Source: StatsSA Tourism
5.2 Passenger volumes and movement trendsTraveller data recorded by DHA is from travel documents scanned at the land ports of
entry/exit. Unfortunately the data does not distinguish between travellers using privately
owned vehicles and those using taxis and buses.
Table 17 below shows annual data of arrivals into and departures from South Africa, of both
South African residents and foreign nationals by road for 2013 and 2014.
Table 17: Passenger movement between South Africa and Zimbabwe
46

2013 2014
Arrivals Departures Arrivals Departures
South African 222 874 226 650 239 597 242 675
Foreign nationals 3 261 114 2 848 246 3 374 000 2 805 683
Total 3 483 988 3 074 896 3 613 597 3 048 358
Source: StatsSA Tourism
From Table 17 above, it is evident that there was an increase in the number of passengers,
both South African and foreign nationals, from 2013 to 2014. The number of passengers
arriving into South Africa from Zimbabwe increased by 3.59% from 2013 to 2014; and of
those travelling to Zimbabwe from South Africa decreased by 1% in the same period.
The monthly passenger movement between South Africa and Zimbabwe is illustrated in
Figures 25 and 26 below: showing periods of most travel.
Figure 25 : Passenger arrivals from Zimbabwe into South Africa
January
February
March
AprilMay June
July
August
Septem
ber
October
November
December
200000
220000
240000
260000
280000
300000
320000
340000
360000
380000
Number of arrivals 2013Number of arrivals 2014
47

Figure 26: Passenger departures from South Africa into Zimbabwe
January
February
March
AprilMay June
July
August
Septem
ber
October
November
December
100000
150000
200000
250000
300000
350000
400000
Number of Departures 2013Number of Departures 2014
From the above figures, the highest number of passenger movement was in January and
December. The high number of passengers departing South Africa for Zimbabwe in
December is mainly due to migrant workers - Zimbabwe nationals - going home, and
marginally due to holiday makers visiting Zimbabwe, for the festive season. The number of
passengers entering South Africa from Zimbabwe in January can be attributed to holiday
makers returning home and Zimbabwean migrant workers returning to South Africa for work.
5.3 Cross-Border Operators profileThe number of taxi and freight operators doing business between South Africa and
Zimbabwe is significantly higher than that of bus operators. Table 18 below shows the
number of permits issued to South African operators to operate between South Africa and
Zimbabwe over the financial years indicated.
Table 18: Operator permits
FINANCIAL YEAR FREIGHT PERMITS TAXI PERMITS BUS PERMITS2012/2013 8432 2312 12992013/2014 10666 2882 8772014/2015 9599 3521 1047Source: the CBRTA
Freight permits decreased whilst the taxi and bus permits increased. The taxi industry is
growing and is relatively easy to enter. The increase in the number of taxi operators also
indicates the increase in demand in the cross-border market as the number of travellers
48
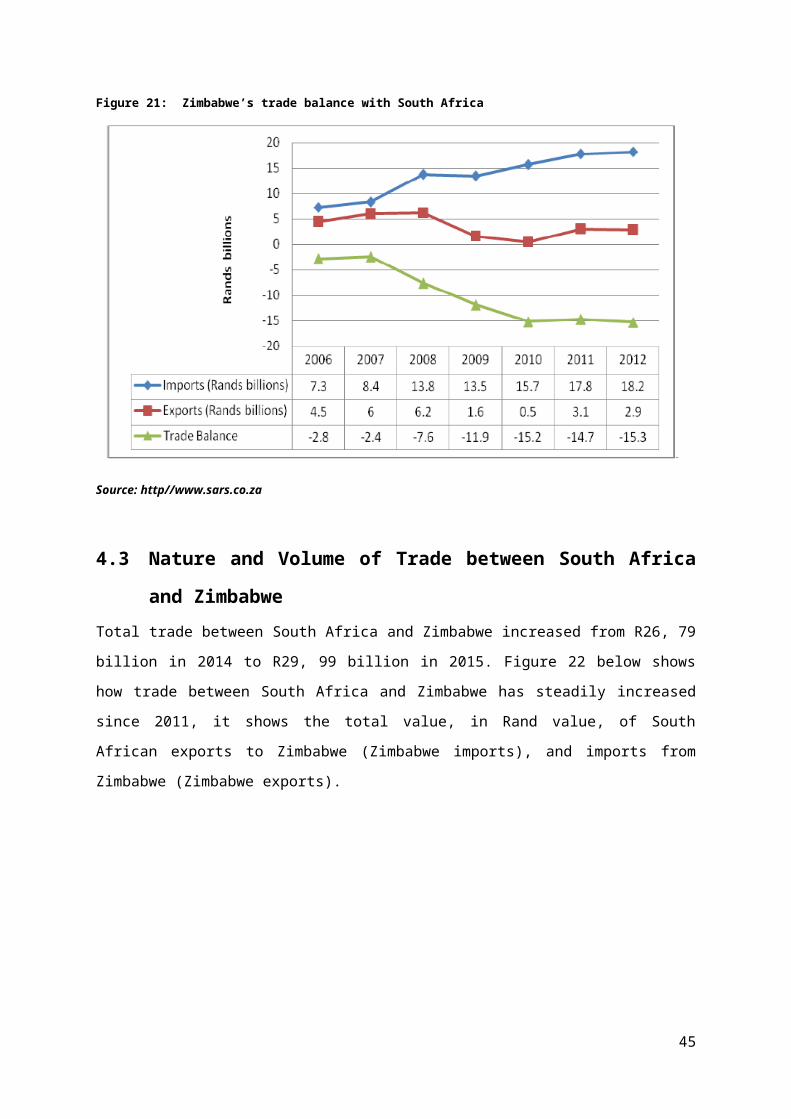
between South Africa and Zimbabwe increased, and their preference for taxis over buses is
evident.
There was an overall increase of 13.65% in permits issued year-on-year during the
2013/2014 year translating into an increase of 9,616 permits. Permits issued for taxi
operations increased by 5.3%, up from 10,539 to 11,095, to freight carries increased by
16.1% up from 55,053 to 63,935 and bus permits decreased from 3,144 to 2,781.
In the 2014/2015 financial year, there was an overall decrease of 1.42% in permits issued
which translates into a decrease of 1 140 permits. Overall permits issued for taxi operations
increased by 5.16%, up from 11 062 to 11633 – this was also seen in permit to Zimbabwe
increasing by 22.17%. Permits issued for bus operations decreased by 19.67%, down from 2
781 to 2 234 and yet those to Zimbabwe increased by 19.38%.
The freight permits decreased by 2.01%, down from 63 935 to 62 647 and the major
contributors to the decrease were Zimbabwe at 10%, Botswana at 3.73% and Lesotho at
3.23% as shown in Table 19 below.
Table 19: Permits issued for freight transport
COUNTRY 2014/15 2013/14 % MOVEMENTAngola
200 - 200%
Botswana 7,875
8,180 -3.73%
Democratic Republic of Congo 3,536
3,328 6.25%
Lesotho 3,896
4,026 -3.23%
Malawi 1,809
1,814 -0.27%
Mozambique 11,299
10,625 6.34%
Namibia 6,648
6,234 6.64%
Swaziland 5,355
5,281 1.40%
Zambia 12,391
13,271 6.63%
Zimbabwe 9,599
10,666 -10%
Cabotage 39
60 35%
Total 62,647
63,935 -2.01%
Source: the CBRTA, Annual Report 2014/15
49
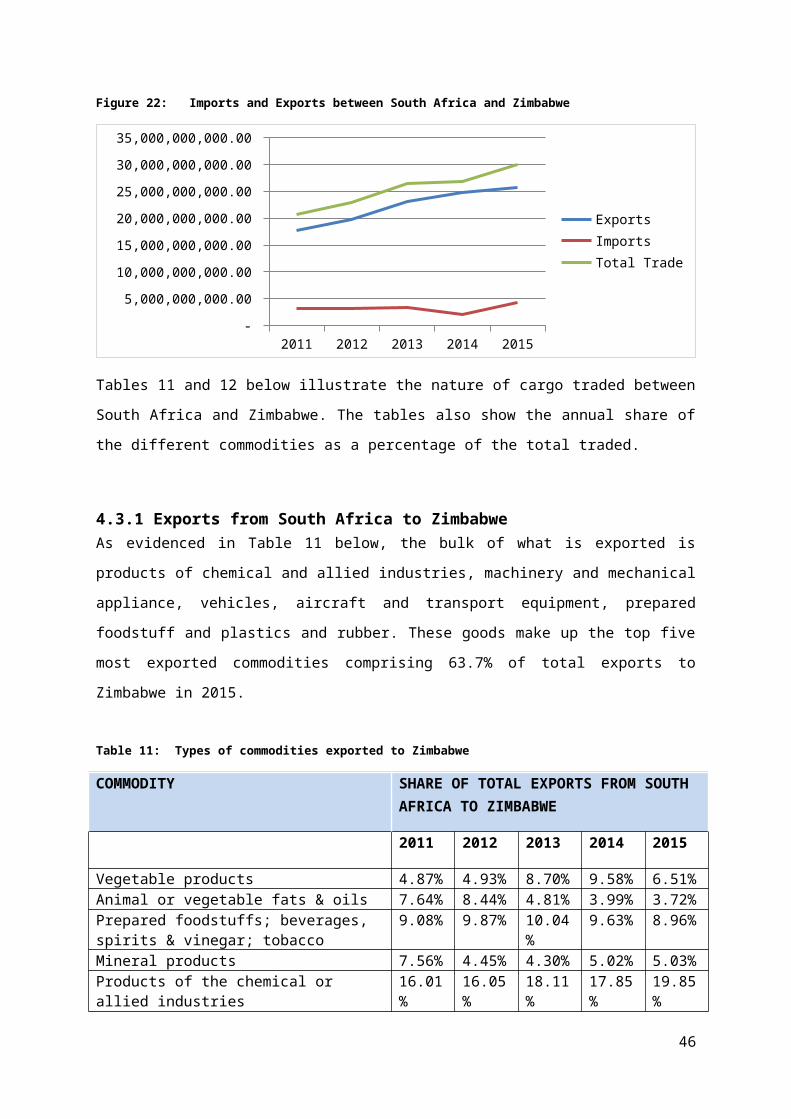
South Africa currently has twenty-four taxi and thirty four bus associations. New entrants into
the cross-border road passenger transport market are regulated by the C-BRTA Regulatory
Committee which assesses whether the demand for such a service exists. On a monthly
basis the statistics of buses and taxis from South Africa to different provinces in Zimbabwe
are shown below in Figure 27 below.
Figure 27: Monthly statistics of bus and taxi operators
HARARE
MUTARE
BULAW
AYO
CHIPINGE
CHEGUTU
MUREWA
GOKWE
RUSAPE
CHINHOYI
DULUBADZIM
U
MASVINGO
TEMPELH
OF
GWERU
PLUMTR
EE
CHIREDZI
TSHOLO
TSHO
0
20
40
60
80
100
120
140
160
180
BUSTAXI
As shown in Figure 27, taxis transport passengers mostly to Bulawayo, Dulubadzimu,
Masvingo and Plumtree where-else most bus operators go to Harare and Bulawayo.
50
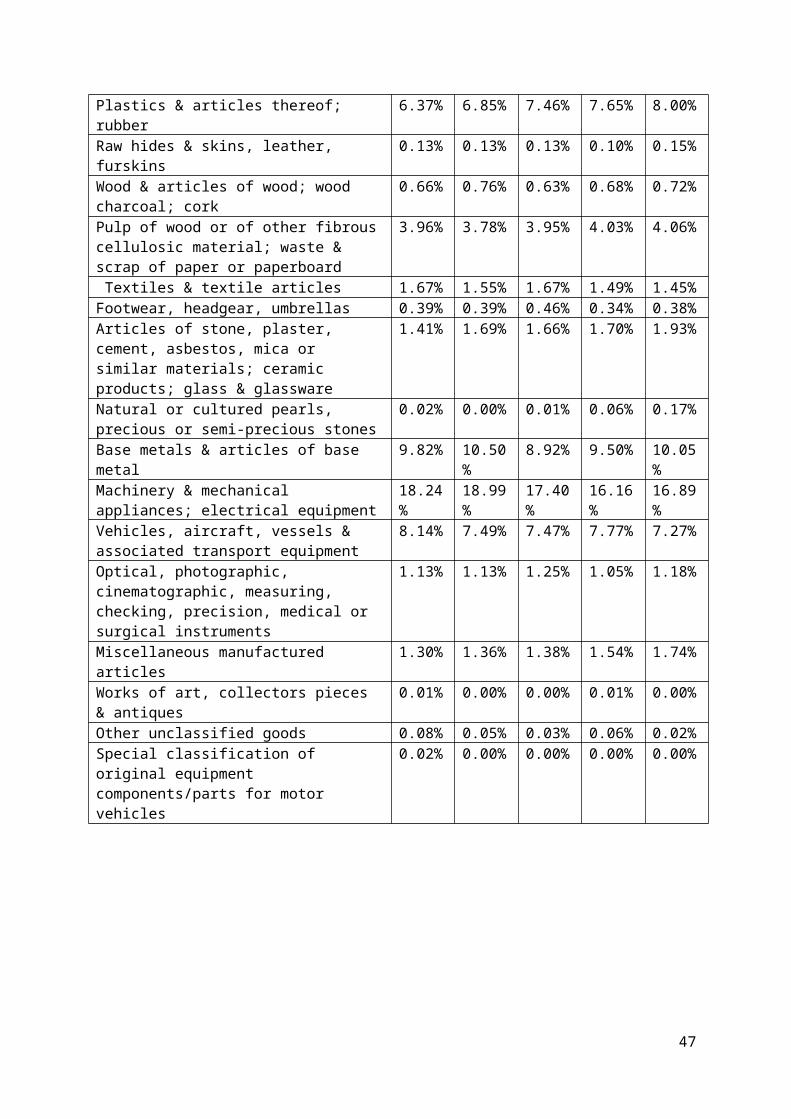
6. THE ROAD TRANSPORT ENVIRONMENT
The transport sector in Zimbabwe comprises five modes namely; road, rail, aviation, inland
water and pipeline transport. The road network excluding urban roads totals 76,241km of
which 9,256km or 12.1% are tarred. About 5 per cent of the road network is classified as
primary roads and has some of the most trafficked arterials that link Zimbabwe with its
neighbours. This part of the road network plays a major role in the movement of the
country’s imports and exports as well as transit freight.
About 14 per cent of the network is classified as secondary roads that link the main
economic centres within the country, enabling internal movement of people and goods. The
primary and secondary roads are collectively referred to as the trunk road system; they carry
over 70 per cent of the traffic. 72 per cent of the network is made up of tertiary feeder and
access roads that link rural areas to the secondary road network. The remaining 9 per cent
of the network are urban roads managed by urban councils.
The rail network comprises a total 3,100km of which 340km between Beitbridge and
Bulawayo was built under a Build Operate and Transfer (BOT) arrangement. It was privately
owned and operated by the Beitbridge-Bulawayo (BBR) Railway Company providing
transport services to passengers, business and the mining industry.
The aviation sub-sector comprises ten airports, three of which are international airports,
namely at Harare, Bulawayo and Victoria Falls. The other airports are located at Kariba,
Masvingo, Buffalo Range, Mutare, Gweru, Beitbridge and Charles Prince. The ten airports
are managed by the Civil Aviation Authority (CAA).
With respect to pipeline transport, Zimbabwe through the National Oil Infrastructure
Company (NOIC) controls 21km of the 287km oil pipeline running from the Beira port in
Mozambique to the Feruka Oil Refinery in Zimbabwe. Water transport is dominated by
waterborne tourism, leisure activities, commercial and small scale fishing and sports on the
Kariba Dam and the Zambezi River. There is however potential for water transport
51
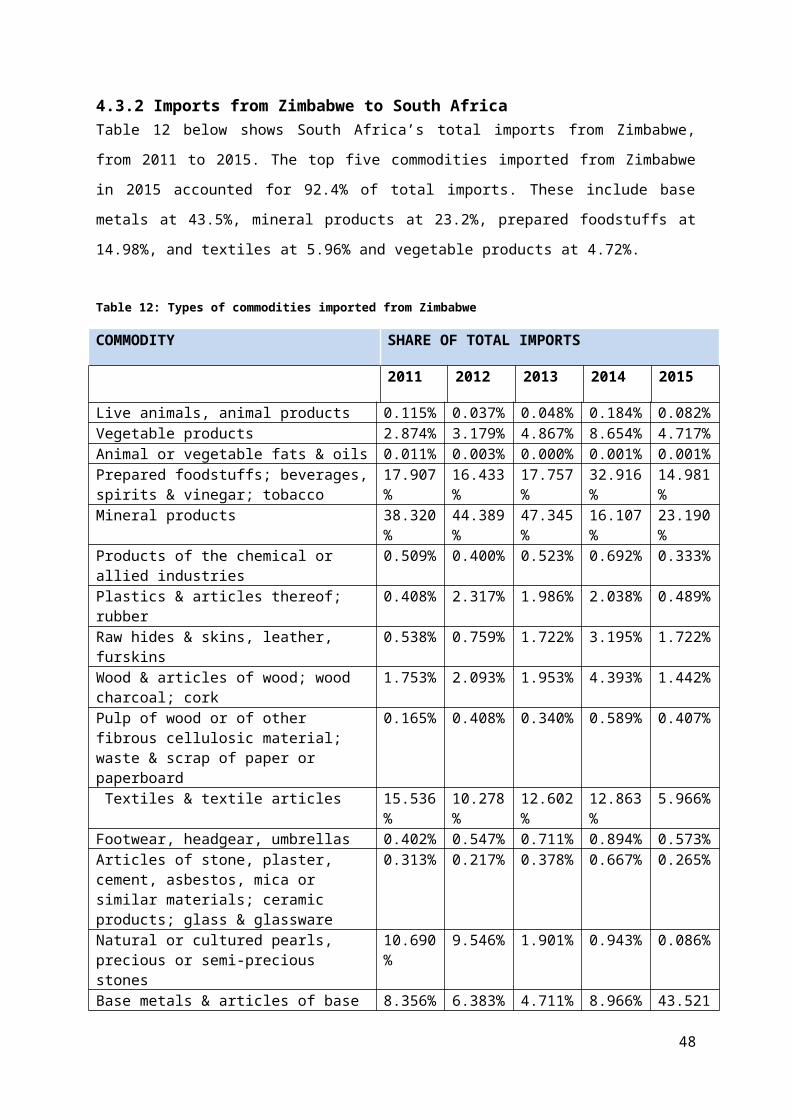
6.1 InfrastructureZimbabwe is a land-locked country where national and regional transport connectivity is a
necessary condition for promoting economic activity and cross border trade. The general
condition of the transport infrastructure has deteriorated due to inadequate funding for
regular maintenance. Infrastructure faces numerous challenges and constraints which
include;
Lack of maintenance due to financial constraints;
Lccelerated deterioration through misuse;
Capacity constraints due to migration of skilled personnel;
Inadequate funding for infrastructure greenfield projects;
High rates of accidents; and
Lack of an integrated approach in infrastructure investment planning.
To address some of the challenges, Government has proposed (i) rehabilitation and
maintenance of the infrastructure; (ii) mobilising resources through user pay principles; and
(iii) use of PPP ventures to finance and operate infrastructure and services. Government is
putting emphasis on rural infrastructure while Public-Private-Partnership ventures (PPPs)
are used for the major infrastructure development projects. For instance; the rehabilitation
and maintenance of major trunk roads commenced in 2009 and is currently on-going through
the financial resources generated from tolling of the most trafficked road sections; and the
Beitbridge-Bulawayo Rail Link was constructed on a BOT agreement with the private sector.
6.2 Road Transport LegislationRoad transport in Zimbabwe is regulated by the Road Motor Transportation Act. The Act
provides for the licensing of drivers of motor vehicles; issuing and recognition of international
driving permits and foreign drivers licences; compulsory insurance against third party risks
arising out of the use of motor vehicles; traffic signs and police directions; the control of
certain advertisements; certain offences connected with road traffic; prohibition from driving
and endorsement of licences and for the powers and duties of various persons.
6.2.1 Speed LimitsUnless an appropriate road traffic sign is displayed indicating a lower speed limit, every
public road or section thereof:
Within an urban area, is subject to a general speed limit of 60 kilometres per hour;
Outside an urban area, is subject to a general speed limit of:
o 100 kilometres per hour if it is not a tarred road;
52

o 120 kilometres per hour if it is a tarred road; and
A general speed limit of 120 kilometres per hour applies in respect of every freeway.
In terms of section 76(3) of the Act, a speed limit of:
80 kilometres per hour, subject to the proviso to that section, applies in respect of:
o A goods vehicle, with a gross vehicle mass exceeding 9 000 kilograms;
o A combination of motor vehicles consisting of a goods vehicle, being the drawing
vehicle, and one or two trailers of which the sum of the gross vehicle mass of the
goods vehicle and of the trailer or trailers exceeds 9 000 kilograms; or
o An articulated motor vehicle, of which the gross combination mass of the truck-
tractor exceeds 9 000 kilograms;
100 kilometres per hour, subject to the proviso to that section, applies in respect of -
o A bus; and
o A minibus used for the conveyance of persons.
6.2.2 Traffic Fines
The traffic fines are categorised as shown in Table 20 below.
Table 20: Fines
DESCRIPTION AMOUNT US($)
Speeding 6 -15 5k/per hour over limit
16 -25 10
26 – 35 1536 – 50 2050+ Court
Fail to Display current vehicle licence 5Produce documents to police 5Produce documents to VID 10Licence vehicle registered vehicle all classes 10Display registration mark and number 10Notify change of ownership – 14 days 10
No Number plate 10Rear number plate light 5Drivers licence 20Insurance 10White front reflectors 5
53
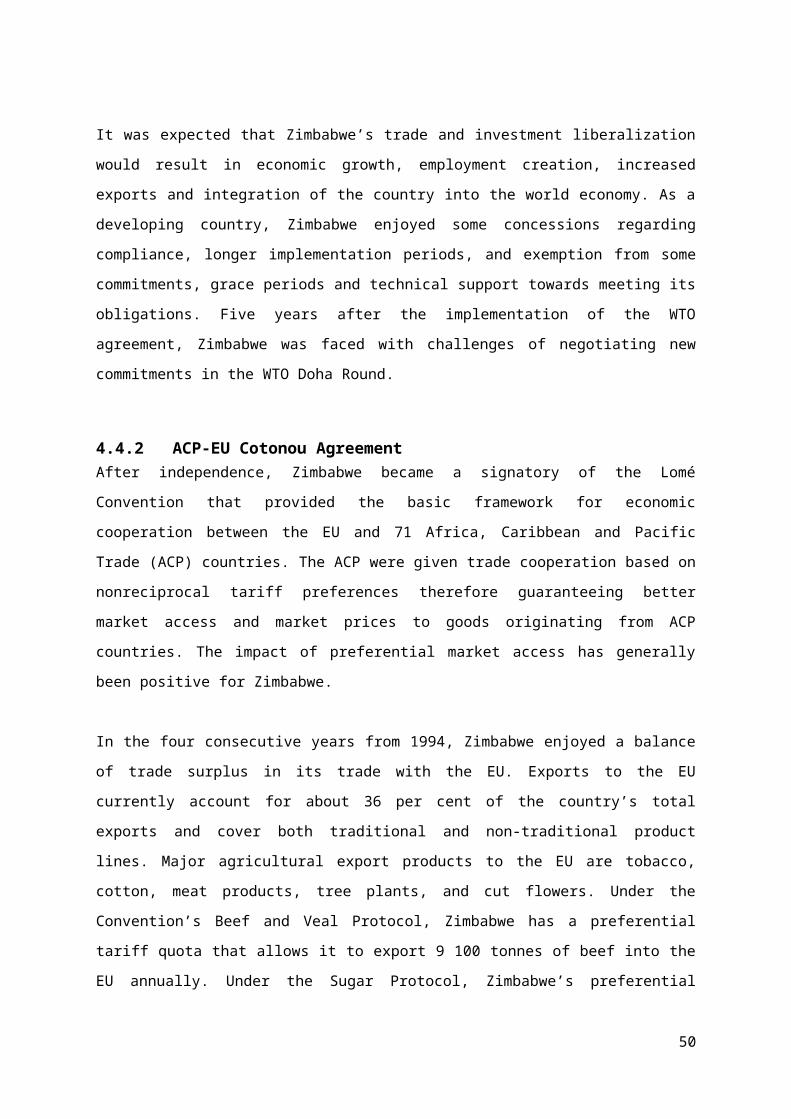
Red read reflectors 5Red “T” on rear trailer 10Amber side reflectors on motor vehicle and trailer longer than 8m
5
Red triangles 15Horn or abuse of horn or fail to use horn 10Stopping, no parking, no left or right turn 5
Other Proceed against red robot 20Proceed against amber robot 10Encroach over white line at a robot 10Overtake over solid white line 20Cut corner when turning 10
Defects No headlight, one headlight or no side lights 5No windscreen wiper 5Leaks of oil onto road 5Handbrakes not working 15Footbrakes not working 20
6.2.3 Vehicle Dimensions and Weights Restrictions
Legal load limitations are imposed in order to protect the roads from the excessive damage
caused by heavy loads. The load limitations are based on:
The engine power of the vehicle and limitations specified by the vehicle;
Tyre manufacturers;
The damage or wear caused by an axle load to the road; and
The load concentration applied by a group of axles or axle units to bridge structures.
Zimbabwe’s axle load regulations compares favourably with most other countries. Tables 21
and 22 below gives an indication of the Axle, Gross Combination Mass and Dimensional
limits for most cross-border partners:
Table 21 : Load Limits
LEGAL LOAD LIMITS ON GOODS VEHICLESCOUNTRY STEERING
AXLESINGLEAXLE
TANDEMAXLE
TRIDEMAXLE
COMBINATIONAXLE
Angola 7 700 kg 10 000 kg 16 000 kg 24 000 kg 38 000 kgBotswana 7 700 kg 8 200 kg 16 000 kg 24 600 kg 50 200 kgLesotho 8 200 kg 16 400 kg 21 000 kg 49 000 kg
Malawi 7 700 kg 8 200 kg 16 400 kg 24 600 kg 55 000 kgMozambique 7 700 kg 10 000 kg 16 000 kg 22 000 kg 38 000 kgNamibia 7 700 kg 8 200 kg 16 400 kg 21 000 kg 48 400 kgSouth Africa 7 700 kg 8 000 kg 16 000 kg 24 000 kg 56 000 kg
(2 wheels) (2 wheels)
South Africa 9 000 kg 18 000 kg
54

(4 wheels) (4 wheels)
Swaziland 7 700 kg 8 200 kg 16 400 kg 21 000 kg 50 200 kgTanzania 7 700 kg 10 000 kg 18 000 kg 24 000 kg 52 000 kgZimbabwe 8 000 kg 18 000 kg 24 000 kg 56 000 kg
Table 22: Dimensional Limits
LEGAL DIMENSIONAL LIMITS ON GOODS VEHICLESCOUNTRY OVERALL
WIDTHOVERALLHEIGHT
LENGTH OFRIGID
LENGTH OFARTICULATED
LENGTH OFCOMBINATION
Angola 2,5 m 4,0 m 15,0 m 18,0 m 20,0 mBotswana 2,5 m 4,1 m 12,5 m 17,0 m 22,0 mLesotho 2,6 m 4,1 m 12,5 m 17,0 m 22,0 mMalawi 2,5 m 4,6 m 12,5 m 17,0 m 22,0 mMozambique 2,5 m 4,0 m 12,0 m 18,0 m*
Namibia 2,5 m 4,1 m 12,5 m 17,0 m 22,0mSouth Africa 2,5 m 4,3 m 12,5 m 18,5 m 22,0 m
(medium)
South Africa 2,6 m
(heavy)
Swaziland 2,5 m 4,1 m 12,5 m 17,0 m 20,0 mTanzania 2,6 m 4,4 m 12,5 m 17,0 m 22,0 mZimbabwe 2,5 m 4,6 m 12,5 m 18,5 m 22,0 m
When the legal mass limits are exceeded an Abnormal Vehicle (AV) registration is required.
6.3 The Regulatory FrameworkThere is currently no overarching policy document for the road sector in Zimbabwe.
However, there are two important draft policy documents that present the Government’s
long- term approach to road sector management which are the “Road Sub-sector Policy
Green Paper” of March 1999 and the “Draft National Transport Policy” of September 2005.
The Green Paper was part of Zimbabwe’s response to the signing of the SADC Protocol.
The paper sets out the following institutional structure for the road sector:
The Ministry responsible for transport as the National Roads Authority which will
have the overall responsibility for the subsector;
Rural District Councils and Urban Councils will be defined as road authorities;
The Zimbabwe National Road Administration will be created to solicit funds from road
users for the maintenance of existing road infrastructure. The key fund-raising
instruments have been the fuel levy, transit fees, overload fees, and abnormal load
fees. The fuel levy accounts for about 45 per cent of ZINARA’s revenues and has
been its main source of revenue;
55

A Road Fund (RF) to provide an adequate, stable, secure, and sustainable source of
funds for the maintenance of the road network. The RF can be used for the following
purposes:
o Grants to road authorities for routine and periodic road maintenance or
emergency works;
o Road safety activities and
o Salaries, allowances, and other expenses of ZINARA (which must not exceed
2.5 per cent of the revenue of the RF).
Figure 28 below shows the Institutional relationships for the road transport sector in
Zimbabwe.
Figure 28: Institutional relationship
6.4 Requirements for Cross Border transportationThe following are requirements for travelling to Zimbabwe:
Valid passport of the driver;
Certified copy of vehicle registration papers in the name of the driver;
Letter of authority from the registered owner if the vehicle is not owned by the driver
If vehicle is still being financed, a letter of authority from the bank (must include dates
of travel) together with the vehicle license papers;
Police Clearance Certificate: is required if travelling through the Chirundu Border
Post, for vehicles and trailers. When applying for Police Clearance certificate, it is
required to have a Request for Police Identification/ Clearance (RPC) Form
obtainable from the Traffic Department;
56
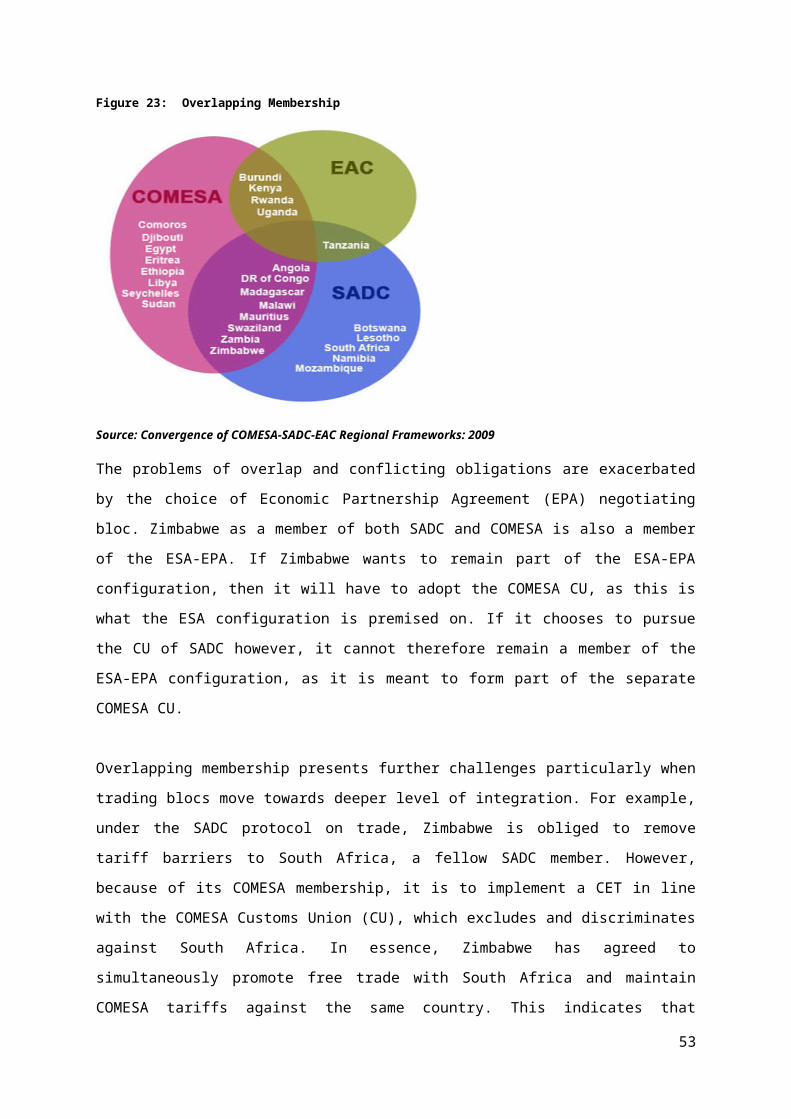
Commercial Vehicle Guarantee (CVG): Private vehicles do not require a CVG it is
only applicable for Commercial vehicles. Obtainable from Zimbabwe registered
clearing agents and payment of relevant bond is between USD 30 to USD 50;
Third-Party Insurance: Compulsory - obtained at border post or at an AA Accredited
Sales Agent store;
Road Access Fee: Based on the vehicle's size paid on entry only:
o R90 for a small sedan;
o R270 for a large 4x4;
Exit Pass: R70 at each exit;
Carbon Tax: charges from R50 to R240;
White and Red Reflective Tape: Two small white rectangular size strips on the right
and left hand side of the front bumper as well as two small red square strips on the
right and left hand side of the rear bumper. Ideally, the strips should be
honeycombed. If towing a trailer, two small red square strips on the right and left
hand side of the rear bumper are required;
Carnet de Passage: Not required. Temporary Import Permit is issued at the border
post upon entry, free of charge;
Warning Triangles: Two warning triangles on a metal plate;
White and Red T-sign: Required if towing a trailer; white must be displayed on front
right hand side of trailer/caravan and red on the rear right hand side of the trailer /
caravan;
Fire Extinguisher: Compulsory;
Safety Vests: Recommended; and
ZA Sticker.
57

7. THE BUSINESS ENVIRONMENT
7.1 Road User ChargesThe N1 is a national route in South Africa that runs from Cape Town through Bloemfontein,
Johannesburg, Pretoria and Polokwane to Beitbridge on the border with Zimbabwe. Figure
29 shows the main route network linking South Africa and Zimbabwe.
Figure 29: N1 National route
There are six main line tolls and nine additional ramps from Pretoria to Beitbridge, the tariffs
are outlined below table 15. Vehicles are divided into the following classes:
I – Light vehicles with or without a trailer: This would include motorcycles, motorcars,
minibuses and light delivery vehicles;
58

II - Medium heavy vehicles: These are two-axle vehicles designed to seat more than
16 passengers or which have an axle fitted with tyres with a bead diameter larger than
406,4 mm (16"), or more than two wheels;
III – Large heavy vehicles: These are vehicles or combinations with three or four
axles; and
IV – Extra-large heavy vehicle: These are vehicles or combinations with more than
four axles.
Most of the operation of the network of national toll roads is done by SANRAL but some are
contracted out on long term agreements and managed by three private concessionaire
companies namely Bakwena Platinum Corridor Concessionaire, N3 Toll Concessions and
Trans African Concessions
SANRAL manages all the toll roads which are not run by the above three concessionaire
companies which include all the tolled sections of the N1 south of Johannesburg between
Johannesburg and Bloemfontein as well as the Huguenot Tunnel, between Worcester and
Paarl. It also controls the N1 sections to the north between Bela Bela (Warmbaths) and the
Beit Bridge border.
The Agency also runs all the tolled sections of the N2 in Kwazulu Natal comprising the North
Coast Road between Emangeni and Durban and the South Coast Road between Port
Shepstone and Margate. In addition it runs the Tsitsikama section of N2 on the Garden
Route, the Magaliesberg section of the N4, west of Pretoria as well as the tolled sections of
the N17 and R30.
Bakwena Platinum Corridor Concessionaire is responsible for a 95 km section of the N1
between Pretoria and Bela Bela (Warmbaths). This also connects the N4 from Witbank at
the Proefplaas Interchange with the N4 Platinum Toll Road to Botswana at the Doornpoort
Interchange. Bakwena also manages 352 km of the tolled section of the N4 west of Pretoria
from the N1 interchange, through Brits, Rustenberg, Groot Marico and Zeerust to Lobatse
(Skilpadhek) on the Botswana border.
Table 23 shows the toll fees (by vehicle class) that are levied on the various tollgates on the
cited network in South Africa.
Table 23: N1 Tariffs (Pretoria – Beitbridge)
59
TOLL NAME OPERATOR CLASS I CLASS II CLASS III CLASS IV
Stormvoel Local Bakwena R7,50 R18,50 R21,50 R26,00
Zambezi Local Bakwena R9,00 R22,50 R26,00 R31,00
Pumulani PTA-
Hammanskraal
Bakwena R9,50 R24,50 R28,00 R34,00
Wallmannsthal Local Bakwena R4,50 R11,00 R13,50 R15,50
Murrayhill Local Bakwena R9,00 R22,50 R27,00 R31,00
Hammanskraal Local Bakwena R21,00 R72,00 R78,00 R90,00
Carousel PTA-
Warmbaths
Bakwena R45,00 R121,00 R133,00 R154,00
Maubane Local Bakwena R19,50 R52,00 R58,00 R67,00
Kranskop Warmbaths-
Naboomspruit
SANRAL R36,00 R92,00 R124,00 R151,00
Warmbaths-
Nylstroom
SANRAL R10,00 R27,00 R32,00 R48,00
Nyl Naboom-
Pietersburg
SANRAL R47,00 R88,00 R106,00 R142,00
Naboom-
Potgietersrus
SANRAL R14,00 R27,00 R32,00 R41,00
Sebetiela Potgietersrus -
Pietersburg
SANRAL R14,00 R27,00 R34,00 R45,00
Capricorn Pietersburg-
Louis Trichardt
SANRAL R37,00 R103,00 R120,00 R151,00
Baobab Louis Trichardt -
Beitbridge
SANRAL R36,00 R99,00 R136,00 R164,00
Zimbabwe activated cross-border charges for foreign vehicles terminating trips or transiting
through the country. The charges are levied on foreign cross-border vehicles including those
that are operated by South African operators.
The cross-border charges that South African operators are charged in Zimbabwe are Yellow
card, New Limpopo Bridge fee, Carbon tax- horse, Carbon tax- trailer, Environmental
Management Agency (EMA) fee, Commercial Vehicle Guarantee (CVGs), Gate Pass, Goods
inspection fee, Parking fee and Victoria Falls bridge fee. All cross-border operators are
required to pay the cross-border charges.
The estimated costs of each of the charges are shown in Tables 24, 25 and 26 below.
60

Table 24 Freight Cross-Border Charges
CROSS BORDER CHARGES AMOUNT (R) VALIDITY
Gate Pass R 650.00 Per entry
Coupons R 1,626.00 Return trip
CVG (+trailer) R 1,355.00 30 days
Carbon Tax R 1,220.00 30 days
Third Party Insurance R 813.00 30 days
Note: US$1.00 = R11.03
Table 25: Bus Passenger Cross-Border Charges
CROSS BORDER CHARGES AMOUNT (R) VALIDITY
Gate Pass R 690.00 Per entry
Coupons R 1,500.00 Return trip
CVG R 400.00 30 days
Carbon Tax R 420.00 30 days
Memorundum R 200.00 Return trip
Third Party Insurance R 1,890.00 30 days
Note: US$1.00 = R11.03
Table 26: Taxi Passenger Cross-Border Charges
CROSS BORDER CHARGES AMOUNT (R) VALIDITY
Gate Pass R 250.00 Per trip
Coupons R 1,100.00 Return trip
CVG (+trailer) R 450.00 30 days
Carbon Tax R 250.00 30 days
Third Party Insurance R 600.00 30 days
Note: US$1.00 = R11.03
61
The Rand value of the charges were established at the time when the Rand/US$ exchange
rate was at US$1 to R11.03. Since Zimbabwe is using the US$ as the base currency, it is
important that operators take note of the current Rand/ US$ exchange rate in order to
estimate the cross-border charges in Rand value at any point in time.
7.2 The Business EnvironmentFor policy makers, knowing where their economy stands in the aggregate ranking on the
ease of doing business is useful. It is also useful to know how it ranks relative to comparator
economies and relative to the regional average. According to the World Bank, Zimbabwe
was ranked at 171 in 2015 for ease of doing business, drop from 170 in 2014. This was
ranked out of a total of 181 economies.
In 2015 there were 189 economies and Zimbabwe was ranked 153 and in 2016 it was 155
as shown in Figure 30 below.
Figure 30: Zimbabwe and comparator economies on the ease of doing business
Source: World Bank, Doing Business 2015
The distance to frontier score benchmarks economies with respect to regulatory practice,
showing the absolute distance to the best performance in each indicator. The distance to
62
frontier score is indicated on a scale of 0 to 100, where 0 represents the worst performance
and 100 the frontier. The index ranks the countries on 10 topics as illustrated in Figure 31.
Figure 31: Ranking on topics
Source: World Bank, Doing Business 2015
The ease of doing business covers 10 themes, but this report only focuses on the following:
Starting BusinessThis indicator looks at the ease of starting a business taking into considerations procedures
officially required by an entrepreneur, and the time and cost required to complete these
procedures. It assumes that all information is readily available to the entrepreneur, that there
has been no prior contact with officials and that the entrepreneur will pay no bribes. Starting
a business in Zimbabwe is a highly costly and time-consuming exercise.
According to the World Bank report, Doing Business 2016; Zimbabwe stands at 182 (179 in
2015) in the ranking of 189 economies on the ease of starting a business. It takes 90 days
and costs 112.0% of income per capita. Comparatively, in South Africa it only takes 46 days
to start a business and costs only 0.3% of per capita income.
63

Figure 32: Time, cost of income per capita
Source: World Bank, Doing Business 2015
When comparing with other economies in the region, it shows bottlenecks reflected in large
numbers of procedures, long delays and high costs. Table 27 below shows the comparison.
Table 27: Comparison with other countries
ZIMBABWE ANGOLA
BOTSWANA
LESOTHO
NAMIBIA
SOUTH AFRICA
SWAZILAND
Rank 182 141 143 112 164 120 156Procedures
9 8 9 7 10 6 12
Time 90 36 48 29 66 46 30Cost 112 22.5 0.7 9.3 11.1 0.3 23.4
Table 27 shows that set-up costs and processes are costly and cumbersome for businesses,
contributing to the country remaining ranked lowly in terms of the ‘Ease and Cost of Doing
Business’.
Trading across bordersMaking trade between economies easier is increasingly important for business in today’s
globalised world. Excessive document requirements, burdensome customs procedures,
inefficient port operations and inadequate infrastructure all lead to extra costs and delays for
exporters and importers, stifling trade potential.
64

This rating is based on a set of specific predefined procedures. It is based on the time and
cost (excluding tariffs and the time and cost for sea transport). Table 28 shows a summary
with South Africa as a trading partner.
Table 28: Indicators of trading across borders
EXPORT IMPORTProduct HS 24: Tobacco and
manufactured tobacco substitutes
HS 8708: Parts and accessories of motor vehicles
Trade Partner South Africa South AfricaBorder Beitbridge BeitbridgeDistance (km) 580 580Domestic transport time (hours) 36 36Domestic transport cost (USD) 862 1669Domestic transport speed (km/hour) 16.1 16.1Domestic transport cost per distance (USD/km) 1.5 2.9
According to the Doing Business Report, exporting a standard container of goods requires 7
documents, takes 53 days and costs $4265, broken down as shown in Table 29 below.
Table 29: Stages and documents for trading across borders
STAGES TO EXPORT COST (US$) TIME IN DAYSCustoms Clearance and inspection 180 4
Documents preparations 300 33
Inland transportation and handling 3500 12
Ports and terminal handling 285 4
Total 4265 53
Importing the same container of goods requires 8 documents, takes 71 days and costs
$6160. Globally, Zimbabwe ranks 100 out of 189 economies on the ease of trading across
borders as shown in Figure 33.
65

Figure 33: Ranking on ease of trading across borders
Source: Doing Business 2015
The rankings for comparative economies and the regional average ranking provide other
useful information for assessing how easy it is for a business in Zimbabwe to export and
import goods.
The government has set up an inter-ministerial committee on doing business to improve the
Investment climate and spearhead the harmonisation of investment laws. Six technical
working groups comprising the key stakeholders have been set up. These cover starting a
business, dealing with construction permits and registering property, getting electricity,
obtaining credit and resolving insolvency, paying taxes and trading across borders and
protecting investors and enforcing contracts.
Furthermore, the government is set to rebrand the National Pricing and Monitoring
Commission (NPMC) the National Competitiveness Commission (NCC). It will be
responsible for promoting a competitive business environment and reviewing regulations on
doing business.
66
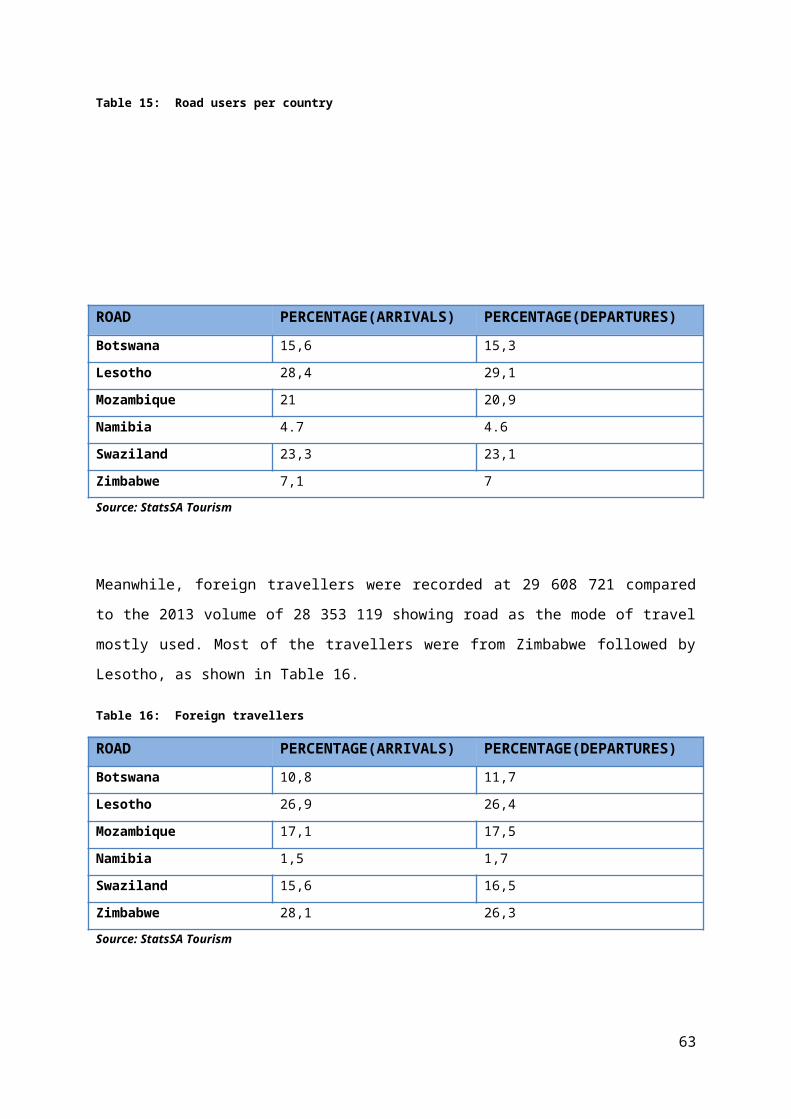
The Zimbabwe Investment Authority (ZIA) is working towards implementing a digital one
stop shop, which will improve turnaround periods for investment clearances. Moreover, the
government is in the process of setting up Special Economic Zones (SEZs) and has created
an inter-ministerial committee, which also includes development partners, to spearhead their
establishment.
The OECD on the other hand developed the Trade Facilitation Indicator, which shows that
Zimbabwe performed better than the averages of Sub-Saharan African and low income
countries in the areas of information availability, involvement of the trade community,
advance rulings, automation, streamlining of procedures and external border agency co-
operation as shown in Figure 34.
Figure 34: Trade facilitation indicators
Source: OECD Trade Facilitation Indicators – Zimbabwe
Zimbabwe’s performance for appeal procedures and internal border agency co-operation is
below the averages of Sub-Saharan African and lower income countries. The OECD
quantitative analysis shows that the areas with the greatest impact on increasing bilateral
67

trade flows and lowering trade costs are: formalities (documents, automation and
procedures) and information availability. Zimbabwe can therefore draw considerable benefits
in terms of trade volumes and trade costs from significant improvements in the areas of
appeal procedures and internal border agency cooperation. Continued efforts in the areas of
harmonisation and simplification of documents and governance and impartiality would bring
further benefits.
8. CONCLUSIONThere is no argument that infrastructure development, both economic and social, is one of
the major determinants of economic growth, especially in developing countries. Direct
investment on infrastructure for Zimbabwe will create production facilities which stimulate
economic activities; reduce trade costs and improves competitiveness; provide employment
opportunities; alleviates poverty and improve the quality of life.
The need to improve the quality of infrastructure services in Zimbabwe is, therefore, the
cornerstone of the Government of Zimbabwe’s policy, strategy and programs to promote
sustained and shared economic growth in the country. Infrastructure services in road
transport and communications that are provided by the private sector are now more
expensive than in neighbouring countries, reflecting in part the economic costs of the
deterioration.
Zimbabwe holds potential as a frontier growth market in Southern Africa, but it is highly
unlikely to meet that potential under current conditions - namely the policies enacted which
make it risky for foreign investors to gain access to the market.
The current collaboration of Government with the private sector is working on the following
projects to improve the economy; full rehabilitation of the national power grid and by 2020
addition of new generation capacity required to sustain strong economic growth;
rehabilitation of a large part of the national road network; rehabilitation of the railways
network and restructuring of the industry through the creation of a new public entity that
would own, maintain, and manage the basic track infrastructure, the restructuring of the
National Railways of Zimbabwe (NRZ) into a privatised railways services company and the
award of concessions for freight and passenger services on the entire rail network and
institutional and regulatory reforms. This will ensure that Zimbabwe meet its aspiration of
economic growth, inclusive of development and prosperity for all.
The government has also set up an inter-ministerial committee on doing business to improve
the Investment climate and spearhead the harmonisation of investment laws.
68

It is important for transport operators and the local industry to take note of the economic
trends in Zimbabwe particularly in regard to sectoral performance:
Noting that while there is growth in the tourism sector which may positively impact
demand for cross-border passenger transport services, other sectors like mining,
agriculture and manufacturing are on the decline. The decline negatively affects the
availability of return loads for transport operators;
On the other hand, the economic decline in Zimbabwe creates huge opportunities for
the local industry and transport operators as it translates to increased demand for
imported goods. The increase in demand for the goods may mean that transport
operators may optimise the high demand towards rationalising transportation rates in
their favour;
It is anticipated that the Zimbabwean economy may peak-up in 2016. This might
increase the demand for cross-border transport services. However, the projected
growth is subject to many factors including political stability and availability of
electricity. It is therefore ideal that a cautious approach be taken, when considering
making investments in Zimbabwe or cross-border road transport operations to
Zimbabwe;
The fact that there is a net growth in imports into Zimbabwe means that the country is
importing more than what it exports. The effect of this is that there are more
commodities transported into Zimbabwe than there are commodities transported from
Zimbabwe. This has a direct bearing on potential market for goods from South Africa.
Secondly, this means that there is more demand for cross-border road transport for
inbound trips, than there is for outbound trips. The effect of this is that securing return
loads may require much more effort by cross-border road transport operators in the
short term;
Meanwhile, South Africa remains Zimbabwe’s largest trading partner, accounting for
about 40% of the total exports and 60% of total imports. Zimbabwe and South Africa
are set to introduce the Zimbabwe- South Africa Simplified Trade Regime as a
means of facilitating and formalising small-scale trade between the two countries.
Under the agreement, qualifying goods worth USD 1 000 or below will be allowed to
pass border points duty-free, with no need to provide certificates of origin for their
goods as long as they are on the list of products agreed on by the two countries. It is
anticipated that this would boost the demand for cross-border road freight transport
and also passenger transport demand; and
Transport operators should look into potential business generation from this move
and devise mechanisms to tap into this market. The increase in bus operator permits
69

which is not in line with the overall decrease of 19.67%. Overall performance of the
business can be optimised through cargo/ consignment consolidation with a view to
enhance viability and productivity.
The bulk of what is exported is products of chemical and allied industries, machinery
and mechanical appliance, vehicles, aircraft and transport equipment, prepared
foodstuff and plastics and rubber. These goods make up the top five most exported
commodities comprising 63.7% of total exports to Zimbabwe in 2015; this is an area
where operators can explore further.
The top five commodities imported from Zimbabwe in 2015 accounted for 92.4% of
total imports. These include base metals at 43.5%, mineral products at 23.2%,
prepared foodstuffs at 14.98%, and textiles at 5.96% and vegetable products at
4.72%.
Meanwhile the C-BRTA, the DoT and the Minister of Transport shall continue to work with
other stakeholders in the cross-border value chain towards the reduction of constraints that
negatively affect cross-border operations between South Africa and Zimbabwe. Towards this
end, support shall be rendered to initiatives taking place in the SADC region and the EAC-
COMESA-SADC tripartite aimed at reducing red tape, corruption, the cost of doing business
whilst improving productivity and opportunities for cross-border road transport operators
between South Africa and Zimbabwe.
70
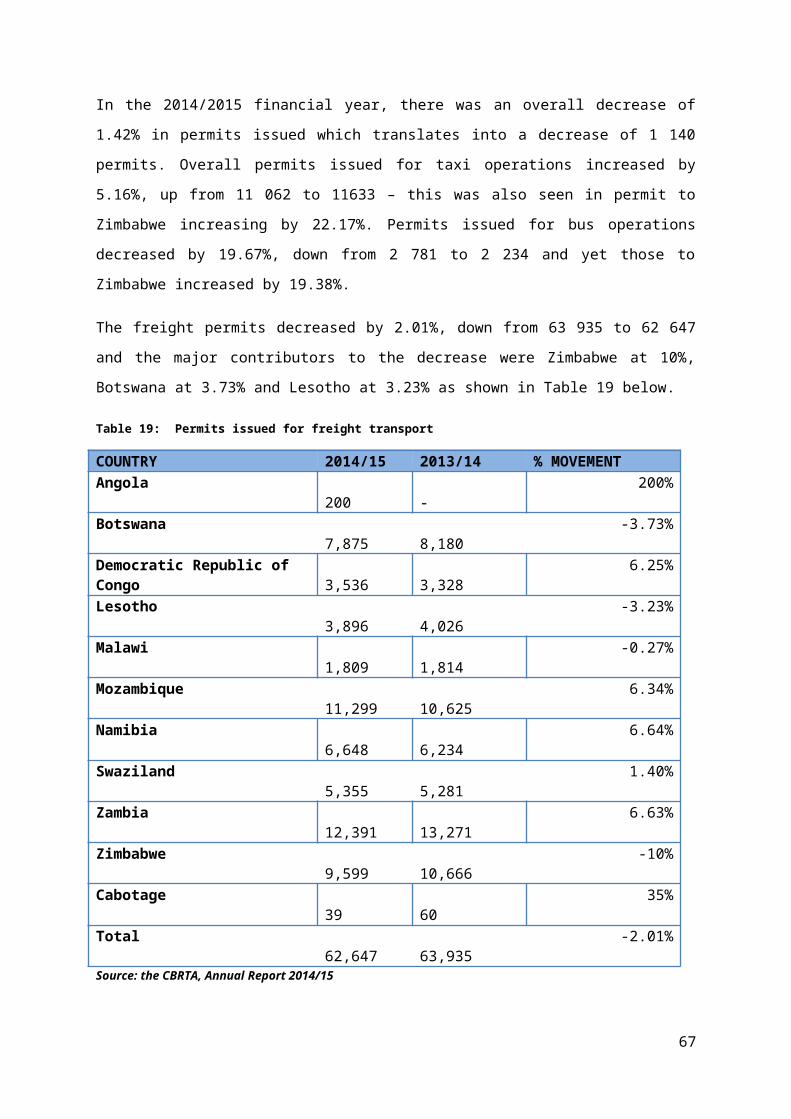
9. CONTACT DETAILS OF RELEVANT AUTHORITIES
9.1 Contact Details of Major StakeholdersThis section contains information on key stakeholders in the cross-border road transport
environment for both South Africa and Zimbabwe.
Table 30: Contact Details
South Africa
Cross-border Road Transport Agency 012 348 1357Port coordinator 013 793 7626
SARS Customs013 793 7458083 555 3357
BCOCC Provincial013 793 7626082 573 7871
DHA013 793 0102079 519 3099
DHA – Inspectorate013 793 0101072 147 2335
SAPS013 793 7311072 062 4988
Agriculture013 793 8534082 213 6304
SANRAL 012 844 8000Bakwena Platinum Corridor Concessionaire 011 519 0400
Port Health013 793 7183071 103 9112
State Security 082 804 5878Zimbabwe
Zimbabwe National Road Administration +263-4-442711-3
Zimbabwe Revenue Authority +263 -08622529Ministry of Transport and Infrastructural
Development 04 700991-9
Should a cross-border transport operator or any other stakeholder face any challenge or
need assistance in the course of conducting cross-border business, it is recommended that
they contact the stakeholders in Table 30 above.
71

10. REFERENCE
(2015). ZIMSTAT, National Report. Harare.
A, C. P. (2015, July 30). Enhancing competitiveness through increased productivity value addition and beneficiation. Harare, Zimbabwe.
African Development Bank Group. (2013). Zimbabwe Counrty Brief 2013 - 2015.
Anyala, O. &. (2014). Economic benefits of an efficient North-South corridor. Birmingham: Alta Innovations.
European Commission. (2012). Road Transport: Achange of gear. Belgium: Luxembourg.
(n.d.). GoZ, Ministry of Dinance and Economic Development, Treasury State of the Economy Report May 2014.
(n.d.). GoZ, Zimbabwe medium term plan 2011-2015.
Mangudya, J. (2015). Beyong Stabilization; Mid-Term Monetary Policy Statement. Harare.
OECD. (2014). Trade Facilitation Indicators: Zimbabwe. OECD.
PWC. (2014, November). Capital projects and infrastructure in EEast Africa, Southern African and West Africa. Johannesburg, Gauteng, South Africa.
SADC. (1996, August 24). SADC Protocol on Transport, Communications and Meteorology in the Southern African Developmet Community Region. SADC.
Statistics South Africa. (2013). Tourism 2013. Pretoria: Statistics South Africa.
Statistics South Africa. (2014). Tourism 2014. Pretoria: Statistics South Africa.
World Bank. (2014). Logistics Performance Index 2014. Washington DC: The World Bank Group.
World Bank. (2015). Doing Business 2015: Economy Profile 2015 Zimbabwe. Washington: The World Bank.
World Trade Organization. (2004). Zimbabwe Diangnostic Trade Integration Study. Volume 1. World Trade Organisation.
Worldbank Group. (2014). Zimbabwe Economib briefing.
72


