141
Towards a Shared European Logistics Intelligent Information Space European Green Logistics Strategies © SELIS, 2018 Page |

Towards a Shared European Logistics Intelligent Information Space
European Green Logistics Strategies
© SELIS, 2018
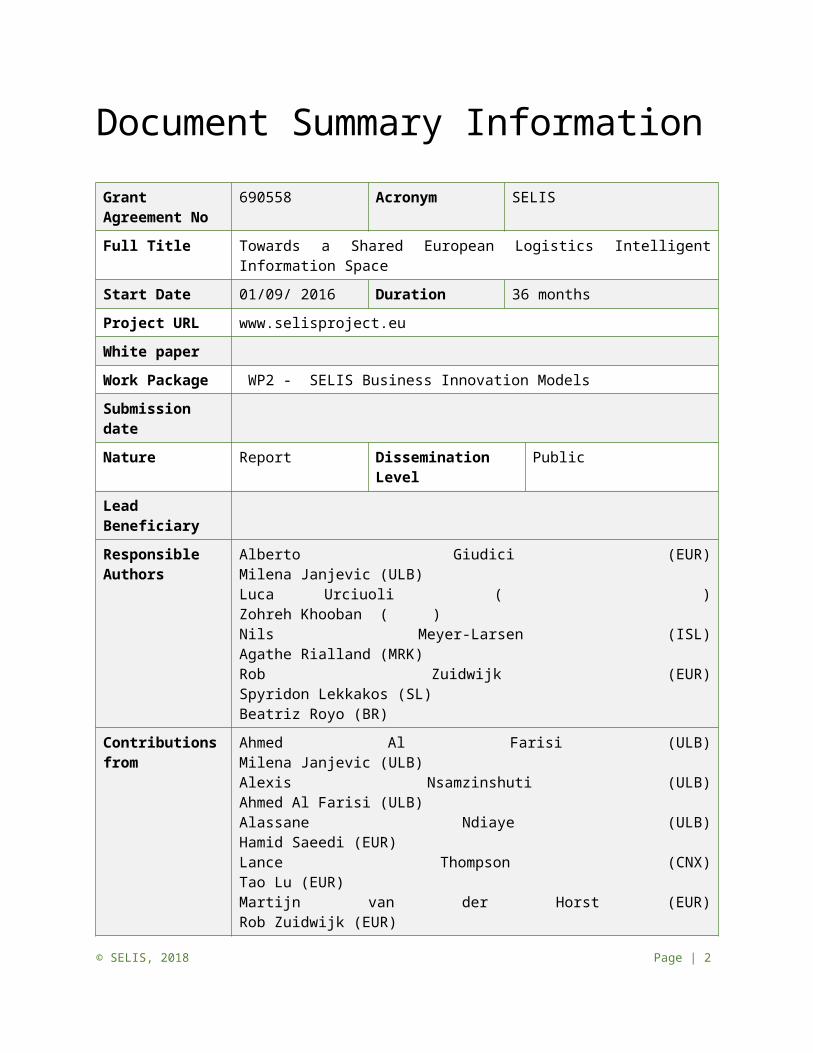
Document Summary InformationGrant Agreement No
690558 Acronym SELIS
Full Title Towards a Shared European Logistics Intelligent Information Space
Start Date 01/09/ 2016 Duration 36 months
Project URL www.selisproject.eu
White paper Work Package WP2 - SELIS Business Innovation Models
Submission dateNature Report Dissemination
Level Public
Lead Beneficiary Responsible Authors
Alberto Giudici (EUR) Milena Janjevic (ULB) Luca Urciuoli ( ) Zohreh Khooban ( )Nils Meyer-Larsen (ISL) Agathe Rialland (MRK)Rob Zuidwijk (EUR) Spyridon Lekkakos (SL) Beatriz Royo (BR)
Contributions from
Ahmed Al Farisi (ULB) Milena Janjevic (ULB) Alexis Nsamzinshuti (ULB) Ahmed Al Farisi (ULB) Alassane Ndiaye (ULB) Hamid Saeedi (EUR) Lance Thompson (CNX) Tao Lu (EUR) Martijn van der Horst (EUR) Rob Zuidwijk (EUR) Hamid Saeedi (EUR)
Revision history (including peer reviewing & quality control)
Version
Issue Date
Stage
Changes Contributor(s) Comments
© SELIS, 2018 Page | 2
Executive SummaryThe SELIS project aims at offering a platform with the technological and business capabilities for enhancing and innovating several logistics activities towards better performance, in particular cost reduction, emissions reduction, and improving reliability. Consequently, seven operational and organizational strategies, i.e. European Green Logistics Strategies (EGLS1-7) are developed and implemented by the SELIS affiliated Living labs. In the framework of these strategies, this document discussed the research and development agendas of the SELIS project.
A number of practical and research problems of operationalizing collaborative transport networks involving heterogeneous stakeholders are identified through a detailed examination of the state of the art. As a result, this document discusses: operational problems associated with collaborative transport planning, the capability of supply chain visibility enabling corrective planning, low-cost financing, performance monitoring and alignment of organizational incentives. This led to refined research gaps addressed by the SELIS research and development plans.
These challenges and the proposed solutions presented in this document are summarized in terms of the EGLS as follows.
i. There is a lack of planning and execution processes to properly capture the value added by different levels of collaboration, definition of cost efficiency and reliability of networks as well as the need to determine optimal collaborative agreements. Therefore, an operational strategy aimed at redesigning the existing logistics processes is developed to address these issues.
ii. Investigation of types of collaborative schemes, business models, governance structures, gain & risk sharing mechanisms are required as organizational strategy and this problem is addressed in this document.
iii. Lack of visibility and foresight is a bottleneck to transport planning and monitoring, and often the cause of expensive and time-consuming corrective processes. The strategic relevance of higher visibility is its impact on operational efficiency, performance, and that it enables other innovative strategies like collaboration and risk sharing, and collaborative planning. Therefore, it is important to investigate how to achieve higher visibility and exploit its benefits of cost reduction by enabling effective preventive actions.
iv. In an environment of low liquidity, the cost of financing has increased and firms are finding it more difficult to obtain the credit they need. A well-designed supply chain financing program has the potential to help corporations optimize their working capital. The development of the core supply chain financing strategy within SELIS aims at addressing three main challenges: the specifications of important variables, such as payment terms, interest rates, discounting schemes, liquidity threshold, and supplier’s KPIs; the functional requirements for a technological solution as well as the implementation and institutionalization of such as solution.
v. As one of its performance targets, SELIS aims to provide tools for environmental performance monitoring. However, the lack of standardized measurement methods as well as data availability are identified as challenges to be addressed in this regard. For this, a strategy for implementing carbon footprint accounting method in SELIS LLs is presented in this document, including a research plan to investigate the impact of level of collaboration and privacy, the cost of sustainability, methods for splitting GHG emissions among collaborating organizations.
© SELIS, 2018 Page | 3

vi. A strategy for optimization of inventory management systems in a supplier-retailer environment is also presented. The strategy aims at facilitating responsiveness to demand fluctuations, by improving demand forecasts, and collaborating on promotion event planning and requires the development of information-sharing mechanisms that can foster further collaboration between suppliers and retailers. Research agendas dealing with the impact of collaboration, identifying data requirements from retailer and supplier sides, setting up KPIs are put forward.
vii. This document also presented a strategic capability using supply chain visibility to reliably report performance of cross-border supply chains in compliance with customs regulations. For this, supply chain visibility needs to be established through three interlaced data pipelines; commercial, logistics, and regulatory. The research and development plans planed in this aspect aim at identifying design principles and available standards for creating consistency between the data pipelines, and investigating the impact of collaboration and supply chain visibility on risk identification.
Disclaimer
The content of the publication herein is the sole responsibility of the publishers and it does not necessarily represent the views expressed by the European Commission or its services.
While the information contained in the documents is believed to be accurate, the authors(s) or any other participant in the SELIS consortium make no warranty of any kind with regard to this material including, but not limited to the implied warranties of merchantability and fitness for a particular purpose.
Neither the SELIS Consortium nor any of its members, their officers, employees or agents shall be responsible or liable in negligence or otherwise howsoever in respect of any inaccuracy or omission herein.
Without derogating from the generality of the foregoing neither the SELIS Consortium nor any of its members, their officers, employees or agents shall be liable for any direct or indirect or consequential loss or damage caused by or arising from any information advice or inaccuracy or omission herein.
Copyright message
© SELIS Consortium, 2016-2019. This deliverable contains original unpublished work except where clearly indicated otherwise. Acknowledgement of previously published material and of the work of others has been made through appropriate citation, quotation or both. Reproduction is authorised provided the source is acknowledged.
© SELIS, 2018 Page | 4

ContentsList of Figures...............................................................................................................................................6
List of Tables................................................................................................................................................7
Glossary of terms and abbreviations used...................................................................................................8
1 Introduction.......................................................................................................................................10
2 Problem Description..........................................................................................................................12
2.1 Collaborative Synchromodal Transport Planning.......................................................................12
2.2 Collaboration Risk and Value Sharing........................................................................................18
2.3 Supply Chain Visibility................................................................................................................21
2.4 Supply Chain Financing..............................................................................................................24
2.5 Environmental Performance Management...............................................................................29
2.6 Supply Chain Optimization.........................................................................................................35
2.7 E-compliance and Customs........................................................................................................37
3 State-of-the-Art.................................................................................................................................40
3.1 Synchromodal Transport...........................................................................................................40
3.2 Collaborative transport..............................................................................................................48
3.3 Supply Chain Visibility and CAPA...............................................................................................54
3.4 Supply Chain Financing..............................................................................................................60
3.5 Environmental Performance Management...............................................................................64
3.6 Supply Chain Optimization.........................................................................................................67
4 Development plans and Expected Outcomes....................................................................................78
4.1 Collaborative Planning and Synchromodal Transport................................................................78
4.2 Collaboration Risk and Value Sharing........................................................................................80
4.3 Visibility and CAPA.....................................................................................................................81
4.4 Supply Chain Financing..............................................................................................................83
4.5 Environmental Performance Management...............................................................................83
4.6 Supply Chain Optimization.........................................................................................................84
4.7 E-compliance and Customs........................................................................................................86
5 Bibliography.......................................................................................................................................88
© SELIS, 2018 Page | 5

List of FiguresFigure 1 Deep sea terminal operations (Vis and De Koster, 2003)............................................................14
Figure 2 Environmental ISO regarding LCA. (based on (Camarero,2011)).................................................30
Figure 3 Four key stages of LCA (ISO 14040/14044) (based on (Shaofeng and Meili,2011)).....................30
Figure 4 Generic cycle of a production system for LCA (figure based on (Kehdall, 2012) )........................31
Figure 5 Three sample transport chain maps, including all transport elements and transhipment centres encountered throughout the journey (Smart Freight Centre, 2016)............................................32
Figure 6 A product logistic and transport processes within their primary methodologies........................32
Figure 7 Integrated view of freight transport planning (Behdani et al. 2014)...........................................40
Figure 8 Dual integration in a Synchromodal Freight Transport System (Behdani et al. 2014)..................41
Figure 9 Structure and sequence of actions in a reverse factoring arrangement......................................60
Figure 10 A typical dynamic discounting solution (Gelsomino et al., 2016)...............................................63
Figure 11 CPFR Conceptual Model (VICS CPFR roadmap 2004).................................................................70
Figure 12 Changing relationship with CPFR (based on Motorola Case study 2007)...................................73
Figure 13 CPFR Process Steps – Adopted from VICS – CPFR Generic Model (ECR Europe, April 2001)......73
Figure 14 CPFR general implementation diagram (ECR Europe, April 2001).............................................76
Figure 15 CPFR Implementation detailed model.......................................................................................76
© SELIS, 2018 Page | 6

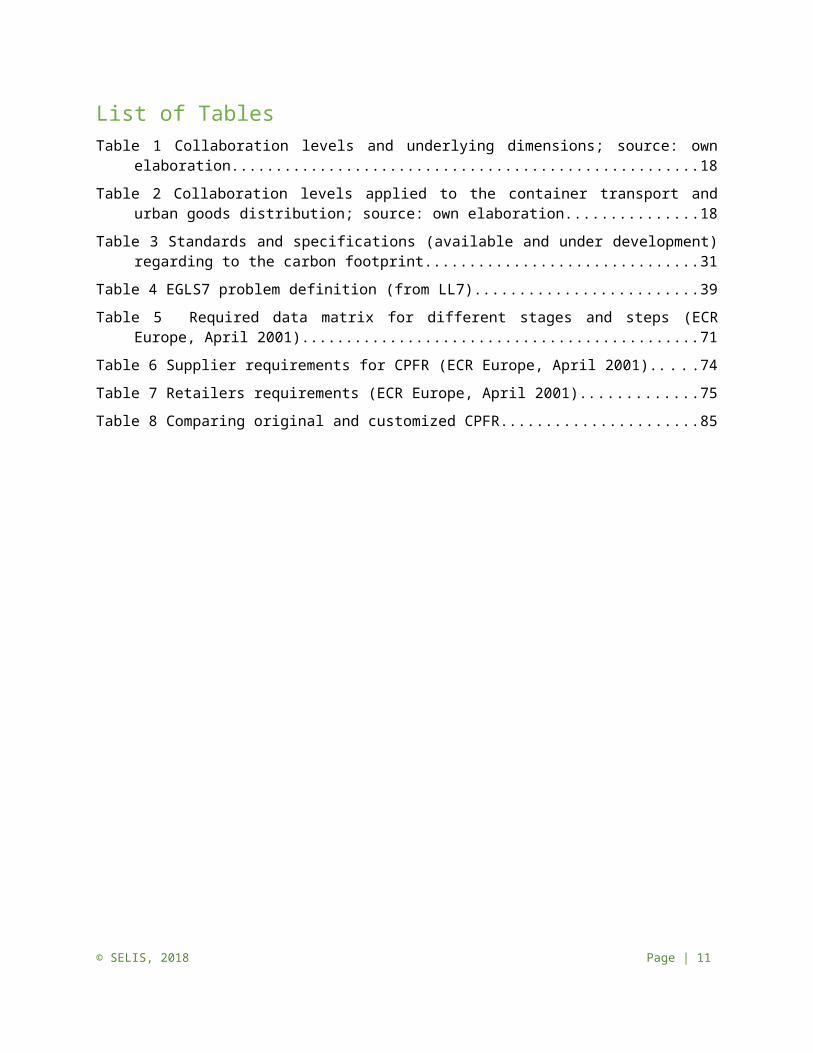
List of Tables Table 1 Collaboration levels and underlying dimensions; source: own elaboration..................................18
Table 2 Collaboration levels applied to the container transport and urban goods distribution; source: own elaboration..............................................................................................................................18
Table 3 Standards and specifications (available and under development) regarding to the carbon footprint..........................................................................................................................................31
Table 4 EGLS7 problem definition (from LL7)............................................................................................39
Table 5 Required data matrix for different stages and steps (ECR Europe, April 2001)............................71
Table 6 Supplier requirements for CPFR (ECR Europe, April 2001)............................................................74
Table 7 Retailers requirements (ECR Europe, April 2001)..........................................................................75
Table 8 Comparing original and customized CPFR.....................................................................................85
© SELIS, 2018 Page | 7

Glossary of terms and abbreviations usedAbbreviation / Term
Description
GHG Greenhouse gases
IPCC Intergovernmental panel on climate change
WMO World Meteorological Organization
UNEP United Nations Environment Programme
GWP Global warming potential
GHG Protocol Greenhouse Gas (GHG) Protocol
EN16825 Methodology for Calculation and Declaration of Energy Consumption and GHG Emissions of Transport Services (Freight and Passengers)
LSP Logistic Service Provider
WRI World Resource Institute
WBCSD World Business Council for Sustainable Development
CO2e CO2 equivalent
EMS Environmental Management Systems
LCA Life Cycle Assessment
DEFRA Department for Environment Food & Rural Affairs
CEN European Committee for Standardisation
US EPA United States Environmental Protection Agency
SC Supply Chain
CAPA Corrective Actions and Preventive Actions
KPI Key Performance Indicators
CPFR Collaborative Planning, Forecasting, and Replenishment
CR Continuous Replenishment
CRP Continuous Replenishment Planning
ECR Efficient Consumer Response
EDLP Everyday Low Prices
EOQs Economic Order Quantities
JELP Joint Economic Lot sizing Problem
© SELIS, 2018 Page | 8

SCN SELIS Community Node
SCO Supply Chain Optimization
SCV Supply Chain Visibility
SME Small and medium enterprises
VICS Voluntary Inter-Industry Commerce Standard
VMI Vendor – Managed Inventory
© SELIS, 2018 Page | 9

1 IntroductionThe SELIS project aims at developing a shared European intelligent information space that will serve as a platform for collaboration on different aspects of economic activity among different actors, private and/or public, within and between supply chains.
The ongoing information technology revolution has generated an immense change in how supply networks function, but also, opportunities for innovation in several logistics activities (i.e., transportation, procurement, etc.). Traditional, company-owned, legacy information systems have been replaced by or interact now with complex platforms which offer a range of mechanisms for facilitating matches among logistics participants by controlling variables such as pricing, visibility, information sharing, terms of trade, and transaction fees. Given these variables, supply chain participants often face complex problems when optimizing their own decisions.
SELIS’ ambition is to offer such a platform (or contribute to its conceptualization) that will bring together different supply chain actors with the objective of (a) facilitate information exchange among actors; (b) incorporate optimization and simulation capabilities for several types of logistics-related business decisions; (c) enable the generation of value from the alignment and synchronization of the participants’ actions and resources; and (d) facilitate the actors’ collaboration through the implementation of comprehensive gain and risk sharing mechanisms.
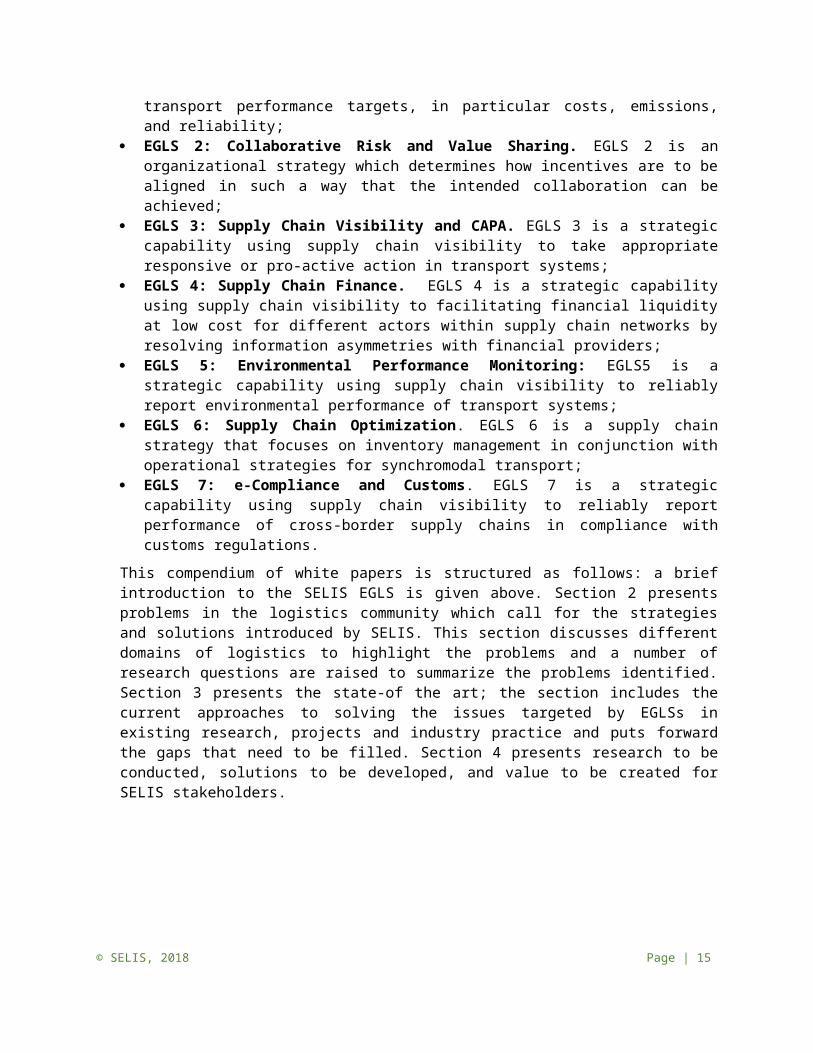
The SELIS project aims to achieve these goals by establishing a research and innovation environment, or Living Labs (LLs), which incorporate a wide spectrum of business and logistics actors. The companies participating in the LLs will provide data to the SELIS platform and will serve as part of the SELIS ecosystem for the testing of different strategies and operational solutions developed. Ultimately, the SELIS project will lead to the formulation of unifying operational and strategic roadmaps that will enable large-scale adoption of innovations. Private and public actors involved with transport and logistics will develop new pan European Green Logistics Strategies (EGLS). This paper serves as a guideline for the further development of the following 7 strategies:
EGLS 1: Collaborative Planning and Synchromodality. EGLS1 is an operational collaborative strategy which determines how logistics resources are synchronized in an optimal way to achieve certain transport performance targets, in particular costs, emissions, and reliability;
EGLS 2: Collaborative Risk and Value Sharing. EGLS 2 is an organizational strategy which determines how incentives are to be aligned in such a way that the intended collaboration can be achieved;
EGLS 3: Supply Chain Visibility and CAPA. EGLS 3 is a strategic capability using supply chain visibility to take appropriate responsive or pro-active action in transport systems;
EGLS 4: Supply Chain Finance. EGLS 4 is a strategic capability using supply chain visibility to facilitating financial liquidity at low cost for different actors within supply chain networks by resolving information asymmetries with financial providers;
EGLS 5: Environmental Performance Monitoring: EGLS5 is a strategic capability using supply chain visibility to reliably report environmental performance of transport systems;
EGLS 6: Supply Chain Optimization. EGLS 6 is a supply chain strategy that focuses on inventory management in conjunction with operational strategies for synchromodal transport;
EGLS 7: e-Compliance and Customs. EGLS 7 is a strategic capability using supply chain visibility to reliably report performance of cross-border supply chains in compliance with customs regulations.
© SELIS, 2018 Page | 10
This compendium of white papers is structured as follows: a brief introduction to the SELIS EGLS is given above. Section 2 presents problems in the logistics community which call for the strategies and solutions introduced by SELIS. This section discusses different domains of logistics to highlight the problems and a number of research questions are raised to summarize the problems identified. Section 3 presents the state-of the art; the section includes the current approaches to solving the issues targeted by EGLSs in existing research, projects and industry practice and puts forward the gaps that need to be filled. Section 4 presents research to be conducted, solutions to be developed, and value to be created for SELIS stakeholders.
© SELIS, 2018 Page | 11

2 Problem Description
Collaborative Synchromodal Transport Planning Synchromodality represents an innovative business model where transport services are deployed in a more flexible way. In particular, booking a transport service represents a commitment to deliver the goods from an origin to a destination in a timely fashion, without specifying further details of the transport service, i.e., mode, route, departure time, etc. This allows the provider of the transport service to deploy resources in the most convenient way, as long as customer demand is satisfied. Consequently, synchromodality faces new challenges and involves new collaborative mechanisms between business partners both in the supply of services and in the management of demand.
In general, the major challenge for future research on transport collaboration lies in the high complexity and diversity of both the transportation requests and allocation of the resources between the collaborating partners. SELIS strategies aim at synchronized collaborative freight transport systems. These strategies can be formulated generically, and then applied to the domains of container logistics and urban logistics.
In this document, we consider the problem of deploying synchromodal transport as a result of a collaboration between different stakeholders. The terms “logistics collaboration” or “supply chain collaboration” are very broad notions that can encompass a variety of concepts. In supply chain management, horizontal co-operation occurs at the same echelon of the distribution system, whereas vertical co-operation applies to different echelons (Krajewska et al., 2008). Examples of vertical collaboration in supply chain management include vertical integration of transportation activities (e.g. in an intermodal setting), and Vendor Managed Inventory (VMI) whereas examples of horizontal collaboration include warehouse sharing, co-loading or purchasing alliances (Verstrepen et al., 2006). The focus of EGLS1 is on collaborative transportation schemes, including vertical integration and horizontal collaboration in transport chains.
At the moment, synchronized freight systems have been studied and implemented only from the perspective of a central planner that owns transport means and uses subcontracted services (B. Van Riessen, 2013; Bart van Riessen, Negenborn and Dekker 2015; Behdani et al., 2014) . Collaboration is believed to bring benefits, and this is often the case as pooling resources helps to better hedge for uncertainties and to enable the flexible deployment of those resources that are best fit to meet demand (Cruijssen, Cools and Dullaert, 2007). In other words, a larger coalition of actors in the transport system join their resources and has more opportunities to deploy those resources to meet joint demand, which enables better performance in terms of costs, emissions, and reliability.
In line with the SELIS project, the particular interests and perspectives of each stakeholder should not be neglected and, therefore, system performance cannot be reduced to the viewpoint of a single stakeholder. This reduction takes place often when considering collaborative planning approaches (Krajewska et al., 2007); a unique central solution is imposed on the shared assets without accounting for the effect of such modelling choice on the single stakeholder’s performance. Indeed, even when the stakeholders in a transportation system aim a seamless and synchronized transport solution, the operators of transport subsystems measure their performance in different ways, not necessarily amounting to a consistent overall performance. For instance, a terminal operator usually measures its performance by the throughput of its container terminal, while an inland transport operator aims to improve the utilization of her assets. This is a first problem: (1) how can we define, compute and operate
© SELIS, 2018 Page | 12

different measures of cost efficiency and reliability of a network when those are seen from different perspectives?
Collaboration is the action of working together towards a result. It, therefore, requires information sharing and reciprocal visibility of partners’ systems. In return, collaboration will produce benefits that need to be shared to incentivize the stakeholders to collaborate. Those elements and the relation between them is set up and defined in a collaborative agreement, which is going to affect the operational synchronization of tasks. One can compare the effect of different collaborative agreements on the performance of the network which is jointly orchestrated and coordinated. This is the second problem: (2) what is the impact of different collaborative agreements on the network performance?
© SELIS, 2018 Page | 13
Domain: Container Transport
We first describe the sequence of handling operations that brings an import container from a deep-sea vessel to its final destination. This is often referred to as the import flow as goods are moving from the seaside to the inland, coming from foreign locations. We will focus on this flow because of the intrinsic large call sizes, i.e., large number of loaded and unloaded containers due to the high capacity of the liner, but also, because of the high level of uncertainty associated to the release time of containers. Indeed, oversea transport is well known for its low level of predictability that stresses inland transport and requires for improved ways of organizing it.
Figure 1 Deep sea terminal operations (Vis and De Koster, 2003)
Containers are first unloaded from the container ship onto vehicles (automated or not) that will bring the containers to the stacking yard. The quay cranes will be used for the first unloading while stacking cranes will bring the containers from the vehicles to the stack. During these first two steps, information on the positions of the container, both on the vessel and in the stack, is used to guide the loading and unloading operations. Containers are placed in the stack, to be forwarded to the inland means of transport that will pick them up. The containers are moved from the stack to the truck, train, or barge by means of a stacking crane, and when applicable, internal transport. The inland transport by means of barge and train usually includes transhipment at inland terminals. Usually, the final leg of the container journey will be performed by truck to deliver the container to the consignee’s warehouse. Modes of transport differ in terms of cost per container and transport speed, but also the operational constraints differ: truck transport can be arranged quickly and is flexible, while train transport is rigidly scheduled as the infrastructure is shared with public transport, and barge transport faces congestion at the deep sea terminal where it shares the berth with deep sea vessels that have priority.
A key prerequisite of synchromodal transport is a-modal booking, i.e. where no commitment to a specific mode is made in advance. Container routing between the
transport (Bontekoning and Priemus, 2004; Eng Larsson and Kohn, 2012)‐ but intermodal transport planning is still not taking reliability into account. Academic literature and practitioners often introduce slack time or redundant capacity to improve their reliability. Moreover, industry partners involved in SELIS Living Lab 2 are further supporting such an investigation on reliability by requesting a Network Reliability Tool. This tool will provide business value to stakeholders by enhancing the visibility on the reliability of different transport services. An additional challenge in container transport is that of reaping the benefits of synchromodal transport.

Research Questions
Two sets of research questions to be addressed by EGLS1 will be provided and described hereafter.
The Impact of level of collaboration on synchromodal transport performance
EGLS1 aims at multiple performance targets, in particular cost reduction, emissions reduction, and improving reliability. Collaborative planning and execution of logistic operations result in adding certain values along these performance measures. As soon as one aims to improve or even optimize overall performance, trade-offs between reliability and efficiency need to be made. Zuidwijk and Veenstra ( 2015) expressed the value of information in container transport as improved trade-offs between transport reliability and efficiency. The level of collaboration among stakeholders implies the extent to which stakeholders share information, and consequently the performance of the transport operations. These concerns lead to the following research questions dealing with the level of collaboration and information sharing.:
(1) How does one define reliability of synchromodal transport processes?
© SELIS, 2018 Page | 14
Domain: Urban Distribution
The second application domain is that of urban distribution. Here, we present the main operational differences between hinterland container and urban transport. First of all, scarce standardization of operations and transport units is a major difference. The high heterogeneity of organizations reflects also a high variety of means of transport and transport solutions: trucks of different sizes are used, as well as, vans, cars, motorcycles and bicycles. All of those modes of transport have different properties in terms of cost, speed, capacity, responsiveness and practicality in the urban landscape. There is also diversity in the delivery destinations and their physical layout, which is increasing the complexity of optimal planning. Moreover, different transport units are used, leading to the question of how to efficiently use transport capacity: pallets, boxes and packages of different sizes and shapes increase the complexity of handling operations.
Secondly, from operational planning point of view, the case of Vehicle Routing Problems is appropriate for the urban distribution domain because vehicles perform tours to serve customers and have to come back to their depot. In the case of container transport, we can instead mainly consider the flow from origin to destination rather than the routing in the network, even if the routing problems apply for barges and drayage operations.
Applications of EGLS1 to this setting comes from the stakeholders involved in SELIS Living Lab 3 who are operating in city distribution. In this domain, execution of transport in a reliable manner is important and synchromodality is seen as a valid solution. However, cooperation and information exchange between stakeholders has not yet been fully accomplished even if it is seen as a source of potential business value.
Domain: Container Transport
We first describe the sequence of handling operations that brings an import container from a deep-sea vessel to its final destination. This is often referred to as the import flow as goods are moving from the seaside to the inland, coming from foreign locations. We will focus on this flow because of the intrinsic large call sizes, i.e., large number of loaded and unloaded containers due to the high capacity of the liner, but also, because of the high level of uncertainty associated to the release time of containers. Indeed, oversea transport is well known for its low level of predictability that stresses inland transport and requires for improved ways of organizing it.
Figure 1 Deep sea terminal operations (Vis and De Koster, 2003)
Containers are first unloaded from the container ship onto vehicles (automated or not) that will bring the containers to the stacking yard. The quay cranes will be used for the first unloading while stacking cranes will bring the containers from the vehicles to the stack. During these first two steps, information on the positions of the container, both on the vessel and in the stack, is used to guide the loading and unloading operations. Containers are placed in the stack, to be forwarded to the inland means of transport that will pick them up. The containers are moved from the stack to the truck, train, or barge by means of a stacking crane, and when applicable, internal transport. The inland transport by means of barge and train usually includes transhipment at inland terminals. Usually, the final leg of the container journey will be performed by truck to deliver the container to the consignee’s warehouse. Modes of transport differ in terms of cost per container and transport speed, but also the operational constraints differ: truck transport can be arranged quickly and is flexible, while train transport is rigidly scheduled as the infrastructure is shared with public transport, and barge transport faces congestion at the deep sea terminal where it shares the berth with deep sea vessels that have priority.
A key prerequisite of synchromodal transport is a-modal booking, i.e. where no commitment to a specific mode is made in advance. Container routing between the
(2) What is the impact of the level of collaboration, and in particular the level of information sharing, on reliability and efficiency of synchromodal transport processes?
(3) How are planning and execution processes designed to capture the potential value of collaboration and information sharing?
(4) In the trade-off between reliability and efficiency, what is the “price of reliability” for synchromodal systems?
The Impact of collaborative agreements on synchromodal transport performance
The development of a synchromodal network involves multiple suppliers of transport handling services. For instance, as pointed out by (Van Riessen, Negenborn, and Dekker 2015)1, the problem of developing a synchromodal network when subcontractors are involved has not yet been studied. Network design and network service design problems have predominantly been studied for network operators that act as single decision makers (Van Riessen, 2013; Van Riessen, Negenborn, and Dekker, 2015; Behdani et al., 2014). The case when multiple decision makers (for instance, a logistic service provider, multiple carriers and inland terminal operators) want to implement synchromodal transport brings along the question of how these various stakeholders will collaborate. Each stakeholder will balance the benefits of its independent strategic position and the operational benefits of collaboration. Synchronizing the deployment of logistic resources at the operational level requires a certain level of collaboration, in particular information sharing between stakeholders. For instance, logistic service providers are not sharing the actual shippers’ transport requirements to the network operators that are going to physically fulfil shippers’ demand. This missing information exchange constitutes a barrier against the deployment of synchromodal transport solutions. Indeed, a dynamic information exchange on the actual demand requirements and the current state of the network is required to achieve the level of planning flexibility necessary for synchromodal transport. However, carriers and terminal operators may not have aligned interests: for example, terminal operators may want to be informed well in advance about the hinterland transport mode and route of particular container to optimize yard operations, while carriers may prefer to defer such allocation decisions to the last moment, as synchromodality prescribes.
Understanding the value of operational information sharing between stakeholders will help the construction of collaborative agreements that can effectively enable synchromodal planning and execution. This raises research questions focusing on the structure of collaboration, i.e., who is collaborating and exchanging information with whom, and its impact on performance of the synchromodal transport processes. These research questions embody the need for “collaborative contracts” that define the identity of collaborators, the conditions as well as incentive alignments.
(1) What is the impact of the various collaborative agreements between stakeholders on synchromodal transport performance?
(2) What is the effect of competitive behaviour on synchromodal transport performance? (What is the price of anarchy?)
(3) Which collaborative agreements add the most value to the planning and execution processes? (4) What operational issues require incentive alignment between different stakeholders?
1 “Network development in a cooperative synchromodal transportation setting is more complex than the intermodal network design problem. Each addition of a new node or connection may influence the loads on existing ones. However, the sub-contractors of individual connections will aim for stable flows for economic operation. How can the network be expanded in a stable way, without jeopardizing the operations of individual sub-contractors? To our knowledge, the problem of stable development of synchromodal network over time has not been studied, yet.”© SELIS, 2018 Page | 15

Collaboration Risk and Value Sharing Collaboration in transport is seen as an important enabler of efficiency and sustainability. We can define several levels of “collaboration maturity” that vary according to a number of elements. Table 1 shows these different levels.
Table 1 Collaboration levels and underlying dimensions; source: own elaboration
Collaboration maturity level
1 2 3 4
Information (data exchange,
None Point to point information exchange
High Completely integrated
Operations (design of planning and executing)
None Coordinated long term planning of operations
Real-time dynamic planning and routing
Real-time automated synchronization of activities
Organization (governance, risk and gain sharing)
None Bi-lateral agreements
Orchestrator of horizontal and vertical collaboration
Hyperconnected decentralized network collaboration
Moving towards a higher level of collaboration requires enablers on several dimensions: information exchange, operational capabilities such as the design of planning and execution and the organizational aspects (governance, risk and gain sharing). In order to illustrate these different levels of collaboration and the underlying enablers, we will use two example domains: container transport and urban freight transport. Table 2 illustrates the different collaboration levels in the container and urban freight transport.
Table 2 Collaboration levels applied to the container transport and urban goods distribution; source: own elaboration
© SELIS, 2018 Page | 16
Collaboration maturity level
1 2 3 4
Container transport
Uni-modal point to point transport
Intermodal transport
Synchromodal transportation
Physical Internet
Urban goods distribution
Fragmented urban distribution
Consolidated urban freight transport
Connected city logistics
Physical Internet
© SELIS, 2018 Page | 17

© SELIS, 2018 Page | 18
Domain: Urban Freight Transport
In urban freight transport, a no-collaboration scenario corresponds to a fragmented point-to-point distribution in which each logistic service provider optimizes its own operations. However, given the high fragmentation of receivers and high fragmentation of the transportation market (i.e. across European cities, 85% of the short-distance truck companies employ less than 5 drivers and are carrying out 80% of the urban deliveries (Dablanc, 2011)), a no-collaboration strategy results in a low utilisation of vehicle capacity. For example, Allen and Browne (2010) have gathered data for 16 cities in the UK and find a loading factor of 58.4% for laden journeys to and from an urban area and of 39.3% for laden journeys within an urban area. The OECD working group on urban goods transport estimated that around 30 percent of vehicles carry loads of 25 percent below capacity, and 50 percent loads of more than 50 percent below capacity (Taniguchi et al., 2004).
The second level of collaboration corresponds to schemes such as consolidated urban freight transport. The fundamental idea of urban consolidation is that the volume of freight vehicles travelling within urban areas could be reduced through more efficient utilisation of vehicles, i.e., higher average load factors and fewer empty trips (Crainic and Gendreau, 2003). Such freight consolidation involves grouping individual consignments or part-loads that are destined for the same locality at a consolidation centre so that a smaller number of full loads are transported to their destination (Lewis et al., 2007). Freight consolidation can be achieved either by introducing a physical consolidation platform, or by achieving a behavioural change (Verlinde et al., 2012). Generally, urban freight consolidation schemes are governed by a central operator who possesses transhipment and transportation assets (i.e. urban consolidation centre operator) and involve long-term partnerships. Compensation rules, service design and performance attributes such as lead time and reliability are all agreed upon in advance and under the responsibility of the consolidation centre operator.
The third level of collaboration corresponds to what we refer to as “connected city logistics”. This scheme corresponds to a more flexible vision of the city logistics. The scheme is still governed by a central operator whose main purpose is not to provide assets (although he can possess them) but to orchestrate the transportation between different infrastructure and transport service providers. The role of information technology is central to this collaboration model.
The final level of collaboration corresponds to the Physical Internet enabled Hyperconnected City Logistics. Physical Internet is an open global logistics system founded on physical, digital, and operational interconnectivity, through encapsulation, interfaces and protocols. When applied to urban environments, the Physical Internet enables the emergence of Hyperconnected City Logistics which is an open system engaging a multitude of diverse actors who, while aiming for their own goals, contribute to the overall performance of the system (Crainic and Montreuil, 2016). In operational terms, the city logistics web requires numerous multi-modal logistics and transportation service providers to co-operate in order to ensure
consolidation and synchronization (Crainic and Montreuil, 2016). In business terms, it involves contractual arrangements between users and providers, notably in terms of pricing, service level, liability, insurance in a distributed risk, cost, revenue and profit, leading the way to ever more hyperconnected business models (Crainic and Montreuil, 2016).
In this document, we discuss the organizational enablers of a transition towards
Research Questions
In this section, we present the research questions that will be addressed in EGLS2. These research questions correspond to four general domains that will be investigated in this EGLS. The EGLS2 addresses the organizational aspects of the collaboration which can be subdivided in the following main domains:
(1) Design of collaborative scheme;(2) Business models and governance structures of the collaborative transport networks;(3) Gain-sharing mechanisms in collaborative transport networks;(4) Risk-sharing mechanisms in collaborative transport networks.
We will now present each of the four domains and the relevant research questions.
Design of collaborative transport schemes
The first set of research question concerns the need to further investigate and characterize collaborative models in transport. Indeed, collaboration models vary according to a number of elements such as the type of participating actors, the presence of one or more nodes, the transportation market segment, etc.
With this in mind, the following research questions are raised:
(1) Which basic elements characterize collaborative transport models?(2) Which collaborative transport models are currently adopted by companies in Europe across
different transport market segments? (3) Which relationships exist between elements describing a certain collaborative transportation
model?
Business models and governance structures of the collaborative transport networks
The second research question aims at assessing the most promising business models and governance structures that can foster collaborative transportation environments across different modes and scales of the transport system. ALICE has identified this aspect by stating that the challenge is to find economically sustainable business models for the provision of logistic services in open and collaborative supply networks. The goal is to preserve profitability for service providers in collaborative networks, ensuring a smooth transition to the new business ecosystem based on shared resources and services (ALICE, 2014a).
With this in mind, the following research questions can be raised:
(1) Which are the current and emerging governance models of collaborative transportation schemes and how do they differ according to the type of transport market segment?
© SELIS, 2018 Page | 19
consolidation and synchronization (Crainic and Montreuil, 2016). In business terms, it involves contractual arrangements between users and providers, notably in terms of pricing, service level, liability, insurance in a distributed risk, cost, revenue and profit, leading the way to ever more hyperconnected business models (Crainic and Montreuil, 2016).
In this document, we discuss the organizational enablers of a transition towards

(2) What are the advantages and the disadvantages of each business model and governance structure?
(3) What new roles and processes do these business models and governance structures imply for the existing logistics stakeholders and what are the emerging roles?
(4) What is the role of IT as an enabler of the new governance models?(5) What are the required business models and governance structures that enable the creation of
more open and more dynamic collaboration networks?
Gain sharing mechanisms in collaborative logistics networks
The third set of research questions we raise concerning collaborative risk and gain sharing aim at investigating the gain sharing mechanisms in collaborative logistics networks. Indeed, one of the most important tasks in a logistics collaboration is to allocate the synergy estimated in the business case to the participating companies in the collaboration (Cruijssen, 2012). The application of new gain-sharing techniques to promote logistics collaboration across the supply chain has been identified as a potential game-changer (ALICE, 2014b).
With this in mind, we put forward the following research questions:
(1) What are the methodologies that are currently used for gain-sharing in collaborative transport networks and how do they differ according to the type of collaboration model considered?
(2) What is the impact of the different gain-sharing mechanisms on the type of coalitions formed?(3) What gain-sharing mechanisms are required to enable the creation of more open and more
dynamic collaboration networks?
Risk-sharing mechanisms in collaborative logistics networks
The fourth set of research questions aim at investigating the risk sharing mechanisms in collaborative transportation networks. Indeed, although the risk management has been studied thoroughly from a perspective of a single company, there is currently a lack of methods for adequately assessing and sharing risks between several actors participating in a collaborative scheme.
Under this research challenge, the following research question will be addressed:
(1) What are the methodologies that are currently used for risk-allocation in collaborative transport networks and how do they differ according to the type of collaboration model considered?
(2) Which risk-allocation methodologies are required in order to adequately share risks between different collaboration partners?
(3) How can risk-allocation mechanisms be integrated with the compensation rules?
Supply Chain VisibilitySupply chain visibility is a well-recognized challenge in transport and logistics. Visibility in this context refers to access to information, timeliness of information, correctness of information. Visibility is a prerequisite for transport planning, execution and monitoring. Visibility at the same time is a factor of competitiveness and of risk. The main challenge to be discussed here is the lack of visibility as a hinder to supply chain agility and transport and logistics performance.
Supply chain visibility and CAPA (Corrective Actions and Preventive Actions) capabilities allow for agile operational planning and monitoring. Supply chain visibility enables actors to plan, track and monitor © SELIS, 2018 Page | 20

activity and take informed-decisions. As a complement to visibility, CAPA, proactive-event handling and deviation management provide the ability to maintain or surpass the targeted performance level. CAPA can both increase visibility and minimize the negative consequences of lack of visibility. In detail:
During transport planning, capacity planning, allocation of cargo to transport capacity, route planning, transport optimization etc., are highly dependent on timely, up-to-date, accurate information;
During transport execution, correct and timely information is crucial with regards to conditions of infrastructure, traffic, availability, in transit status and/or tracking and tracing of cargo (shipment and consignment levels), equipment or means of transport;
Monitoring (and re-planning) is highly dependent on visibility: detection and signalling of anomalies and deviations from plan, ability to foresee deviations (probability of occurrence, early detection), and ability to evaluate and select corrective actions (re-schedule, switch to another resource / asset / service), as well as tool for increasing predictability of events.
The main challenge related to visibility gaps is the monitoring and detection of relevant changes during the process flow. Furthermore, lack of visibility and foresight is a bottleneck to transport planning and monitoring, and often the cause of expensive and time-consuming corrective processes.
The strategic relevance of higher visibility is its multi-fold impact on operational efficiency, supply chain performance, and that it enables other innovative strategies like collaboration and risk sharing (EGLS2) and collaborative planning and synchromodality (EGLS1).
Impact on operational efficiency: visibility enables efficient planning and monitoring operations, avoiding time-consuming search for information, providing more reliable information to the correct recipients;
Impact on performance: visibility and CAPA strategies enable improved resilience, based on dynamic re-planning, event management, ability to foresee/anticipate unwelcome events.
Visibility as a challenge
Supply chain executives still rank visibility as their greatest management challenge. 70% of Supply Chain Leaders report visibility impacts their supply chains to a significant or very significant extent (IBM, 2010). Nevertheless, the progress of digitizing the supply chain and implementing visibility solutions has been slow so far. 33% of respondents of a survey conducted by Capgemini Consulting (2016) said they are “dissatisfied” with the current progress. Key technology enablers such as Supply Chain Visibility Platforms/Tools (94%), Big Data Analytics (90%), Simulation Tools (81%) and Cloud (80%), which are seen as the biggest technology enablers of Digital Supply Chain Transformation, have been identified, but are not widely used yet. In fact, 48% of respondents admit that right now “traditional” methods such as phone, fax, email are still the dominant ways to interact with supply chain partners, who are lacking the necessary awareness, or the required skills. In more digitized cases, more information is available, but according to IBM (2010) proportionally less is being effectively captured, managed, analysed and made available to people who need it. As a consequence, supply chain executives are flooded with more information than ever, but effective algorithms which are suitable to derive relevant information are lacking, and the majority of those who have tried to improve external visibility describe their efforts as largely ineffective, making external visibility projects the least effective of all the initiatives executives are undertaking (IBM, 2010).
© SELIS, 2018 Page | 21

With increasing global trade and growing emphasis on security, enhanced information sharing between actors in global supply chains is required. Currently, the data about cargo transport available in the supply chain does not even provide a timely and accurate description of the goods (Klievink et al., 2012).
Managing visibility
The benefit of supply chain visibility has been studied by several authors. Caridi et al. (2014) established a model for assessment of the benefits of visibility in complex supply chains, based on five main performance parameters that affected by visibility: cost, quality, service level, flexibility, and time. Although this paper focuses on visibility in the supply chain, the model described should be applicable for the transport and logistics domain as well.
Another quantitative model for Supply Chain Visibility is proposed by Lee & Rim (2016). The model uses 𝑍 score in Six Sigma methodology and serves to evaluate the visibility level of the overall supply chain. The proposed methodology can "facilitate assessing and comparing suppliers, customers, and competitors".
Achieving higher visibility:
"Although SC visibility is garnering an increasing amount of attention in the relevant literature, it still remains an underexplored facet of SCM" (Lee et al. 2014, referring to Kim et al., 2011).
One of the main challenges is that of collaboration and sharing. While it is recognised that close cooperation among supply chain partners can enhance the performance of an entire supply chain ( Lee et al. 2014), sharing information always implies a risk for the company and which is why “firms are cautious about releasing their internal information to others and therefore it is difficult to see a fully collaborative end-to-end SC in current practice (Bowersox, Closs, and Cooper, 2010)" (Lee et al., 2014: 292). Lee et al. (2014) studied interorganizational information sharing (IOS), concluding that IOS visibility leads to higher SC performance and that "firms should approach IOS visibility in a positive way to maximize the returns from IOS, while enforcing appropriate mechanisms to control a partner's potential opportunistic behaviour. SC partners can use two different types of control mechanisms to protect against opportunism. They include informal safeguards such as interorganizational trust and formal safeguards such as joint governance structures" (Lee et al. 2014: 292).
Risk Management
Risk management, both related to logistics/operations as well as safety/security aspects, is a continuous process that requires identifying and assessing threats and risk and initiating appropriate counter-measures in case a risk is considered relevant. It is time-constrained and characterised by the need for knowledge of logistics and supply chains and the management and integration of multiple information and intelligence flows (European Commission, 2013). According to Simchi-Levi (2013), companies with mature supply chain and risk management processes are more resilient to disruptions than those with immature processes, and companies with mature capabilities in supply chain management and risk management in general do better along operational and financial performance than immature companies. One reason for this is the fact that supply chain disruptions have a significant impact on company business and financial performance. To make full use of risk assessment methods, it is of course required to know ‘who is moving what, to whom, from where’. Data on the real parties behind the transaction and the movement of goods (buyer and seller or owner), and on the precise goods involved, is essential as is information on the routing of the goods throughout the supply chain (European Commission, 2013). The combination of supply chain visibility tools, big data analytics, and cloud provides a strong foundation for digital transformation of the supply chain, which 75% of
© SELIS, 2018 Page | 22

respondents of a survey conducted in Capgemini Consulting (2016) consider “important or very important”.
Research Questions
In relation to supply chain visibility, the following research questions need to be raised. (1) How to quantify the effect of lack of visibility for individual actors across the supply chain? (2) How to achieve higher visibility? (several methods can be provided here)
Business collaboration, Improved planning (strategic, tactical, operational), ICT for supply-chain, transport and logistics,
(3) Which strategies overcome the lack of visibility and how to better exploit higher visibility?
Corrective actions: Post handling of deviations; real-time re-planning of transport; Preventive actions: Anticipation of undesired events, deviation from plan.
(4) Which strategies support switching from corrective actions (passive) to preventive actions (active)?Supply chain visibility requires a level of information exchange between actors. As benefits need not be distributed in line with efforts required to arrive at visibility, incentives for information sharing may be required. Also, barriers to information sharing need to be overcome, such as organizational privacy concerns. A digital platform requires a business model that aligns its functionalities (information sharing and collaborative mechanisms) and business model characteristics, such as value propositions, customer relationships, key partners, etc. Analysis of available data and events can form the basis for decision support and decide what to do and can increase situational awareness.
(5) How to ensure a correct match between digital platform functionalities and corresponding
business models? How to combine visibility across organizational boundaries (owners /users of information)
and across systems (data integration versus system integration, data distribution, message exchange);
Visibility versus confidentiality (authentication, authorisation, secure communication); Incentives to information sharing (cost and profit sharing of data exchange); Semantic interoperability between related but different domains with different contexts
(conceptual data models versus domain specific data models).
Supply Chain Financing The current economic conditions, as shaped after the 2008 global financial crisis, along with the ensuing liquidity constraints and raised sensitivity toward risk in the financial markets, have created significant issues for companies trying to finance operations and efficiently manage their working capital (Ivashina and Scharfstein, 2010; Liberti and Sturgess, 2013). In this environment of relatively low liquidity, the cost of financing has increased and firms, especially SMEs and the ones operating in countries with macroeconomic problems, are finding it more difficult to obtain the credit they need. The scarcity of cheap external financing has driven many companies to look across their financial supply chain for opportunities to improve the management of working capital, optimize their cash flows, and unlock trapped cash.
© SELIS, 2018 Page | 23
A common practice followed by large corporations for improving their working capital has been the extension of payment terms with their suppliers (of goods or services) by several weeks or even months. There are several reports in trade journals of companies from several industries (such as P&G, Unilever, Diageo, AB InBev, Kellogg, GSK and many more) which have adopted such practices with their suppliers, unilaterally and often on short notice. However, when large corporations impose long payment terms with their suppliers (particularly SMEs), this comes at a cost for the latter, which, in an environment of low liquidity, see their capability to efficiently finance their operations seriously deteriorated. Eventually, this issue has been recognized by governments and regulatory bodies around the world and has led to the introduction of a number of initiatives for its resolution (“SupplierPay” in the US, “Prompt Payment Code” in the UK, “Betaal me nu” in the Netherlands, and Directive 2011/7/EU in the EU).
In this context, supply chain financing has emerged as a means, introduced by large corporations, for soothing suppliers’ financing availability, particularly as demand and hence, suppliers’ need for working capital starts to rise again. A well-designed supply chain financing program has the potential to help corporations optimize their working capital or reduce purchase costs, enable suppliers to be paid earlier than their invoice due date, and help supply chains meet their sustainability and risk management goals.
We outline some latest developments in supply chain financing along with alternative concepts which might become interesting research areas within SELIS and contribute to the SELIS business innovation agenda.
Role of technology platforms in supply chain financing
Reverse factoring has traditionally been run by banks on their own proprietary technology platforms. However, the traditional approach of involving a single financial intermediary (i.e., the local banking partner) has several implications on the efficiency of this financing instrument. First, large global corporations which have adopted reverse factoring end up with a great number of different reverse factoring platforms from different banks across their divisions and geographic locations. Consequently, they are faced with higher administrative costs, multiple platform fees and limitations in scaling up of their programs. From a supplier’s point of view, it can be very costly to manage a plethora of different programs, which reduces the overall level of take-up. Second, due to costly regulatory compliance processes, it is often not economical for banks to make reverse factoring available to SMEs which are more vulnerable to liquidity shortages. Hence, banks mainly target larger suppliers with considerable trading volumes with the buyers, which, however, may not be interested in taking advantage of the liquidity offered from such instruments. As a result, the traditional approach does not allow reverse factoring to realize its full potential and the available benefits fully reached.
Lately, the supply chain finance market is developing towards two directions. First, new technology platforms have been developed that are open and independent of the financing provider (some of the largest players in this market are PrimeRevenue, GT Nexus, and Orbian). The subsequent standardization introduces a degree of commonality across the different reverse factoring solutions and soothes the administrative, cost and scaling obstacles into onboarding the long tail of the supply base. Second, the new generation of technology platforms and legal structures allow the provision of funding from different sources, such as banks, institutions (i.e., pension funds), and/or the buyer itself. The resulting competition among the funding providers and its impact on the financial terms will increase the attractiveness of reverse factoring to suppliers and will facilitate higher adoption levels.
© SELIS, 2018 Page | 24
The latest development in supply chain financing is the introduction of multiple-solution technology platforms which support several instruments in parallel, such as reverse factoring and dynamic discounting. In the near future, it is expected that the latest developments in data security, such as blockchain, will further boost the adoption of open, cloud-based supply chain financing platforms by enhancing their reliability, security, scope and functionality.
In our view, these developments open up interesting opportunities for new business models, which are currently being explored within the SELIS LLs. In particular, the supply chain financing landscape provides incentives for supply chain partners to capture financial benefits through reducing the overall cost of financing. Still, a prerequisite for these gains to be realized is the smooth integration of the involved firms’ legacy management information systems with the existing supply chain financing technological platforms. Most likely, intermediate solution providers will be needed for undertaking this task. These intermediaries must possess sufficient IT expertise to facilitate the desired level of automation and interconnection between the different systems. Most importantly, they must have a thorough understanding of both supply chain management and finance to incorporate decision-support tools with the objective of working capital optimization.
The latest developments in technology platforms that are tailored towards bank-neutral supply chain financing solutions, offer new opportunities for the buyers to optimize their cash and working capital with a portfolio of tools. The buying firm’s preference over balance sheet gains (i.e., paying invoices at maturity) vs. income statement gains (i.e., taking advantage of discounts for early payment) depends on its current liquidity and is a dynamic decision. The new supply chain financing solutions understand the dynamic nature of working capital optimization and are focused on applications that combine the benefits from both dynamic discounting and reverse factoring. The basic idea is that a large buyer can extend its payment terms and provide seamless financing to their suppliers -at any time before invoice maturity- through third parties, while using its own cash for capturing discounts whenever this serves the firm’s financial goals with respect to the income statement.
Apart from the necessary integration with an on-line supply chain financing platform, the implementation of 2nd generation solutions not only requires a higher level of alignment among different function within the buying firm, but also the incorporation of sound decision-support capabilities. For example, to efficiently decide whether or not to use own liquidity for discounting a supplier’s invoice, the buying firm shall have an accurate view of current liquidity, but also a reliable forecast of anticipated cash outflows by compiling -in a timely and reliable manner- relevant information from different functions (i.e., procurement, commercial, etc.).
The higher alignment among different function within the buying organization, which is required for implementing 2nd generation solutions, opens up opportunities for connecting supply chain financing with supplier performance goals. For example, suppliers could be offered better financing terms for meeting operational targets (i.e., on-time delivery, service level, quality scores, etc.), innovation targets (depending on the industry this might be timely delivery of new components, innovation scores, etc.), or even social responsibility and environmental targets. With regard to the latter, Kapoor (2017) presents the cases of PUMA and LEVI’S, which have incentivized their suppliers to adopt environmentally-friendly and socially-responsible practices by offering better rates as part of their supply chain financing programs. According to Frank Waechter, senior head of treasury and insurance at PUMA, “The idea came after we had implemented new processes and IT technology in our sourcing landscape. We used the opportunity to introduce a new piece of software to connect everybody involved [suppliers and third-parties] with a single [supply chain financing technology] platform…” (Kapoor, 2017).
© SELIS, 2018 Page | 25
The above example describes perfectly SELIS’ vision for the development of the core supply chain financing strategy within a SELIS LL. Our goal is to enable the implementation of a 2nd generation supply chain financing solution by providing IT integration services and business intelligence capabilities. Yet, connecting the offered financial rates with suppliers’ performance is in our view a considerable challenge (unless the final solution involves only dynamic discounting, which, most likely, has been the case in PUMA). This issue is more manageable in the frame of another instrument, namely pre-shipment financing, which is also considered in EGLS4 and is described in the following section.
Pre-shipment (purchase order) financing
Our discussion so far has been focused on approved invoice-based (i.e., post order shipment) financing solutions. In other words, the approval of invoices from a trading transaction between the large buyer and a supplier serves as a mechanism for mitigating agency (information) costs in the financial supply chain; hence facilitate cheap financing to the latter. However, it is not uncommon for the suppliers to find their liquidity short in supporting their desired production plans. A new direction in supply chain financing is the development of funding solutions that take a more holistic view of the supply chain. Finance based on purchase orders rather than invoices is one emerging solution, while instruments that enable corporates to help their tier-1 suppliers procure necessary raw materials or components from tier-2 suppliers might be the next development.
In pre-shipment financing, risk becomes an important issue for the funding provider, as its exposure now goes beyond the large corporation’s creditworthiness to encompass the supplier’s credibility to deliver. At the same time, the risk exposure horizon can be much longer than the typical 60 to 120 days that is usually the case with post-shipment supply chain financing. Nevertheless, if the orientation of the corporate’s supply chain financing strategy is toward increasing the supply chain stability and facilitating suppliers’ growth and service level, then, this is the direction to take.
Pre-shipment financing is explored in the frame of a SELIS LL. The basic idea there is for the buyer to open a credit line that will be used for financing future purchase orders on demand. As the buyer can secure this credit line at very good terms (say, less than 1% annual interest rate), she could extend a purchase-order financing service to the suppliers in need and capture twofold benefits; namely, both operational (i.e., higher service levels) and financial (i.e., interest payments). There are two challenges which need to be addressed for implementing such type of pre-shipment financing. First, the buyer needs to calculate the supplier’s credit risk (which is idiosyncratic in nature) for determining the offered ceiling and interest rate. Second, pre-shipment financing is a great vehicle for incentivizing supplier’s effort toward performance goals (which can be operational and/or environmental). This is captured by linking offered terms with historical performance. For example, consider a particular supplier who requests financing for a purchase order with the value of €50,000. Then, if the supplier is in performance category A (with regard to pre-established KPI ranges), he can get financing of €30,000 at 1.5% annual interest rate. Obviously, the purchase order coverage (funding interest rates) will decrease (increase) as we move to categories B, and so on.
Opportunities for logistics service providers
As logistics service providers (LSP) form an important group within the SELIS ecosystem and research agenda, next, we discuss two concepts which might be relevant to that industry. Though these concepts are not considered in any of the SELIS LLs, we outline here the underlying ideas for the sake of the document’s completeness.
© SELIS, 2018 Page | 26
The first concept refers to a financial service that could be of interest to large LSPs with significant free cash flows. It is based on the fact that LSPs are supply chain actors with good (often real-time) visibility and reliable information on a wide spectrum of the end-to-end supply chain. Consequently, they may be able to calculate the risk in a trading transaction better than financial intermediaries (sometimes, better than the buyers themselves). By leveraging on this information advantage and on the close relationship with companies upstream a supply chain, LSPs could profitably use their free cash flow as supply chain financing providers. The potential to compete financial intermediaries on this service is even higher when suppliers are located in countries whose financial markets are not mature (i.e., most of the Asian manufacturing hubs). We refer the interested reader to the UPS Capital (https://upscapital.com/), the financial service offered by UPS which, among others, includes supply chain financing solutions for goods in-transit or in inventory.
This second concept refers to the use of hedging for mitigating the risk of adverse changes in the cost of key inputs to production or transportation of goods. In the operations management world, hedging is important when increases in key cost drivers in manufacturing (i.e., sugar price for a candy manufacturer) or transportation (i.e., fuel prices for LSPs) cannot be effectively passed along the buyers of products and services. There is an extensive literature on the mechanics of hedging using financial instruments such as futures and options. We refer the interested reader to Triantis (1999) for a comprehensive summary of this research.
Research Questions
The scope of supply chain financing can be quite large and depends on the type of solution and industry under consideration. Each solution or development has its own challenges and requires a different research approach. Here we outline the research questions that relate to the solutions currently under development within the SELIS LLs.
The current research questions can be organized into three aspects, divided in the following subsections.
Design of selected supply chain financing solutions
The first set of research questions are concerned with the technical specifications of the solutions under development (i.e., 2nd generation supply chain financing and pre-shipment financing). The most important research questions in this category are the following:
(1) How will the key parameter values for each solution be determined? More specifically, these parameters may include:
Reverse factoring: extended payment terms (if applicable), interest rates (if not open to bidding);
Dynamic discounting: discounting scheme (i.e., sliding scale of discounts), supplier-neutral or supplier-specific offering;
Pre-shipment financing: number of supplier categories, purchase order financing ceiling and interest rate per supplier category.
(2) How will the buyer’s liquidity threshold be determined for switching between offering reverse factoring and dynamic discounting to the supplier? How will the liquidity forecasting using real-time information (i.e., pending payments, purchase order log, etc.) take place?
© SELIS, 2018 Page | 27
(3) How will the suppliers’ scoring for qualifying for different purchase order financing conditions (terms) take place? More specifically, which should be the suppliers’ KPIs (i.e., quality, delivery, environmental, financial, etc.) and their weights in determining a supplier’s overall score and category placement?
Technical implementation of selected solutions
The second dimension of our research questions is concerned with technical implementation issues. In particular:
(1) What are the IT requirements for a reliable, secure and timely function of a supply chain financing platform?
This category seeks to provide answers to issues related to information protocols, connectivity with buyer’s information systems, interfaces between buyer-supplier systems, integration with funding platforms, etc. Our lack of expertise in this area would require the involvement of SELIS technology partners to address these questions and potentially identifying opportunities for innovation.
Institutionalization of selected solutions
The third dimension of our research questions is concerned with the institutionalization of the solutions under development. The most important research questions in this category are the following:
(1) Which are the basic considerations for a successful adoption of the supply chain financing platform by suppliers? What are the adoption barriers and how they can be overcome?
(2) Which departments within the buying organization shall be involved with onboarding suppliers and take ownership of supply chain financing?
(3) Which suppliers shall be invited first to participate in supply chain financing? What are the prioritization criteria for gradual onboarding? Are there any supplier categories that should not qualify for participation?
The study of these questions requires an applied research approach. There are several white papers which discuss the importance of involving several departments from the buying organization (e.g., procurement, finance, legal, IT) in disseminating supply chain financing, as well as establishing successful communication and trust with the supply base (see for example Hurtrez and Salvadori, 2010; Seifert and Seifert, 2011; Demica, 2013; Tyagi, 2013). This topic has also attracted some academic interest. A series of case study-based papers by Wuttke et al. (2013a and 2013b) study the adoption of supply chain financing by supply chain partners (2013a) and the suitability of different types of buyer-initiated financing instruments for specific supply chain configurations (2013b). In the second paper, the authors suggest that while working capital reduction is the main objective, other factors such as risk for supply chain disruption, buyer-supplier dependence level, and inter-firm integration may also be important. Finally, Wuttke et al. (2016) use an analytical modelling approach to explain observed patterns on buyers’ introduction and adoption decisions. Our work on supply chain financing within the SELIS LLs may provide new insights that could potentially supplement this literature.
© SELIS, 2018 Page | 28

Environmental Performance Management The magnitude of climate change requires developed countries to make changes to lifestyle choices, from the products they consume to where they spend their vacations, to the building in which they live and work. While GHG standards will play a vital role in transition, providing transparency and assurances are needed for product labelling, purchasing of carbon offset, regulating business emissions and certifying the GHG practitioners (ISO Central, 2012).
The environmental performance management requires GHG standards to provide reliable and comparable systems, so they can support:
Many types of mandatory and voluntary government programmes, Incorporation of regional as well as international trade agreements into legislation and
regulations; Incentives (production subsidies, tax and other business incentives) to support new industries
and technologies; Technology R&D funding.
A range of important business functions Carbon labelling of products and events for consumer and stakeholder communications avoiding
“greenwashing”. New financial products,
Practitioner’s competence and certifying quantification in auditing, reporting, labelling and communications.
The ISO 14000 standards for environmental management is firmly established as the global benchmark for good practice in this area and includes supporting tools, several standards to ensure good practice in environmental claims and communications. It provides guidance for environmental management systems (EMS).
Figure 2 Environmental ISO regarding LCA. (based on (Camarero,2011))
Figure 2 shows the ISO related with this White Paper, at the base of the pyramid are ISO from 14040-14044 which describe the principles and framework for life cycle assessment (LCA), from the definition of the goal and scope to the reporting phase as it is shown in Figure 3.
© SELIS, 2018 Page | 29
Figure 3 Four key stages of LCA (ISO 14040/14044) (based on (Shaofeng and Meili,2011))
The second row of the pyramid contains more specifically ISO for organizations to implement an auditable GHG inventory, verify and validate GHG projects and define the baseline scenarios for monitoring projects. Above are the ISO related to labels and declarations and finally, at the top are the ISO related to carbon footprint accounting, 14067 for products and 14069 for organizations, both are still under development.
Figure 3 shows all the phases and activities involved in a product life cycle. The first step to developing the LCA is determining the scope and this White Paper is delimited to the logistic and transport activities and more specifically to the “carbon footprint”. Carbon footprint is an internationally recognized indicator used to determine the production, reduction or compensations of GHG emissions associated to organizations, events, projects, reduction activities and product life cycle. The GHG emissions are expressed in mass-based CO2 equivalents (CO2e) and gather different gaseous substances for which the IPCC has defined a GWP to be converted to (CO2e). The main logistics services’ greenhouse gases are carbon dioxide (CO2), nitrous oxide (N2O) and methane (CH4).
Figure 4 Generic cycle of a production system for LCA (figure based on (Kehdall, 2012) )
As aforementioned, the ISO regarding carbon footprints are still under development and therefore other specifications are being used pending its availability, some of them are shown in Table 3.
Table 3 Standards and specifications (available and under development) regarding to the carbon footprint.
© SELIS, 2018 Page | 30
ORGANIZATION PRODUCT EVENT/ PROJECT
ISO 14064-1 (ref)
ISO 14069 (draft)
PAS 2060
GHG Protocol
ISO 14067 (draft)
PAS 2050
GHG Protocol
EN16258(Transport Services)
ISO 14064 –1
ISO 14069 (draft)
GHG Protocol EVENTS
These specifications are different depending on the region and means of transport, which hinders the total carbon footprint accounting, hence a simplified system to perform the accounting harmonizing all the existing methodologies and facilitating information sharing is required.
Carbon footprint accounting
A freight movement begins with the handover of the consignment centre to the party transporting the shipment and ends with the handover of the shipment to the consignee, where the number of existing methods hinders the total carbon footprint accounting. Therefore, the examples shown here are focused on the collaborative carbon footprint accounting, how to collect data to perform the accounting and the possibilities the results can offer.
Figure 5 Three sample transport chain maps, including all transport elements and transhipment centres encountered throughout the journey (Smart Freight Centre, 2016)
Example 1: Collaborative carbon footprint accounting
The figure below shows a further explanation of the aforementioned problem focusing on the first sequence above.
Shipment 1 is transported on a truck to a rail terminal (first leg), where it is unloaded and repacked in one of the many containers that are loaded onto a rail vehicle for the next part of the transport (second leg). At the destination station, it is unloaded and stored on site before it is loaded onto a truck for its final delivery (third leg). The three legs constitute part of the corresponding product LCA, and therefore, carbon footprint accounting should be the result of the energy consumed for executing all the activities involved. The table below gathers only some of the primary methodologies currently applied by each means of transport and identified the best starting point of GLEC framework (Smart Freight Centre, 2016), each with its own features which can differ from others and hinder the total carbon footprint accounting.
© SELIS, 2018 Page | 31

Figure 6 A product logistic and transport processes within their primary methodologies
Due to this problem, an easy and user-friendly way to integrate data from the different actors is required, allowing vessels and vehicles to perform the data collection on real time and on an automatic manner.
Example 2: Data collection and reporting carbon footprint accounting
Real time monitoring Reporting (total and itemized list) Tariff barriers (out of the scope of this strategy)
o France Ecolabelling proposal in 2011, active in 2012o Markey Waxman law in USA
One of the main issues of good’s competitiveness in world markets is taking the LCA carbon footprint accounting and reporting to assign environmental taxes and a mechanism to establish worldwide accuracy targets to mitigate and reduce the emissions impact.
Customer awareness
Several surveys show customer preferences demonstrating that the choice between two identical products with the only difference of incorporating Green environmental information, favouring products reporting this information.
o France 2009 surveyo New York Times reporto Carbon Trust (UK survey)o Laydverd.com German (55% even would pay higher prices)
Therefore, firms are taking conscious decision regarding the importance of reporting to improve their brand image (marketing tool).
Firms will have to provide the information for all products along their supply chain with a high compromise to reduce the environmental impacts if necessary.
The reporting information or ecolabel will contain the environmental impacts produced by a single product along all its “life cycle or life cycle assessment (LCA)”, where the logistic and transport systems play an important role.
Example 3: KPI for Carbon footprint accounting
© SELIS, 2018 Page | 32

Benchmarking: In order to assess the carbon footprint accounting a baseline, providing a benchmark that will allow to evaluate the performance of some greener actions is required.
Decision Support System (DSS) Simulation tool
The carbon footprint could be established as a key performance indicator to measure results and implement changes to improve the environmental performance in storage and logistic processes design.
The improvement could be applied on the inventory and ship order processes and the optimization of warehouse movements in both forklifts and transport equipment. The increasing logistic services and company’s competition finds out cooperation among LSP’s and shippers, through storage or transport sharing. This KPI could be use by a DSS or simulation tool to assess the trade-off between sustainability and efficiency for:
Buying/building resources together (warehouses, greener fleet) Sharing existing resources
Research Questions
Impact of level of collaboration on developing LCA (carbon footprint accounting)
LCA is divided in several stages and processes. One of the most important processes that are present in all the stages along the entire life cycle of products are the logistics and transport services. Until the availability of ISO14067, GLEC Framework has harmonized the methodologies for accounting the carbon footprint along all combination of means of transport, independent of its complexity, considering each stage as an individual and allowing the aggregation of these isolated parts to the total account. Through this framework, a common methodology allowing the actors involved in the transport services to cooperate for getting an accurate, reliable and comparable carbon footprint is established. At this point the level of collaboration takes an important role. It is obvious that performing the total accounting is required at least to collaborate at the information level to share the information flows (input/ collected data, output/reported data), although what and how information is to be collected is established in GLEC Framework, the collaboration at the information level raises the following questions:
(1) What is the impact of the level of collaboration (in information flows) on the accuracy, comparability and reliability of data collection and reporting processes for performing the GHG emissions accounting?
(2) Could any business sensitive information be a barrier to collect this information?
The carbon footprint is a key performance indicator. Currently worldwide environmental awareness about environmental sustainability makes firms consider and integrate this KPI in their strategical, tactical and operational plans. Taking the advantages of a common carbon footprint accounting methodology (GLEC Framework) and new ICT capabilities is possible in order to develop new platforms and simulation tools based on operational and organizational collaboration levels such as cooperation among LSP’s and shippers, through storage or transport sharing. The questions at this level relate to “resource sharing” in the context of organizational collaboration:
(1) How do organizations split GHG emissions (taxes, revenues, grants) produced by any activity involving a physical shared resource?
(2) In the trade-off between “sustainability” and efficiency, what is the prize of sustainability for performing greener processes/activities?
© SELIS, 2018 Page | 33

Reporting carbon footprint is being used as a marketing tool where many businesses see benefits in using it, besides in the coming future will be used as a tariff barrier in some countries, hence the questions related to the organizational level of collaboration.
(1) How does achieving collaborative sustainability goals impact brand image?(2) How must tariff barriers be applied on collaborative systems?
Impact of collaborative agreements on LCA (carbon footprint accounting)
In manufacturing processes where the same methodology can be applied for the carbon footprint accounting of all activities performed (belong to the same country and use the emissions factor to convert the energy consumption in CO2e), the impact of organizational collaboration for achieving sustainability goals and the resulting trade-offs between environmental performance and efficiency indicators have been widely demonstrated and examined by previous research. However, this research is scarcer in logistics and transport systems. This can be due to the level of cooperation in carbon footprint accounting is hindered by a higher combination of means of transport (each one with its own methodology for the emissions accounting) belonging likely to different regions (probably with its own methodology). Drilling down the literature about environmental manufacturing collaboration which captures the notion of joint planning and solution finding between organizations (Vachon and Klassen, 2008), the following questions could be brought up regarding buying/building new operational resources or sharing existing ones:
(1) What is the impact of the various collaborative agreements among logistics and transport stakeholders for sharing operational resources on sustainability?
Regarding the GHG emissions accounting on collaborative logistics and transport systems where a wide range of stakeholders could participate and beyond the informational and operational collaboration levels required, an organizational collaboration level could be established in order to address the following questions:
(2) What agreements would be required in case of facing business sensitive information?(3) What agreements would be required to distribute GHG emissions (taxes, revenues, grants)?(4) What agreements would be required regarding tariff barriers?
Other overall questions that can apply here are the following:(5) What is the price of anarchy?(6) Which collaborative agreements add the most value?(7) What operational issues require incentive alignments from the collaborative agreements?
Supply Chain OptimizationSupply Chain Optimization can be a very broad concept if considering all potential applications of optimization techniques in a supply chain. The term of optimization relates to mathematical techniques to maximize or minimize an objective function (e.g. it could be the cost of a process in a supply chain), given a certain set of constraints. At the same time, a supply chain is made of several business entities (e.g., suppliers, manufacturers, distributors, retailers) working together by acquiring raw materials, converting them into components or final products, and delivering to end consumers (Beamon, 1998). These tasks will require several operations and processes to take place in an optimal manner, i.e. planning, sourcing, making, delivering and returning (considering return flows) (Huan, Sheoran and
© SELIS, 2018 Page | 34

Wang, 2004). For example, optimization in a supply chain could be related to techniques and tools used by decision makers to reduce costs or improve processes related to (Beamon, 1988):
Sourcing or procuring. In this set of problems analysts decide what could be the best/optimal combination of suppliers for providing raw materials or refurnishing an assembly. Game theory appears in this area as a tool for modelling the buyer-supplier relationship and determine optimal ordering quantities and inventory levels at equilibrium (Esmaeili, Aryanezhad and Zeephongsekul, 2009).
Planning inventories. There are plenty of models, based on optimization techniques, which have been developed to determine economic order quantities (EOQs), ordering policies, safety stocks, inventory levels, reorder levels, production lot sizes, lead times, multi-echelon stocks, etc.
Production by best allocating machines and personnel in factories. Several linear programming, non-linear, MILP models as well as heuristic algorithms have been developed by researchers in order to optimize production scheduling and allocation of operations. In this area we can also find models related to determining storage and manufacturing capacity needed along a supply chain for matching supply and demand.
Transport/logistics activities. Companies periodically benchmark providers’ costs and performance. For that reason, they need to redesign their distribution networks accordingly. Network design algorithms become relevant in this specific area. Also, in this case typical techniques used range from heuristics, to LP, non-LP, MILP, stochastic programming, and simulation.
Scheduling of drivers, and vessels to be assigned to several routes. In this category the well-known models related to vehicle routing problem, crew/fleet scheduling and service network design are some of the most prominent methods used.
Running after-market services. Typical models applied within this area concern the monitoring of spare parts inventories and synchronization and/or optimization of inventory levels accordingly (Cohen, and Lee, 1990).
Hence, by combining the two definitions, a general definition of supply chain optimization can be the following:
“Supply chain optimization is a set of methodologies and tools for supporting managerial decisions –strategic, tactical, or operational – in the end-to-end supply chain, which would lead to improved performance (e.g. economic, environmental, risks etc.) in the supply chain”.
It is well known that most competitive supply chains in the market are those that manage to provide the best service at the lowest cost. Research has demonstrated that factors like operations excellence, revenue growth and cutting costs can be fully improved by using some of the several existing optimization models (Rai, Patnayakuni and Seth, 2006). In particular, typical performance impacts can be seen in overall improved customers’ satisfaction, more effective risk-management, and profit maximization (Beamon, 1998). Other more specific potential impacts depend on the specific supply chain area of application of the optimization models, and could cover for instance performance metrics like utilization rates, customer response time minimization, fill rate maximization etc. (Beamon, 1998).
Despite the wide range of problems under the optimization definition, EGLS6 is focused only on the inventory management system in a supplier-retailer environment, with the goal to facilitate responsiveness to demand fluctuations, by improving demand forecasts, and collaborating on promotion event planning. These goals require the development of information-sharing mechanisms that can foster further collaboration between suppliers and retailers. © SELIS, 2018 Page | 35

Retailers and suppliers should collaborate in order to better respond to consumer demand fluctuations, obtain better demand forecasts, and optimize promotion event planning. By coordinating their actions regarding system’s inventory, they will be able to minimize the operational costs of ordering and holding inventory, and their transportation costs, while achieving better service levels (e.g., reduce back-orders and lost sales).
Regarding SELIS project targets, supply chain optimization can include two areas of research: transportation optimization and inventory management optimization. Transportation optimization is discussed within EGLS1 and EGLS2; hence, this section considers only the latter. EGLS6 will be applicable in LLs where event scheduling and inventory optimization are required.
Research Questions
Since, collaboration and information sharing seem ingrained in many of SELIS dimensions; we are going to integrate these concepts with the inventory management optimization in EGLS6. Here we have listed the research questions related to EGLS6.
The first research question discusses the impact of supplier and retailer collaboration on inventory management performance.
(1) What is the impact of collaboration in managing supply chain inventory, including demand forecasting and promotions planning, on inventory management costs and reliability of service?
When we talk about the collaboration in this concept, it’s pivotal to clarify what kind of information would be necessary for supporting inventory management activities. Question 2 and 3 relate to information flow issues.
(2) What type of upstream information (comes from manufacturer side) would effectively impact promotion planning, demand forecasting and order replenishment planning?
(3) What type of downstream information (comes from retailer side) would effectively impact of promotion planning, demand forecasting and order replenishment planning?
The next research question is about defining appropriate KPIs in order to measure the performance of inventory management regarding information-sharing.
(4) Which KPIs should be defined to evaluate the performance of promotional planning, accuracy of demand and order replenishment forecast regarding the level of collaboration.
E-compliance and CustomsSupply chain visibility may serve supply chain actors to synchronize and coordinate their planning and execution. However, in addition, supply chain visibility may also serve better coordination between supply chain actors and authorities such as customs, i.e. for the supply chain to demonstrate compliance and for authorities to facilitate trade more effectively while maintaining a required level of security.
EGLS7 is defined as a strategic capability using supply chain visibility to reliably report performance of cross-border supply chains in compliance with customs regulations. It will do so by establishing supply chain visibility through three interlaced data pipelines; commercial, logistics, and regulatory.
For example, given security threats around the world and government initiatives to combat these, there is a need for governments, and indeed operators as well, to have the information concerning their trans-border movement of merchandise well in advance of its arrival. In a traditional supply chain transaction, © SELIS, 2018 Page | 36

the detailed import declaration is filed to customs when the operator acknowledges the arrival of their goods and wants to clear them for import or some other customs procedure. This is traditionally when customs get the complete set of data concerning the merchandise. Over the past decade, pre-arrival security declarations have been put in place. But very often these are provided by the main carrier who does not necessarily know the details of the merchandise; the main carrier only knows the information which is provided to them from the other parties in the Supply Chain.
So, how to get the right information at the right time? This has been explored in the EU projects Cassandra and CORE through data pipelines. These projects rely on a ‘data pipeline provider’ who centralizes the information. This obliges everyone in the supply chain to utilize the same software provider, each eventually with their own standards for the capture of this data. A single operator will therefore potentially need to manage multiple interfaces.
Furthermore, the data pipeline principle foresees that the information is constructed progressively as the merchandise moves along the Supply Chain. Within all movements of merchandise, there are two principle points of view: a shipment (or commercial) point of view and a consignment (or logistics) point of view. The relationship between these points of view is multiple to multiple. In other words, one single commercial order can be broken up into multiple logistical transport movements. And within one single logistical transport movement, there can be multiple commercial orders grouped together (in the same container, on the same bill of loading, etc.). In order to construct information progressively and to allow these multiple to multiple relationships between a shipment and consignment point of view, it is necessary to create two different data pipelines, each with their respective point of view.
There is a third point of view which must be considered, the regulatory point of view. This is not based upon a construction of the information over time, but rather a snapshot of the information at a given point of time. Customs usually does not see the complexity of building a structure for this multiple to multiple relationships between commercial transaction and logistics transaction; what they see is the information prior to departure, or the information at arrival. So, a third data pipeline based on this regulatory point of view (a snapshot at any given time) would also be useful. This third data pipeline would not construct the information but rather convey the information at a given time.
The strategy for e-compliance and customs will therefore consider three interlaced data pipelines:
The regulatory data pipeline provides the transmission of data to agencies for declarative and clearance purposes. Regulatory in this sense means any information which is transmitted to a government agency;
The logistics data pipeline enables the construction of logistics information over time and determines how this is organized in order to transmit it between partners and also to transmit it to government agencies. Logistics in this sense refers to all activity and information which is related to the logistics movement of merchandise.
The commercial data pipeline has similar elements as the logistics data pipeline but takes a commercial point of view. Commercial in this sense refers to all activity and information which is related to the commercial transaction.
In short, there are two parallel data pipelines, one to manage a commercial vision of the transactions and a second to manage a logistics vision of the transactions. The third (regulatory) data pipeline which we are calling ‘regulatory’ is technically two things: first a snapshot of the transactions relating the commercial and logistics views at any given moment for the regulatory clearances and second, it is a mapping to customs data standards.
The combination of these three data pipelines could potentially provide similar, if not the same, benefits as planned within a national single window. The recent ratification of the World Trade Organization’s © SELIS, 2018 Page | 37
Trade Facilitation Agreement (WTO TFA) puts an obligation on all member countries (including all of those from the European Union) to make best efforts to implement a single window system. The base definition of a single window is found in UNECE Recommendation 33 which outlines five key points:
The commercial trader is the central figure in single window implementation; There should be a single-entry point of data; The single window should handle all trade, transport and transit regulatory procedures; All transactions should be dematerialized; and Information should only be submitted once to the single window system.
The combination of the three pipelines would potentially respond to all five of these criteria.
The data pipeline vision as proposed by (Klievink et al., 2012) motivates supply chain visibility of commercial transactions and logistics transactions as the enabler of believable declarations, which are required to be truthful snapshots of the supply chain processes at hand. This brings forward the challenge of constructing high quality (complete, accurate, timely, etc.) data that properly reflects the commercial and logistics processes and that supports analysis of the declarations by customs authorities. As soon as such analysis has been done on the commercial and logistics data pipeline in an integrated way, customs authorities should be able to identify risks in such a manner that false positives and false negatives are minimized. This leads to the following problem statements:
Table 4 EGLS7 problem definition (from LL7).
Problem Statement Obj. Objective Description
How to get better quality data in the Supply Chain at the right time
1 Capturing data at the source with a virtual data pipeline
How to allow multiple platforms to exchange information captured at the source
2 Connectivity between B2B platforms each exchanging information in a virtual data pipeline structure
How to streamline the operations at entry borders
3 Identification of high-risk consignments, secure trade lanes and high-risk operators
These problem formulations are quite generic, so they could be considered at EGLS level.
Research Questions
Here, research questions that are aligned with some of the conceptual developments in LL7 are formulated.
© SELIS, 2018 Page | 38

(1) What are design principles and base standards for the logistics data pipeline, commercial data pipeline, and regulatory data pipeline, in accordance with the customs standards?
(2) How should one map supply chain processes to the logistics data pipeline and commercial data pipeline in a consistent way?
(3) How should one map (snapshots of) the logistics data pipeline and commercial data pipeline to the regulatory data pipeline and customs data standards?
(4) What is the impact of the level of collaboration and information exchange in the supply chain, and the level of supply chain visibility, on the quality of identification of high-risk consignments, secure trade lanes and high-risk operators?
© SELIS, 2018 Page | 39
3 State-of-the-Art
Synchromodal TransportThe concept of synchromodal transport emerged in 2010 in an advice to the Dutch government by the Strategic Platform Logistics. The report states that Synchromodality brings considerable logistics improvements (Strategisch Platform Logistiek 2010).
The present literature on synchromodal transport is at an early stage, mainly based on local (Dutch) studies, in the context of port-related container distribution. A few definitions co-exist. We summarize four commonly used definitions from earlier papers:
(Tavasszy, , Van der Lugt,., Janssen, and Hagdom - Van der Meijden, 2010): Synchromodality is the synchronization of transport demand across the multi-modal transport system. Shippers make use of different modes of transport, in function of the transport demand, and switch between modes is possible;
(TNO, 2011): The coordination of logistics chains, transport chains and infrastructure, in such a way that, given aggregated transport demand, the right mode is used at any point in time;
(Gorris, , Groen, Hofman, , Janssen,, Meijeren and. Van, Oonk, 2011): Synchromodality occurs when the supply of services from different transport modes is integrated to a coherent transport product, which meets the shippers’ transport demand at any moment in terms of price, due time, reliability and/or sustainability. This coordination involves both the planning of services, the performance of services, and the information about services;
(Behdani et al., 2014): Synchromodality is an integrated view of planning which uses different transport modes to provide flexible transport services (Figure 7). However, the horizontal integration of the modes is the key distinctive feature of synchromodal transport (Figure 7).
Figure 7 Integrated view of freight transport planning (Behdani et al. 2014).
© SELIS, 2018 Page | 40
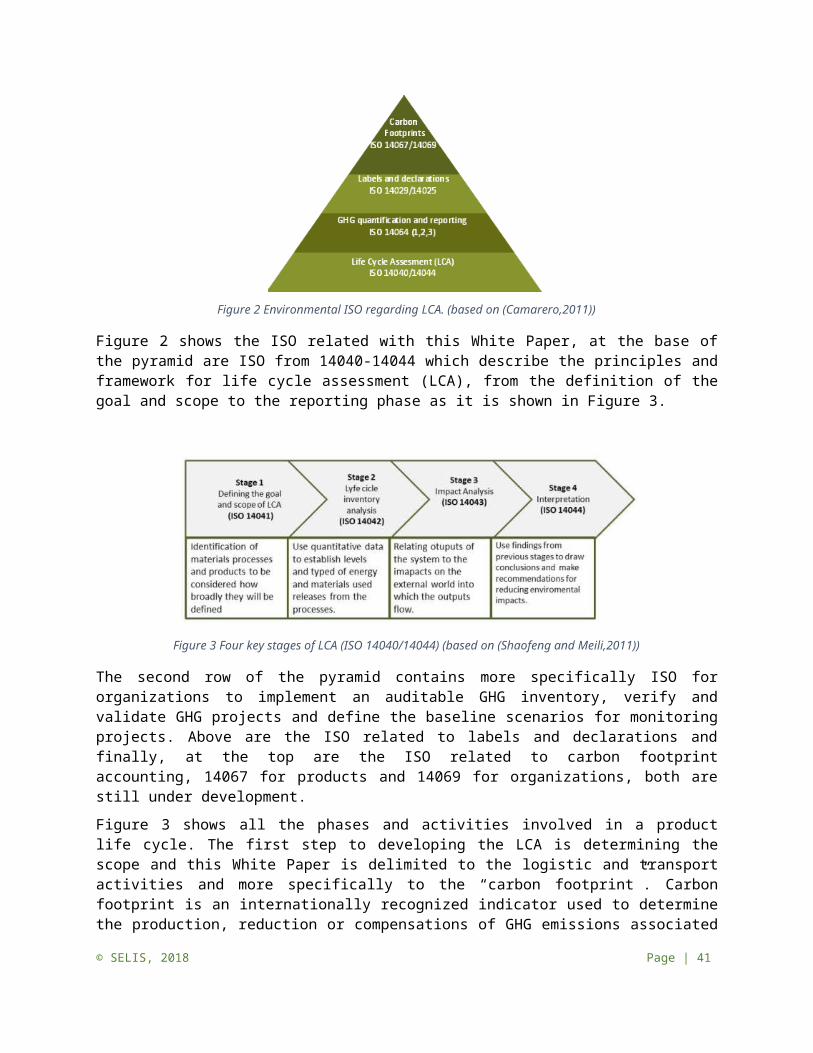
Figure 8 Dual integration in a Synchromodal Freight Transport System (Behdani et al. 2014).
For a systematic literature review on the topic of synchromodal transport we refer to (Singh, Van Sinderen, and Wieringa, 2016) and (Reis, 2015). Although different definitions exist and the need for a good definition of synchromodal transport is stressed by (Reis 2015), the purpose of this literature review is not to come up with a new definition, but to give a description of the four characteristics, concepts and/or enablers related to the concept of synchromodality that will support our research. Below, we will discuss (1) its dynamic character, (2) collaboration between stakeholders as a condition, (3) performance measures of synchromodal networks, and (4) information sharing and supply chain visibility as a condition.
Collaboration of stakeholders as key prerequisite
Collaboration is a prerequisite for enabling synchromodal transport. The study of Pfoser et al. showed that collaboration is categorized as key enabler for a synchromodal transport chain (Pfoser, Treiblmaier, and Schauer, 2016). Tavasszy et al. (2015) stress that coordination can be even more challenging for a “synchromodal” system in which the operation of different chains must be synchronized simultaneously (Tavasszy, Behdani, and Konings, 2015). Failure to coordinate may cause logistical problems and hinder the value of synchromodality. Nevertheless, cooperation between stakeholders in supply chains does not always develop spontaneously. With the focus on port-related transport, Van der Horst & De Langen 2015) state that coordination is hindered due to several reasons like imbalance between the costs and benefits of coordination, a lack of willingness to invest, and the strategic considerations of the actors involved. These reasons, together with information asymmetry, lead to poor performance in the whole chain (Cachon et al. 2001), and other coordination problems (Van Der Horst and de Langen 2015).
The literature comes up with several research streams to improve the level of collaboration. We will discuss three streams that are relevant to EGLS1. First, Macharis et al. ( 2010) state that a comprehensive analysis of relevant stakeholders is necessary to identify the different interests in the whole transport network. Second, Van der Horst & De Langen ( 2015) argue that either one of the following coordination mechanisms in hinterland transport need to be put in place: incentive alignment, alliance, or vertical integration. Ypsilantis et al. ( 2016) developed a mathematical model for Port-Hinterland intermodal barge network design. Their results show that cooperation between dry-ports could significantly reduce the costs and increase the service quality. These contributions fit in a wider range of research that seeks mechanisms to improve the efficiency of “intermodal” transport chains. Intermodal transport is defined as “unitized freight transport by at least two transport modes” (Saeedi et al. 2017). For example, Veenstra et al. (2012) investigate transport network integration by extending the deep sea terminal gate to the gate of the hinterland terminal. They argue that these extended gates © SELIS, 2018 Page | 41

relieve congestion both at the deep-sea terminals and in the transport corridors (Veenstra, Zuidwijk, and van Asperen, 2012). Woxenius ( 2007) suggests a generic framework for flow consolidation and routing principles in a transport network. Saeedi et al. ( 2017) explain different range of business consolidation strategies in intermodal freight transport, from vertical to horizontal integration, and from light to heavy consolidation. They also explain how these strategies could change the market structure and reduce competition. Anti-trust authorities consider reduction of competition harmful to customer interests and may therefore block integration. Third, there is a recent research stream, including the contributions Tavasszy et al. 2015), and Behdani et al. ( 2014), that stresses the issue of contract design in synchromodal transport. New contractual agreements that enable collaboration and the exchange of information between parties need to be developed.
The most common type of collaboration in urban freight transport is subcontracting of the last mile operations. Indeed, many parcel operators subcontract their delivery operations in highly congested areas. For example, while DHL only subcontracts 10 percent of its activities in small towns, it outsources most of them in Paris (Ducret and Delaître 2013). Another type of horizontal collaboration is the convened horizontal collaboration (Köhler and Groke, 2003; Thompson and Taniguchi, 2001). In this collaboration model, the shippers or the carriers participating in the collaboration are the initiators and the owners of the collaboration and keep control over the scheme. For example, a neutral freight carrier collects goods from five freight carriers and delivers them to shops in the inner city. Cruijssen et al. ( 2005) developed a model that has been referred to as the insinking model. In this type of scheme, a logistics service provider is the initiator and the owner of a collaborative network. This type of approach can be met in practice, especially among specialist last mile operators that are focusing on specific delivery areas and that tender among multiple clients in order to reach sufficient volume. An example of such a case can be seen in Brussels, where a green logistics provider SUMY consolidates flows from several shippers. The logistics service provider collects part of the goods among the shippers and delivers the remainder at their consolidation platform. Quak and Tavasszy ( 2011) investigate the potential savings for carriers linked to the use of the network of urban consolidation centres in the Netherlands through vehicle routing, based on real delivery data for two large carriers. Roca-Riu and Estrada ( 2012) use continuous approximation methodologies in order to compare two distribution strategies for a series of carriers having equal market shares: independent delivery by each carrier, or the use of an urban consolidation center. Crainic et al. (2009) focus on the analysis of collaborative urban freight transportation networks involving a two-tiered distribution structure (Crainic, Ricciardi, and Storchi, 2009), whereas Crainic et al. Crainic (2004) develop a model for a distribution system based on satellite platforms (Crainic, Ricciardi, and Storchi 2004). Gonzalez-Feliu (2011) combine a demand generation model with a route optimization algorithm to simulate the resulting routes of individual or collaborative distribution schemes.
Performance measures of a synchromodal transport network
Different stakeholders in the synchromodal chain benefit from synchromodality. For the design and the performance measurement of synchromodal supply chains, multiple performance measures must be identified (Behdani et al. 2014). The definition of synchromodality from TNO (2011) articulates this: “Synchromodal Transport is [...] deployed in such a way that: (1) the shipper is offered the transport service that suits its competitive strategy; (2) a profitable exploitation is possible for the terminal operator, (3) the infrastructure and available space are used to the full, and (4) the (whole) chain performance in terms of sustainability is optimized. Reliability, (cost) efficiency and sustainability (emissions) are important performance measures, not only from the perspective of individual stakeholders, but especially from a transport network or system perspective. The interests from different individual stakeholders in the sustainability of the supply chain is not obvious. In the © SELIS, 2018 Page | 42
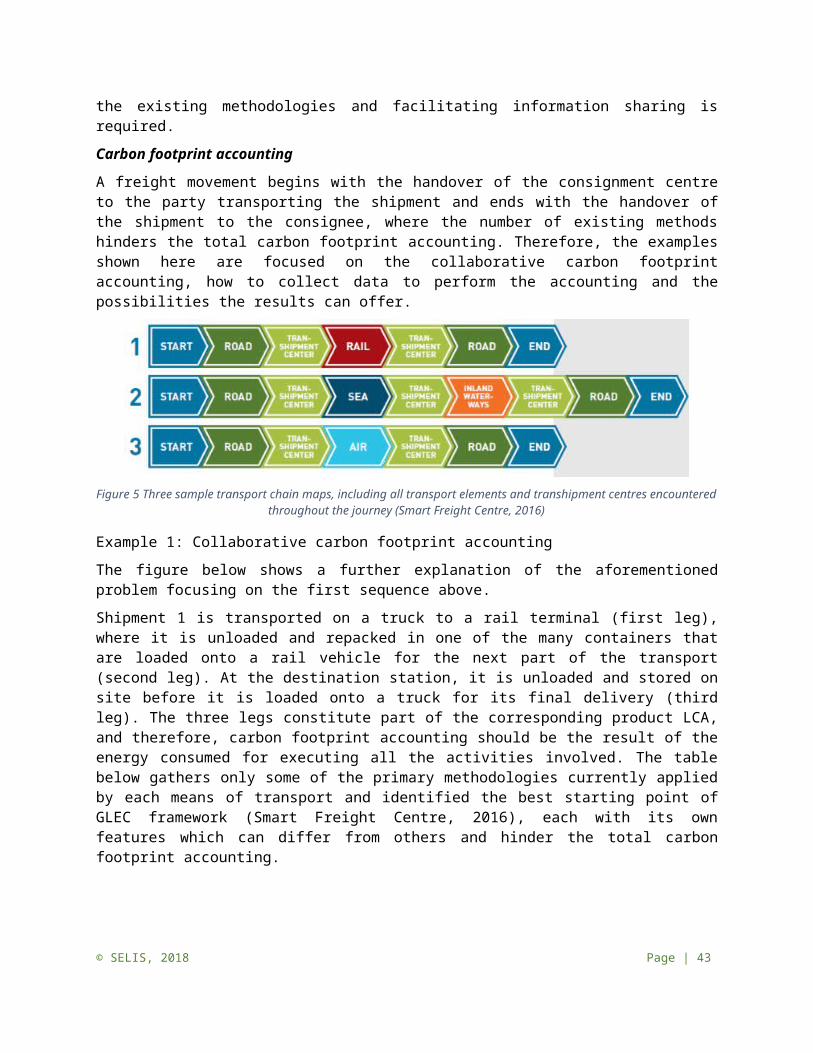
assessment of the intermodal value proposition offered by shipping lines, Van den Berg and De Langen ( 2015) conclude that both shippers and forwarders still have a rather limited interest in sustainability. Forwarders attribute the lowest importance to sustainable operations. In the explorative study of Eng-Larsson and Kohn 2012), the shippers’ perspective on modal shift for a greener logistics is analysed. They notice how emission reduction is taken as collateral benefit of modal shift, rather than a target on its own. However, as stressed by Pfoser et al. (2016), it is important that stakeholders undergo a mental shift, i.e., develop an open eye for the benefits of synchromodality. In their study on Critical Success Factors, mental shift is the second most mentioned factor.
From a system perspective, Zhang and Pel ( 2016) developed a model that considers the dynamics in demand and supply, and enables strategic decision-making based on the system performance evaluation from governmental perspective. The model uses (1) total system costs, total system time expense, and capacity occupancies of service lines as economic indicators, (2) network flow concentration, and road traffic as societal indicators, and (3) carbon dioxide emissions as environmental indicator. Applying the model to the hinterland of the port of Rotterdam, they found that from an economic perspective, the synchromodal system has very limited benefits compared to the intermodal system. The synchromodal system could impose higher risks due to additional transhipments, and higher coordination costs among different modalities. Because of the shorter waiting time, the synchromodal system featured shorter delivery times. Moreover, the synchromodal system yielded an overall reduction in CO2 emissions.
The dynamic character of synchromodal transport
As proposed by the Dutch Institute for Advanced Logistics (Dinalog) (discussed in Zhang and Pel 2016)), synchromodal transport entails that a shipper agrees with a service operator on the delivery of products at specified basic requirements, such as costs, quality, and sustainability. The service operator has the freedom to decide on how to deliver according to these specifications. He can optimize transport processes and utilize available resources in an efficient and sustainable way. An important aspect on the supply side of synchromodal transport services is that the choice for the transport mode is made along with the provision of the transport service, based on real-time information on the current conditions of the transport system (e.g. delays, congestion, reliability, transit times, pricing, availability of transport, infrastructure and terminal and warehouse capacities). According to Tavasszy et al. 2015), synchromodality can be briefly summarized as a network of well-synchronized and interconnected transport modes (supply side), which together cater for the aggregate transport demand (shipper perspective), and can dynamically adapt to the individual and instantaneous needs of network users. The issue of adaptation and dynamic planning is also pointed out by Pfoser et al. 2016). They state that sophisticated dynamic planning, simulation of transport routes and transport patterns are essential Critical Success Factors to create a functioning synchromodal transport network.
In the literature on freight transport, three planning levels are usually identified: strategic, tactical and operational (Crainic and Laporte, 1997). With the main difference being the time horizon considered and the inherent change of perspective on the planning. We consider the operational planning, i.e., the day-to-day planning of transportation. From the literature, important operational planning characteristics emerge like the adaptive mode choice, flexible planning, and real-time response or switching in case of disturbances and disruptions. In the works of (B. Van Riessen, 2013; B Riessen et al., 2015; Bart van Riessen et al. 2015; Bart van Riessen, Negenborn, and Dekker, 2016), two aspects of operational planning are required to enable synchromodal transport. First, the real-time dimension of intermodal transport. Van Riessen et al. ( 2013) consider the combination of intermodal planning with real-time switching. Real-time switching refers to changing the container route over the network in real-time to cope with transportation disturbances, such as service delays or cancellations. Second, there is a need
© SELIS, 2018 Page | 43

for an integrated transport planning using self-operated and subcontracted services. Their work takes the perspective of a central planner.
SteadieSeifi et al. ( 2014) mention that synchromodal transport is the next step after intermodal and co-modal transportation. With adopting the operational planning characteristics like adaptive mode choice, flexible planning, and real-time response, it can be argued this is true. The same position is taken by Haller et al. ( 2015). They state that synchromodality fits in the evolution of inter- and co-modal transport concepts, where stakeholders in the transport chain actively interact within a collaborative network to flexibly plan transport processes and to be able to switch in real-time between transport modes tailored to available resources.
Information sharing and supply chain visibility
The dynamic character of synchromodal transport decisions requires the continuous monitoring of planning and execution in real-time. As noted by Behdani et al. ( 2014), unexpected events like the late arrival of trucks, trains, or the late release of containers frequently occur during operations. According to the authors, these unforeseen events are incorporated in synchromodal network planning. Adjustments in real-time planning require insights in the availability of transport, terminal and infrastructure capacity. This calls for information sharing with the transport, terminal, and infrastructure related stakeholders. Providing high quality and standardized data as well as sharing and mutually exchanging information are seen as key enablers of synchromodal transport.
Data pipelines combining information from different stakeholders have to be available in such a way that all stakeholders within the transport chain are able to properly use them. Furthermore, it is essential to implement ITS and ICT systems in order to dynamically provide data and to be able to optimize transport planning. Long-term and automated planning need to consider the crucial role which data and information play in a synchromodal supply chain. Additionally, issues dealing with data security and data protection must be solved (Pfoser, Treiblmaier and Schauer, 2016).
Previous projects
There are some other European projects which, to some extent, concern about the synchronization of the logistic activities in a collaborative manner. In this section we shortly explain their main purpose. We follow the same structure as in the review of the academic literature.
Collaboration of stakeholders as key prerequisite
There are projects in which the collaboration between stakeholders is highlighted. For example, the SMART-RAIL project is developing business and governance models that will enable collaboration with different stakeholders in the supply chain. The ULTIMATE project explores the new ideas for cooperation between different multi-modal operators by developing the extended gate concept for use in the hinterland. The Platoon (2-Truck Platoon matching) project will introduce new logistics concepts in the Supply Chain. This project addresses the industrial challenge to be able to schedule platoons or dynamically form platoons on-the-fly, by realizing a collaborative matching and planning competency. TIGER (Transit via Innovative Gateway concepts solving European intermodal Rail needs) project aims to develop the Rail transport in competitive and co-modal freight logistics chains.
Performance measures of a synchromodal transport network
© SELIS, 2018 Page | 44

The CO2REOPT project aims at developing methods and tools for full external transport integration where suppliers, manufacturers and customers share a fully integrated and optimized intermodal supply chain. In CO2REOPT, the robust and dynamic re-planning of timetables, optimal disruption management, and design of cross-border synchromodal transport chains, will be studied from a supply chain perspective. In this project, there is also attention for reliability of scheduled services and carbon emission reduction.
The dynamic character of synchromodal transport
Some of the European projects are about applying or developing intermodality and synchromodality on European networks. The ISOLA project supports the development of the multimodal transport system in the Netherlands, and by extension in Europe, into a truly synchromodal transport system, in which infrastructure use, transport services and operations are aligned with market demand. The ISOLA project considers sourcing of transport capacity for synchromodal services, articulation of the demand side, revenue management applied in synchromodal context, and the use of real-time information. Implications of automated driving in freight transport are one of the concerns of EU decision makers; the STAD project is about automated driving and is based on an integrated approach combining spatial economics, passenger and freight transport, traffic safety and multimodal transport networks. One STAD subproject focuses on platooning. Real-time planning is one of the main characteristics of synchromodal transport. In SYNCHRONET project, a software for real-time synchromodal logistics optimization is developed.
Information sharing and transport chain visibility
There are different EU projects which are developing new methods and platforms for information sharing between actors in transport supply chains. This information sharing platforms will lead to more visibility in the transport networks.
Boxreload is an innovative, easy to use web-based platform to allow trucking companies to cooperate by safely sharing certain information and enabling better transport planning. Boxreload helps trucking companies of all sizes to combine loads with the aim of replacing two journeys by two trucks, each with an empty leg, by one return journey with a single truck. In the INTEGRITY project, the core of the project was the development of the so-called Shared Intermodal Container Information System (SICIS) allowing authorized companies and authorities to access planning and status information of selected transports. Proactive planning following the Supply Chain Event Management (SCEM) approach allows to forecast problems well before they might occur. The AEOLIX (Architecture for European Logistics Information Exchange) project is running to overcome the fragmentation and lack of connectivity of ICT based information systems for logistics decision making. The iCargo project aimed to advance and extend the use of ICT to support new logistics services to synchronize vehicle movements and logistics operations across various modes and actors. The vision of the CELAR (Automatic, multi-grained elasticity-provisioning for the Cloud) project is to provide automatic, multi-grained resource allocation for cloud applications. FIWARE project is developing Core platform of the Future Internet. The FIWARE mission is to build an open sustainable ecosystem around public, royalty-free and implementation-driven software platform standards that will ease the development of new Smart Applications in multiple. In addition, the FIspace is a business-to-business (B2B) collaboration platform. EfficienSea project aimed at preparing maritime authorities for major future investments needed to implement e-Navigation in the Baltic Sea region. Whereas PROPS project promoted and developed short sea shipping and extended SSS operations to encompass inter-modal and co-modal transport.
© SELIS, 2018 Page | 45

ASAP and PortDial are two other platforms which develop frameworks for information sharing. The ASAP research project develops a dynamic open-source execution framework for scalable data analytics. The underlying idea is that no single execution model is suitable for all types of tasks, and no single data model. The PortDial will result in a commercial platform for quick prototyping of interactive spoken dialogue applications to new domains and languages, the corresponding multilingual collections of concepts-services-grammars for specific application domains (marketed separately), and a multilingual linked-data ontological corpus that can be freely used for spoken dialogue research and prototyping for non-commercial purposes.
There are other projects which develop new technologies that could help to extend the concept of information sharing in multi-actor networks. COGNIMUSE will undertake fundamental research in modelling multi-sensory and sensory-semantic integration via a synergy between system theory, computational algorithms and human cognition. CAPER project is investigating the authentication of pervasive devices - how can a user be guaranteed that the device they associate with is indeed the device in front of them.
State of the practice
The current state of practice features a variety of collaborative arrangements in container transportation. For example, European Gateway Services is offering intermodal transport services integrated with container handling services in the deep-sea port and in the hinterland dry port (Veenstra, Zuidwijk, and van Asperen, 2012). Some hinterland terminals collaborate by sharing terminal capacity or barge capacity to better utilize resources (Ypsilantis, 2016). Also, shippers join forces to create sufficient volume to exploit intermodal transport solutions. Samskip is offering on some of its corridors in Europe synchromodal transport solutions where the actual mode and route of transport is left to the discretion of the intermodal operator. Usually, these transport solutions may have some features in common with the synchromodal transport solutions outlined in this white paper. However, state of practice does not feature the level of collaboration and information exchange required for full synchromodal service deployment. The question is what benefits can be obtained when collaboration and information exchange are enhanced and in which types of enhancements are most effective.
Research Gap
In this section, we provide evidence of the research gap present in the current literature by presenting the two main research directions of this first European Green Logistics Strategy.
The first one deals with the issue of assessing the effect of different collaboration levels on synchromodal network performance, e.g., costs and reliability. The second direction, instead, looks into how different collaboration agreements affect the execution of synchromodal transport. To enter the description of the two directions, we first need to distinguish the concept of collaboration levels from that of collaborative agreement. On the one side, a collaboration level can be defined by looking at the operational properties of a collaboration, namely, how information is shared, the role of participating actors and the planning level where cooperation occurs (Barratt, 2004). On the other side, a collaborative agreement is related to the precise terms by which collaboration is put into practice, for instance a benefit sharing mechanism, or an arrangement that aims at coordinating and synchronizing the actions of multiple organizations.
© SELIS, 2018 Page | 46

Different levels of collaboration can be distinguished by looking at how information is shared, what actors are sharing information and the planning level (strategic, tactical or operational) where coordination takes place (Barratt, 2004). Variety in levels of collaborations relates also to different coalitions of stakeholders: because multiple heterogeneous organizations operate on the same network, diverse collaborations can be arranged by looking at specific combinations of participants, with certain configurations yielding to a higher network performance than others. Therefore, a synchromodal and collaborative strategy will result in performance improvements only if properly deployed and coordinated. Between the improvements, enhanced reliability should be defined in a network setting. A definition that can be used to operationalize the concept, rather than statically assessing its value on a specific network configuration, is missing in the literature. This measure for reliability should be defined in such a way that it respects composition structures of transport networks and, at the same time, being valuable for stakeholders. Moreover, following this definition, we aim at understanding the inherent relations between reliability and the other network performance measures, i.e., costs and emissions. Establishing the price of reliability in terms of quantifiable measures comes down to determining the cost of increasing network reliability to a certain extent. In this direction, several studies have investigated synchromodal planning and execution methods from the point of view of a unique central planner(Van Riessen, 2013; Van Riessen, Negenborn, and Dekker, 2015; Behdani et al., 2014). We plan to extend those works, especially because we explicitly consider coalitions of stakeholders, but also because of our focus on reliability and on different levels of information sharing.
In the second direction, collaborative agreements, instead, assume a central role in establishing the gap. Indeed, they occupy a relevant position in the collaborative planning of synchromodal transport as the development of a synchromodal transport network involves multiple suppliers of transport and handling services. Different transport service providers may not have aligned interests because of their different positions in the transport network, different performance of their services, or specific dependencies of their operations to particular timing of information provision. For instance, stacking operations can be optimized when advance information on the container flow through the terminal is given, while carriers might defer taking decision on container routing - and the resulting information sharing – to wait for revelation of further information. In this example, if the carrier’s decision is going to affect the terminal operator, as the latter can or cannot be on the chosen route, a clear misalignment of incentives in information sharing is found. To our knowledge, this effect has not been studied so far as operational planning problems have predominantly been studied for network operators that act as single decision makers. For the studies where different operators act cooperatively in planning transportation, full integration of the planning process has to be assumed (Krajewska et al., 2007; Agarwal and Ergun, 2010). We plan to start our research from those works by extending and modifying the models proposed there, so that the effect of information sharing on operational planning is explicitly captured. Moreover, by reversing the previous research process, i.e., going from given targets of network performance measures to the collaborative agreements, we will determine the value of operational information sharing between stakeholders. Those results will clarify how to construct collaborative agreements that can effectively enable synchromodal planning and execution.
To summarize, we underlined a two-fold research gap. In a first direction, there is a clear gap in the academic knowledge about the effect of diverse information sharing levels, heterogeneity in cooperating parties and different coordinated planning levels on synchromodal network performances, in particular reliability of transportation. In the second direction, knowledge is missing regarding the impact of benefit sharing concepts and incentive alignment mechanisms on the performance of a synchromodal network.
© SELIS, 2018 Page | 47
Required academic research
This section presents the methodologies that we are going to consider addressing each of the two directions of the research gap. In general, our methodological approach is a combination of optimization models and cooperative game theory applications. This research will make use of stochastic dynamic network flow models to initiate the investigation on the definition of reliability. Those models are a compromise between detailing operational planning to its full complexity and putting into the model abstract concepts of resource synchronization. Indeed, a network flow model is not considering operations in their full details but presents transport resources in an aggregated manner. This will allow for a simplified representation of transportation, thus, facilitating the evaluation of reliability and of concepts of synchronization of resources. Stochastic parameters will be used in the combinatorial models to capture uncertainty. The value of different levels of information sharing will be addressed by a scenario-based analysis that fixes variability of certain parameters of the combinatorial models and a comparison of those results.
Different solution concepts from cooperative game theory (the Shapley value, the core, etc.) will be used to represent different benefit sharing mechanisms. On the same issue, we might consider specific non-cooperative game models to capture the self-interested behaviour of multiple organizations. Those models will be linked to the combinatorial models reported above.
In a first moment of this research, we plan to use stylized models to provide clear insights into the different roles. By stylized models, we mean simple examples where the instance size of the combinatorial models is small. In a second moment, we might consider performing simulations to properly address more involved network structure, or when obtaining closed solutions are not feasible anymore.
Required applied research
Applied research needs to demonstrate in what manner collaborative arrangements and information exchange should be enhanced in current transport systems. Although various levels of collaboration and information exchange between different heterogeneous players can be established, the question is what the outcome will be. One, therefore, needs to define and assess different performance dimensions of collaborative transportation networks composed out of heterogeneous players. This will allow the examination of trade-offs between different performance dimensions. Moreover, there is a need to increase the visibility and awareness of the different collaborative agreements and schemes on the overall performance of a transport.
The required collaboration and information exchange is closely related to the design of planning and execution of synchromodal processes. Information exchange should provide decision makers with the required level of situational awareness to fully utilize the available resources and to meet actual demand. To deploy the various resources in an optimal way, there should be no frictions between the planning and execution by the different actors that hinder optimal system performance.
The applied research should consider the feasible designs in the Living Lab environments. This investigation will provide insights into how the planning and execution processes should be designed to lever the potential value of collaboration towards the realization of synchromodal transport.
Next to organizational boundaries, also certain organizational procedures may not be defined away immediately. The same holds true for legal and institutional constraints. In general, a stakeholder analysis is required to map out the drivers and barriers of adoption of collaboration and synchromodality. © SELIS, 2018 Page | 48

Collaborative transport In this part of the document, we will summarize some main elements from the literature with regards to the main dimensions of the EGLS2:
(1) Design of collaborative scheme(2) Business models and governance structures of the collaborative transport networks(3) Gain-sharing mechanisms in collaborative transport networks(4) Risk-sharing mechanisms in collaborative transport networks
Design of collaborative scheme
Collaboration in transport can take place under many different forms. In this section, we will summarize common collaboration models in transport order to identify some basic dimensions that can be used to characterize them.
Vertical collaboration in transport is a well-established form of collaboration. In container transport, an example of vertical integration is intermodal transport where several transportation modes are integrated.
Horizontal collaboration consists of sharing of resources between potentially competing players and is therefore seen as a “new frontier” or a “paradigm shift”.
Several authors highlight that achieving optimally optimized transport solutions required the combination of vertical and the horizontal collaborations (Cruijssen, 2012; Doukidis et al., 2007; Ritter et al., 2004; Simatupang and Sridharan, 2002; Prakash and Deshmukh, 2010; Soosay et al., 2008). This type of set-up is sometimes referred to as lateral collaboration or network collaboration (Cruijssen, 2012). Lateral and network collaboration both consist of combining and sharing capabilities in both vertical and horizontal manners (Simatupang and Sridharan, 2002). However, while lateral collaboration requires direct and networked points of contact between different parties (e.g. various shippers or logistics service providers), this is not necessary in case of network collaboration (Cruijssen, 2012).
An example of network collaboration can be illustrated in the context of container distribution in ports where supply chains in a network are not linear but complex networks. As such, the performance of the container distribution network is the result of joint action by a set of actors whose operations are intertwined and interdependent. Indeed, a series of connected stakeholders provide transport, intermediary, terminal and storage services such as container handling, deep-sea terminal operators, inland transport companies, inland terminal operators, freight forwarders, depot owners. Collaboration between different parts of the network is largely an organizational challenge (Van Der Horst and De Langen, 2015). For example, as demonstrated by Van Der Horst and De Langen (2015), handling one container from deep-sea terminal to inland terminal involves at least six different stakeholders who have different business models and different interests in the transport network (De Langen, 2010). For example, deep-sea terminal operators have a focus on improving terminal efficiency, inland transport companies focus on the utilization rate of their assets, and shipping lines are interested in short port turnaround times and repositioning issues of empty containers. This contrasts with forwarders or logistics service providers, who are in general non-asset based, and are focused on optimizing good and information flows for the shipper.
Business models and governance structures of collaborative transport networks
© SELIS, 2018 Page | 49

Different collaboration models correspond to different governance structures. We can illustrate this with several examples.
Vertical collaborations are typically governed by freight forwarders. However, maritime container terminal operating companies have also extended the gates of their seaport terminals to the gates of inland terminals by means of frequent services of high capacity transport modes such as river vessels and trains and are de facto extending their role from node operators to that of multimodal transport network operators (Ypsilantis and Zuidwijk, 2013). In urban freight transport, the most common type of vertical collaboration is the subcontracting of the last mile operations. The subcontracting of the last mile can be done towards “white vans”, i.e. local companies competing on price or towards last mile specialists which offer a series of “green” and value-added services. Typically, highly congested and regulated service areas generally require alternative delivery models and often involve subcontracting towards last-mile specialists. For example, in London, several parcel operators are subcontracting their deliveries within the congestion zone to the Grewt micro-consolidation centre employing electric vehicles who are exempt from the access restrictions in that zone.
With regards to the horizontal collaboration, McKinsey (2010) highlights three types of collaborative models: (1) Convened collaboration where a neutral party outside the core activity organizes the collaboration, (2) "Primus inter pares" collaboration where a large player with sufficient critical scale offers existing network to smaller competitors or complementary product shippers and (3) "Inter pares" collaboration where a group of players with subcritical but typically similar sized operations consolidate existing or set-up new joint activities. PharmLog is given as an example of “inter pares” collaboration – this company is an industry platform joint venture organizing joint distribution of different pharma companies (McKinsey, 2010). In urban freight transport, an example of “inter pares” horizontal collaboration are co-loading schemes between carriers or shippers. An example of such scheme was implemented in Kassel City (DE) – here, a neutral freight carrier collected goods from five freight carriers and delivered them to shops in the inner city (Köhler and Groke, 2003; Thompson and Taniguchi, 2001). Examples of convened collaborations are those operated by a company outside of the core activity, such as a 3PL. In urban freight transport, urban consolidation centres can be seen as a type of a convened collaboration as their operation involves an external orchestrator which consolidates goods from several shippers and who is typically the owner of the collaboration model.
McKinsey (2010) and Tsenga et al. (2013) also discuss the benefits and drawbacks between different collaboration models. On one side of the spectrum, the convened collaboration offers clear governance and reduces the risks that a low level of trust may bring to the collaboration (Tsenga et al., 2013). A “trustee” coordinates all partners, controls and safeguard the sharing of resources in the coalition and take care of the division of synergies generated from collaboration activities. However, efforts by the trustee may need to be compensated (Tsenga et al., 2013). On the other side of the spectrum, “inter pares” collaboration offers full transparency on cost improvements and presents an opportunity to draft fair gain sharing model providing the full collaboration benefit to each participant (McKinsey, 2010). However, it also requires the disclosure of potentially confident information to partners and calls for relatively high expertise on orchestration and implementation of collaborations (McKinsey, 2010). As such, the convened collaboration presents the lower level of risk but also lowest transparency and benefits whereas the “inter pares” collaboration can present the highest transparency and benefits but the highest level of risk.
Cruijssen et al. (2005) also differentiate the convened collaborations (i.e. operated by an external company) with regards to the initiator of the collaboration. Indeed, they highlight that collaboration in transport can be achieved through a “push” or outsourcing approach or by the “pull” or “insinking” approach. As such, the “pull” horizontal collaboration is indeed already a frequent phenomenon in © SELIS, 2018 Page | 50

container transportation where several shippers often share barge or train capacity. Cruijssen et al. (2005) also describes an “insinking” approach for road transport. In this type of scheme, a logistics service provider is the initiator and the owner of a collaborative network. The logistics service provider aims at gaining maximum synergetic effects by tendering for multiple shippers whose distribution networks can be merged very efficiently (Cruijssen et al., 2007).
In order to manage the governance of a network collaboration, Cruijssen (2012) introduces another function, which is that of a trustee who performs controlling and monitoring functions that can be categorized in “offline functions” (e.g. conflict resolution, confidentiality, and legal compliance) and “online functions” (e.g. daily operations, load consolidation, prioritization, and matching). The role of trustee is close to the concept of the “logistics control tower”. As an early example of such a company is Tri-Vizor (trivizor.com) who introduces itself as “the world’s first supply chain orchestrator” (Montreuil et al., 2012). Example of network collaboration is synchromodal transport which uses different transport modes to provide flexible transport service and consists out of a horizontal and vertical integration of the modes (Behdani et al., 2014).
Another concept that has been introduced in the synchromodal setting is that of a “control tower”, i.e. a team formed by all the companies involved to coordinate the operations and to have visibility of the logistics flows (Rossi, 2012). For example, Mes and Iacob (2016) investigate the applicability of synchromodal transport planning at a Dutch 4PL service provider active in the European transport market using a control tower software which helps a planner to direct the transport through the network - it takes restrictions into account and tries to find the best way (based on user preferences) to schedule all transports.
The previously described approaches are relevant collaborations between a limited number of companies and long-term collaboration agreements. However, technology drives innovative horizontal collaboration models and ad-hoc collaborative schemes that are gathering a larger number of participating actors. Examples of such schemes are asset-light brokerage platforms that easily match demand and supply for logistics services, also referred to as freight marketplaces (e.g. Telogis, Keychain Logistics). Examples of such emerging schemes in urban freight transport include technology start-ups (e.g. Shutl, tiramizoo, Zipments) who aggregating local courier capacity on a broker platform to form flexible courier networks that dynamically assign orders to a courier enabling deliveries within a couple of hours (Hausmann et al., 2014).
With regards to the presented typology, we can conclude that most of the collaborations have been carried out in a centralized manner. Given the nature of vertical collaboration, the collaboration model generally consists out of a series of bi-lateral agreements between companies and is governed by a single operator. As noted by Xu (2013), horizontal collaboration cases so far are carried out among a few leading companies. Network collaboration is governed by a trustee and at the moment, synchromodal transport has been studied and implemented only from the perspective of a central planner that owns transport means and uses subcontracted services.
Decentralized collaboration has been so far addressed only on a conceptual level. For example, Dai and Chen (2011) present an example of auction-based logistics marketplace in order to enable collaboration among carriers. Similarly, Xu (2013) presents a framework for the collaboration mechanism in decentralized horizontal collaboration logistics systems. Finally, although the collaboration mechanisms of the Physical Internet have not yet been established, considering the scale of this system, it will probably be decentralized (Ballot et al., 2012). A decentralized approach allows a large number of agents to take part in the system, and is a way forward to an open collaborative system (Xu, 2013).
© SELIS, 2018 Page | 51
Gain sharing mechanisms in collaborative logistics networks
There is a vast body of literature addressing gain sharing mechanisms in the collaborative transportation networks. For example, a paper by Guajardo and Rönnqvist (2016) lists 55 different papers that address this issue. Gain sharing methodologies define how the synergies can be shared fairly among the contributors, commonly referred to as ‘compensation rules’. A compensation rule makes sure that possible gains and risks are shared equitably, but not necessarily equally, between the participants in a horizontal collaboration. In a case of horizontal collaboration where a “gain” is defined as a cost reduction which occurs through the cooperative model, the gain-sharing methods are also referred to as cost-allocation rules or mechanisms. Several authors (e.g. Cruijssen et al., 2007 and Guajardo and Rönnqvist, 2016) discuss the cost-allocation mechanisms for collaborative transportation networks. Some commonly used methods are:
Proportional rules: an approach that seeks to distribute gains and/or costs by linking it proportionally to a single indicator; some of the frequent indicators are the demand quantities and the stand-alone costs;
Shapley value: one of the most used concepts in cooperative games which allocates to each player an average of the marginal costs it implies when entering coalitions; this allocation guarantees the “fairness” of the allocation;
Th Nucleolus (Excess of a coalition): the set of imputations that maximizes the excess vector which presents the savings from a coalition for all players; instead of looking for a most “fair” coalition, this allocation method seeks in minimizing the worst inequity (i.e. the maximum dissatisfaction) within the coalition;
Methods based on separable and non-separable costs, where cost are allocated according to the marginal or separable cost of a player.
However, most of the present literature focuses on coalitions where different partners have the same level of performance, similar service requirements and risk profiles and there is a lack of gain allocation methodologies between heterogeneous partners.
In container transport, for example, Van der Horst and De Langen (2015) note the unequal distribution of the costs and benefits of collaboration as a major barrier for setting-up the collaboration. As noted by the authors, well-synchronized container networks are a collective result by a group of different actors and clear gain sharing mechanisms that redistribute the collective benefits are poorly developed and may fail because of high transaction costs. Currently, the lack of contractual relationships between different parties (e.g. is no contractual relationship between the inland transport company and the deep-sea terminal operator) prevents interoperability between different systems as no incentives are given in order to encourage parties to better match the quay planning of the deep-sea terminal operator with the planning of the transport company.
In case of synchromodal transport, there is no direct link between the costs and revenues of transport services, which makes pricing complex (Van der Burg, 2012). In addition to this, transport can be provided by more than one carrier and the use of assets can be shared among various stakeholders (Van der Burg, 2012). A cost and gain sharing model has to be developed to determine which share of the costs and revenues each stakeholder incurs and receives (Eng-Larsson and Kohn, 2012). A similar conclusion is made by Behdani et al. (2014) who highlight that the gains of implementing synchromodality must be shared with fair contracts among all actors and that the involved parties must be coordinated by contractual relationships and incentives for cooperation.
© SELIS, 2018 Page | 52

Therefore, it is necessary to establish specific gain-sharing rules in synchromodal transport. Moreover, in a synchromodal transport system it is essential to formalise the cooperation, e.g. with rules for gain, cost sharing and decision making, especially in multilateral initiatives (Ypsilantis and Zuidwijk, 2013).
A similar situation can be found in the urban freight transport where collaborative schemes require the integration between actors having different requirements in terms of service level (e.g. the reliability or responsiveness in the pharmaceutical supply chain is not the same as in wholesale logistics) and different levels of performance (e.g. travel and delivery times that vary according to the type of urban area or the delivery time).
Currently, the most common way of chagrining for the transportation services in urban freight transport is using a proportional method. For example, as noted by Janjevic and Ndiaye (2016), the most common way of charging for the urban consolidation centre services is a fixed price per transported cargo unit (i.e. parcel or pallet), which corresponds to a fixed service fee per transaction/transport. However, as noted by Tsenga et al. (2013), simplistic methods as the proportional methods tend to favour one particular or a particular type of partner, which can raise the problem of unfairness among shippers. For instance, if the method is to allocate the cost proportional to the number of orders, the shippers with more orders but traveling shorter distances may be allocated with a cost that is higher than if they execute the service without collaboration (Tsenga et al., 2013).
Risk-sharing mechanisms in collaborative logistics networks
Today, most organisations apply well developed risk transfer measures as well as effective internal control measures treating the most crucial enterprise risks (ALICE, 2014b). However, the collaborative risk management schemes are underutilized. Indeed, very few approaches consider the identification of risk interdependencies between partners. In fact, “risks are often interconnected, which leads to the exacerbation of some risks when the mitigation strategies of other risks are implemented”. (Aqlan and Lam, 2015:54). Organizations have utilized technology to link with other organizations to develop a very complex web of dependencies. Such relationships create co-dependency among partner organizations that result not only in the sharing of benefits through efficiency gains, but also in sharing inevitable risks (Sutton et al., 2008). From an enterprise risk management view, such risks can be particularly disconcerting as an organization generally has minimal control over the mitigation of risks at partner companies (Sutton et al., 2008). Moreover, many organisations only implicitly manage their supply chain risks, based on experience and without using structured analysis methods (ALICE, 2014b).
Furthermore, the risk-allocation mechanisms in collaborative networks are highly simplistic. For example, currently, the risks related to co-modality are typically allocated to the carrier which is usually in charge of the consolidation of different flows from its clients (Eng-Larsson and Kohn, 2012). However, as noted by Rossi (2012), risks cannot be imputed to the carrier only, as it would be far too difficult to be handled by a single organisation. New methods for risk-sharing in intermodal settings are indeed required.
A similar situation is met in urban freight transport. Indeed, collaboration between several shippers can produce significant financial gains (e.g. decreased cost of transport) but also involve additional risks (e.g. risk of supply disruption due to unplanned demand, risk of delays due to the multiplication of the delivery points). Therefore, it requires visibility on the incurred costs and risks for each individual player in order to fully assess the effects of a collaboration, potentially adjust compensation rules and produce risk mitigation actions.
© SELIS, 2018 Page | 53
Previous projects
We can mention several projects that explicitly investigate the design of the collaborative schemes in transport.
The CO3 project, short for 'Collaboration Concepts for Co-modality', has made a significant effort in addressing the issue of business models for co-modality. The project identifies several models that are currently used in co-modal setting and describes an advanced business model for co-modality in a collaborative environment based on three main components: legal issues, fair gain sharing, and the presence of the trustee (CO3, 2016). The project also specifically focuses on gain sharing methodologies which defined how the synergies can be shared fairly among many contributors (Tsenga et al., 2013).
NexTrust is an ongoing project whose objective is to increase efficiency and sustainability in logistics by developing interconnected trusted collaborative networks along the entire supply chain (NexTrust, 2016a). These trusted networks, built horizontally and vertically, will fully integrate shippers, LSPs and intermodal operators as equal partners (NexTrust, 2016a). The project acknowledges the existing successful collaboration models and in particular the role of the “neutral trustee” function, which is considered as a crucial enabler of the collaboration. NexTrust had setup several pilot cases in which the role of the trustee is to be investigated: e.g. Less than Truck Loads (LTL), Full Truck Loads (FTL), intermodal and e-commerce (NexTrust, 2016b).
4C4D City Distribution: the focus of this research project is collaboration in distribution and coordination between Logistics Service Providers (LSPs) and between LSPs and retailers. The increase of collaboration will lead to innovative distribution concepts that are based on sound business models, while meeting objectives and restrictions set by municipalities.
The SecureSCM project investigated confidentiality-preserving supply chain management (SCM). Indeed, collaborative planning, forecasting, and management of supply chains can offer important benefits, but require access to confidential information. Currently, these benefits cannot be achieved because the partners are reluctant to provide this information (the negative effects of disclosing it exceed the benefits). The SecureSCM project developed a randomized model for benefit sharing in secure collaborative lot size planning and a tool for automatic analysis of data sharing risks in supply chains.
Supply Chain Visibility and CAPAIn the context of EGLS3, the following definition from literature can be retained: "Visibility means that important information is readily available to those who need it, inside and outside the organisation, for monitoring, controlling, and changing SC strategy and operations, from service acquisitions to delivery" (Schoenthaler, 2003, in Caridi et al., 2014:2).
Based on a review of several definitions of supply chain visibility, Caridi et al. (2014) pointed out that "the concept goes beyond simple access to certain information flows related to SC process, [but also encompasses] the properties of the shared information". Typical information flows include Transactions/events, Status information, Master data and Operational plans (Caridi et al., 2010).
As pointed out by Lee & Rim (2016), most studies of visibility have focused on information sharing and accuracy using information technology. They further raise the importance of approaches for not only improving visibility, but for capabilities to handle a lack of visibility. "A reactive approach that focuses on information visibility is very important, but a proactive approach to improve process capability through process improvements and restructuring is also very important. [...] In order to acquire operational excellence, both reactive and proactive approaches are very effective" (Lee and Rim, 2016: 10).
© SELIS, 2018 Page | 54

Cancellations, speculative bookings and no-shows are not only characteristics of passenger behaviour in airline industry (McGill et al., 1999), but also serious sources of uncertainty in short sea shipping and feeder shipping. To handle these and ensure higher capacity utilization, strategies like stand-by cargo, overbooking, booking rescheduling, price differentiation, and cargo prospection are suggested (Styhre, 2010; 2013). Based on root-causes and consequence analysis of the late cancellations problem (dummy booking, late information), business requirements towards a future Internet based concept for handling of late cancellations have been identified in a previous project (Finest). These include functionalities such as open reservation of capacity, booking flexibility, alternative price models, early warning of cancellation, proactive event-handling and the anticipation of cancellations and rapid replacement of cancellations (Rialland and Hagaseth, 2014).
Going beyond deviation handling and corrective/preventive actions, the concept of proactive event processing provides a strong opportunity for supply chain and logistics monitoring. The ability to foresee and detect deviations before they occur, in order to avoid them or minimize their consequence, represents a highly valuable business capability. It is also a very innovative area for the sector.
Alias et al. (2016) provide a very insightful review of complex event processing and predictive analytics in the transport and logistics sector. They define complex event processing (CEP) as "a concept for methods, techniques and tools in order to process events in real-time continuously and promptly" (Alias et al., 2016:3). Feldman et al. (2013) and Metzger et al. (2015) propose combining CEP with predictive capabilities into a predictive model. The model consists of probabilistic rules producing alerts based on modelled prediction. Feldman et al. (2013) present a case study on the proactive management of transport processes. They address a challenge related to shipment planning (over- / under-weight loads), showing that the use of proactive approaches enables predicting deviation early enough in the planning process to enable the planner to optimize load plans.
ICT for Transport & logistics
According to IBM (2010), future supply chains will increasingly be equipped with sensor-based solutions to reduce inventory costs with increased visibility. Supply chain information that was previously created by people will increasingly be generated by sensors, RFID tags, meters, actuators, GPS and other devices and systems. In terms of visibility, supply chains not only will be able to “see” more events, but also react accordingly as they occur. In fact, Event Management is the backbone of a visibility solution, as it allows the monitoring of activities in the supply chain. However, monitoring is just the start; reporting and handling are more advanced Event Management functions (Capgemini Consulting, 2012). In parallel to an increased digitalization of the supply chain, objects, not people, must do more of the reporting and sharing of information. Critical data will come from trucks, docks, store shelves, and parts and products moving through the supply chain. This visibility will not just be used for better planning, but it will be fundamental to real-time execution. Smarter supply chains will track external factors such as soil conditions and rainfall to optimize irrigation, monitor traffic status to alter delivery routes or shipping methods, and follow financial markets and economic indicators to predict shifts in labour, energy and consumer buying. To make sense of available data, smarter supply chains will use sophisticated algorithms like intelligent modelling, analytic and simulation capabilities (IBM, 2010).
Talking about transported goods themselves, data should be captured upstream at the point where goods are packed for transport to the buyer in order to ensure the availability of high-quality information suitable for all necessary purposes like risk analysis and quality assurance. This will be guaranteed by innovative methodologies like the data pipeline concept, which is an IT innovation to enable capturing data at its origin by accessing existing information systems used by the parties in international supply chains. To achieve this goal, the implementation of a public-private governance
© SELIS, 2018 Page | 55

model that has to accompany the technical innovation is of vital importance (Klievink et al., 2012). This process can be supported by the implementation of Single Window systems which are suitable to harmonize logistics processes and thus to facilitate trade in general. Respective implementations need to take compatible standards regarding formal descriptions of logistics processes, interfaces and information content into account. It is important to proceed further in obtaining a distinct and unified framework and methodology for developing Single Window systems, which will crucially support a smooth and manageable integration of heterogeneous systems into a Single Window environment (Fjortoft et al., 2011).
When Capgemini asked to identify the different trends in the Supply Chain Visibility software market, collaboration beyond the silos of a single firm and with other supply chain members was often mentioned. Apparently, companies “seek to orchestrate their supply chain across functional and organizational boundaries”. Another important trend is the increase in demand for SaaS-solutions, allowing companies “to plug into (Cloud) visibility solutions at lower costs due to more effective and flexible pricing models”. Another important topic is increased collaboration and willingness to share data among supply chain partners, motivated by increased competitive pressure (Capgemini Consulting, 2012).
From the Digital Transport and Logistics Forum (DTLF)2, the following is said about visibility services that Logistics Information systems must offer to support logistics processes:
Visibility Services: The state of supply and logistics chains is shared via events containing milestones. By combining events from different sources or by applying rules by matching event data with already known information, new events might be generated (e.g. ‘too late’). ETA prediction might also be part of those events.
Logistics Platforms focusing on Booking and visibility: These platforms provide capabilities of booking transport for particular legs (e.g. sea transport), particular type of cargo (e.g. TEUBooker for container booking to the hinterland) and provide visibility of individual bookings. Note that for instance Uber4Freight will probably also provide this type of functionality.
Logistics Platforms focusing on Visibility: These platforms only provide visibility services for particular shipments or objects like a container, barge, or a railway wagon. An example is Rail Net Europe (RNE) providing train visibility services based on input provided by national rail infrastructure managers. MarineTraffic provides a similar service for vessel tracking. Other examples are Transics and Astrata providing visibility for trucks to their owners based on On-Board Units. Maersk develops the so-called Shipping Information Pipeline (SIP) providing Visibility Service, not only based on a transaction between two enterprises but also supporting visibility based on an authorization token to third parties.
2 The European Commission launched on 1st July 2015 the Digital Transport and Logistics Forum (DTLF). The Forum will work for three years and aims at the further digitalisation of freight transport and logistics. It brings together Member States and stakeholders from transport and logistics communities in order to identify areas where common action in the EU is needed, to provide recommendations and solutions, and to work on their implementation, where appropriate. The DTLF envisages in particular addressing the following topics: Definition and acceptance of e-transport documents Optimisation of cargo flows through better use and exchange of data Languages / standards for seamless data exchange Social aspects of digitalisation and education and training requirementshttps://ec.europa.eu/transport/themes/logistics-and-multimodal-transport/digitalisation-transport-and-logistics-and-digital-transport-and_en © SELIS, 2018 Page | 56
Previous projects
Many previous projects addressed the topic of collaboration in supply chains in general, e.g. by increasing efficiency and sustainability in logistics by developing interconnected trusted collaborative networks along the entire supply chain and developing, professionalizing and disseminating information on the business strategy of logistics collaboration in Europe. By developing respective business models, models and capabilities for cooperation and communication between logistics stakeholders were provided. Efforts were taken to develop hardware and data management systems for data sharing, data analytics and asset tracking and to establish cloud-based collaborative logistics ecosystems for configuring and managing (logistics-related) information pipelines. In that way, through collaboration between industry partners, co-modality should be stimulated and co-modal networks should be made attractive to use. Special emphasis was put to raise the position of SMEs and get them with affordable, reliable and trusted IT solutions so to enable them to take part in international trade and commerce flows.
Projects related to visibility
A considerable number of projects was conducted to develop procedures and technologies allowing for supply chain visibility, security and predictability. Projects aimed at creating tools and methods that can be applied to increase container transportation security through integration of container security data in a common information distribution and sharing environment. By enhanced supply chain visibility, business operations as well as government’s cross-border security inspections should be improved, resulting in a higher hit rate and greater effectiveness of security related government inspections. One way to achieve this goal is to employ innovative IT technology solutions like RFID (Radio Frequency Identification) for container and seal identification.
Other projects aimed at developing common Future Internet software components, such as transport planning, open electronic market-places, shipment tracking, and proactive event handling, together with innovative cloud software solutions for effective and inexpensive deployment and management of Internet of Things (IoT) asset tracking systems exploiting live and actionable Big Data analytics.
In the rail freight sector, efforts were taken to improve the rail freight services offered to shippers, focusing on five key topics: reliability, lead time, costs, flexibility and visibility. Furthermore, innovative and practical solutions for a sustainable wagonload transport were developed, e.g. by smart wagon telematics facilitating improved cargo tracking at reduced costs.
In addition, efforts were taken in awareness raising, capacity building and promotion activities for fostering business development of EGNSS based applications worldwide, convincing public stakeholders and other actors of the transportation industry about the benefits they could derive from implementing such innovative solutions. One project aimed to overcome shortcomings of GPS based systems for the freight and logistics sector in specific situations (limited spatial accuracy and availability in difficult environments, lacking integrity information).
Projects related to CAPA
With regard to corrective and preventive actions, projects supported the inter-company business interaction and collaboration alongside the transport logistics chain, e.g. by cloud-based services, and to foster secured and non-biased critical information exchange among logistics actors of the global logistic chains including Customs authorities. This is an important pre-requisite in order to generate situational awareness along global supply chains in support of enhanced logistics services. Furthermore, projects aimed to discover gaps and practical problems in this process and to develop capabilities and solutions © SELIS, 2018 Page | 57

that could deliver sizable and sustainable progress in this field. Special emphasis was put on mitigation of the impact of natural disasters and extreme weather phenomena on transport system performance, for example by implementing a systematic risk management framework that explicitly considers the impacts of extreme weather events on the EU transport system and developing a series of respective mitigation tools. In the field of road transport, efforts were taken to provide better and more detailed information about road and weather conditions to improve road safety and road transport efficiency.
When it comes to corrective and preventive actions related to shipment delivery and transport operations, several projects (e.g. Finest, FIspace) have worked on developing concepts for cloud-based services (i.e. platform, Apps) for supporting proactive event-handling, offering autonomous detection of deviation from plan (e.g. shipment status and cargo condition), search for alternative solutions (e.g transport plan update; re-routing), and anticipation of deviations based on improved data analytics.
State of the practice
The Living Labs (LLs) defined in the SELIS project confirm that common challenges related to visibility are still very current. Visibility continues to be a weakness in transport and logistics operations. Lack of visibility is the biggest hinder to effective planning and monitoring of transport, including tracking of shipment and transport assets. From a business perspective, main requirements are still towards tools for higher visibility and business intelligence.
In practice, there are three main obstacles to achieve visibility:
Organisational: It is difficult to address the responsibility for visibility since it transcends different organisational functions and regional boundaries that all benefit from improved visibility.
Technology: Visibility systems have to gather information from multiple internal and external systems; that requires many interfaces to other systems and a clear semantics of information from different, but related domains. However, web services, B2B hubs, and transportation carrier portals are now making interfaces more manageable.
Managing visibility information: How to drive strategic business improvement from visibility information? Additional technology and organizational capabilities are needed to achieve this. Companies need a system which can monitor the events in the entire supply chain and that provides reports to all stakeholders involved.
Another issue in achieving supply chain visibility is related to the strategic importance of information. A major dilemma for companies is deciding on sharing information.
As expressed through one of the SELIS Living Labs3, it is of vital importance to develop and implement visibility solutions which provide a reasonable level of visibility to the end customer. Customers need to be provided with fast and reliable information especially in case of deviations of the transport process from the planned schedule in a pro-active way. Currently, it is often the case that common incidents like deviation of a vessel or re-scheduling of a container on another vessel causing the container to arrive late in the port of destination are communicated or announced too late, such that the customer is not able to adopt his planning to the changed circumstances.
Also, for planning of transport and logistics operations, visibility and capabilities for corrective and preventive actions are still missing. For better decisions, optimization of transport and higher resource
3 LL6: DFDS Integrated Shipping and Logistics Network SELIS Node© SELIS, 2018 Page | 58

utilization, services supporting match-making between transport capacity and cargo, benchmarking of services, combination of multimodal resources etc. are far from being widely implemented in practice.
Efficient match-making is about both increased transport capacity utilization and quick coupling between offer and demand of transport service. In today's practice, this match-making is still time-consuming and costly, especially with regards to sea freight transport. In the transport sector, a number of examples of online matchmaking services like load-boards for matching trucks with cargo can be identified. In the sea-transport sector, several platforms for publication of schedules and even transport needs are available (searates.com, bigschedules.com, shortseaschedules.com, velgsjoveien.no, timocom.com, cargospace24.com and aferryfreight.com). Research has been published about electronic logistics marketplaces (Nedelea, 2010; IMRC, 2008; Keifer, 2009; Noia et al., 2004), as well as models for match-making between offer and demand. These studies show high potential for lower transaction costs, better capacity utilization and better planning (based on better benchmarking of services) thanks to such e-marketplaces (Nedelea, 2010; Wang et al., 2008). Still, no such model directly applicable for sea freight transport at cargo unit level or which is commonly used in the European shortsea shipping sector could be identified.
Research Gap
Research activities related to visibility and CAPA focus on improving the collaboration along the entire supply chain. These activities include investigation of organizational factors and development of interconnected trusted collaborative networks. Also, technical concepts for visibility, collaboration and data exchange are developed. Innovative logistic principles like co-modality and synchro-modality have been developed and validated in real-life scenarios. New possibilities related to Internet of Things, cheaper and more available sensors, cheaper data processing and improved telecommunications are also investigated.
Required academic research
Academic research is necessary to clarify and structure the concept of visibility in the transport and logistics domain and to develop models and methodologies that can support the establishment of corrective and preventive actions. The following research areas are suggested.
How to quantify the effect of lack of visibility, for individual actors; across the supply chain. How to achieve higher visibility
o Business collaborationo improved planning (strategic, tactical, operational) o ICT for supply chain, transport and logistics
Strategies to overcome the lack of visibility and/or to better exploit higher visibilityo Corrective actions: post handling of deviations; real-time re-planning of transporto Preventive actions: anticipation of undesired event, deviation from plan
Strategies for switching from corrective actions (passive) to preventive actions (active)
How to ensure a correct match between technical solutions and existing/future business models
o How to combine visibility across organization boundaries (owners /users of information) and across systems (integration)
o Visibility vs. confidentialityo Incentives to information sharing
© SELIS, 2018 Page | 59

The core of research and most innovative aspects are the development of algorithms for achieving a higher level of proactivity (data analytics; event prevention; event anticipation, dynamic re-planning etc.).
Required applied research
Applied research on visibility and CAPA as described in this white paper should take into consideration the diversity among actors of the transport and logistics sector. Needs and requirements with regards to visibility vary among actors, and so do their existing capabilities and resources in terms of tools and strategies for managing visibility and monitoring operations. This diversity makes it difficult to build one unique solution, IT or strategic approach, suiting all stakeholders. Applied research should focus on specific use case scenarios in order to uncover that diversity as well as to test the utility of solutions to be developed, in distinct contexts. Also, applied research on what solutions are simple to introduce in the supply chain, must be done, both related to user friendliness and the tool's ability to solve the most pressing problems.
Supply Chain Financing Next, we provide an outline of two supply chain financing instruments, namely reverse factoring and dynamic discounting, which have gained considerable momentum in the industry over the last few years and are relevant to solutions under development within the SELIS LLs.
Reverse factoring
Reverse factoring (also referred to as “approved payables financing”, “confirming” or “supply chain finance”) is a buyer-led supply chain financing solution that involves a three-party arrangement between a large creditworthy buyer, a financial intermediary (typically, but not always, a bank), and a supplier. This arrangement is supported by an information system that is accessible to all three parties, where the buyer registers approval of the supplier’s invoices. Figure 9 gives a schematic representation of the reverse factoring process. Upon approval and registration on the system of a supplier’s invoice, the buyer guarantees she will deposit the corresponding amount to the bank on the due date that is specified in the trade credit agreement with the supplier. Based on the buyer’s promise for prompt payment of the registered invoices, the financial intermediary agrees to provide an approved-payables-based financing solution to the supplier. That is, if the supplier wishes to get payment for an approved invoice earlier than its due date, he can factor (i.e., sell) the relevant invoice to the financial intermediary at a discount that is based on the buyer’s credit rating.
© SELIS, 2018 Page | 60

Figure 9 Structure and sequence of actions in a reverse factoring arrangement.
Reverse factoring is applicable in situations where the corporate buyer has a stronger balance sheet (therefore, lower cost of financing) than the supplier and the established payment terms in their trading relationship are long (increasing, hence, the supplier’s need for cash). Instead of using its own cash to pay suppliers early, the corporate enters into an arrangement with a financial institution, which in recognizing that the supplier has an authorized invoice issued to the corporate buyer, acknowledges that it has a lower credit risk (than if it were to enter into a regular lending relationship with the supplier) and is able to provide financing to the supplier at a lower cost than it otherwise would. In other words, reverse factoring reduces the overall cost of financing within a supply chain because it enables the financing provider to transfer the financial risk from the supplier to the strong buyer.
Reverse factoring represents a development of traditional factoring, a form of external financing that has been used for decades by firms of all sizes, particularly SMEs, for funding their working capital (Berger and Udell, 1998; Klapper, 2006). The key difference between the two forms of financing is that the former is an accounts payable or buyer-centric arrangement, while the latter is accounts receivable or supplier-centric (that is, it is based on the initiative and information of the supplier). As such, traditional factoring cannot efficiently mitigate informational issues on the quality of invoices, such as fraud and mistakes with the billing process (Mian and Smith, 1992). Consequently, traditional factoring is subject to several limitations and transactional costs that may considerably increase the associated cost of financing compared to that achievable with reverse factoring. For example, there are limits on invoice maturity and margins of advance, but also fees for collection and monitoring of invoices (Bryant and Camerinelli, 2013).
In principle, a well-designed reverse factoring program is supposed to provide advantages to all three parties involved. Vliet et al. (2013) distinguish two types of strategic orientation for the buyers that implement such programs. A return-oriented strategy focuses on the direct financial returns a buyer can obtain from offering reverse factoring to her suppliers. The basic idea is that if the reduction in the cost of financing for the supplier is sufficiently large, the buyer may extract a portion from the generated value, either by extending the trade credit period, or by negotiating some price discount. On the other hand, a risk-oriented strategy focuses on the operational benefit for the buyer when reverse factoring is targeted towards facilitating supplier growth and improving service level. On the supplier’s side, through
© SELIS, 2018 Page | 61

expediting the cash flows from outstanding invoices at favorable terms, the supplier can efficiently manage his working capital and achieve a higher operational performance at a lower cost. Finally, reverse factoring enables the bank make a profit through service-related fees and cross-selling opportunities. In addition, financing against the buyer’s credit rating decreases the bank’s overall portfolio risk, relaxing, thus, the capital reserves constraints for meeting central bank solvency requirements.
There are numerous reports in trade journals referring to reverse factoring. A representative example of a “return-oriented” approach is Procter & Gamble’s decision in April 2013 to extend her payment terms with her suppliers by 30 days in association with a reverse factoring program that would help them cope with the changes (Serena, 2013). Using a similar approach, Unilever has managed a $2 billion working capital reduction in a three-year time span (Seifert and Seifert, 2011). Other companies, such as Volvo, Scania, and Caterpillar, have followed a more “risk-oriented” approach in their reverse factoring programs, with the objective to help their suppliers support their own growth in expectation of increasing demand for their end products (Aeppel, 2010). Also, some programs have been initiated in response to disruptions in the financial markets. For example, WalMart’s “Supplier Alliance Program” was offered to more than a thousand of its apparel suppliers, many of which SMEs, in the aftermath of the 2009 Chapter 11 bankruptcy filing by CIT Group Inc., an established commercial lender for that industry (O’Connell, 2009).
The total market size and potential of reverse factoring is not easy to calculate due to information confidentiality. Nevertheless, according to a report by McKinsey (Hurtrez and Salvadori, 2010), reverse factoring has the potential to unlock $100-500 billion of liquidity only in the US market. Similar figures have also been estimated for the EU market (Demica, 2013). The total potential, though, may grow substantially due to the aforementioned regulatory interventions which have been initiated as a response to long payment terms that large corporations impose on their suppliers (and particularly on SMEs).
Dynamic discounting
Dynamic discounting is a buyer-led supply chain financing solution that allows the dynamic settlement of invoices in a buyer-supplier relation. As with reverse factoring, this arrangement is facilitated by an information system that enables the exchange of invoice information (e-invoicing) and messages between the trading parties. Dynamic discounting solutions provide suppliers with the option of accepting early payments against any or all of their approved invoices, at any point, up to the maturity date for a discount fee. Unlike reverse factoring, with dynamic discounting the buyer uses its own liquidity (rather than that of a financial intermediary), trading off the adverse impact on her balance sheet (through expediting the settlement of invoices outstanding) with a benefit in her income statement (through an agreed discount on purchase prices and subsequent reduction in cost of goods sold). Consequently, dynamic discounting has wider application than reverse factoring in the sense that it does not necessarily presume a buyer with sound credit rating (e.g., double or triple A).
Dynamic discounting is a financing instrument that is built on the traditional trade credit, which is the most common arrangement for facilitating trading among firms. Trade credit can be found in two basic forms: a simple delay in payment, or a two-part term policy, in which the supplier offers a standard payment term (e.g., Net 45) and an alternative, discounted payment term (e.g., 1.5% 10, Net 45). The latter allows the buyer to settle payment within a short term (e.g. 10 days) in exchange for a discount (e.g. 1.5%), or within standard payment terms (e.g., 45 days) for the face invoice value. There are three problems, though, with traditional trade credit. First, many buyer companies are not capable of © SELIS, 2018 Page | 62

processing invoices quickly enough to be able to take up such discounts. Second, the attractiveness of getting a discount depends on the buying firm’s current liquidity and on the availability and attractiveness of investment alternatives. Hence, when payment terms are long, the best timing to ‘exercise’ the discount option is a dynamic decision. Finally, once the discount window is closed, suppliers often have to wait the invoice maturity date to get paid or alternatively resort to more expensive sources of financing such as factoring or asset-based lending (if available at all).
Dynamic discounting helps to resolve these issues by providing a pre-agreed sliding scale of discounts (e.g., linearly decreasing discount, reaching zero at the invoice maturity date). This allows buyers to improve their rate of return by managing their liquidity in a more dynamic way. It also allows suppliers to ask for early payment at a time that better suits their needs. The size of the discount is calculated from the number of days left until the invoice due date multiplied by the implicit interest rate negotiated by the two trading parties.
Figure 10 A typical dynamic discounting solution (Gelsomino et al., 2016).
Figure 10 gives a schematic representation of a typical dynamic discounting solution. With regard to discount configuration, dynamic discounting offers flexibility to the buyers to configure and change discount schemes at various levels (e.g., common for all suppliers, tailored to supplier tiers or segments, or even to the individual supplier level). Also, it allows buyers to specify which invoices will be made available for discounting based on their liquidity state and the dates on which these invoices can be discounted. Finally, as shown in Figure 10, a typical dynamic discounting solution provides visibility to suppliers to view which invoices can be discounted and the associated fees. Then, once suppliers select to discount a specific invoice, they are getting immediate payment.
© SELIS, 2018 Page | 63

Research Gap
The study on supply chain financing requires some combination of analytical modelling and applied research approaches. More specifically:
The analytical study of reverse factoring has attracted some academic interest, mainly because the practice of extending payment terms creates a trade-off for the supplier between lower cost of financing and greater funding needs (due to terms extension). For the most part, this stream of research considers the supplier’s problem in stylized models, assuming that the problem parameters are exogenously determined, and focusing on the operational and financial implications of reverse factoring on the two actors’ performance (Tanrisever et al., 2015; van der Vliet et al., 2015; Lekkakos and Serrano, 2016). Moreover, as the buyer’s gain in these models has monotone characteristics, the buyer’s implicit best response is to exploit her power in determining the reverse factoring parameters (terms extension) and capture the entire supply chain surplus (i.e., to squeeze the suppliers). An exception to this modelling approach is the work of Lekkakos and Serrano (2017), which applies a more integrated (supply chain) approach to reverse factoring by studying the buyer’s problem in the presence of deadweight cost for external financing. Nevertheless, the aforementioned research can be used as a basis for determining the reverse factoring parameters in an applied research environment, possibly by means of simulation optimization (van der Vliet et al., 2015).
The academic research on dynamic discounting is very limited as there is not any key trade-off involved for neither the supplier nor the buyer. To the best of our knowledge, the work by Gelsomino et al. (2016) is the only paper that studies the impact of dynamic discounting (with linear discounts) on the buyer’s financial performance. In our view, the selection of linear discounting is both intuitive and easy to implement. Also, whether to apply supplier-neutral or supplier-specific discount rates is a matter of the buyer’s appetite for capturing the most of potential surplus at the expense, though, of the implementation effort (i.e., by screening periodically the financial condition of every single supplier and adjusting the corresponding discount rates). Nevertheless, no particular applied research is required for this instrument other than determining the maximum applicable discount rate.
Regarding 2nd generation supply chain financing (i.e., a combined reverse factoring and dynamic discounting solution), we are not aware of any previous academic research on this topic. In our view, the problem is too complicated and parameter-heavy to be studied by an analytical modelling approach (even with stylized models). There are several components that need to be considered in calculating the liquidity threshold that determines buyer’s offering of reverse factoring vs. dynamic discounting. First, an accurate liquidity forecasting method shall be developed. Second, the buyer’s objectives with regard to balance sheet vs. profitability performance shall be clearly defined. Third, the setup and parameters of the reverse factoring and dynamic discounting solutions shall be specified. Once these prerequisites have been resolved, then, the optimal liquidity threshold could be determined by means of simulation optimization.
Finally, purchase order financing is an area with both business and academic interest. Unlike reverse factoring and dynamic discounting, this type of supply chain financing involves both a higher risk for the funding provider and a longer repayment period. The risk mainly lies with the supplier’s inability to deliver either due to inherent production uncertainties or due to the deliberate diversion of funds into other -possibly riskier- projects (moral hazard). The latter (i.e., the lenders’ inability to affect the borrowers’ actions once a loan has been approved) is one of the main agency issues associated with external financing which usually results to credit rationing and higher cost (Stiglitz and Weiss, 1981). To the best of our knowledge, the only paper in the operations management literature to consider purchase order financing is the work by Wu et al. (2014) who study the impact of buyer-backed bank
© SELIS, 2018 Page | 64

loan on the buyer’s optimal coverage (guarantee) and purchase order decision. In a different setting, Buzacott and Zhang (2004) study the impact of loan limits imposed by banks (in an asset-based financing scheme) on preventing excessive risk-taking in newsvendor operational environment. However, the agency issues discussed above are not considered in neither of these studies. In our view, there is a clear gap in the operations management literature for studying the concept of purchase order financing. Game theoretic models that would consider the actions of both actors in the presence of moral hazard (when the buyer decides the credit limit and interest rate based on supplier’s performance) would provide valuable insights to the industry. At a practical level, the determination of credit limits and interest rates per supplier category, along with the development of the supplier classification criteria, are challenging tasks which may require some type of simulation to be settled.
Environmental Performance Management
Mishra et.al. (2017) review the literature on GSC performance measures and identify the top contributing authors, organizations and key research topics related to the field.
Shultz and Holbrook (1999) remark the importance of maintaining a balance between economic and environmental performance despite organizations facing increasing competitive, regulatory and community pressures.
Lewis and Gretsakis (2001) and Sarkis (1995) manifest firms need to incorporate environmental strategies to reduce pressures and achieve environmental sustainability.
There are several definitions of Green Supply Chains depending on the nuance (social SC, integrated SC, sustainable SC, closed loop SC, etc.). However, the core tenet is a general focus on the environment, therefore a definition by Beamon (1999) is adopted as “the extension of traditional supply chains with the aim to reduce environmental impacts throughout its life cycle” and as definition of GSCM which gathers all GSM nuances: “the sum of green purchasing, green manufacturing, green distribution and marketing and reverse logistics” (Hervani, Helms and Sarkis, 2005; Linton, Klassen, and Jayaraman, 2007; Zhu and Sakis, 2006).
The interest of SGCM is focused on measuring the environmental performance on Supply Chains. Although the literature about performance measures for supply chains as it is shown in Agami, Saleh and Razmy (2012), provides an extended review and concludes that currently supply chain performance measurement frameworks can be classified into nine different groups, according to key criteria of measurement (i.e., SCOR). Most of these measures are inadequate for matching environmental sustainability and economic efficiency, leading to the emergence of a more inclusive green supply chain performance measures (GSC – PM).
Green Supply Chain Management
The Confederation of British Industries (CBI), 1994, observed that various factors as market expectation, risk management, regulatory compliance and business efficiency propel competitive advantage via environmental performance (Zhu, Sarkis and Geng, 2005).
The increasing interest in SGCM focused the attention on measuring the GSCM. Olugu and Wong (2009) made the importance of measurements understandable, if there are no measures, there will be no improvement. Regarding this point, there are several researches on the importance of focusing on the development of performance measures, to be used by a firm in deciding whether to continue with its current strategy or further improve it (Olugu and Wong, 2009). Therefore, the GSC-PM not only
© SELIS, 2018 Page | 65

facilitates the external reporting, internal control and analysis, it also plays an important role in the planning, design, implementation and monitoring of systems. Ahi and Searcy (2015) presents a wide range of metrics to measure the performance of green supply chains, Hervani, Helms and Sarkis (2005) proposed the use of ISO 14041 as a basis for the measurement of green supply chains, in relation to LCA for any kind of negative environmental impact (air, water, land pollution), waste of resources (energy, materials, products) and non-financial performance measurement systems (NPFMS) (Agami, Saleh and Ramsy, 2012). Different criteria have been used for measuring environmental impacts e.g. Chenga and Kincho(2011) used GreenSCOR based on SCOR () allowing to perform a construction project accounting of carbon considering all participating members along the supply chain as individual units and adding them to calculate the total. This technique is very useful in complex and temporary projects.
As shown the body of literature regarding the environmental performance is very vast, however, the main problem is concerned with the lack of standard for carbon footprint accounting, therefore each research based their calculation on the specification that fits their interests better, which usually depends on the country where they are placed. In a globalized work, where different stakeholders from diverse countries participate along the LCA of a product, it makes it difficult to aggregate the total accounting. This becomes more noticeable if the system from the consignment to the consignee is very complex with different participating means of transport from different countries, where each country could provide its own specification for each means of transport. The GLEC Framework (Smart Freight Center, 2016) was developed with the idea of developing a global methodology framework for logistics and transport systems based on existing methodologies and to fill gaps where necessary. It provides a much closer harmonized basis for the calculation of emissions from freight transport chains accross modes and global regions (Diekmann et al., 2014). This is possible by proposing a harmonized approach for data format, collection, analysis and reporting , because it uses the existing and most used methodologies within the Logistic sector as well as within global GHG accounting (specifically (Scope 3, 2011) and (Scope 3, 2014)). The principal objective is to improve the decision-making and effectiveness of reporting within the global logisitics sector by carriers, LSPs and shippers. One of the main difficulties to provide accurate results is the process of collecting data, (data from subcontracted is missing, not regionally specific and sometimes even unvailable). Hence, a collaborative platform for sharing information flows and using the same harmonized carbon footprint accounting method (GLEC Framework) regardless of the logistic and transport systems complexity takes an special meaning for overcoming the accuracy problems regarding data collection.
Focusing on Collaborative GSC, a wide range of research regarding manufacturing processes are found.Henriques and Sadorsky (1999) already showed the importance of enviromental managment for manufacturers due to the intense scrutiny they face from different stakeholders (end customers, suppliers, financial institutions). Therefore, different strategies have been taken to overcome impact of their activities on the enviromental sustainability, where many of them require varying degrees of interaction with other organizations in the supply chain. Vachon and Klassen (2008) focused the enviromental collaboration between a focal plant and its suppliers and/or its customers, demonstrated the influence of organizational collaboration in each direction empirically, the objective was examining the impact of Collaborative GSC practices such as: joint enviromental goal setting, shared enviromental planning, working together to reduce pollution or other enviromental impacts on manufacturing performance practices. Caning and Hanmer Lloys (2001) and Geffen and Rothenberg (2000), showed the importance of exchanging technical information and mutual willingness to learn about each other’s operations in order to improve environmental sustainability as well as (GEMI, 2004) required knowledge sharing activities pertaining to greener product design or process modification
© SELIS, 2018 Page | 66

Previous projects
GreenEFFORTS is a project primarily aimed at the reduction of energy consumption and to promote cleaner energy mixes at ports and terminals by developing a standardized carbon footprint accounting. This standardization is restricted to port and terminal, however there are other consecutive projects which aim at harmonized carbon footprint accounting for all logistics and transport systems: COFRET Project aimed at exploring the methodologies for the calculation of carbon footprint and other GHG emissions. In February 2014, COFRET’s Advisory Board joined forces with Smart Freight Centre to form the GLEC Project with the objective of developing a global methodology framework for logistics and transport systems based on existing methodologies and to fill any gaps as necessary. LEARN Project emerged in 2016 including GLEC members among other partners, industry associations and programs and its goal was to empower businesses to reduce their carbon footprint across the global logistics supply chain by facilitating measurement (using and improving the GLEC Framework), reporting and validation of (MRV) processes.
On the other hand, the following projects consider the carbon footprint as one of the goals requiring some grade of collaboration to achieve, however they do not consider the ways of calculating it. The first two projects regard manufacturing processes, ESAVE provides a modular and extendible collaboration and management platform by integrating ERP with automatic data capturing to collect data, monitoring the emissions and helping the decision makers. LOCIMAP justifies energy saving through highly integrated manufacturing on industry parks through the use of underpinning technologies. GREEN SUPPLY CHAIN2009 aimed at providing an innovative DSS linking financial health to impacts of pollution emissions. iCARGO takes the advantage of ICT solutions for optimizing the collaboration and information exchange in cooperative business networks in order to reduce the CO 2
emissions. GET SERVICE uses real time information to respond quickly to unexpected events during transportation by integrating this information into their existing TMS and enabling sharing information between transportation partners, LSPs and authorities. MODULUSHCA, required information sharing through the Physical Internet (PI) to optimize load factor and reduce the CO2 emissions and finally HIGH – TOOL aims at developing a high-level strategic transport model to assess economic, social and environmental impacts of transport policy, providing a web interface allowing users to assess the policy options.
Research Gap
The main research domains of this White Paper are logistics and transportation. It focuses only on the information level collaboration for facilitating the carbon footprint accounting and reporting regardless of combination of transhipments and means of transport from the consignment to the consignee, where multiple organizations could cooperate and suppose one of the activities for a product’s LCA.
Supply Chain OptimizationRetailers and suppliers’ collaboration allows them to respond with greater flexibility to external demand, enabling prompt response in cases of unexpected changes in demand or new requests from consumers.
The roots of collaboration in inventory replenishment trace back to the concept of efficient consumer response (ECR) that was applied in the grocery sector in the 1990s. Walmart successfully integrated its suppliers through applying an ECR strategy for offering its customers everyday low prices (EDLP) and quality products in a quicker, more efficient manner (Seifert, 2003). Thereafter, the replenishment © SELIS, 2018 Page | 67

mechanism evolves into continuous replenishment (CR), often called continuous replenishment planning (CRP) (Andraski, 1994). CR changes the replenishment process (from the traditional retailer generation of orders) to the replenishment of products based on actual and forecasted product demand through the use of electronic data interchange (EDI). CR links the supplier and the store-level retailer in a partnership that shares mutual information to generate orders and manage inventory. If the supplier (manufacturer) manages CR on its own, this replenishment mechanism is called vendor-managed inventory (VMI) (Cachon and Fisher, 1997; Sari, 2008). Based on sales and stock level of products, the vendor (supplier) of VMI decides when and how many products are shipped to the store-level retailers.
Collaborative planning, forecasting, and replenishment (CPFR), which was proposed by the Voluntary Inter-Industry Commerce Standards (VICS) in 1998, is a three-stage and nine-step procedure for companies who desire the implementation of a collaborative system in inventory management (VICS, 1998). Seifert (2003) considers CPFR to be the second generation of ECR. The objectives of CPFR include improving the accuracy of collaborative planning, collaborative forecasting, and collaborative replenishment, and dealing with exceptional events through cooperative partnering (Lyu et al., 2010).
Almedia et al. (2015) provide a comprehensive literature review on supply chain collaboration. They claim that VMI and CPFR are the two systems that provide a more efficient replenishment policy for companies. The replenishment policy is a major cause of the bull-whip effect (BWE) (Bhattacharya and Bandyopadhyay, 2011). By developing practices, such as VMI and CPFR, companies can align their inventory policies, avoiding the accumulation of unnecessary inventory that generates costs and obsolescence, mitigating the problems arising from the BWE. To that end, CPFR introduces a sequential approach that defines key actions to be undertaken during the formulation of collaborative initiatives.
Cassivi (2006) supports that CPFR captures the operational advantages of VMI and adds collaboration mechanisms to facilitate the exchange of information in different echelons of the SC. He shows that the advantages of CPFR are significant, namely, increased sales, reduced inventory, and improved customer service.
In addition to CPFR and VMI, two other techniques, namely Joint Economic Lot-sizing Problem (JELP) and Multi-agent simulation have been developed for collaborative inventory management; however these are less frequently used in the industry. For more information about these methods, we recommend Ertogral et al. (2007) and Ramanathan (2014), respectively.
In following subsections, VIM and CPFR (as the more efficient and applicable approaches in collaborative inventory management concept) will be briefly discussed.
Vendor Management Inventory (VMI)
VMI is a collaborative commerce initiative where suppliers are authorized to manage the buyer’s inventory of stock-keeping units. It integrates operations between suppliers and buyers through information sharing and business process reengineering. By using information technologies, such as © SELIS, 2018 Page | 68
Electronic Data Interchange (EDI) or Internet-based XML protocols, buyers can share sales and inventory information with suppliers on a real-timebasis. Suppliers can then use this information to plan production runs, schedule deliveries, and manage order volumes and inventory levels at the buyer’s stock-keeping facilities.The potential benefits from VMI are very compelling and can be summarized as reduced inventory costs for the supplier and buyer and improved customer service levels, such as reduced order cycle times and higher fill rates (Yao et al., 2007).The benefits, opportunities and performance of a SC arising from VMI collaborative initiative for suppliers and customers have been researched and documented by analytical means, simulation, and case studies (Disney and Towill, 2003a; Borade and Bansod, 2010; Tanskanen et al., 2009). The implementation of VMI eliminates a level of demand forecasting and ordering from the SC (Disney and Towill, 2003b).
The VMI can be applied only in an environment of mutual trust, credibility, incentive alignment, and long-term perspective between the collaborating companies. This is because the buying company will deliver replenishment control to the supplying partner –by doing so, it loses some control of its supply, being dependent to the supplier.
Collaborative Planning Forecasting and Replenishment (CPFR)
CPFR is a practice that was first registered as a trademark by the Voluntary Inter-Industry Commerce Standards (VICS) in 1998. CPFR is a three-stage and nine-step procedure for companies who desire implementation of a collaborative project and is defined by VICS as a collection of new business practices that leverage the Internet and EDI in order to achieve two goals: radically reduce inventories and expenses while improving customer service. CPFR as a practice-based technique originates from the launch of a comprehensive cooperative plan, then termed Collaboration Forecasting and Replenishment between Walmart and Warner-Lambert in 1995 (Cooke, 1998). This two-year project was supported by IT companies SAP and Manugistics, as well as by the consulting firm Benchmarking Partners. As part of this cooperation, Walmart and Warner Lambert independently calculated their demand six months in advance and collectively compared forecasts and resolved contradictions on a weekly basis. The project was monitored by VICS in order to develop an appropriate model to solve the collaborative forecasting problems, which was subsequently converted into CPFR (Seifert, 2003).
Skjoett-Larsen et al. (2003:532) define CPFR as “collaboration where two or more parties in the supply chain jointly plan a number of promotional activities and work out synchronized forecasts, on the basis of which the production and replenishment processes are determined”. The CPFR focuses on a strong link between business planning, forecasting and replenishment with wide information-sharing. Sari (2008) suggests that the benefits of CPFR are superior to the practice of VMI. In the VMI program, retailers are excluded from the process of demand forecasting as they only share sales data and inventory positions. CPFR can solve most of the problems found in the VMI program, but it requires that all members of the SC jointly develop demand forecasts, production planning and purchasing, and inventory replenishment. It adds value to the SC in the form of reduced inventory and increased level of customer service, by achieving better matching of demand and supply.© SELIS, 2018 Page | 69

The successful implementation of CPFR is not an easy task. In CPFR related literature, there is a business process guideline proposed by VICS (2004) which study the effects of retail events, such as promotion sales, in the CPFR methodology. They describe a standard business process model for retail event collaboration, along with implementation guidelines needed to support the process. The whole process is named “collaborative event strategy and planning” and can be incorporated to CPFR initiatives. Apart from CPFR, information-sharing topics related to supplier-retail collaboration on promotions include two areas. First, how to plan a promotion (Smaros, 2007) and, second, how promotions affect demand forecast (Ramanathan and Muyldermans, 2010; Ramanathan, 2014). Ovalle and Marquez (2003) classify the types of information needed to that end.
State of the practice
CPFR will be the basis for EGLS6 within SELIS for two reasons. First, it is compatible with the solutions developed in SELIS LLs. Second, CPFR is a generalized model which can be adapted to consider different level of collaboration (from VMI to full integration) and different business level activities (from production lot-sizing to transportation of goods). But as mention in the literature review part, the successful implementation of CPFR is not an easy task. Several authors stressed that CPFR must begin with only a few activities, after which it can gradually expand the scope of collaboration (Hollmann et al., 2015). Figure 11 shows the main components of CPFR model delivered by VICS roadmap in 2004.
© SELIS, 2018 Page | 70

Figure 11 CPFR Conceptual Model (VICS CPFR roadmap 2004).
Following parts describe the model overview, prerequisites for successful implementation and implementing diagram specifications.
Overview of CPFR model stages and required data
There are several categories of information should be prepared for as CPFR implementation prerequisites. Here we summarized the main categories.
Business plan Promotion plan New product introduction information Inventory data POS data and forecast Production and capacity plan Lead-time information
© SELIS, 2018 Page | 71

Table 5 depicts different categories of information needs in each stage of CPFR model.
Table 5 Required data matrix for different stages and steps (ECR Europe, April 2001).
Prerequisites for successful CPRF Implementation (based on Motorola Case study)
CPFR is an inter-company initiative that its implementation faces more difficulties and failure risks comparing to internal organization projects. “Motorola CPFR” is one of the successful CPRF implementation initiatives between the company and its retailers. In their report, Cederlund et al. (2007) outline that the success of Motorola’s CPRF program rests on the coordination changes for both participants. They also point out three group-activities as prerequisites for a successful CPRF implementation: (a) realigning the business strategies; (b) reworking key process; and (c) rethinking the organizational structure.
Realigning the business strategies
CPFR requires probably a fundamental change in business strategies, as both participants need to go along with all collaboration accepted agreements. Common and aligned goals should be established in both supplier and retailer strategic level and agreements must be reached on the level of information to be shared. Moreover, in this stage, both companies should have some collaboration practice to get closer and feel comfortable to share data with each other. For instance, they can have collaborative workshops and meetings to monitor the following: product availability, order confirmation, on-time delivery performance, flexibility of order quantity, order changes and order accuracy.
Reworking key process
© SELIS, 2018 Page | 72
To help rationalize business processes for planning, forecasting and replenishment, cross-functional groups should be set up at multiple points along the supply chain. The process includes periodic meetings for reviewing prior/current period sell-through, inventory position, and open orders. Additionally, the participants set up a new process for facilitating communication with marketing and finance. While regular telephone conferences keep the collaboration moving, the participant teams meet face to face every couple of periods.
Rethinking the organizational structure
The human resources (HR) representative in the project -with support of the company’s top management- shall refine the organizational structure to support collaborative relationship. One key change is the establishment of an account-based operations team in each participant (supplier / retailer). This team could directly discuss and collaboration issues with the counterpart team of the other participant. In the Motorola implementation case, they eliminated business planning and business analyst roles and create two new positions which were director of retailer operations and retailer alliance manager.
Figure 12 shows how Motorola and its retailer change their organizational structures based on setting up account-based operations teams.
Figure 12 Changing relationship with CPFR (based on Motorola Case study 2007).
CPFR Model Diagram
Inter-Industry Commerce Standards (VICS) first in 1998 proposed a basic CPFR model consist of three-stage and nine-step procedure for collaborative planning between supplier and manufacturer.© SELIS, 2018 Page | 73
The following diagram (Figure 13), describes clearly the main steps of the model, actions and relations.
Figure 13 CPFR Process Steps – Adopted from VICS – CPFR Generic Model (ECR Europe, April 2001).
Basic requirements for implementing CFPR
Based on literature review and best previous practice studies on CPFR implementation, there are some basic requirements for both suppliers and retailers to get ready for a successful implementation. Table 6 demonstrates requirements for supplier and retailer respectively. In both tables, requirements are classified based on four areas of involvement and three levels of implementation complexity.
Table 6 Supplier requirements for CPFR (ECR Europe, April 2001).
© SELIS, 2018 Page | 74

Table 7 Retailers requirements (ECR Europe, April 2001).
CPFR Model Implementation Diagram
Finally, the following diagram clarifies different phases during implementation process. As shown in the diagram, there is a pre-implementation (preparation) phase which comprises internal readiness, trading partner segmentation and defining implementation strategy. The whole diagram is based on the PDCA concept which encompasses planning, do, check and act in different steps of implementation algorithm.© SELIS, 2018 Page | 75
Preparation: Considering the essential stages to assess a company’s internal requirements and capabilities. Implementation Models: three different implementation choices varying in scope, company requirements and impact that target to facilitate the implementation of CPFR in distinct situations.CPFR Development Plan: guidelines that help companies in defining the other steps following the first phase of a CPFR initiative.Assessment of Collaborative Results: the final step in the process is to fully assess the results of the collaboration initiatives and to re-evaluate the previously defined CPFR implementation strategy. Figure 14 illustrates this process.
Figure 14 CPFR general implementation diagram (ECR Europe, April 2001).
Figure 14 shows the implementation phase of Figure 15 more precisely. Based on the level of collaboration, degree of information sharing and business managers’ requirements this part of model could implement in basic, developing and advanced level. In the advanced level, all the required information from both upstream and downstream sides of supply chain go through the model in order to use for optimizing 3 modules of promotion planning, demand forecasting and replenishment order planning will be provided and used in the model.
© SELIS, 2018 Page | 76

Figure 15 CPFR Implementation detailed model.
© SELIS, 2018 Page | 77
Obstacles and barriers
Byrne and Heavy (2006) identify 13 significant CPFR barriers based on expert opinion, organized in four groups: managerial, process, technological, and cultural. Their analysis indicates that managerial barriers are a significant root cause for both process and cultural barriers, but also for implementation difficulties. They also claim that although the importance of information technology to launch collaborative schemes has been addressed by many scholars, technology alone is not the complete solution for successful CPFR implementation. Here we briefly report the main barriers based on Byrne and Heavy’s (2006) work.
• No shared targets • Lack of visible and effective Leadership • Executive and management support obstacles • Lack of forecasting processes and resources • Difficulties with information sharing process • Benefits difficult to calculate • Fear of losing competitive information • Difficulties with real-time coordination of information exchange • Lack of compatibility of partners’ abilities • Lack of commitment to share information • Lack of partner trust • Lack of internal alignment
© SELIS, 2018 Page | 78

4 Development plans and Expected Outcomes
Collaborative Planning and Synchromodal TransportThis section describes the scope of the academic research we will carry out, as well as, the domain of the applications considered in this EGLS.
Logistics and transport are the two wide domains this research belongs to. More specifically, the focus is on collaborative logistics, both horizontal and vertical cooperation, and container transport as we will consider multiple organizations cooperating in a hinterland container transport network. Studying hinterland networks is bringing this research away from the specific problems of maritime systems. Moreover, the empty container repositioning problem will not be considered. Operational planning is going to be the prominent focus of this study, therefore, excluding the tactical and strategic planning.
The cooperative aspect of this research belongs to the domain of game theory, in general, and cooperative game theory, more specifically. Solution concepts for cooperative games will be considered, as well. We will not study pricing models unless those might become relevant as effective coordinating mechanism under a collaborative agreement.
In both research gap directions that were presented, the concept of value of information was clearly underlined. Therefore, assessing the value of information is another domain of this research.
When coming to the applications of this research, the domains of container transport and urban distribution are included. Indeed, while container transport can be seen as transport of standardized cargo units, urban transport can be tackled similarly as a special case of a transport setting where a variety of units is used
Solutions to be developed
This section illustrates different solutions that will be developed by addressing the research gap. Managerial insights will be presented first, followed by tools that will be developed because of prior investigations.
Although one can easily understand that cooperation in a transportation system is a way to produce benefits and create innovative solutions, one can also easily glimpse the higher level of complexity that is brought into play by collaboration. This simplified argument on the possible benefits and on the complexity of cooperation motivates the need for providing practitioners with well-formulated and educated insights. Indeed, to extract value from collaborations it is important that organizations can easily understand and evaluate their position with respect to others in terms of collaborating opportunities, rather than competing advantages. The research aiming at filling the first gap described in Section will accomplish this claim. Understanding the value of different collaboration levels is directly aligned with this purpose. Moreover, establishing the value of information sharing in the collaborations will allow network operators to confidently share operational information and exchange information with other partners in a cooperation.
The investigation that will be carried out on the definition of reliability will provide insights on how to improve transport services and lever on reliability to further promote one’s position in the network. Studying the price of reliability will provide guidance on at what costs an organization can improve its reliability or sell services with different reliability levels. In this analysis of reliability, the study of stochastic combinatorial models will be the predominant source of remarks.
© SELIS, 2018 Page | 79
In addition to managerial insights, new tools to plan and execute transport service in a cooperative environment will be needed. While providing insights gives guidance in evaluating the potential benefits of a collaboration, developing tools for operationalizing this cooperation will be done to allow stakeholders to fully achieve the expected performance targets. Those tools will be developed from the synchromodal cooperative planning models. Indeed, our investigations will foresee and address real-world planning issues that would be otherwise hindering the value of cooperatively planning itself.
From the above presentation of the research solution to be developed, it is possible to highlight IT solutions that should be implemented next. We first describe general features of the IT system and, then, connect the IT solution with the managerial insights and the tools that will be developed.
In general, the designed IT system should be flexible in terms of being able to connect many players. Moreover, the entrance and exit from the system should be easy both in terms of IT complexity and in terms of having minimal legal- and cost-related barriers. Such a system should also enhance visibility in the transport chain by allowing cooperating stakeholders to share operational information. Allowing visibility only within a collaboration is critical: stakeholders should trust the way the platform shares their information.
Following the results from the investigation of the impact of different collaboration levels on synchromodal transport, the system should reproduce a practically viable Collaborative Synchromodal Planning Toolbox. From the analysis, it will be possible to assess what would be the characteristics of such a tool, therefore, guide an implementation that already incorporates those findings. This Toolbox will use information on the resources shared by the different organizations to allow network operators and carriers to plan synchromodal transport by having a clear view on the value of different performance measures of a possible plan.
Following the study on reliability, a Network Reliability Tool should be devised and implemented within the SELIS platform: using data related to schedules and the actual realization of transport, the system should be able to provide insights into the reliability of different transport services operating in the network. Such a tool will show how the reliability of an overall transport solution depends on that of the services involved. The implementation of this feature should follow the research results on the definition of reliability itself.
From this perspective, the Publish & Subscribe system can be used to notify carriers in real-time and use sensor data to automatically trigger notifications. We provide some examples of possible messages that can be shared:
if a service is delayed, notify the following service connected to the previous one; if a terminal is congested, notify incoming barges; if a disruption occurs, notify all services using that leg of the network; if the planned arrival of a service is changed, notify the stakeholder at the arrival facility; if a service is not on the planned schedule and track, notify the service owner for reaction.
A case study proper for urban transport would require similar solutions. A system with the previous requirements will then allow for dynamic planning and routing with the following extras required by EGLS2:
Integration of the external data (weather data and traffic events) from the Publish &subscribe system
Real-time monitoring of the different events allows proactive action according to a set of predefined operational rules; for example:
o If there is an expected delay of less than 10 minutes for a specific customer, do nothing;
© SELIS, 2018 Page | 80

o If there is an expected delay of 10 to 30 minutes, notify the customer by e-mail;o If there is an expected delay of more than 30 minutes, notify the planning department
to see if it is possible to reroute the vehicle
Expected Value
Finding an answer to those questions will have double impact of both academic and practical relevance. First, this research will produce planning methods for collaboratively organize synchromodal transport solutions. Indeed, in order to analyse performances of a synchromodal transport network, it is required to have a mathematical description for such a type of transport solution. Second, consultants and stakeholders can have managerial insights into how collaborative agreements should be designed to be successful in terms of synchronization of resources, and what are the possible operational dynamics that can be expected when certain agreements have been made. Third, the academic community will find a framework that can be used to further dissect cooperation in container transport. Setting a ground for formal research will have a positive effect to stimulate different fields. Moreover, this white paper poses research questions that remained unresolved, as the research gap analysis demonstrated.
The research developed following the research agenda will lead to innovative business cases in the domain of synchromodal transport. When these research questions have been answered, and when the associated solution directions have been shared with stakeholders in the Living labs and with the Technology Providers, who help build the collaborative platform, decision makers are able to:
Determine the various levels of information exchange and collaborative agreements, and the benefits in terms of enhanced network performance.
Decide which level of collaboration and information sharing among the incumbent stakeholders fits best with the associated performance levels, while considering less quantifiable drivers and barriers for the adoption of the collaborative platform.
New entrants to the collaborative platform can be assessed on their value added.
Businesses will benefit from the findings of this research. We noticed that various stakeholders are interested in synchromodal transport but, at the same time, the benefits and risks of engaging in synchromodal solutions and collaborations have not been quantified and are not yet fully understood. This may cause stakeholders to be conservative in embarking on synchromodal transport solutions and collaboration. Therefore, addressing the research questions may also favour the adoption of synchromodality and collaboration by the various stakeholders.
Collaboration Risk and Value Sharing This section describes the scope of the academic research we will carry out, as well as, the domain of the applications considered in this EGLS.
Third, gain and risk sharing methodologies that are investigated in this strategy require optimal knowledge of the different costs, benefits and risks that are linked to a certain collaborative scheme and rely on supply chain cost and risk evaluation models. We will provide sample applications of these models in order to demonstrate their use within the strategy, but we do not envision to further develop these aspects as supply chain economic and risk assessment methods have been extensively covered in the literature and in practice. © SELIS, 2018 Page | 81

When coming to the applications of this research, the domains of container transport and urban distribution are included.
Solutions to be developed
Once different processes have been identified, it is necessary to develop ICT solutions that support the different processes. In this section of the document, we will explain the preliminary description of tools that need to be developed.
ICT tools that allow to increase the visibility on the collaboration
This could include tools that offer dashboard views on the benefits and risks of a collaboration (including revenue management tools as well as tools for mapping and visualizing the collaborative risks) or simulation tools that allow assessing the impact of different collaborative agreements or risk mitigation strategies. Indeed, in the hyper-connected operating environment, cost allocation is not as clear as in current supply chains.
Expected Value
To remedy the suboptimal logistics organization, this strategy will promote the establishment and the maintenance of collaborative logistics networks by establishing a structured collaboration framework which aims at facilitating information sharing, gain sharing/pricing and contracting/risk sharing between stakeholders taking part in a collaborative network. In particular, it will allow for:
Increasing visibility on the costs, benefits and risks of the existing collaborations enabling monitoring and adjusting the design of different collaborations in order to maximize their profitability and decrease the associated risks.
Assessing the costs, benefits and risks of the potential collaborations in order to select those that bring the most value.
Reduction of the time and effort necessary for setting-up new collaborations through a trusted and seamless process, ultimately leading towards higher levels of logistics optimization and decreased costs.
Enabling of ad-hoc collaboration through a trusted and seamless process which considers the associated risks and benefits, ultimately leading towards higher levels of logistics optimization and decreased costs.
Visibility and CAPA
Solutions to be developed
ICT for improved visibility (ALICE 2014) road map Information Systems for Interconnected Logistics)
o Overcoming data-sharing barriers in collaborative networkso Data correctness, timelinesso Internet of service, Internet of things
© SELIS, 2018 Page | 82
Data analytics to support for improved resilience and agility in transport and logistics (effective exploitation of visibility)
o Risk management o Event detection, anticipation (effective/efficient monitoring)
Dynamic capabilities, dynamic (re)-planning o CAPA strategies to overcome the lack of visibility
New business modelso Based on information sharing; information as a service, data as a product
Improving environmental performance
While other strategies aim at achieving environmental efficiency (optimizing on cost, time, emissions per tonne-km), such as EGLS1 & 2, the EGLS "visibility and CAPA" can provide a tool for environmental performance management. This can be done by defining preventive and corrective actions to reduce the environmental impact of supply chain (at cargo, shipment, and transport asset level).
o Anticipation of environmental impact (CO2 emission): combining real-time information and historical data to estimate the real emission per tonne-km of own shipment under planning
o Corrective actions: Identify possible changes in transport plano Populate emission database for improving planning (and preventive actions)
In brief, the foreseen innovation lies in the visibility and dynamic capabilities which can be offered by improved ICT and Internet-based technologies which can in turn contribute to improved business performance for both transport services providers and transport service clients, resulting in overall improvement at the supply chain level.
Expected Value
The different strategies proposed to optimize visibility and CAPA, and thereby either exploiting higher visibility or overcoming the lack of visibility, will lead to specific benefits such as full shipment visibility for transport/logistics service providers and transport service clients, access to information or descriptive analytics for supply chain actors, and enabling information sharing across the supply chain, thus facilitating horizontal and vertical collaboration across the parties involved. Event monitoring based on real-time information will allow reliable deviation detection and facilitate taking appropriate corrective actions such as dynamic re-planning and rerouting. On that basis and together with predictive strategies and forecasting, the flexibility and resilience of supply chains will be improved, leading to considerable optimization of the efficiency of supply chains and an improved service level for customers. Within transport and logistics (scope for EGLS3) visibility has multiple facets and goes hand-in-hand with corrective and preventive actions.
Taking a stakeholder perspective, visibility varies in terms of who needs visibility and about what. A transport service client needs visibility about transport capacity to plan shipment and about shipment under delivery, while a transport service provider needs visibility of demand for planning transport capacity and schedules, and about own transport resources for enabling best possible match asset-cargo. In addition, several transport service providers that are collaborating need access to some of each other’s service details.
© SELIS, 2018 Page | 83

Supply Chain Financing
Solutions to be developed
While the solutions under development are at the leading edge of supply chain financing field, we do not foresee any innovation in the sense of introducing solutions that have never been applied so far in the industry.
Expected Value
The business relevance of supply chain financing is obvious. Such instruments can play a vital role in a company’s supplier relationship management, facilitating the delivery of core business strategies relating to growth, innovation and risk management.
Environmental Performance Management
Solutions to be developed
The solution to be developed will be a collaborative Carbon Footprint Reporting computational resource as a service, with a REST based API (DoA). The heart of this application will be based on the GLEC framework (SFC, 2016) which harmonized the methodologies and provide a guidance to perform the accounting and a harmonized approach for data format, collection, analysis and reporting. The stakeholders will be able to provide the information flows to perform the carbon footprint accounting and to visualize the results transparently through a user interface (benchmarks, CAPA, dashboards, etc.).
GLEC Framework Database
Information Flows
Input Data:
Input data will be facilitated by a user-friendly interface which will ask for different information depending on the scope or role:
Scope 1: Fuel consumption from mobiles sources (vessels and vehicles owned by the company), this includes all journeys considering return or repositioning times and this calculation is based on data fuel use, distance and shipment weight.
Scope 1 & 2: Fuel consumption from transhipment centres considering activities pertaining to the storage and movement of freight.
Scope 3: Calculations require the reporting company to gather the consumption factors from subcontractors, afterwhich the total emissions would be calculated combining the total work done for shipments transported by each carrier.
Vehicles and vessels (scope 1) will have the possibility to integrate data provided on real time automatically using the Internet protocol directly from the vehicle, to the core of the application.
Output data:
The results will be reported by a user-friendly interface with different purposes:
© SELIS, 2018 Page | 84

Real Time carbon footprint monitoring Benchmarking
It will provide a benchmarkwhich will use the following emission factors as baselines for each mode of transport:
HBFA (Handbook of Emissions Factors for Road Transport) CCWG (Clean Caro Working Group for Sea Transport)
NTM (Network for Transport Measures for Air Transport)
Reporting, labelling and certification
Data gathering using GLEC Framework can be used for reporting ensuring the GHG Protocol standards (WRI & WBCSD, 2011, 2004) requirements in case of reporting corporate level GHG – inventories. In case of individual reporting schemes, GLEC Framework provides a list of good practices collected from various recognized sources as DEFRA, CEN, US EPA and WRI & WBCSD.
Trade regulations and customer preferences are encouraging firms to perform a bigger compromise and provide more accurate data.
CAPA, DSS, Simulation
Expected Value
Carbon footprint as a Key Performance indicator will be used to:
Develop a dashboard to identify bad practices along the supply chain and perform corrective or preventive actions.
Anticipate new trade regulations applied to the carbon footprint. Satisfy new customers’ preferences (facing two products with same quality, balance will decant
to the one who demonstrate a sustainability process along its life cycle, which includes logistics and transport services).
Establish new logistics and transports sharing agreements regarding: an improved use of resources, selecting the most sustainable options to renew assets based on decision support systems, and simulation tools which will accomplish a harmonized methodology for the carbon footprint accounting independently of the country and complexity of the supply chain.
Supply Chain Optimization
Solutions to be developed
In this section, we describe the steps of implementing CPFR model in practice within SELIS project. We developed this procedure based on literature and previous best-practice implementations. As highlighted in the literature, implementing a comprehensive CPFR model successfully requires several changes in the managerial practices among the participants but also some cultural shift. Based on these lessons learned, our goal is to develop a simplified version of CPFR while focusing on incentive alignment. © SELIS, 2018 Page | 85

Although we are going to implement a customized CPFR in the SELIS platform, we will maintain all the main stages and most of the steps of the basic model. Table 8 demonstrates the difference between the original and customized model.
Table 8 Comparing original and customized CPFR.
As it is clear in table 8, the only changes to the original model are related to steps of “Create sales forecast”, “Identifying sales exceptions” and “Delivery execution”. The first two steps in our customized model are delivered by the retailer, but they would be shared with the supplier and get its approval before being implemented. Delivery would be executed by the supplier but with complete collaboration with the retailer. Based on the shipment and delivery status in supplier’s side, the on-order inventory notification would be changed (online or offline) in collaborative platform.
Expected Value
An Inventory Management Toolbox incorporates business analytics, dynamic planning (using simulation), and execution. It involves the development of a collaborative environment (through an information-sharing application) that will consider inventory data (at both retailer and supplier), incentive alignment, and collaborative forecasting and promotion planning.
© SELIS, 2018 Page | 86

In this toolbox, we expect to use different types of information to be shared by the supplier and retailer, in order to coordinate demand forecasting, replenishment ordering policies, and promotions planning. Once the system is in place, an assessment will take place regarding the impact of collaboration on reducing inventory costs, including service performance in promotion events.
E-compliance and Customs
Solutions to be developed
The foreseen innovations relate to the establishment and evaluation of the logistics and commercial data pipeline models and standards. These two data pipelines, along with the regulatory pipeline, depending on how it is implemented, should provide similar if not the same benefits as a full single window implementation. One of the main objectives from this part of the project, should be to explore how such commercial initiatives could in fact provide the same trade facilitation results as foreseen in the UNECE Recommendation 33 on Single Window implementation. This could in turn provide an alternative for EU member states with their obligations under the WTO TFA to put in place national single windows.
The solution includes the development of advanced features of a business analytics tool to identify reliably high-risk consignments, secure trade lanes and high-risk operators while using data from the two data pipelines.
Expected Value
The expected value of these solutions is twofold, namely:
There is relevance for business: supply chain visibility for more efficient and effective compliance management, but also more general benefits based on supply chain visibility.
There is relevance for authorities: better assessment of supply chain compliance, based on declarations and data obtained from commercial and logistics data pipelines following a system-based approach.
© SELIS, 2018 Page | 87

5 Bibliography Abatello, L. (2016). Full Digitalisation – An Optimised Supply Chain. Edition 71. Retrieved from
WWW.PORTTECHNOLOGY.ORGAeppel, T. (2010). ‘Bullwhip’ hits firms as growth snaps back. Wall Street Journal, January 26.Agami, N., Saleh, M., & Rasmy, M. (2012). Supply Chain Performance Measurement Approaches: Review
and Classification. Journal of Organizational Management Studies.Agarwal, R., & Ergun, Ö. (2010). Network Design and Allocation Mechanisms for Carrier Alliances in
Liner Shipping. Operations Research 58 (6). INFORMS : 1726–42. doi:10.1287/opre.1100.0848.Ahi, P., & Searcy, C. (2015). An analysis of metrics used to measure performance in green and
sustainable supply chains. Journal of Cleaner Production, 86:360-377.Alias, C., Rawet, V. L., Neto, H. X. R., & Reymão, J. D. E. N. (2016). Investigating into the Prevalence of
Complex Event Processing and Predictive Analytics in the Transportation and Logistics Sector: Initial Findings From Scientific Literature. In MCIS (p. 2).
ALICE (2014). Information systems for interconnected logistics. Retrieved from http://www.etp-logistics.eu/wp-content/uploads/2015/08/W36mayo-kopie.pdf
ALICE (2014a). Global Supply Network Coordination and Collaboration Research & Innovation Roadmap.ALICE (2014b). ALICE Recommendations to H2020 Work Programs 2016-2017.Allen, J., & Browne, M. (2010). Considering the relationship between freight transport and urban form.
Green Logistics.Almeida et. al (2015). Mitigation of the bullwhip effect considering trust and collaboration in supply
chain management: a literature review. The International Journal of Advanced Manufacturing Technology, Volume 77, Issue 1–4, pp 495–513.
Andersen, J., Crainic, T. G., & Christiansen, M. (2009a). Service network design with asset management: formulations and comparative analyses. Transportation research part C: emerging technologies, 197-207.
Andraski, J.C. (1994). Foundations for successful continuous replenishment programs. The International Journal of Logistics Management 5 (1):1–7.
Aqlan, F., & Lam, S.S. (2015). A fuzzy-based integrated framework for supply chain risk assessment. International Journal of Production Economics 161, 54–63. doi:10.1016/j.ijpe.2014.11.013
Bai, R., Wallace, S.W., Li, J., & Chong, A.L. (2014). Stochastic service network design with rerouting. Transportation Research Part B: Methodological 60, 50–65.
Ballot, E., Gobet, O., & Montreuil, B. (2012). Physical internet enabled open hub network design for distributed networked operations, in: Service Orientation in Holonic and Multi-Agent Manufacturing Control. Springer, pp. 279–292.
Barratt, Mark (2004). Understanding the Meaning of Collaboration in the Supply Chain. Supply Chain Management: An International Journal 9 (1): 30–42. doi:10.1108/13598540410517566.
Beamon, B. (1999). Designing the green supply chain. Logisitic Information Management, 12 (4) 332-342.Beamon, B.M. (1998). Supply chain design and analysis: Models and methods. International journal of
production economics, 55(3), pp.281-294.Beamon, B.M. (1998). Supply chain design and analysis: Models and methods. International journal of
production economics, 55(3), pp.281-294.Behdani, B., Fan, Y., Wiegmans, B., & Zuidwijk, R. (2014). Multimodal Schedule Design for Synchromodal
Freight Transport Systems (SSRN Scholarly Paper No. ID 2438851). Social Science Research Network, Rochester, NY.
Berger, A. N., & Udell, G. F. (1998). The economics of small business finance: The roles of private equity and debt markets in the financial growth cycle. Journal of banking & finance, 22(6-8), 613-673.
© SELIS, 2018 Page | 88

Bhattacharya, R. and Bandyopadhyay, S. (2011). A review of the causes of bullwhip effect in a supply chain. The International Journal of Advanced Manufacturing Technology. 54 (9–12): 1245–1261.
Bock, S. (2010). Real-time control of freight forwarder transportation networks by integrating multimodal transport chains. Eur. J. Oper. Res. 200, 733–746.
Bontekoning, Y., & Priemus, H. (2004). Breakthrough innovations in intermodal freight transport. Transportation Planning and Technology, 27(5), 335-345.
Borade, A. B., & Bansod, S. V. (2010). Study of vendor-managed inventory practices in Indian industries. Journal of Manufacturing Technology Management, 21(8), 1013-1038.
Bowen, F., Cousins, P., Lamming, R., & Faruk, A. (2001). The role of supply management capabilities in green supply. Production and Operations Management, 10 (2) 174-89.
Bryant, C., & Camerinelli, E. (2013). Supply chain finance: EBA European market guide. Euro Banking Association. Version 1.0.
Buzacott, J. A., & Zhang, R. Q. (2004). Inventory management with asset-based financing. Management Science, 50(9), 1274-1292.
Byrne, P.J. & Heavy, C. (2006). The impact of information sharing and forecasting in capacitated industrial supply chains: A case study, International Journal of Production Engineering. 103(1):420-437.
Cachon, G. P. (2003). Supply chain coordination with contracts. Handbooks in operations research and management science, 11, 227-339.
Cachon, G., & Fisher, M. (1997). Campbell soup’s continuous replenishment program: evaluation and enhanced inventory decision rules. Production and Operations Management 6 (3): 266–276.
Camarero, R. (2011). La huella de carbono en las actividades logísticas. Guía de calidad medioambiental. Laureano Vegas. Departamento de comunicación Centro Español de Logística.
Canning, L., & Hanmer Lloyd, S. (2001). Managing the environmental adaptation process in supplier–‐customer relationships. Business Strategy and the Environment, 10(4), 225-237.
Capgemini Consulting. (2012). Supply Chain Visibility, 2012Capgemini Consulting. (2016). The Current and Future State of Digital Supply Chain Transformation,
available on www.capgemini-consulting.fr/digital-supply-chain-transformation-surveyCaridi, M., Crippa, L., Perego, A., Sianesi, A., & Tumino, A. (2010). Measuring visibility to improve supply
chain performance: a quantitative approach. Benchmarking: An International Journal, 17(4), 593-615.
Caridi, M., Moretto, A., Perego, A., & Tumino, A. (2014). The benefits of supply chain visibility: A value assessment model. International Journal of Production Economics, 151, 1-19
Caris, A., Macharis, C., & Janssens, G. K. (2008). Planning problems in intermodal freight transport: accomplishments and prospects. Transportation planning and technology, 277-302.
Cassivi, L. (2006). Collaboration planning in a supply chain. Supply Chain Management: An International Journal, 11(3), 249-258.
Cederlund, JP., Kohli, R., Sherer, SA., & Yao, Y. (2007). How Motorola Put CPFR into Action, Supply Chain Management Review, 11(7): 28-35.
Chenga, J., & Kincho, H. (2011). A web service framework for environmental and carbon footprint monitoring in construction supply chains. Pocedia Engineering; The Twelfth East Asia-Pacific Conference on Structural Engineering and Construction.
CO3. (2016). co3 | Collaboration Concepts for Co-modality.COFRET. (2011-2014). Retrieved from Carbon footprint of freight transport (FP7): http://www.cofret-
project.eu/Cohen, M.A. & Lee, H.L. (1990). Out of touch with customer needs? Spare parts and after sales service.
MIT Sloan Management Review, 31(2), p.55.
© SELIS, 2018 Page | 89

Cohen, M.A. & Lee, H.L. (1990). Out of touch with customer needs? Spare parts and after sales service. MIT Sloan Management Review, 31(2), p.55.
Cooke, J.A. (1998). Into the great wide open. Logistics Management & Distribution Report. 37(10):84-7. Cormen, T.H. (2009). Introduction to algorithms. MIT press.Craig, A., Blanco, E., & Sheffi, Y. (2013). Estimating the CO2 intensity of intermodal freight
transportation. Transp. Res. Part D: Transp. Environ. 22, 49–53.Crainic, T. (2000). Service network design in freight transportation. Eur. J. Oper. Res. 122, 272–288.Crainic, T. , Fu, X. , Gendreau, M. , Rei, W. , & Wallace, S.W. (2011). Progressive hedging-based
metaheuristics for stochastic network design. Networks: An International Journal 58 (2), 114–124.Crainic, T. G., & Rousseau, J. M. (1986). Multicommodity, multimode freight transportation: A general
modeling and algorithmic framework for the service network design problem. Transportation Research Part B: Methodological, 20(3), 225-242.
Crainic, T. G., Ricciardi, N., & Storchi, G. (2009). Models for evaluating and planning city logistics systems. Transportation science, 43(4), 432-454.
Crainic, T., & Kim, K. (2007). Intermodal transportation. In C. Barnhart, & G. Laporte (Eds.), Transportation. Handbooks in operations research and management science (Vol. 14, pp. 467–537).
Crainic, T., & Laporte, G. (1997). Planning models for freight transportation. Eur. J. Oper. Res. 97, 409–438.
Crainic, T.G., & Gendreau, M. (2003). Advanced Fleet Management Systems and Advisors: Converging Decision Technologies for ITS and E-Business, CD-ROM 10th World Congress on Intelligent Transport Systems. Madrid, Spain.
Crainic, T.G., & Laporte, G. (1997). Planning Models for Freight Transportation. European Journal of Operational Research 97 (3): 409–38. doi:10.1016/S0377-2217(96)00298-6.
Crainic, T.G., & Montreuil, B. (2016). Physical Internet Enabled Hyperconnected City Logistics. Transportation Research Procedia, Tenth International Conference on City Logistics 17-19 June 2015, Tenerife, Spain 12, 383–398. doi:10.1016/j.trpro.2016.02.074
Crainic, T.G., Ricciardi, N., & Storchi, G. (2004). Advanced Freight Transportation Systems for Congested Urban Areas. Transportation Research Part C: Emerging Technologies 12 (2): 119–37. doi:10.1016/j.trc.2004.07.002.
Cruijssen, F. (2012). Framework for Collaboration: A CO3 Position paper. Collaboration Concepts for Co-modality.
Cruijssen, F., Borm, P., Fleuren, H., & Hamers, H. (2005). Insinking: a methodology to exploit synergy in transportation.
Cruijssen, F., Dullaert, W., Fleuren, H. (2007). Horizontal cooperation in transport and logistics: a literature review. Transportation journal 22–39.
Dablanc, L., 2011. City distribution, a key element of the urban economy: guidelines for practitioners. City distribution and urban freight transport: multiples perspectives 13–36.
Dai, B., & Chen, H. (2011). A multi-agent and auction-based framework and approach for carrier collaboration. Logist. Res. 3, 101–120. doi:10.1007/s12159-011-0046-9
Danielis, R., Rotaris, L., & Marcucci, E., (2010). Urban freight policies and distribution channels: a discussion based on evidence from Italian cities.
Demica (2013). Linked in? Building sustainable strength in German - Central European supply chains. Retrieved from http://www.demica.com/images/PDFs/linked_in_demica_research_ report_20.pdf.
Demir, E., Burgholzer, W., Hrušovský, M., Arıkan, E., Jammernegg, W., & Van Woensel, T. (2016). A green intermodal service network design problem with travel time uncertainty. Transportation Research Part B: Methodological, 93, 789-807.
© SELIS, 2018 Page | 90

Diekmann, D., Auvinen, H., Clausen, U., Davydenko, I., Ehrler, V., & & Lewis, A. (2014). Calculating emissions along supply chains-Towards the global methodological harmonization. Research in Transportation Business & Management, 12, 41-46.
Disney, S. M., & Towill, D. R. (2003). On the bullwhip and inventory variance produced by an ordering policy. Omega, 31(3), 157-167.
Disney, S. M., & Towill, D. R. (2003). Vendor-managed inventory and bullwhip reduction in a two-level supply chain. International journal of operations & production Management, 23(6), 625-651.
Doukidis, G.I., Mason, R., Lalwani, C., & Boughton, R. (2007). Combining vertical and horizontal collaboration for transport optimization. Supply Chain Management: An International Journal 12, 187–199.
Ducret, R., & Delaître, L. (2013). Parcel delivery and urban logistics-changes in urban courier, express and parcel services: the French case. In 13th World Conference on Transport Research, July 15-18, 2013-Rio de Janeiro, Brazil.
ECR Europe (2001). Guide to CPFR Implementation, by Accenture. Eng-Larsson, F., & Kohn, C. (2012). Modal shift for greener logistics–the shipper's perspective.
International journal of physical distribution & logistics management, 42(1), 36-59.Ertogral, K., Darwish, M., & Ben-Daya, M. (2007). Production and shipment lot sizing in a vendor–buyer
supply chain with transportation cost. European Journal of Operational Research 176 (3): 1592–1606.
ESAVE. (2012-2104). Energy Efficiency in the supply chain through Collaboration, Advanced Decision Support and Automatic Sensing. Retrieved from http://cordis.europa.eu/project/rcn/101843_en.html
Esmaeili, M., Aryanezhad, M. B., & Zeephongsekul, P. (2009). A game theory approach in seller–buyer supply chain. European Journal of Operational Research, 195(2), 442-448.
Esmaeili, M., Aryanezhad, M. B., & Zeephongsekul, P. (2009). A game theory approach in seller–buyer supply chain. European Journal of Operational Research, 195(2), 442-448.
European Commission. (2013). COMMUNICATION FROM THE COMMISSION TO THE EUROPEAN PARLIAMENT, THE COUNCIL AND THE EUROPEAN ECONOMIC AND SOCIAL COMMITTEE on Customs Risk Management and Security of the Supply Chain, Brussels, 8.1.2013
Farvolden, J. M., & Powell, W. B. (1994). Subgradient methods for the service network design problem. Transportation Science, 28(3), 256-272.
Fjortoft, K. E. et al. (2011). Maritime Transport Single Windows: Issues and Prospects, in: International Journal on Marine Navigation and Safety of Sea Transportation, Volume 5, Number 3, September 2011
Geffen, C., & Rothenberg, S. (2000). Suppliers and Environmental Innovation: The Automotive Paint Process. International Journal of Operations & Production Management, 20(2):166-186.
Gelsomino, L. M., Mangiaracina, R., Perego, A., & Tumino, A. (2016). Supply Chain Finance: Modelling a Dynamic Discounting Programme. Journal of Advanced Management Science Vol, 4(4).
GET SERVICE. (2012-2015). Retrieved from GET SERVICE: http://getservice-project.eu/Goel, A. (2010). The value of in-transit visibility for supply chains with multiple modes of transport. Int. J.
Logist. Res. Appl. 13, 475–492.Gonzalez-Feliu, Jesus. (2011). Costs and Benefits of Logistics Pooling for Urban Freight Distribution:
Scenario Simulation and Assessment for Strategic Decision Support. In Seminario CREI.Gorris, T., Groen, T., Hofman, W., Janssen, R., Meijeren, J. Van, & Oonk, M. (2011).
Implementatieroadmap Synchromodaliteit. Delft, The Netherlands.GReen EFFORTS. (2012-2014). Retrieved from http://cordis.europa.eu/project/rcn/102782_en.htmlGREEN SUPPLY CHAIN 2009. (2010-2012). Retrieved from GREEN SUPPLY CHAIN 2009:
http://cordis.europa.eu/project/rcn/95883_es.html© SELIS, 2018 Page | 91

Guajardo, M., Rönnqvist, M. (2016). A review on cost allocation methods in collaborative transportation. Intl. Trans. in Op. Res. 23, 371–392. doi:10.1111/itor.12205
Haller, A., Pfoser, S., Putz, L. M., & Schauer, O. (2015, July). Historical Evolution of Synchromodality: A First Step Towards the Vision of Physical Internet. In Proceedings of the Second Physical Internet Conference (pp. 6-8).
Harris, M., & Raviv, A. (1991). The theory of capital structure. the Journal of Finance, 46(1), 297-355.Harvey, J., Meijer, J., & Kendall, A. (2014). Tech Brief: Life Cycle Assessment of Pavements. Federal
Highway Administration, Washington, DC. Hausmann, L., Herrmann, N. A., Krause, J., Netzer, T. (2014). Same-day delivery: The next evolutionary
step in parcel logistics. McKinsey & Company. Retrieved from http://www.mckinsey.com/industries/travel-transport-and-logistics/our-insights/same-day-delivery-the-next-evolutionary-step-in-parcel-logistics (accessed 11.23.16).
Heaney, B. (2013). Supply chain visibility. A critical strategy to optimize cost and service, Aberdeen Group, Boston (MA).
Henriques, I., & Sadorsky, P. (1999). The Relationship Between Environmental Commitment and Managerial Perceptions of Stakeholder Importance. Academy of Management Journal, 42 (1), 87-99.
Hervani, A., Helms, M., & Sarkis, J. (2005). Performance measurement for green supply chain management. . Benchmarking an International Journal, 12 (4) 330-353.
HIGH TOOL. (2013-2014). Retrieved from Strategic high-level transport model: http://cordis.europa.eu/project/rcn/186990_en.html
Hollmann, R.L., Scavarda, L.F., Thomé, A.M.T., 2015. Collaborative planning, forecasting and replenishment: a literature review. Int. J. Product. Perform. Manag. 64 (7):971–993.
Huan, S. H., Sheoran, S. K., & Wang, G. (2004). A review and analysis of supply chain operations reference (SCOR) model. Supply Chain Management: An International Journal, 9(1), 23-29.
Hurtrez, N., & Salvadori, M. G. S. (2010). Supply chain finance: From myth to reality. McKinsey on payments, 22.
Hutchison, J. (1998). Integrating environmental criteria into purchasing decision: value added? Green Purchasing: Opportunities and Innovations. Greenleaf Publishing., 164-178.
IBM. (2010). The Smarter Supply Chain of the Future, IBM Corporation, October 2010ICARGO. (n.d.). Retrieved from Intelligent Cargo in Efficient and Sustainable Global Logistics Operations:
http://i-cargo.eu/IMRC (2008). Electronic Logistics Marketplaces Research Report, Cardiff University Innovative
Manufacturing Research Centre.Initiative, G. E. (2004). Forging New Links: Enhancing Supply Chain Value Through Environmental
Excellence. Retrieved from www.gemi.org.INTEGRITY Final Report, Retrieved from http://integrity-supplychain.eu/ Ivashina, V., & Scharfstein, D. (2010). Bank lending during the financial crisis of 2008. Journal of Financial
economics, 97(3), 319-338.Janjevic, M., Ndiaye, A. (2016). Investigating the theoretical cost-relationships of urban consolidation
centres for their users. Transportation Research Part A: Policy and Practice. doi:10.1016/j.tra.2016.10.027
Kaplan, R. (1990). Measures for Manufacturing Excellence. Harvard Business School Press, Boston.Kapoor, J. (2017). How supply chain finance can drive sustainability and CSR. Supply Chain Briefing.
Retrieved from http://www.scfbriefing.com/supply-chain-finance-and-sustainability/Kehdall, A. (2012). Life Cycle Assessment for Pavement: Introduction. . presentation in Minutes, FHWA
Sustainable Pavement Technical Working Group Meeting.Keifer, S. (2009). Rise and fall of B2B e-marketplaces.
© SELIS, 2018 Page | 92

Klapper, L. (2006). The role of factoring for financing small and medium enterprises. Journal of Banking and Finance. 30(11): 3111-3130.
Klievink, B., Van Stijn, E., Hesketh, D., Aldewereld, H., Overbeek, S., Heijmann, F., & Tan, Y. H. (2012). Enhancing Visibility in International Supply Chains: The Data Pipeline Concept. International Journal of Electronic Government Research 8(4): 14-33.
Köhler, U., Groke, O. (2003). New ideas for the city-logistics project in Kassel, in: Proceedings of 3rd International Conference on City Logistics, in Madeira. pp. 331–343.
Krajewska, M. A., Kopfer, H., Laporte, G., Ropke, S., & Zaccour, G. (2008). Horizontal cooperation among freight carriers: request allocation and profit sharing. Journal of the Operational Research Society, 59(11), 1483-1491.
Larsen, T.S., Thernøe, C., & Andresen, C. (2003). Supply chain collaboration: theoretical perspectives and empirical evidence, International Journal of Physical Distribution & Logistics Management. 33(6): 531-549.
LEARN. (2016). Logistics emissions accounting & reduction center. Retrieved from http://www.learnproject.net/
Lee, H., Kim, M. S., & Kim, K. K. (2014). Interorganizational information systems visibility and supply chain performance. International Journal of Information Management, 34(2), 285-295
Lee, Y., & Rim, S. C. (2016). Quantitative Model for Supply Chain Visibility: Process Capability Perspective. Mathematical Problems in Engineering, 2016.
Lekkakos, S.D., Serrano, A. (2015). Supply chain finance for small and medium sized enterprises: The case of reverse factoring. International Journal of Physical Distribution & Logistics Management. 46(4): 367-392
Lekkakos, S.D., Serrano, A. (2017). Reverse Factoring: When might extending payment terms be economically efficient? Submitted to Journal of Purchasing and Supply Management.
Lewis, A., Lagrange, A., Patterson, D., & Gallop, N. (2007). South London Freight Consolidation Centre Feasibility Study - Final Report.
Lewis, H. G. (2001). Design + Environment: A Global Guide to Designing Greener Goods. . Greenleaf Publishing.
Li, S. and Lin, B. (2006). Accessing information sharing and information quality in supply chain management. Decision support systems, 42(3), pp.1641-1656.
Liberti, J.M., Sturgess, J. (2013). The anatomy of a credit supply shock: Evidence from an internal credit market. Working paper. Kellstadt Graduate School of Business, Chicago.
Linton, J., Klassen, R., & Jayaraman, V. (2007). Sustainable supply chains: an introduction. Journal of opertional management, 25 (1) 1075-1082.
LOCIMAP. (2012-2014). Low Carbon Integrated Manufacturing Parks: Retrieved from http://cordis.europa.eu/project/rcn/107966_en.html
Lyu, J.J., Ding, J.H. & Chen, P.S. (2010). Coordinating replenishment mechanisms in supply chain: from the collaborative supplier and store-level retailer perspective, International Journal of Production Economics. 123(1):221-234.
Macharis, C., & Bontekoning, Y. (2004). Opportunities for OR in intermodal freight transport research: a review. Eur. J. Oper. Res. 153, 400–416.
Macharis, C., Van Hoeck, E., Pekin, E., & Van Lier, T. (2010). A decision analysis framework for intermodal transport: Comparing fuel price increases and the internalisation of external costs. Transportation Research Part A: Policy and Practice, 44(7), 550-561.
McKinney, J., & Radford, A. (2014). The delivered financial value of in-transit cargo tracking data. Supply Chain Management Review, 18(1).
McKinsey (2010). Identifying and assessing horizontal collaboration partnerships.
© SELIS, 2018 Page | 93

Mes, M.R., & Iacob, M.E. (2016). Synchromodal transport planning at a logistics service provider, in: Logistics and Supply Chain Innovation. Springer, pp. 23–36.
Mian, S. L., & Smith Jr, C. W. (1992). Accounts receivable management policy: theory and evidence. The Journal of Finance, 47(1), 169-200.
Mishra, D., Gunasekaran, A., Papadopoulos, T., & Hazen, B. (2017). Green supply chain performance measures: A review and bibliometric analysis. Sustainable Production and Consumption.
Modigliani, F., & Miller, M. (1958). The cost of capital, corporate finance, and the theory of investment. American Economic Review. 48: 261-297.
MODULUSHCA. (2012-2016). Modular logistic Units in Shared Co-modal network: Retrieved from http://www.modulushca.eu/
Montreuil, B., Rougès, J.F., Cimon, Y., & Poulin, D. (2012). The Physical Internet and Business Model Innovation. Technology Innovation Management Review 32–37.
Muir, M. (2010). European supply chain horizontal collaboration–a brief analysis of eyefortransport’s recent survey. Eyefortransport, London.
Myers, S.C., & Majluf, N.S. (1984). Corporate financing and investment decisions when firms have information that investors do not have. Journal of Financial Economics. 13: 187-221.
Nedelea, B. (2010). e-Marketplaces and their importance for logistic networks, Internal Auditing and Risk Management, V, 1(17).
NexTrust (2016a). NexTrust Deliverable 1.1 Report – Results of identification phase [WWW Document]. URL http://nextrust-project.eu/downloads/D1.1_Identification_Phase.pdf (accessed 2.17.17).
NexTrust (2016b). Press release: Innovative Trustee Business Model was presented at NexTrust Project Industry Board kick-off in Cologne [WWW Document]. URL http://nextrust-project.eu/downloads/Press_Release_November_2016_-_English.pdf (accessed 2.23.17).
Noia, T. et al. (2004). A system for principled matchmaking in an electronic marketplace." International Journal of Electronic Commerce 8 (4): 9-37.
O’Connell, V. (2009). Wal-Mart program will aid suppliers. Wall Street Journal, November 14.OECD (2003). Delivering the goods - 21st century challenges to urban goods transport. OECD working
group on urban freight logistics, Paris.Olugu, E., & Wong, K. (2009). Supply chain performance evaluation: trends and challenges. American
Journal of Engineering and Applied Sciences, 2 (1), 202 - 211.Ovalle, R.O., & Marquez, A.C. (2003). The effectiveness of using e-collaboration tools in the supply chain:
an assessment study with system dynamics. J. Purch. Supply Manag. 9 (4), 151–163Pfoser, S., Treiblmaier, H., & Schauer, O. (2016). Critical success factors of synchromodality: Results from
a case study and literature review. Transportation Research Procedia, 14, 1463-1471.Prakash, A., & Deshmukh, S.G. (2010). Horizontal collaboration in flexible supply chains: a simulation
study. Journal of Studies on Manufacturing 1, 54–58.Quak, H. J. (2008). Sustainability of urban freight transport: Retail distribution and local regulations in
cities.Quak, Hans, & Tavasszy, Lori (2011). Customized Solutions for Sustainable City Logistics: The Viability of
Urban Freight Consolidation Centres. In Transitions towards Sustainable Mobility, 213–233. Springer.
Rai, A., Patnayakuni, R. & Seth, N. (2006). Firm performance impacts of digitally enabled supply chain integration capabilities. MIS quarterly, pp.225-246.
Rai, A., Patnayakuni, R. & Seth, N. (2006). Firm performance impacts of digitally enabled supply chain integration capabilities. MIS quarterly, pp.225-246.
© SELIS, 2018 Page | 94
Ramanathan, U. & Muyldermans, L. (2010). Identifying demand factors for promotional planning and forecasting: A case of a soft drink company in the UK. International Journal of Production Economics, 128 (2), 538-545.
Ramanathan, U. (2014). Performance of supply chain collaboration – a simulation study, Expert Systems with Applications. 41(1): 210-220.
Reis, Vasco (2015). Should We Keep on Renaming a +35-Year-Old Baby? Journal of Transport Geography 46. Elsevier Ltd: 173–79. doi:10.1016/j.jtrangeo.2015.06.019.
Rialland, A., & Hagaseth, M. (2014). Future Internet Based Services for Improved Transport Planning and Capacity Utilization. International Maritime-Port Technology and Development Conference (MTEC). Trondheim
Riessen, B. V., Negenborn, R. R., Dekker, R., & Lodewijks, G. (2015). Service network design for an intermodal container network with flexible transit times and the possibility of using subcontracted transport. International Journal of Shipping and Transport Logistics, 7(4), 457-478.
Riessen, B. Van (2013). Planning of Hinterland Transportation in the EGS Network.Ritter, T., Wilkinson, I.F., & Johnston, W.J. (2004). Managing in complex business networks. Industrial
marketing management 33, 175–183.Roca-Riu, M., & Estrada, M. (2012). An evaluation of urban consolidation centers through logistics
systems analysis in circumstances where companies have equal market shares. Procedia-Social and Behavioral Sciences, 39, 796-806.
Rossi, S. (2012). Challenges of Co-Modality in a Collaborative Environment. CO3: Collaboration Concepts for Co-Modality.
Saeedi, H., Wiegmans, B., Behdani, B., & Zuidwijk, R. (2017). Analyzing competition in intermodal freight transport networks: The market implication of business consolidation strategies. Research in Transportation Business & Management, 23, 12-20.
Sari, K. (2008). On the benefits of CPFR and VMI: a comparative simulation study. International Journal of Production Economics 113 (2): 575–586.
Sarkis, J. (1995). Manufacturing strategy and environmental consciousness. Technovations, 15 (2), 79-97.Secretariat, I. C. (2012). GHG Schemes addressing climate change - How ISO standards help. Switzerland:
ISO, 2010-12/ 2000.Seifert, D. (2003). Collaborative planning, forecasting, and replenishment: How to create a supply chain
advantage. New York: AMACOM. Seifert, R.W., & Seifert, D. (2011). Financing the chain. International Commerce Review. 10(1) Spring. Serena, N.G. (2013). P&G, big companies pinch suppliers on payment terms. Wall Street Journal, April
17,1.SFC (Smart Freight Center) (2016). GLEC Framework for Logisitcs Emissions Methodologies, Version 1.0.
http://www.smartfreightcentre.org/glec/what-is-glec.Shaofeng, L., & Meili, J. (2011). Providing Efficient Decision Support for Green Operations Management:
An Integrated Perspective. Efficient Decision Support Systems - Practice and Challenges in Multidisciplinary Domains.
Shultz II, C., & Holbrook, M. (1999). Marketing and tragedy of the commons: a synthesis, commentary and analysis for action. Journal of Public Policy Mark, 18 (2), 218-229.
Simatupang, T.M., & Sridharan, R. (2002). The collaborative supply chain. The International Journal of Logistics Management 13, 15–30.
Simchi-Levi, D., Kyratzoglou, I. M., & Vassiliadis, C. G. (2013). Supply Chain and Risk Management, MIT and PwC Research Study, 2013
Singh, P. M., van Sinderen, M., & Wieringa, R. (2016, June). Synchromodal transport: pre-requisites, activities and effects. In ILS Conference (pp. 1-4).
© SELIS, 2018 Page | 95

Skjoett-Larsen, T., Thernøe, C. & Andresen, C. (2003). Supply chain collaboration: theoretical perspectives and empirical evidence, International Journal of Physical Distribution & Logistics Management. 33(6);531-49.
Småros, J. (2007). Forecasting collaboration in the European grocery sector: observations from a case study. Journal of Operations Management 25:702–716.
Soosay, C.A., Hyland, P.W., Ferrer, M. (2008). Supply chain collaboration: capabilities for continuous innovation. Supply Chain Management: An International Journal 13, 160–169.
SteadieSeifi, M., Dellaert, N. P., Nuijten, W., Van Woensel, T., & Raoufi, R. (2014). Multimodal freight transportation planning: A literature review. European journal of operational research, 233(1), 1-15.
SteadieSeifi, M., Dellaert, N. P., Nuijten, W., Van Woensel, T., & Raoufi, R. (2014). Multimodal freight transportation planning: A literature review. European journal of operational research, 233(1), 1-15.
Stiglitz, J. E., & Weiss, A. (1981). Credit rationing in markets with imperfect information. The American economic review, 71(3), 393-410.
Strategisch Platform Logistiek (2010). Synchromodaal Transport. Retrived from http://www.connekt.nl/uploads/2012/04/08-2010-brief-informateur-strategisch-platform-logistiek-def.pdf.
Styhre, L. (2010). Capacity utilisation in short sea shipping. Chalmers University of Technology.Styhre, L. (2013). Potential for improvement of feeder vessel capacity utilisation. International Journal of
Shipping and Transport Logistics, 5(4-5), 512-531.Sutton, S.G., Smedley, G., Arnorld, V. (2008). Accounting for collaborative supply chain relationships:
issues and strategies.Taniguchi, E., Thompson, R.G., Yamada, T. (2004). Visions for city logistics, in: The 3rd International
Conference on City Logistics.Tanrisever, F., Cetinay, H., Reindorp, M., & Fransoo, J. (2015). Reverse factoring for SME finance.Tanskanen, K., Holmström, J., Elfving, J., & Talvitie, U. (2008). Vendor-managed-inventory (VMI) in
construction. International journal of productivity and performance management, 58(1), 29-40.Tavasszy, L. A., Behdani, B., & Konings, R. (2015). Intermodality and Synchromodality. SSRN Electronic
Journal. doi:10.2139/ssrn.2592888.Tavasszy, L. A., Van der Lugt, L. M., Janssen, G. R., & Hagdorn-van der Meijden, E. (2010). Outline of
Synchromodal Transportation System. Main report; Verkenning Synchromodaal Transportsysteem. Hoofdrapport.
Thompson, R., Taniguchi, E. (2001). City Logistics and Freight Transport, in: Handbook of Logistics and Supply Chain Management. Brewer.
Thompson, Russell, & Taniguchi, Eiichi (2001). City Logistics and Freight Transport. In Handbook of Logistics and Supply Chain Management. Vol. 2. Brewer.
TNO (2011). Final Report Implementation Roadmap Synchromodal Transport System. Delft, The Netherlands.
Triantis, A. J. (1999). Corporate risk management: Real options and financial hedging. G. W. Brown, D. H. Chew, eds., Corporate Risk: Strategies and Management, 1st ed. Risk Publications.
Tsenga, M.M., Yana, J., Cruijssenb, F. (2013). POSITION PAPER ON COMPENSATION RULES.Tyagi, A. (2013). Liquidity and visibility: Foundations for robust supply chain finance. Aberdeen Group,
March. (available at the company’s website)Vachon, S., & Klassen, R. (2008). Environmental Management and Manufacturing Performance: The Role
of Collaboration in the Supply Chain. International Journal of Production Economics 111(2):299-315.Van den Berg, R., & De Langen, P. W. (2015). Assessing the intermodal value proposition of shipping
lines: Attitudes of shippers and forwarders. Maritime Economics & Logistics, 17(1), 32-51.van der Burg, M. (2012). Synchromodal transport for the horticulture industry. Erasmus University.
© SELIS, 2018 Page | 96

Van Der Horst, M. R., & de Langen, P. W. (2015). Coordination in hinterland transport chains: A major challenge for the seaport community. In Port Management (pp. 57-83). Palgrave Macmillan, London.
Van Der Horst, M.R., De Langen, P.W. (2015). Coordination in Hinterland Transport Chains: A Major Challenge for the Seaport Community. Port Management 57.
van der Vliet, K., Reindorp, M. J., & Fransoo, J. C. (2013). Maximising the value of supply chain finance. BETA publicatie: working papers, 405.
Van der Vliet, K., Reindorp, M. J., & Fransoo, J. C. (2015). The price of reverse factoring: Financing rates vs. payment delays. European Journal of Operational Research, 242(3), 842-853.
Van Riessen, B., Negenborn, R. R., & Dekker, R. (2015, September). Synchromodal container transportation: an overview of current topics and research opportunities. In International Conference on Computational Logistics (pp. 386-397). Springer, Cham.
Van Riessen, B., Negenborn, R. R., & Dekker, R. (2016). Real-time container transport planning with decision trees based on offline obtained optimal solutions. Decision Support Systems, 89, 1-16.
Van Riessen, B., Negenborn, R. R., Lodewijks, G., & Dekker, R. (2015). Impact and relevance of transit disturbances on planning in intermodal container networks using disturbance cost analysis. Maritime Economics & Logistics, 17(4), 440-463.
Veenstra, A., Zuidwijk, R., & Van Asperen, E. (2012). The extended gate concept for container terminals: Expanding the notion of dry ports. Maritime Economics & Logistics, 14(1), 14-32.
Verlinde, S., Macharis, C., Witlox, F. (2012). How to consolidate urban flows of goods without setting up an urban consolidation centre? Procedia-Social and Behavioral Sciences 39, 687–701.
VICS (1998). CPFR guidelinesVis, I. F., & De Koster, R. (2003). Transshipment of containers at a container terminal: An overview.
European journal of operational research, 147(1), 1-16.Wang, Y., Potter, A., & Naim, M. (2009). The Potential for a Regional Electronic Logistics Marketplace:
The Case of Wales.Wieberneit, N. (2008). Service network design for freight transportation: A review. OR Spectrum, 30, 77–
112.World Economic Forum (2012). New Models for Addressing Supply Chain and Transport Risk, available
on https://www.weforum.org/reports/new-models-addressing-supply-chain-and-transport-riskWorld Economic Forum (2013). Building Resilience in Supply Chains. Retrieved from
https://www.weforum.org/reports/building-resilience-supply-chainsWoxenius, Johan (2007). Generic Framework for Transport Network Designs: Applications and
Treatment in Intermodal Freight Transport Literature. Transport Reviews 27 (6). Routledge : 733–49. doi:10.1080/01441640701358796.
WRI&WBCSD (2011). Corporate Value Chain (scope 3) Accounting and Reporting Standard.WRI&WBCSD. (2014). Technical Guidance for Calculating Scope 3 Emissions.Wu, A., Huang, B., & Chiang, D.M. (2014). Support SME suppliers through buyer-backed purchase order
financing. Working paper. National University of Singapore, Singapore.Wuttke, D.A., Blome, C., & Henke, M. (2013b). Focusing the financial flow of supply chains: An empirical
investigation of financial supply chain management. International Journal of Production Economics. 145: 773-789.
Wuttke, D.A., Blome, C., Foerstl, K., & Henke, M. (2013a). Managing the innovation adoption of supply chain finance: Empirical evidence from six European case studies. Journal of Business Logistics. 34: 148-166.
Wuttke, D.A., Blome, C., Heese, H.S. & Protopappa-Sieke, M. (2016). Supply chain finance: Optimal introduction and adoption decisions. International Journal of Production Economics. 178: 72-81.
Xu, X. (2013). Collaboration mechanism in the horizontal logistics collaboration. Ecole Nationale Supérieure des Mines de Paris.
© SELIS, 2018 Page | 97
Yao, Y., Evers, P.T., Dresner, M.E. (2007). Supply chain integration in vendor-managed inventory. Decision Support Systems 43 (2): 663–674.
Ypsilantis, P., Zuidwijk, R. (2013). Joint Design and Pricing of Intermodal Port - Hinterland Network Services: Considering Economies of Scale and Service Time Constraints.
Ypsilantis, Panagiotis (2016). The Design, Planning and Execution of Sustainanble Intermodel Port-Hinterland Transpoirt Networks. Erasmus University Rotterdam.
Zamar, D.S., Gopaluni, B., Sokhansanj, S. and Newlands, N.K. (2017). A quantile-based scenario analysis approach to biomass supply chain optimization under uncertainty. Computers & Chemical Engineering, 97, pp.114-123.
Zhang, M., & Pel, A.J. (2016). Synchromodal Hinterland Freight Transport: Model Study for the Port of Rotterdam. Journal of Transport Geography 52 (April): 1–10. doi:10.1016/j.jtrangeo.2016.02.007.
Zhu, Q., & Sarkis, J. (2006). An inter-sectoral comparison of green supply chain management in China: Drivers and practices. Journal of Cleaner Production, 14(5):472-48.
Zhu, Q., Sarkis, J., & Geng, Y. (2005). Green supply-chain management practices in China: Drivers, practices and performance. International Journal Operational Production Management, 25 (5), 449–468.
Zuidwijk, R. A., & Veenstra, A. W. (2014). The value of information in container transport. Transportation Science, 49(3), 675-685.
© SELIS, 2018 Page | 98


