List of Journal publications, Conference papers and Awards Journal Publications Satheesh, P.R. and Jacob, J. (2011). Impact of climate warming on natural rubber productivity in different agro-climatic regions of India. Natural Rubber Research. 24(1): 1-9. Raj, S., Satheesh, P.R. and Jacob, J. (2011). Evidence for climate warming in some natural rubber growing regions of South India. Natural Rubber Research. 24(1): 10-17. Annamalainathan, K., Satheesh, P.R. and Jacob, J. (2011). Ecosystem flux measurements in rubber plantations. Natural Rubber Research. 24(1): 28-37. Sumesh, K.V., Satheesh, P.R., Annamalainathan, K., Krishnakumar, R., Thomas, M. and Jacob, J. (2011). Physiological evaluation of a few modern Hevea clones for intrinsic drought tolerance. Natural Rubber Research. 24(1): 61-67. Annamalainathan, K., Joseph, J., Alam, B., Satheesh, P.R. and Jacob, J. (2013). Seasonal changes in xylem sap flow rate inmature rubber plants. Journal of Plantation Crops. 41(3): 343-349 Thomas, M., Sathik, M.B.M ., Luke, L.P., Sumesh, K.V., Satheesh, P.R., Annamalainathan, K. and Jacob, J.(2012). Stress responsive transcripts and their association with drought tolerance in Hevea brasiliensis. Journal of Plantation Crops. 40(3): 180-187 Sathik, M.B.M., Kuruvilla, L., Thomas, M., Luke, P.L., Satheesh, P.R., Annamalainathan, K. and Jacob, J. (2012). Quantitative expression analysis of stress responsive genes under cold stress in Hevea brasiliensis. Rubber Science. 25(2): 199-213. Molly Thomas, Mohammed Sathik, M.B., Lisha P. Luke, Linu Kuruvilla, Sumesh, K.V., Satheesh, P.R., Annamalainathan, K., Krishnakumar, R. and James Jacob. (2011). Analysis of drought responsive gene expression in Hevea brasiliensis. Natural Rubber Research. 24 (2): 247- 252. Conference papers Jacob, J. and Satheesh, P.R. (2012). Climate warming in the plantation belt of kerala and its impact on natural rubber productivity. Proceedings of Kerala Environment Congress 2012, organized by Centre for Environment and Development, Trivandrum in association with Rajiv Ghandi Centre for Biotechnology. Pp 99-108. Jacob, J. and Satheesh, P.R. (2012). Climate Change, Economy and Sustainable development. Proceedings of the International Seminar on Climate Change, Sustainable Development and Society (CLIMATE CONCLAVE-2012) organised by British Council, Association of British
Transcript
List of Journal publications, Conference papers and Awards
Journal Publications
Satheesh, P.R. and Jacob, J. (2011). Impact of climate warming on natural rubber productivity in
different agro-climatic regions of India. Natural Rubber Research. 24(1): 1-9.
Raj, S., Satheesh, P.R. and Jacob, J. (2011). Evidence for climate warming in some natural rubber
growing regions of South India. Natural Rubber Research. 24(1): 10-17.
Annamalainathan, K., Satheesh, P.R. and Jacob, J. (2011). Ecosystem flux measurements in rubber
K., Krishnakumar, R. and Jacob, J. (2010). Analysis of drought responsive gene expression in
Hevea brasiliensis. Abstracts, 19th Biennial symposium on plantation crops, Placrosym XIX in
Rubber research institute of India, Kottayam on 7-10 December, 2010, p 80-81.
Awards
Won the third best research paper award given in 2012 by Rubber Research Institute of India during the 25th anniversary of its research journal
Natural rubber Research (now Rubber Science).
1
INTRODUCTION
It is very likely that greenhouse gases(GHGs) accumulating in earth’s atmospherefrom anthropogenic emissions are warmingthe world’s climate system (IPCC, 2007a).Climate change as a result of global warmingcan influence the growth and productivityof agricultural crops (Cynthia and Parry,1994). Climate change can affect cropproductivity in various direct and indirectways (Cynthia et al., 2001). For example, anextreme weather event like drought or stormdirectly impacts growth and productivity.
IMPACT OF CLIMATE WARMING ON NATURALRUBBER PRODUCTIVITY IN DIFFERENT
AGRO-CLIMATIC REGIONS OF INDIA
P.R. Satheesh and James Jacob
Rubber Research Institute of India, Kottayam-686 009, Kerala, India
Received: 12 January 2011 Accepted: 20 May 2011
Satheesh, P.R. and Jacob, J. (2011). Impact of climate warming on natural rubber productivity in different
agro-climatic regions of India. Natural Rubber Research, 24(1): 1-9.
Long term changes in climate of major natural rubber (NR) growing tracts of India were quantified and
their impact on NR productivity was estimated using multiple linear regression models. Day-to-day
variations in productivity in terms of dry rubber yield per tree per tap (g/t/t) could be best explained based
on the variations in daily maximum temperature (Tmax) and daily minimum temperature (Tmin) and
variations in other weather variables did not contribute much to the variations in daily productivity. For
unit rise in Tmax and Tmin, NR productivity was affected differently in different agro-climatic regions. If
both Tmax and Tmin rose by 1 0C, NR productivity will reduce by 9-16% in the agroclimatic conditions of
Kerala and by 11% in the hot and drought-prone North Konkan region. On the other hand, in the cold-
prone North Eastern India, there is hardly any reduction in NR productivity if both Tmax and Tmin went
up by 1 0C. Our analysis show that if the present warming trend continues, NR productivity in Kerala could
be reduced by 4-7% and that in North East India could go up by as much as 11% in the next decade. North
Konkan region may also register about 4% reduction in NR productivity in the next decade if the present
warming trend continues; however, absolute yields will continue to remain high in Kerala.
Changes in weather pattern can affect theincidence of pests and diseases and thusindirectly affect the crop.
Natural rubber (NR) is mostly grown inSouth and South East Asia which is highlyvulnerable to climate change (IPCC, 2007b).Studies show that temperatures havegenerally gone up in this part of the worldin the recent decades (Manton et al., 2001).Number of rainy days and number of coolnights per year showed a declining trend andthat of hot days per year increased. Whilewe may be able to understand and appreciate
Natural Rubber Research, 24(1): 1-9, 2011
2
to what extent climate has changed in thetraditional rubber growing regions of the
world in the recent past, it is extremelydifficult to predict how exactly these changes
will continue in the years ahead and howthese changes will affect growth and
productivity of NR. Thus, the impact ofchange in future climate on natural rubbergrowth, productivity and supply will be
complex and difficult to predict.
While warming conditions andassociated changes in climate may adversely
affect growth and productivity in thetraditional NR growing tracts of the world,
it is likely that new regions and countriescould become suitable for NR cultivation in
future. For example, regions where lowtemperature is presently a limiting factor for
cultivating NR, such as parts of North East(NE) India could become suitable for NR
cultivation in a future warmer world.Changes in climate may lead to changes in
incidences of old and new pests and diseasesin ways unknown today.
Between 2001 and 2008, consumption
of NR in India increased at the rate of 0.035million tons/year while its supply increased
by 0.036 million tons/year (IRSG, 2009).Almost all studies show that in the years
ahead, this kind of near-perfect harmonybetween demand and supply may not
continue to exist even as consumption of NRis expected to increase at a faster rate than
its supply, both nationally and globally(IRSG, 2009), provided there is sustained
economic growth. Since 2006, India ranksfirst in the world in terms of NRproductivity (IRSG, 2009). Despite the
recent global economic crisis, Indiaremained reasonably buoyant and the
Indian economy is expected to grow atimpressive rates in the coming years, and
thus, the demand for NR also will be on the
rise. But climate change is one important
factor that may seriously jeopardize NR
availability in India and other major NR
producing countries in South and South
East Asia, a region particularly vulnerable
to the adverse impacts of climate change
(Manton et al., 2001). The present study
examines how rising temperature may
influence NR productivity in the different
agro-climatic regions of India where NR is
cultivated.
MATERIALS AND METHODS
Long term daily weather data collected
from the weather station at the Rubber
Research Institute of India (RRII) located in
Kottaym, a typical traditional rubber
growing region in Kerala, since 1957 were
analysed for long term trends. Long term
daily weather data were collected from the
Regional Research Stations (RRSs) of RRII at
Agartala, Tura and Dapchari (non traditional
regions), and Central Experimental Station
(CES) of RRII at Chethackal and RRS,
Padiyoor (traditional region) representing
the diverse agro-climatic regions in India
where NR is cultivated (Jacob et al., 1999) and
their changing trends were worked out.
The climatic conditions of these regions
range from extreme dry and hot conditions
in Dapchari to severe winter conditions in
NE. Dapchari is situated at 200 04’N, 720 04’E
with an average elevation of 48 m above MSL
in the North Konkan region of Maharashtra.
During the monsoon season, this region gets
around 2400 mm rainfall. During peak
summer days, the maximum temperature
goes above 38 0C and during winter, the
minimum temperature can be as low as
15.5 0C (Jacob et al., 1999).
SATHEESH AND JACOB
3
Agartala and Tura are situated in NEIndia, at 230 50’N, 910 16’E and 250 30’N, 900
13’E, with an altitude of around 30 and 1100 mabove MSL, respectively. The annual rainfallin these regions ranges from 2000-2400 mm.During peak winter days, the minimumtemperature may be as low as 5 0C or lessand the maximum temperature duringsummer is 31 0C (Jacob et al., 1999). Comparedto these two non traditional regions, theweather conditions in the traditional NRgrowing regions of India are more moderate.These traditional regions are situated at alatitudinal range of 80 15’N to 120 5’N andlongitudinal range of 740 5’E to 770 30’E withan altitude of approximately 20-500 m aboveMSL and are represented by RRII, Kottayam,CES, Chethakkal and RRS, Padiyoor. Meanannual rainfall in these regions ranges from2000-4500 mm. The mean maximum andminimum temperatures during the summermonths are 33 0C and 25 0C and for thewinter months, 31 0C and 22 0C, respectively.India is perhaps the only country where NRis cultivated in such extremely diverseconditions. In all cases, we regressed NRyield with different weather parameters todetermine the quantitative effect of eachweather parameter on yield.
Three different approaches wereadopted in analyzing the data. In the firstapproach, we regressed mean annualproductivity in these diverse agro-climaticregions together with the prevailing weatherparameters and made one single multiplelinear regression model (MLR) for all thelocations. In the MLR model, we usedweather parameters like mean annualtemperature (Tann), mean annual maximumtemperature (Tmax), mean annual minimumtemperature (Tmin), mean annual rainfall(RF) and mean number of annual rainy days
(RFday) as independent variables and mean
yield over the year i.e. g/t/t as the dependent
variable. Variables from all the different
experimental locations representing the
diverse agro-climatic regions were regressed
together in one single MLR model so as to
get maximum variability in the independent
(weather) variables. In the second approach,
daily per tree yield (g/t/t) for several yearswas regressed with the corresponding dailyweather parameters for these years,separately for the different agro-climaticregions. In a third approach, we regressedthe per hectare productivity with maximumand minimum temperatures for threelocations from within the traditional areas,namely Kottayam, Kanjirapally andTaliparamba and estimated the impact ofrising temperature on productivity. Aftergetting a model for each location, wepredicted the yield for 1 0C rise in Tmax andTmin. We also predicted the yield for the next10 years by incorporating the currentwarming trends in these regions in themodels.
RESULTS AND DISCUSSION
Long term temperature trends
The mean Tmax and Tmin on almostevery day in an year during 2005-2009 havebeen higher than the same for the period1957-1961 at RRII, Kottayam (Fig. 1). Linerregression analyses showed that the meanannual Tmax and Tmin have been increasingat the rate of 0.05 0C per year and 0.03 0C peryear, respectively since 1957 at RRII,Kottayam (Table 1). At the Regional ResearchStation of RRII in Agartala, Tmax and Tminincreased at the rate of 0.02 0C per year and0.06 0C per year, respectively since 1986. Inevery study location there was a warmingtrend, but the extent of the warming wasdifferent (Table 1).
CLIMATE WARMING AND NATURAL RUBBER PRODUCTIVITY
4
Fig. 1. Mean daily Tmax (a) and Tmin (b) in RRII,Kottayam during the periods 1957-61(green) and 2005-09 (red)
Multiple liner regression analysis ofannual yield data and different weatherparameters (all locations together)
Mean annual weather data (meantemperature, mean Tmax, mean Tmin, meanrainfall and mean number of rainy days/year) were used as the independent variables(X variables) and mean annual productivityof the tree (g/t/t) was taken as the dependentvariable (Y variable) to work out a singleMLR model in which data from all studylocations were pooled together in order to catchmaximum variations in the independentvariables (approach 1). In the last step ofMLR, only three independent variableswere left in the model, namely, mean annualTmax, mean annual Tmin and mean annualRF (Y = 96.94 - 7.05 Tmax + 7.45 Tmin + 0.008RF, R2 =0.71) (Table 2). This model (in whichthe independent variables from variousagro-climatic regions were pooled andincorporated in one single MLR model) hada fundamental flaw; in the different regions,the different independent variables had
SATHEESH AND JACOB
Table 1. Climate warming trends based on liner regression analysis in different locations of the study
representing different agro-climatic regions where NR is cultivated in India
Station Period Annual mean temperature (0C) R
2Warming rate (
0C/year)
Tura 1995-2008 Tmax 29.3 0.30 0.12
(NE) Tmin 16.9 0.30 0.05
Agartala 1984-2007 Tmax 30.6 0.07 0.02
(NE) Tmin 19.9 0.30 0.06
Padiyoor 1998-2009 Tmax 32.8 0.05 0.01
(Traditional) Tmin 21.8 0.60 0.11
Dapchari 1987-2009 Tmax 33.2 0.40 0.08
(Non-traditional) Tmin 20.6 0.16 0.03
Kottayam 1957-2009 Tmax 31.2 0.66 0.05
(Traditional) Tmin 22.7 0.30 0.03
Chethackal 1987-2009 Tmax 32.5 0.10 0.02
(Traditional) Tmin 21.8 0.21 -0.03
5
Table 2. MLR (backward) models obtained between the annual yield and different weather parameters
for all stations together (approach 1).
Unstandardized StandardizedModel coefficient coefficients t p
B Std. Error Beta
1 (Constant) -26.4 152.224 -0.173 0.871
Tann 2.787 2.628 0.284 1.061 0.349
Tmax -4.922 6.459 -0.607 -0.762 0.488
Tmin 6.203 5.56 1.145 1.116 0.327
RF 5.68E-03 0.009 0.449 0.625 0.566
RFday 8.94E-02 0.305 0.21 0.293 0.784
2 (Constant) -0.195 111.345 -0.002 0.999
Tann 2.642 2.333 0.269 1.132 0.309
Tmax -6.419 3.572 -0.791 -1.797 0.132
Tmin 7.647 2.327 1.412 3.286 0.022
RF 8.13E-03 0.003 0.643 2.58 0.049
3 (Constant) 96.938 72.647 1.334 0.23
Tmax -7.053 3.61 -0.869 -1.954 0.099
Tmin 7.452 2.375 1.376 3.138 0.02
RF 8.11E-03 0.003 0.641 2.515 0.046
qualitatively and quantitatively differentimpacts on yield (see approach 2 below). Forexample, in the NE where very low wintertemperatures prevail, an increase in Tmax hada positive effect on yield unlike in other placeswhere the effect was the opposite. Thisbecame evident when MLR analysis wasmade separately for the different regions (seeapproach 2 below). Therefore, approach 1 wasrejected.
Multiple linear regression analysis of dailyyield data and daily weather dataseparately for different locations
Upon realizing that the weatherparameters had different impacts on yieldin the different study locations, MLR analysiswas done for each study location separately(approach 2). For obtaining variations inyield (Y) and weather (X), daily data were
collected round the year for several years.
The MLR models obtained for the individual
regions had only two independent variables
in the last step, namely daily Tmax and daily
Tmin. The MLR models for the different
study locations were: Y = 433.43 - 7.87
Tmax - 4.83Tmin (CES, 90 26’N to 760 48’N),
Y = 171.01 - 2.54Tmax - 1.71Tmin (Padiyoor,
110 58’N to 750 36’N), Y = 204.98 - 1.01Tmax -
5.51Tmin (Dapchari, 200 04’N, 720 04’E),
Y = 41.25 + 0.67Tmax - 1.13Tmin (Agarthala,
230 50’N, 910 16’E) and Y = -24.85 + 3.58 Tmax
- 2.59Tmin (Tura, 250 30’N, 900 13’E). From
these five models, the change in yield when
both Tmax and Tmin concomitantly
increased by 1 0C was calculated (Table 3).
Reduction in yield in CES, Chethackal was
to the tune of 16% for 1 0C rise in Tmax and
Tmin. In Dapchari, the yield reduction for
1 0C rise in Tmax and Tmin was 11% followed
CLIMATE WARMING AND NATURAL RUBBER PRODUCTIVITY
6
by 9% in Padiyoor. But in the other tworegions, namely Agartala and Tura in NEIndia where winter temperatures are verylow, the impact of warming was found to benegligible. In Agartala, the yield reductionwas about 1% and in the case of Tura therewas an increase in the yield by 3% for 1 0Crise in Tmax and Tmin. Thus, small rise intemperature in this region may not havemuch adverse impact on rubber yield.Sometimes this may increase the yield justlike what happened in the Tura region.Warming of the region may help to expandNR cultivation to more parts of NE wherelow temperature is a limiting factor today.
During the last 52 years (1957-2009)Tmax and Tmin in RRII have increased atthe rate of 0.05 0C/yr and 0.03 0C/yr,respectively at RRII, Kottayam (Table 1).Extrapolating this data, the rise in Tmax andTmin in the next 10 years was calculated andthe same was used to estimate the expectedreduction in productivity after 10 years atthe nearby CES, Chethackal using the MLRmodel developed for CES (Table 3). The
yield reduction after 10 years will be about7% in CES. In Padiyoor, the rate of increasein Tmax and Tmin during the period 1998-2009 were 0.01 0C/yr and 0.11 0C/yr, respectively(Table 1) and this may result in the reductionof yield by 4% after 10 years based on theMLR model for Padiyoor (Table 3). In thecase of Dapchari, during the period 1987-2009 the rate of increase in Tmax was muchhigher (0.08 0C/yr) but the minimumtemperature increased by only 0.03 0C/yr(Table 1). The reduction in the yield in thisregion will be 4% for the next decade. InAgartala, the reduction in yield in the nextten years will be very small going by thepresent warming trend (1%) which is 0.02 0C/yr for Tmax and Tmin 0.06 0C/yr for Tmin(during the period 1984-2007). For theperiod 1995-2008 Tmax in Tura increased by0.12 0C/yr (Table 1). But the minimumtemperature increased by 0.05 0C/yr in thisregion (Table 1). The cumulative effect of theexpected changes in Tmax and Tmin in thisregion could lead to an increase in the yieldby 11% in the next ten years (Table 3).
Table 3. MLR (backward) models, percentage change in NR productivity (on a per tree per day basis)
for 10C rise in Tmax and Tmin and predicted yield depression in the next 10 years with the
current warming trends in the different study locations (approach 2)
MLR % Change % Change Estimated presentStation (for 1 0C rise) (in next productivity
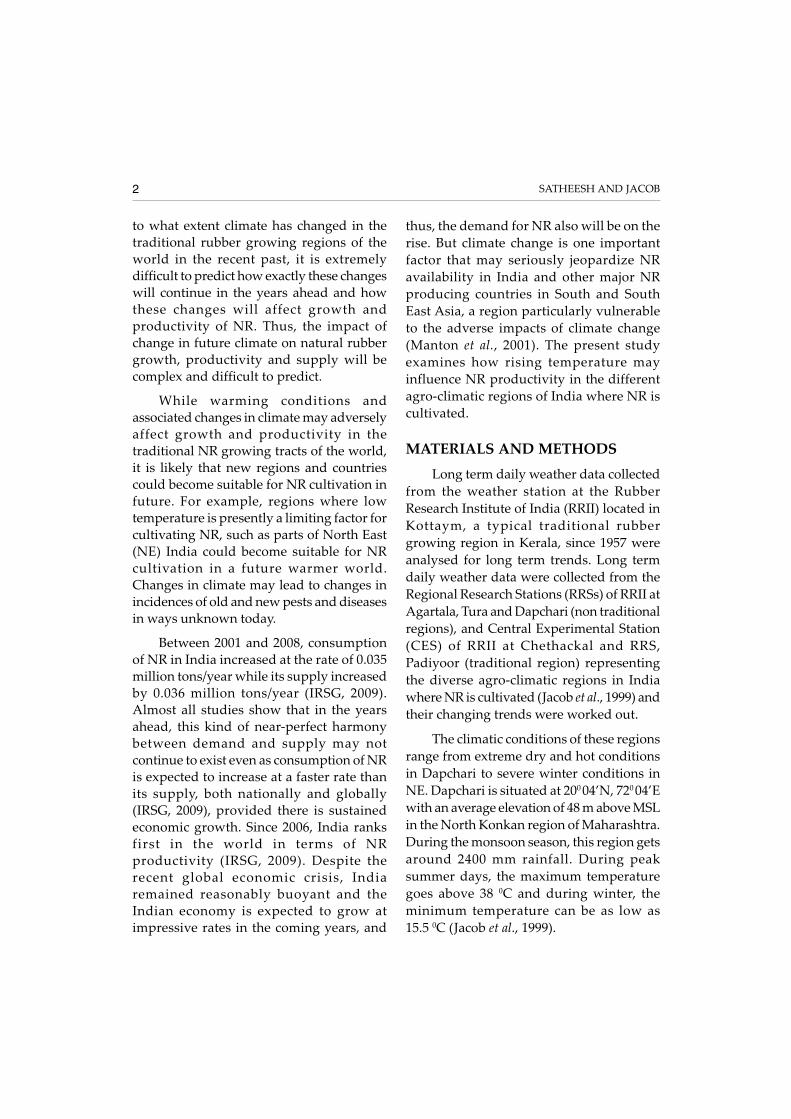
Multiple linear regression analysis of perhectare productivity and temperature
The MLR model obtained for per hectareproductivity (kg/ha/month) was Y = 999.53 -6.14Tmax - 27.68Tmin for Kottayam (closeto RRII), Y = 789.36 - 11.33Tmax - 12.68Tminfor Kanjirapally (close to CES) and Y = 281.91+ 4.13Tmax - 11.26Tmin for Taliparamba(close to Padiyoor). These MLR models weremade using monthly mean values of the Yand X vaiables for the whole year for severalyears. While mean yields were obtained fromgrowers’ fields in these three regions, theweather data were obtained from nearbyRRII, Kottayam (for the Kottayam region),RRS, Padiyoor (for the Taliparamba region)and CES, Chethakkal (for the Kanjirappallyregion). The percentage reductions inproductivity (for 1 0C rise in both maximumand minimum temperatures) were 19%, 15%and 4% for Kottayam, Kanjirapally andTaliparamba, respectively. These results werecomparable to the results obtained from therespective regions when per tree per dayyield was used as the dependent variable(Tables 3&4).
Our analyses clearly indicate that climatehas warmed in the traditional and nontraditional rubber growing tracts of India and
that this will have qualitatively andquantitatively different impacts on NR
productivity in the different regions. Kerala
and the Konkan regions are going to be
relatively more affected by the adverse effect
of climate warming than NE India (Table 3)
where warming conditions may increase
productivity even as the prevailing cold
conditions are a limiting factor at present
(Jacob et al., 1999). Rise in temperature,
especially in Tmax would have a positive
impact on NR cultivation in NE India, unlike
in other places. For these reasons, approach 1
was rejected. Extrapolating the present
warming trends, the MLR models clearly
indicate that NR productivity will be
relatively more affected in Kerala than any
other NR growing regions in the next one
decade, although the absolute productivity
may still remain high here. However, NR
productivity may see an improvement in NE
in the coming decade as the region continues
to get warmer.
In this context, it is pertinent to ask the
question if the past warming has had in fact
adversely affected NR productivity. Going
by the MLR models, such an impact must
have happened already. But it may be noted
that statistical data clearly indicate that NR
Table 4. MLR (backward) models, percentage change in the future productivity of rubber (on a per ha
per month basis) for 10C rise in Tmax and Tmin and estimated present productivity (kg/ha/yr)
productivity in the country has gone up inthe past decades (Rubber Board, 2009). Thishas been due to increased adoption of highyielding clones, particularly RRII 105, theflagship clone released by RRII during 1980.RRII 105 has been one of the highest yieldingclones anywhere in the world. As a largeshare of the mature plantations came underRRII 105, NR productivity (based onstatistical data from growers’ fields) alsoincreased over the years, masking the actualimpact of climate warming on productivity.
However, if large scale adoption ofRRII 105 had not happened and the areaunder this high yielding clone had notincreased, there was every possibility thatNR productivity would have gone downover the years as a result of climatewarming. The MLR models clearly suggestthat the potential NR productivity musthave come down in the recent decades;
thanks to climate warming. During the late1970s and early 1980s, the meanproductivity of RRII 105 under the bestmanagement practices of our researchfarms in the traditional regions have beenin the range of 60-65 g/t/t, but of late, thisis mostly in the range of 50-55 g/t/t or evenless (RRII, 1988 & 2010). Since the genetics(clone) was the same and the managementpractices were constant (as can be expectedas the trials were in our own experimentalfarms where management practices did notunder go any substantial change over theyears), the most persuasive reason for thisreduction in productivity seems to be theappreciable temperature warming that hashappened during this period. There mighthave been other factors too, such as likelydeterioration in soil productivity or otherunknown factors, but the high rate of risein both Tmax and Tmin in the traditional
SATHEESH AND JACOB
Fig. 2. Flow chart showing the direct and indirect effects of climate warming on growth and yield of rubber
9
regions strongly indicates the significantrole climate warming must have played inreducing productivity in the past.
This could have been true for othercrops too – had it not been for the geneticand agronomic improvements, productivitymight have been adversely affected, or atleast the potential productivity of a newvariety might not have been fully realized inthe field as temperature rose. This points tothe need to evolve cultivars and clones thatare climate (temperature) resilient.
The present analysis has been the firstattempt of its type to assess the direct impactof climate warming on NR productivity. Ourresults clearly indicate how Tmax and Tmin
CLIMATE WARMING AND NATURAL RUBBER PRODUCTIVITY
have been increasing in the past, how it hasadversely affected productivity in the pastand what rising temperatures might do toNR productivity in future in the differentagro-climatic regions of India where thiscrop is cultivated today. Climate change isobviously much more complex than dailyvariations in weather parameters such asdaily Tmax or Tmin (See Fig. 2). Changes incloud formation, wind, rainfall pattern,occurrence of extreme weather events likestorms, floods, long dry spells, unexpectedbreaks in monsoon, spread of new and oldpests and diseases etc. are important factorsthat can seriously influence NR croppingcalendar in unknown ways which are thesubject of our current research.
REFERENCES
Cynthia, R. and Parry, M.L. (1994). Potential impactof climate change on world food supply. Nature,367:133-138.
Cynthia, R., Iglesias, A., Yang, X.B., Epstein, P.R. andChivian, E. (2001). Climate change and extremeweather events: Implications for foodproduction, plant and pests. Global Change &Human Health, 2(2): 90-104.
IPCC. (2007a). Fourth Assessment Report (AR4),Climate Change 2007: The Physical Science Basis.Contribution of Working Group I to the FourthAssessment Report of the IntergovernmentalPanel on Climate Change. (Eds. Solomon, S., D.Qin, M. Manning, Z. Chen, M. Marquis, K.B.Averyt, M. Tignor and H.L. Miller). CambridgeUniversity Press, Cambridge, United Kingdomand New York, NY, USA.
IPCC. (2007b). Fourth Assessment Report (AR4),Climate Change 2007: Impacts Adaptation andVulnerability. Contribution of Working Group IIto the Fourth Assessment Report of theIntergovernmental Panel on Climate Change.(Eds. M.L. Parry, O.F. Canziani, J.P. Palutikof, P.J.
van der Linden and C.E. Hanson). CambridgeUniversity Press, Cambridge, United Kingdomand New York, NY, USA.
Jacob, J., Annamalainathan, K., Alam, B., Sathik,M.B.M., Thapliyal, A.P. and Devakumar, A.S.(1999). Physiological constraints for cultivationof Hevea brasiliensis in certain unfavourableagroclimatic regions of India. Indian Journal ofNatural Rubber Research, 12(1&2): 1-16.
Manton, M.J., Della-marta, P.M., Haylock, M.R.,Hennessy, K.J., Nicholls, N., Chambers, L.E.,Collins, D.A., Daw, G., Finet, A., Gunawan, D.,Inape, K., Isobe, H., Kestin, T.S., Lefale, P., Leyu,C.H., Lwin, T., Maitrepierre, L., Ouprasitwong,N., Page, C.M., Pahalad, J., Plummer, N.,Salinger, M.J., Suppiah, R., Tran, V.L., Trewin,B., Tibig, I. and Yee, D. (2001). Trends in extremedaily rainfall and temperature in Southeast Asiaand the South Pacific: 1961-1998. InternationalJournal of Climatology, 21:269-284.
RRII. (1988). Annual Report 1986-87. Rubber ResearchInstitute of India, The Rubber Board, Kerala, 23p.
RRII. (2010). Annual Report 2008-09. Rubber ResearchInstitute of India, The Rubber Board, Kerala, 28-32.
and soils (Kumar et al., 2009). Sequestrationof CO
2 by terrestrial plants helps prevent
global warming (Suruchi and Singh, 2002).Marine algae are also a potent sink foratmospheric CO
2 (Takahashi et al., 2002);
however, terrestrial vegetation is obviouslymore amenable to human intervention thanmarine algae are.
Roughly between 45 and 55% of plantbiomass is carbon (Malhi et al., 2001). Someof this stored carbon in plants is transferredinto soils when vegetation, litter and rootsdecay. In fact, there is more carbon stored inbelow ground biomass and soils than above
Natural Rubber Research, 24(1): 28-37, 2011
29
ground biomass in boreal forests (Roger,2001). In tropics, more carbon is stored in
above ground vegetation than in soils (IPCC,2000). Carbon stored in various components
of an ecosystem can return to the atmosphereas CO
2 when the soil is cultivated. Agricultural
tillage operations stir up soils resulting inoxidation of biomass carbon into CO
2. Decay
or combusting of biomass also results in
emission of CO2 into the atmosphere. The
movement of carbon in and out of trees and
soils is integral part of the earth’s carbon cycle.
While annual agricultural crops alsosequester large amounts of CO
2 from the
atmosphere,, almost the entire amount of
carbon stored in them is returned to the
atmosphere at the end of the crop cycle whenthe crop is consumed by man or animal and
the crop residues are used as cattle feed orthey are incorporated into soil or burnt. This
is not so in forestry or plantation agriculturewith perennial tree species. For example, a
plantation like natural rubber (Heveabrasiliensis) has an economic life cycle of 25- 30
years and therefore, the carbon sequesteredin the biomass in rubber plantations will stay
for this long.
Automobile tyres, whether they aremade of natural or synthetic rubbers, are
indispensable to man. Automobiles areresponsible for emission of roughly 14% of
the global GHGs (Stern, 2006). Naturalrubber plantations help to mitigate the
atmospheric CO2 concentration in two
different ways. First, it supplies natural
rubber which can be used in place ofsynthetic rubbers that are produced frompetroleum stocks. Production of synthetic
rubbers results in huge emission of CO2.
Secondly, natural rubber plantations have thecapacity to sequester significant quantitiesof CO
2 from the atmosphere. This study
attempts to measure the capacity of a rubberplantation to sequester atmospheric CO
2.
There are several methods to study the
CO2 sequestration potential of a perennial
plantation crop like natural rubber. Biomass
inventory method is the most easily available
and commonly used method which gives an
estimate of the total amount of carbon stored
in the various components over a period of
time (Jacob and Mathew, 2004; Jacob, 2005).
In the present study a state-of-the-art method
known as eddy covariance (EC) technique
was used for measuring CO2 and water flux
in a 4-5 year old natural rubber plantation in
central Kerala continuously for a period of
one year.
MATERIALS AND METHODSExperimental site
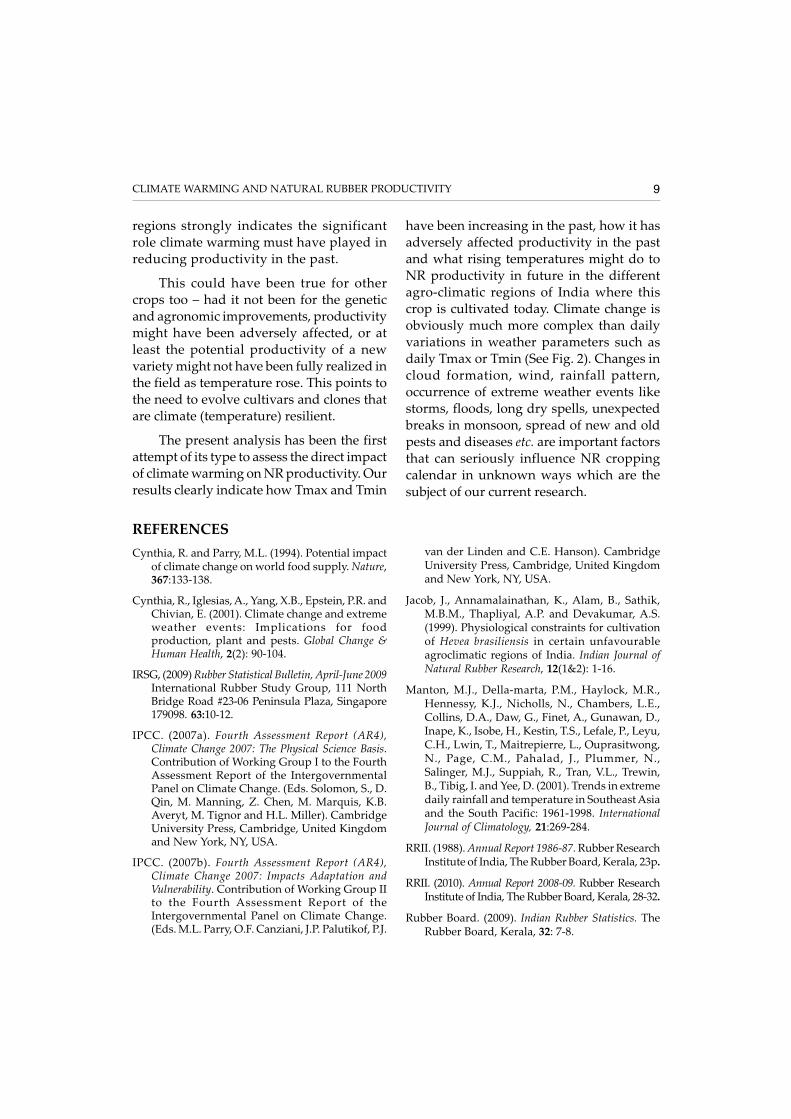
The experimental site was situated at theCentral Experimental Station (CES) of
Rubber Research Institute of India (RRII) atChethackal, Pathanamthitta District, Kerala
(Fig. 1). The location is 90 26’N and 760 48’E.The study was carried out in an immature
260, RRII 430 and ten ortet selections, spreadover more than five hectare area with almost
uniform growth. The average height of thetrees was 10 m and girth was 35 cm at 150 cm
above the bud union of the plant when thestudy began in March 2009. Results given
here are based on the measurements madebetween April 2009 and March 2010.
Eddy covariance technique for atmosphericflux analysis
Eddy covariance (EC) method is asophisticated micro-meteorological methodin which the fluxes of CO
2 and water vapour
ECOSYSTEM FLUX MEASUREMENTS IN RUBBER
30
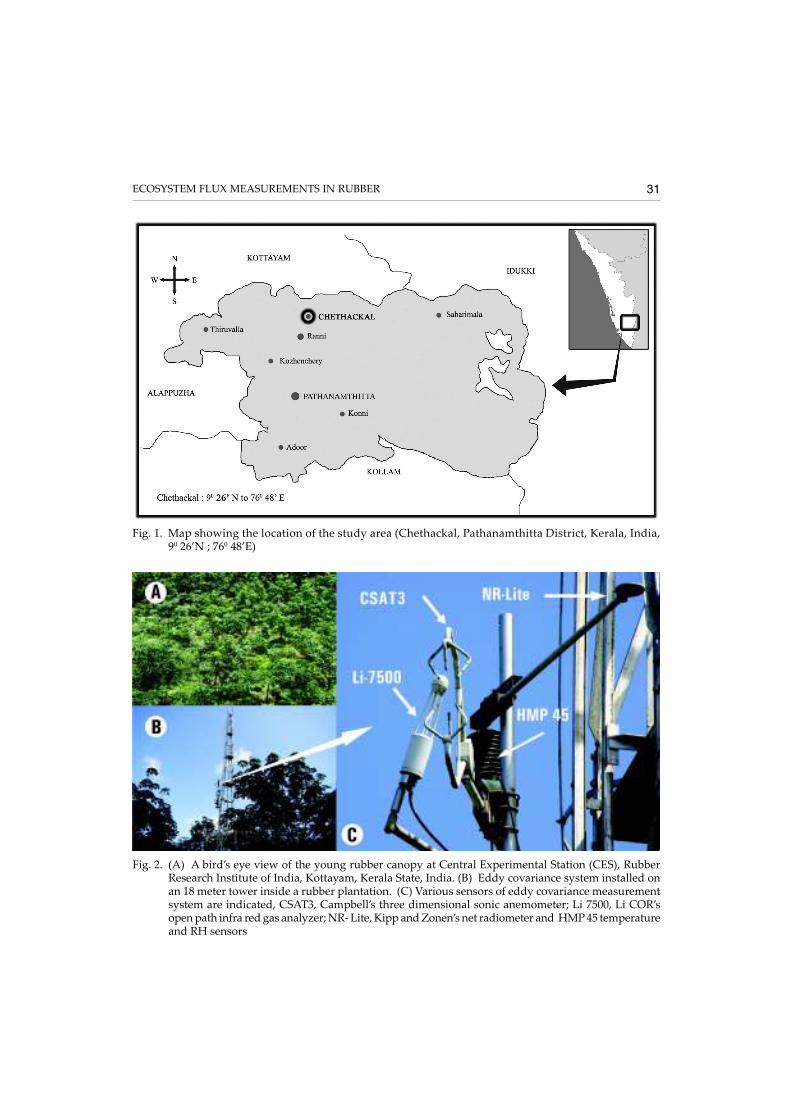
and three-dimensional wind velocities aremeasured on real time basis (Baldocchi,2003). The EC system comprises of a threedimensional sonic anemometer (CSAT3,
Campbell, USA) which is used together withan open path infra red gas analyzer (Li-7500,
Li-Cor, USA). Additionally the system isequipped with a net radiometer (NR-Lite,
USA) and temperature and relative humidity
(RH) sensors (HMP 45, Vaisala, Finland)
(Fig.2). Other weather parameters namely,
rainfall, maximum and minimum
temperatures, sunshine hours, etc. were
collected from an adjacent weather station
at CES, Chethackal. Carbon dioxide (Fc) and
water vapour fluxes of the rubber plantation
were continuously measured by eddy
covariance technique for the above period.
The EC equipments were commissioned on
a flux tower of 18 m height and the various
sensors were fixed on the tower at 4 m above
the canopy (Fig. 2).
Raw data were collected and corrected
by Edi Re software and processed into half-
hourly values. There are several parameters
necessitating correction of the measured
signals (Massman and Lee, 2002). The planar
fit corrections have been done for averaging
the mean vertical wind by using Edi Re
software. Data on CO2 flux (Fc) and the water
vapour flux which is measured as latent heat
of vapourisation (LE) were corrected fordensity effects (Webb et al., 1980). Daily
diurnal net ecosystem exchange of CO2
(NEE) and day and night flux rates were also
calculated. The latent heat of vapourization(LE) was used to calculate evapotranspiration
(ET) on a per day basis. The downloaded and
corrected data table contains half hourly
mean values of net radiation, air temperature,
relative humidity (RH), fluxes of CO2 (Fc),
water (LE) and sensible heat (H). The rates
of ecosystem photosynthesis, respiration and
decomposition will vary diurnally and
seasonally in response to interactions
between the physical environment like
irradiance, moisture and temperature and
biotic factors like plant phenology, soil
microbial metabolism and heterotrophic CO2
release (Goulden et al., 2004). Therefore,
attempts were also made to correlate the CO2
flux values with prevailing environmental
conditions.
Net ecosystem level flux of CO2 and water
vapor in real time was calculated. The net CO2
exchange obtained from the EC system is the
difference between photosynthetic
assimilation by the vegetation and the total
respiratory CO2 efflux from the foliage, roots
and soil (Lalrammawia and Paliwal, 2010). In
the present study, ecosystem level net CO2
sequestration rates (photosynthesis and
respiration, including litter decomposition)
and evapotranspiration for a one year period
in a 4-5 year old rubber plantation is described.
Accounting of tree biomass
The above ground dry weight of a rubbertree was calculated using the Shorrock’sregression model:
W= 0.002604 G2.7826 (Shorrocks et al., 1965)
where, G is trunk girth (cm) at a height of150 cm from bud union. 15-20% of the shootbiomass was taken as the root biomass.
RESULTS AND DISCUSSION
Diurnal pattern of net ecosystemexchange of CO
2 (NEE) clearly indicates two
phases namely, a net fixation of CO2 occurring
during day time (influx) and net release ofCO
2 from the system into the atmosphere
during night time (efflux) (Fig. 3). By default,
ANNAMALAINATHAN et al.
31ECOSYSTEM FLUX MEASUREMENTS IN RUBBER
Fig. 1. Map showing the location of the study area (Chethackal, Pathanamthitta District, Kerala, India,90 26’N ; 760 48’E)
Fig. 2. (A) A bird’s eye view of the young rubber canopy at Central Experimental Station (CES), RubberResearch Institute of India, Kottayam, Kerala State, India. (B) Eddy covariance system installed onan 18 meter tower inside a rubber plantation. (C) Various sensors of eddy covariance measurementsystem are indicated, CSAT3, Campbell’s three dimensional sonic anemometer; Li 7500, Li COR’sopen path infra red gas analyzer; NR- Lite, Kipp and Zonen’s net radiometer and HMP 45 temperatureand RH sensors
32
net influx of CO2 into the ecosystem (net
photosynthesis) is shown as negative fluxand net efflux of CO
2 (net respiration) is
shown as positive flux which includesrespiration from all living components anddecomposition, collectively termedecosystem respiration (R
eco). The difference
between the amount of net fixation duringday time and the CO
2 lost as R
eco during night
time is the net fixation of CO2 by the
ecosystem for a given day. As sunlightintensity increases, net CO
2 flux gradually
becomes negative (indicating netphotosynthesis or CO
2 influx or sequestration
into the ecosystem) and this generally remainsnegative until sunset. In the evening as lightintensity declines R
eco becomes greater than
CO2 fixation (Fig. 3). Evapotranspiration
followed an opposite pattern as that of CO2
flux (Fig. 3).
During the study period, the daily NEEby the rubber ecosystem ranged 1-25g CO
2/
m2/day (Fig. 4). Most of the days recordedCO
2 influx in to the plantation; however, a
few days (around 25 days during the oneyear study period) recorded net carbon effluxfrom the plantation to atmosphere. On thosedays, around 1-7g CO
2/m2/day was released
to atmosphere and during these days therewas rain and relatively fewer sunshine hours.The net efflux on certain days would haveincluded the possible high rate of total soilrespiration (R
s) both by autotrophic (R
a) and
heterotrophic (Rh) components of the soil in
addition to the net CO2 release from leaf
respiration. The soil respiration rategenerally depends on the soil moisture,temperature, organic composition, density ofmicrobial population and rate of
decomposition of organic contents (Stephen
Fig. 3. A typical diurnal CO2 and water flux (25
th July 2009) pattern in an immature rubber plantation (4-5
years old)
ANNAMALAINATHAN et al.
33
Fig. 4. Daily net CO2 flux (Fc) in a 4-5 year old immature rubber plantation in central Kerala for a continuous
one year period. Short gaps in the data are due to equipment failure from thunder storm, powerfailure etc.
Fig. 5. Mean monthly ecosystem exchanges of CO2 in a 4-5 year old rubber plantation. The mean ecosystem
respiration (Reco), ecosystem CO2 assimilation (Aeco
) and net ecosystem CO2 exchange (NEE) onper day basis are depicted
ECOSYSTEM FLUX MEASUREMENTS IN RUBBER
34
and Theodore, 1979). Intermittent heavy
rainy days witnessed a net efflux of CO2 to
atmosphere, most probably, due to a low rateof canopy photosynthesis due to poor solarlight and possible sudden spurts in releaseof locked up CO
2 from the air space in the
soil. Sunny days (when soil moisture level wasnot deficient) were more favourable forsequestration of carbon by the rubberplantation. On an annual average, the NEE was11g CO
2/m2/day during the study period which
is equivalent to 33.5 tons of CO2/ha/year.
The net CO2 assimilation (A
eco) and net
respiratory CO2 efflux (R
eco) were calculated
for the entire year. While the mean Reco
was
2.5g CO2/m2/day, the net assimilation rate
(Aeco
) recorded was 13.5g CO2/m2/day (Fig. 5).
Though there was considerable rate ofecosystem respiration at night, the CO
2
assimilation during daytime was much
higher in rubber plantation making it a netsink of CO
2. In a study with mature rubber
plantation in Thailand, Thaler et al. (2008)got similar rates of sequestration and theyhave suggested that ecosystem level ECmeasurement of CO
2 and water fluxes could
be used to model gas exchange of rubberplantation according to prevailing climate
and other environmental parameters.
The daily flux data were analyzed inrelation to prevailing maximum temperature
(Tmax) and sunshine hours of the day, but aclear relationship was not observed
throughout the study period, most likely dueto other factors such as soil moisture and
VPD interfering with photosynthesis andrespiration (Stephen and Theodore, 1979;Orchard and Cook, 1983). In general, dayswith lengthy sunshine hours recorded highrate of net ecosystem exchange (Fig. 6).
Fig. 6. Sunshine hours (SSH) and net ecosystem exchange of CO2 (NEE). Days with lengthy sunshine hours
recorded high rate of net ecosystem exchange (NEE)
ANNAMALAINATHAN et al.
35
During summer months sunlight was plentybut soil moisture deficit and highatmospheric VPD could restrict canopyphotosynthesis and hence NEE. The NEEwas relatively higher during pre-monsoonperiod when the soil is fully recharged withmoisture after the initial showers. Duringcontinuously cloudy and incessant rainydays, either NEE was very low or the netecosystem respiration rate was higher thannet assimilation.
The rate of evapo-transpiration (ET) wascalculated from the downloaded data onlatent heat of vapourization (LE). The meanET was 3.5 mm/day during the study period(Fig. 7). Earlier studies with lysimetricmethod in the traditional rubber growingareas of Kerala showed that the mean ET was4.4 mm per day (Jessy et al., 2002).
The amount of carbon sequestered bythe rubber plantation was estimated duringthe same period by estimating the annualshoot biomass increment during this period
Fig. 7. Water flux in a 4-5 year old rubber plantation in central Kerala for a continuous one year period
using Shorrock’s method. From the shoot
biomass estimation, the amount of CO2
sequestration was calculated as 13.5 t
CO2/ha/yr which does not include root
biomass, soil respiration, litter decomposition
and sequestration by weeds and other
vegetation inside the plantation such as cover
crops. Carbon stock in rubber plantations has
been worked out earlier by biomass inventory
method (Jacob and Mathew, 2004; Wauters
et al., 2008). The amount of carbon stored in
one hectare of a 33 year-old stand was 596
mt. Total carbon sequestered by rubber
plantations under Kerala conditions for a 21
year period was estimated to be 67 t C/acre
and it was reported that the sequestration
capacity of rubber plantation was much
higher than most other terrestrial ecosystems
(Jacob and Mathew, 2004). A 14 year old
rubber holding had a carbon stock of 76 t C/ha
in its above ground biomass which is
equivalent to 19.9t CO2/ha/yr (Wanters et al.,
2008). The contribution of the soil organic
ECOSYSTEM FLUX MEASUREMENTS IN RUBBER
36
carbon pool amounted to 135 t C/ha (Wauters
et al., 2008).
Our studies show that natural rubberplants are a good sink for atmospheric CO
2
round the year. Cultivation of rubber trees onnon forested land is a good land use optionto mitigate rising concentration of CO
2 in the
atmosphere. Under Kyoto Protocol, forestryor plantation activities that sequesteratmospheric carbon into biomass can generateCO
2 offset credits that could further help in
reduction of fossil fuel use (Suruchi andSingh, 2002), but existing plantations are not
eligible for this credit. However, there arealternative carbon markets where carboncredits from existing plantations are alsogetting greater acceptability.
ACKNOWLEDGEMENTS
The authors thank Dr. MallinathPriyadarshan, Deputy Director, CentralExperimental Station for his help inmaintenance of the eddy covariance tower.Thanks are also due to Dr. R. Krishnakumar,Joint Director, Crop Physiology Division, RRIIfor his support in commissioning the tower.
ANNAMALAINATHAN et al.
REFERENCES
Baldocchi, D.D. (2003). Assessing ecosystem carbonbalance. Problems and prospects of the eddycovariance technique. Global Change Biology, 9:476-492.
Goulden, M.L., Miller, S.D., Da Rocha, H.R, Menton,M.C., De Freitas, H.C., E Silva Figueira, A.M.,and Dias De Sousa, C.A. (2004). Diel andseasonal patterns of tropical forest CO
2
exchange. Ecological Applications, 14(4): 42-54.
Intergovernmental panel on climate change 2000.(IPCC 2000). Methodological and technological issuesin ‘Technology Transfer’, ISBN 92-9169-112-7.
Jacob, J. (2005). The science, politics and economics ofglobal climate change: Implications for the carbonsink projects. Current Science, 89(3): 464-474.
Jacob, J. and Mathew, N.M. (2004). Eco-friendly NRplantations can tap vast global funding. RubberAsia. March-April, 2004.
Jessy, M.D., Dey, S.K, Prathapan, K., Joseph John,Mathew, T.P and Punnoose, K. I. (2002). Effectof drip irrigation on growth of immature rubber.Journal of Natural Rubber Research, 15(2): 182-186.
Kumar, G.P., Ashutosh, A.M, Gupta, S. and Singh,S.B. (2009). Carbon sequestration with specialreference to agro forestry in cold deserts ofLadakh. Current Science, 97: 1063-1068.
Lalrammawia, C. and Paliwal, K. (2010). Seasonalchanges in net ecosystem exchange of CO
2 and
respiration of Cenchrus ciliaris L. grasslandecosystem in semi-arid tropics: an eddy covariancemeasurement. Current Science, 98(9): 1211-1218.
Malhi, Y., Phillips, O. and Grace, J. (2001). AreAmazonian rain forests absorbing carbon and
increasing in biomass? A comparison of evidenceand insights from measurements of carbon
dioxide fluxes and forest biomass change. In:Tropical Ecosystems: Structure, diversity, and
Human Welfare. Proceedings of the InternationalConference on Tropical Ecosystems. Oxford-IBH,
New Delhi, 27-28 p.
Massman, W. J. and Lee, X. (2002). Eddy covariance
flux corrections and uncertainties in long termstudies of carbon and energy exchange.
Agriculture and Forest Meteorology, 113: 121-144.
Orchard, V.A. and Cook, F. J. (1983). Relationshipbetween soil respiration and soil moisture. Soil
Biology and Biochemistry, 15: 447-453.
Roger, S.S. (2001). Sequestration of carbon by soil.
Soil science, 166(11): 858-871.
Shorrocks, V.M. (1965). Mineral nutrition, growthand nutrient cycle of Hevea brasiliensis. Growth
and nutrient content. Journal of Rubber ResearchInstitute of Malaysia, 19: 32-47.
Solomon, S., Dahe, Q., Martin, M., Melinda, M.,Kristen, A., Melinda, M.B., Tignor, H., LeRoy,
M. Jr., and Zhenlin, C. (2007). Climate Change,
37
The physical science basis. Contribution ofWorking Group I to the Fourth Assessment Reportof the Intergovernmental Panel on Climate Change,Cambridge University Press, Cambridge, UnitedKingdom and New York, NY, USA. Summaryfor policy makers. pp. 1-18.
Stephen, G.P. and Theodore, T.K. (1979). Stomatalresponse of populus clones to light intensity andvapor pressure deficit. Plant Physiology, 64: 112-114.
Stern, N. (2006). Stern review on the economics ofclimate change. Executive summary.
Suruchi, B. and Singh, R. (2002). Carbon sequestrationestimates for forestry options under differentland-use scenarios in India. Current Science,83: 1380-1386.
Takahashi, T., Sutherland, C., Sweeney, A., Poisson,N., Tilbrook, N., Bates, R., Wanninkhof, R.A.,Feely, C., Sabine, J., Olafsson and Nojiri, Y.C.(2002). Global sea-air CO2 flux based on
climatological surface ocean CO2 and seasonalbiological temperature effects. Deep Sea ResearchII, 49: 1601-1622.
Thaler, P., Siripornpakdeekul, P., Kasemsap, P., Kunjet,S., Chairungsee, N., Kositsup, B., Roupsard, O.,Gay, F., Chantuma, A., Thanisawanyangkura, S.,Sangkhasila, K., Sathornkich, J. and Bonnefond,J.M. (2008). Rubberflux. Progress in CO2 andwater budget evaluation of rubber plantations inThailand. AsiaFlux Workshop 2008, 17-19November 2008, Seoul, Republic of Korea.
Wauters, J.B., Coudert, S., Grallien, E., Jonard, M.and Ponette, Q. (2008). Carbon stock in rubberplantation in Western Ghana and Mato Grosso(Brazil). Forest Ecology and Management, 255(7):2347-2361.
Webb, E.K., Pearman, G.I and Leuning, R. (1980).Corrections of flux measurements for densityeffects due to heat and water vapour transfer.Quarterly Journal of Royal Meteorological Society,106: 86-100.