234
BREEDE VALLEY MUNICIPALITY ANNUAL REPORT 2010/11 Page 1 As approved by Council on 29 March 2012

BREEDE VALLEY MUNICIPALITY ANNUAL REPORT 2010/11
Page 1
As approved by Council on 29 March 2012
Resolution Number: C21/2012

BREEDE VALLEY MUNICIPALITY ANNUAL REPORT 2010/11
TABLE OF CONTENTS
EXECUTIVE MAYOR’S FOREWORD................................................................................................................................... 11
MUNICIPAL MANAGER’S FOREWORD............................................................................................................................. 13
CHAPTER 1: INTRODUCTION AND MUNICIPAL OVERVIEW..............................................................................................17
1.1 MUNICIPAL OVERVIEW....................................................................................................................................................17
1.1.1 Vision and Mission............................................................................................................................................17
1.1.2 Demographic Information................................................................................................................................17
a) Municipal Geographical Information...................................................................................................................................17
b) Population...........................................................................................................................................................................21
c) Households..........................................................................................................................................................................22
d) Key Economic Activities.......................................................................................................................................................23
1.1.3 Socio Economic Information.............................................................................................................................23
a) Socio Economic growth.......................................................................................................................................................23
1.1.4 Municipal Challenges........................................................................................................................................23
CHAPTER 2: GOVERNANCE............................................................................................................................................. 25
2.1 NATIONAL KEY PERFORMANCE INDICATORS - GOOD GOVERNANCE AND PUBLIC PARTICIPATION....................................................26
2.2 PERFORMANCE HIGHLIGHTS - GOOD GOVERNANCE AND PUBLIC PARTICIPATION........................................................................26
2.3 CHALLENGES - GOOD GOVERNANCE AND PUBLIC PARTICIPATION.............................................................................................26
2.4 GOVERNANCE STRUCTURE................................................................................................................................................28
2.4.1 Political Governance Structure..........................................................................................................................28
a) Council................................................................................................................................................................................. 28
b) Executive Mayoral Committee.............................................................................................................................................32
c) Committees.........................................................................................................................................................................34
2.4.2 Administrative Governance Structure...............................................................................................................34
2.5 PUBLIC ACCOUNTABILITY..................................................................................................................................................35
2.5.1 Ward Committees.............................................................................................................................................35
2.5.2 Functionality of Ward Committee.....................................................................................................................45
2.5.3 Representative Forums.....................................................................................................................................47
a) Labour Forum......................................................................................................................................................................47
Page 2

BREEDE VALLEY MUNICIPALITY ANNUAL REPORT 2010/11
b) IDP Forum............................................................................................................................................................................48
2.6 CORPORATE GOVERNANCE...............................................................................................................................................48
2.6.1 Anti-Corruption and anti-fraud.........................................................................................................................48
a) Developed Strategies...........................................................................................................................................................48
b) Implementation of Strategies..............................................................................................................................................48
2.6.2 Audit Committee/s............................................................................................................................................50
a) Functions of the Audit Committee.......................................................................................................................................50
b) Members of the Audit Committee.......................................................................................................................................51
2.6.3 Performance audit committee..........................................................................................................................51
a) Functions of the Performance Audit Committee.................................................................................................................51
b) Members of the Performance Audit Committee.................................................................................................................52
2.6.4 Internal Auditing...............................................................................................................................................52
2.6.5 By-Laws and Policies.........................................................................................................................................57
2.6.6 Communication.................................................................................................................................................58
2.6.7 Website.............................................................................................................................................................59
CHAPTER 3: ORGANISATIONAL DEVELOPMENT PERFORMANCE......................................................................................62
3.1 NATIONAL KEY PERFORMANCE INDICATORS – MUNICIPAL TRANSFORMATION AND ORGANISATIONAL DEVELOPMENT........................62
3.2 PERFORMANCE HIGHLIGHTS – MUNICIPAL TRANSFORMATION AND ORGANISATIONAL DEVELOPMENT............................................62
3.3 CHALLENGES – MUNICIPAL TRANSFORMATION AND ORGANISATIONAL DEVELOPMENT.................................................................63
3.4 INTRODUCTION TO THE MUNICIPAL WORKFORCE..................................................................................................................63
3.4.1 Employment Equity...........................................................................................................................................63
A) Employment Equity targets/actual......................................................................................................................................63
B) EMPLOYMENT EQUITY VS. POPULATION..............................................................................................................................64
C) Occupational Categories – Race..........................................................................................................................................64
d) Occupational Levels - Race..................................................................................................................................................65
e) Departments - Race.............................................................................................................................................................65
3.4.2 Vacancy Rate....................................................................................................................................................66
3.4.3 Turnover rate....................................................................................................................................................68
Page 3

BREEDE VALLEY MUNICIPALITY ANNUAL REPORT 2010/11
3.5 MANAGING THE MUNICIPAL WORKFORCE...........................................................................................................................69
3.5.1 Injuries..............................................................................................................................................................69
3.5.2 Sick Leave.........................................................................................................................................................70
3.5.3 HR Policies and Plans........................................................................................................................................71
3.5.4 Employee Performance Rewards......................................................................................................................72
3.6 CAPACITATING THE MUNICIPAL WORKFORCE.......................................................................................................................73
3.6.1 Skills Matrix......................................................................................................................................................73
3.6.2 Skills Development – Training provided............................................................................................................75
3.6.3 Skills Development - Budget allocation.............................................................................................................76
3.7 MANAGING THE MUNICIPAL WORKFORCE EXPENDITURE........................................................................................................76
3.7.1 Personnel Expenditure......................................................................................................................................76
CHAPTER 4: STRATEGIC PERFORMANCE.......................................................................................................................... 79
4.1 NATIONAL KEY PERFORMANCE INDICATORS – BASIC SERVICE DELIVERY AND LOCAL ECONOMIC DEVELOPMENT................................82
4.2 STRATEGIC SERVICE DELIVERY BUDGET IMPLEMENTATION PLAN (TOP LAYER)............................................................................82
4.2.1 Top Level SDBIP - Good Governance and Public Participation...........................................................................84
4.2.2 Top Layer SDBIP - Municipal Transformation and Institutional Development...................................................88
4.2.3 Top Layer SDBIP - Municipal Financial Viability and Management...................................................................89
4.2.4 Top Layer SDBIP - Local Economic Development...............................................................................................90
4.2.5 Top Layer SDBIP - Basic Service Delivery...........................................................................................................90
4.3 DEVELOPMENT AND SERVICE DELIVERY PRIORITIES FOR 2011/12...........................................................................................97
4.3.1 Assure financial viability and sustainable growth.............................................................................................97
4.3.2 To actively participate in determining the future of our country......................................................................98
4.3.3 To create an enabling environment for employment and poverty eradication through proactive economic development and tourism...............................................................................................................................................99
4.3.4 To ensure a healthy and productive work environment - happy employees supported by a proactive accountable leadership team..........................................................................................................................................99
4.3.5 To ensure a safe, healthy, clean and sustainable external environment for all Breede Valley's people..........100
4.3.6 To provide and maintain basic services and ensure social upliftment of the Breede valley community..........100
4.4 BASIC SERVICE DELIVERY................................................................................................................................................103
Page 4

BREEDE VALLEY MUNICIPALITY ANNUAL REPORT 2010/11
4.4.1 Basic services delivery Performance highlights...............................................................................................103
4.4.2 Basic services delivery challenges...................................................................................................................103
4.4.3 Access to Free Basic Services...........................................................................................................................104
4.4.4 Access to basic level of services......................................................................................................................105
a) Capital budget spent on municipal services.......................................................................................................................105
b) Percentage spending on total capital budget....................................................................................................................107
c) Summary of backlogs that must still be addressed............................................................................................................107
4.4.5 Water and Sanitation.....................................................................................................................................108
a) Water Service Delivery Levels............................................................................................................................................108
b) Sanitation Service Delivery Levels......................................................................................................................................110
4.4.6 Electricity........................................................................................................................................................112
4.4.7 Housing...........................................................................................................................................................114
4.4.8 Refuse Removal..............................................................................................................................................115
4.4.9 Roads..............................................................................................................................................................116
a) Tarred Roads.....................................................................................................................................................................116
b) Gravelled Roads.................................................................................................................................................................116
c) Cost of Construction/Maintenance....................................................................................................................................116
4.4.10 Storm water...............................................................................................................................................117
a) Storm Water Infrastructure...............................................................................................................................................117
b) Cost of Construction/Maintenance....................................................................................................................................117
4.5 MUNICIPAL INFRASTRUCTURE AND OTHER GRANTS..............................................................................................................118
4.6 ADDITIONAL PERFORMANCE...........................................................................................................................................119
4.7 LED...........................................................................................................................................................................121
4.7.1 Highlights: LED................................................................................................................................................121
4.7.2 Challenges: LED..............................................................................................................................................121
4.7.3 LED Strategy...................................................................................................................................................121
4.7.4 Economic Activity............................................................................................................................................124
4.7.5 LED initiatives.................................................................................................................................................124
Page 5

BREEDE VALLEY MUNICIPALITY ANNUAL REPORT 2010/11
4.8 TOURISM....................................................................................................................................................................125
4.8.1 Aim and function of Tourism Section..............................................................................................................125
4.8.2 The Local Tourism Organisation (LTO)............................................................................................................125
4.8.3 The Cape winelands district municipality (CWDM) LTA Structure...................................................................125
4.8.4 Training/DEVELOPMENT.................................................................................................................................127
4.8.5 Tourism Awareness/EVENTS...........................................................................................................................127
4.9 SERVICE PROVIDERS STRATEGIC PERFORMANCE..................................................................................................................128
CHAPTER 5: FUNCTIONAL PERFORMANCE..................................................................................................................... 129
5.1 PERFORMANCE HIGHLIGHTS PER FUNCTIONAL AREAS..........................................................................................................131
5.2 OVERVIEW OF PERFORMANCE.........................................................................................................................................136
5.3 PERFORMANCE PER FUNCTIONAL AREA (DEPARTMENTAL/OPERATIONAL SDBIP)..................................................137
5.3.1 Office of the Municipal Manager...................................................................................................................137
5.3.2 Operational Services......................................................................................................................................139
5.3.3 Financial Services...........................................................................................................................................142
5.3.4 Public Safety and Community Development Services.....................................................................................144
5.3.5 Corporate Services..........................................................................................................................................146
CHAPTER 6: FINANCIAL PERFORMANCE........................................................................................................................ 148
6.1 FINANCIAL VIABILITY HIGHLIGHTS....................................................................................................................................149
6.2 FINANCIAL VIABILITY CHALLENGES....................................................................................................................................149
6.3 FINANCIAL SUSTAINABILITY.............................................................................................................................................150
a) National Key Performance Indicators - Municipal Financial Viability and Management....................................................150
6.3.1 Operating Results...........................................................................................................................................151
6.3.2 Outstanding Debtors......................................................................................................................................152
a) Gross outstanding debtors per service..............................................................................................................................152
b) Total debtors age analysis.................................................................................................................................................153
6.3.3 Viability indicators..........................................................................................................................................154
a) Level of reliance on grants and subsidies...........................................................................................................................154
b) Liquidity ratio.....................................................................................................................................................................155
Page 6
BREEDE VALLEY MUNICIPALITY ANNUAL REPORT 2010/11
6.3.4 Audited Outcomes..........................................................................................................................................155
6.3.5 Equitable Share vs Total Revenue...................................................................................................................156
6.3.6 Repairs and Maintenance...............................................................................................................................157
6.3.7 Capital funded by source................................................................................................................................159
LIST OF ABBREVIATIONS....................................................................................................................................... 160
ANNEXURE A: FINANCIAL STATEMENTS
ANNEXURE B: REPORT OF THE AUDITOR-GENERAL
ANNEXURE C: REPORT OF THE PERFORMANCE AUDIT COMMITTEE
ANNEXURE D: OVERSIGHT REPORT ON ANNUAL REPORT
LIST OF TABLES
TABLE 1: MUNICIPAL WARDS.........................................................................................................................................................18TABLE 2: DEMOGRAPHIC INFORMATION OF THE MUNICIPAL AREA – TOTAL POPULATION............................................................................21TABLE 3: TOTAL NUMBER OF HOUSEHOLDS........................................................................................................................................22TABLE 4: KEY ECONOMIC ACTIVITIES.................................................................................................................................................23TABLE 5: SOCIO ECONOMIC INFORMATION........................................................................................................................................23TABLE 6: MUNICIPAL CHALLENGES...................................................................................................................................................24TABLE 7: NATIONAL KPIS - GOOD GOVERNANCE AND PUBLIC PARTICIPATION PERFORMANCE....................................................................26TABLE 8: GOOD GOVERNANCE AND PUBLIC PARTICIPATION PERFORMANCE HIGHLIGHTS............................................................................26TABLE 9: GOOD GOVERNANCE AND PUBLIC PARTICIPATION CHALLENGES................................................................................................27TABLE 10: COUNCIL UNTIL 18 MAY 2011........................................................................................................................................29TABLE 11: COUNCIL AFTER 18 MAY 2011........................................................................................................................................31TABLE 12: COUNCIL MEETINGS........................................................................................................................................................31TABLE 13: EXECUTIVE MAYORAL COMMITTEE UNTIL 18 MAY 2011......................................................................................................32TABLE 14: EXECUTIVE MAYORAL COMMITTEE AFTER 18 MAY 2011......................................................................................................33TABLE 15: COMMITTEE MEETINGS..................................................................................................................................................33TABLE 16: ADMINISTRATIVE GOVERNANCE STRUCTURE.......................................................................................................................34TABLE 17: WARD 1 COMMITTEE MEETINGS......................................................................................................................................35TABLE 18: WARD 2 COMMITTEE MEETINGS......................................................................................................................................36TABLE 19: WARD 3 COMMITTEE MEETINGS......................................................................................................................................36TABLE 20: WARD 4 COMMITTEE MEETINGS......................................................................................................................................37TABLE 21: WARD 5 COMMITTEE MEETINGS......................................................................................................................................37TABLE 22: WARD 6 COMMITTEE MEETINGS......................................................................................................................................38TABLE 23: WARD 7 COMMITTEE MEETINGS......................................................................................................................................38TABLE 24: WARD 8 COMMITTEE MEETINGS......................................................................................................................................38TABLE 25: WARD 9 COMMITTEE MEETINGS......................................................................................................................................39TABLE 26: WARD 10 COMMITTEE MEETINGS....................................................................................................................................39TABLE 27: WARD 11 COMMITTEE MEETINGS....................................................................................................................................40TABLE 28: WARD 12 COMMITTEE MEETINGS....................................................................................................................................40TABLE 29: WARD 13 COMMITTEE MEETINGS....................................................................................................................................41TABLE 30: WARD 14 COMMITTEE MEETINGS....................................................................................................................................41
Page 7

BREEDE VALLEY MUNICIPALITY ANNUAL REPORT 2010/11
TABLE 31: WARD 15 COMMITTEE MEETINGS....................................................................................................................................42TABLE 32: WARD 17 COMMITTEE MEETINGS....................................................................................................................................42TABLE 33: WARD 18 COMMITTEE MEETINGS....................................................................................................................................43TABLE 34: WARD 19 COMMITTEE MEETINGS....................................................................................................................................44TABLE 35: FUNCTIONING OF WARD COMMITTEES..............................................................................................................................46TABLE 36: LABOUR FORUM............................................................................................................................................................47TABLE 37: STRATEGIES..................................................................................................................................................................48TABLE 38: IMPLEMENTATION OF THE STRATEGIES...............................................................................................................................49TABLE 39: MEMBERS OF THE AUDIT COMMITTEE...............................................................................................................................51TABLE 40: MEMBERS OF THE PERFORMANCE AUDIT COMMITTEE..........................................................................................................52TABLE 41: INTERNAL AUDIT COVERAGE PLAN....................................................................................................................................56TABLE 42: INTERNAL AUDIT FUNCTIONS...........................................................................................................................................57TABLE 43: BY-LAWS......................................................................................................................................................................58TABLE 44: POLICIES......................................................................................................................................................................58TABLE 45: COMMUNICATION ACTIVITIES...........................................................................................................................................59TABLE 46: WEBSITE CHECKLIST.......................................................................................................................................................60TABLE 47: NATIONAL KPIS– MUNICIPAL TRANSFORMATION AND ORGANISATIONAL DEVELOPMENT............................................................62TABLE 48: PERFORMANCE HIGHLIGHTS– MUNICIPAL TRANSFORMATION AND ORGANISATIONAL DEVELOPMENT............................................62TABLE 49: CHALLENGES – MUNICIPAL TRANSFORMATION AND ORGANISATIONAL DEVELOPMENT................................................................63TABLE 50: EE POPULATION 2010/11..............................................................................................................................................64TABLE 51: OCCUPATIONAL CATEGORIES............................................................................................................................................64TABLE 52: OCCUPATIONAL LEVELS...................................................................................................................................................65TABLE 53: DEPARTMENT - RACE.....................................................................................................................................................65TABLE 54: VACANCY RATE PER POST AND FUNCTIONAL LEVEL................................................................................................................66TABLE 55: VACANCY RATE PER SALARY LEVEL.....................................................................................................................................67TABLE 56: TURNOVER RATE...........................................................................................................................................................68TABLE 57: INJURIES.......................................................................................................................................................................69TABLE 58: SICK LEAVE...................................................................................................................................................................70TABLE 59: HR POLICIES AND PLANS..................................................................................................................................................71TABLE 60: PERFORMANCE REWARDS................................................................................................................................................72TABLE 61: SKILLS MATRIX..............................................................................................................................................................73TABLE 62: SKILLS DEVELOPMENT.....................................................................................................................................................75TABLE 63: BUDGET ALLOCATED AND SPENT FOR SKILLS DEVELOPMENT....................................................................................................76TABLE 64: PERSONNEL EXPENDITURE...............................................................................................................................................76TABLE 65: PERSONNEL EXPENDITURE...............................................................................................................................................78TABLE 66: NATIONAL KPIS – BASIC SERVICE DELIVERY AND LOCAL ECONOMIC DEVELOPMENT...................................................................82TABLE 67: TOP LAYER SDBIP PERFORMANCE PER NATIONAL KPA........................................................................................................83TABLE 68: TOP LAYER SDBIP – GOOD GOVERNANCE AND PUBLIC PARTICIPATION...................................................................................87TABLE 69: TOP LAYER SDBIP – MUNICIPAL TRANSFORMATION AND INSTITUTIONAL DEVELOPMENT............................................................88TABLE 70: TOP LAYER SDBIP – MUNICIPAL FINANCIAL VIABILITY AND MANAGEMENT..............................................................................89TABLE 71: TOP LAYER SDBIP – LOCAL ECONOMIC DEVELOPMENT........................................................................................................90TABLE 72: TOP LAYER SDBIP – BASIC SERVICE DELIVERY....................................................................................................................96TABLE 73: SERVICES DELIVERY PRIORITIES FOR 2011/12.....................................................................................................................97TABLE 74: SERVICES DELIVERY PRIORITIES FOR 2011/12.....................................................................................................................98TABLE 75: SERVICES DELIVERY PRIORITIES FOR 2011/12.....................................................................................................................99TABLE 76: SERVICES DELIVERY PRIORITIES FOR 2011/12.....................................................................................................................99TABLE 77: SERVICES DELIVERY PRIORITIES FOR 2011/12...................................................................................................................100TABLE 78: BASIC SERVICE DELIVERY PRIORITIES FOR 2011/12...........................................................................................................103TABLE 79: BASIC SERVICES DELIVERY HIGHLIGHTS............................................................................................................................103
Page 8

BREEDE VALLEY MUNICIPALITY ANNUAL REPORT 2010/11
TABLE 80: BASIC SERVICES DELIVERY CHALLENGES............................................................................................................................103TABLE 81: FREE BASIC ELECTRICITY SERVICES TO INDIGENT HOUSEHOLDS...............................................................................................104TABLE 82: FREE BASIC WATER SERVICES TO INDIGENT HOUSEHOLDS.....................................................................................................104TABLE 83: FREE BASIC SANITATION SERVICES TO INDIGENT HOUSEHOLDS...............................................................................................104TABLE 84: FREE BASIC REFUSE REMOVAL SERVICES TO INDIGENT HOUSEHOLDS PER TYPE OF SERVICE..........................................................105TABLE 85: ACCESS TO BASIC LEVEL OF SERVICES................................................................................................................................105TABLE 86: CAPEX.......................................................................................................................................................................105TABLE 87: TOTAL CAPITAL EXPENDITURE ON ASSETS..........................................................................................................................107TABLE 88: TOTAL CAPITAL EXPENDITURE.........................................................................................................................................107TABLE 89: BACKLOGS..................................................................................................................................................................107TABLE 90: WATER SERVICE DELIVERY LEVELS....................................................................................................................................108TABLE 91: SANITATION SERVICE DELIVERY LEVELS..............................................................................................................................110TABLE 92: ELECTRICITY SERVICE DELIVERY LEVELS..............................................................................................................................112TABLE 93: HOUSING WAITING LIST.................................................................................................................................................114TABLE 94: HOUSING...................................................................................................................................................................114TABLE 95: REFUSE REMOVAL SERVICE DELIVERY LEVELS......................................................................................................................115TABLE 96: TARRED ROADS............................................................................................................................................................116TABLE 97: GRAVELLED ROADS.......................................................................................................................................................116TABLE 98: COST OF ROAD CONSTRUCTION......................................................................................................................................116TABLE 99: STORM WATER INFRASTRUCTURE....................................................................................................................................117TABLE 100: COST OF CONSTRUCTION/MAINTENANCE OF STORM WATER SYSTEMS...................................................................................117TABLE 101: SPENDING OF GRANTS.................................................................................................................................................119TABLE 102: ADDITIONAL PERFORMANCE........................................................................................................................................120TABLE 103: LED HIGHLIGHTS.......................................................................................................................................................121TABLE 104: CHALLENGES LED.....................................................................................................................................................121TABLE 105: LED STRATEGIC AREAS................................................................................................................................................123TABLE 106: LED OBJECTIVES AND STRATEGIES................................................................................................................................123TABLE 107: ECONOMIC ACTIVITY BY SECTOR....................................................................................................................................124TABLE 108: LED INITIATIVES........................................................................................................................................................124TABLE 109: TOURISM AWARENESS/EVENTS....................................................................................................................................127TABLE 110: FUNCTIONAL AREAS...................................................................................................................................................131TABLE 111: PERFORMANCE HIGHLIGHTS PER FUNCTIONAL AREA.........................................................................................................135TABLE 112: SUMMARY OF TOTAL PERFORMANCE.............................................................................................................................136TABLE 113: FUNCTIONAL ALIGNMENT – OFFICE OF THE MUNICIPAL MANAGER.....................................................................................138TABLE 114: FUNCTIONAL ALIGNMENT – OPERATIONAL SERVICES.........................................................................................................140TABLE 115: FUNCTIONAL ALIGNMENT – FINANCIAL SERVICES.............................................................................................................142TABLE 116: FUNCTIONAL ALIGNMENT – PUBLIC SAFETY AND COMMUNITY DEVELOPMENT SERVICES..........................................................144TABLE 117: FUNCTIONAL ALIGNMENT – CORPORATE SERVICES...........................................................................................................146TABLE 118: FINANCIAL VIABILITY HIGHLIGHTS..................................................................................................................................149TABLE 119: FINANCIAL VIABILITY CHALLENGES.................................................................................................................................150TABLE 120: NATIONAL KPIS FOR FINANCIAL VIABILITY AND MANAGEMENT............................................................................................150TABLE 121: PERFORMANCE AGAINST BUDGETS.................................................................................................................................151TABLE 122: GROSS OUTSTANDING DEBTORS PER SERVICE...................................................................................................................152TABLE 123: SERVICE DEBTOR AGE ANALYSIS.....................................................................................................................................153TABLE 124: RELIANCE ON GRANTS.................................................................................................................................................154TABLE 125: LIQUIDITY RATIO........................................................................................................................................................155TABLE 126: AUDIT OUTCOMES......................................................................................................................................................155TABLE 127: 2010/11 DETAIL ON AUDIT OUTCOMES........................................................................................................................156TABLE 128: EQUITABLE SHARE VS. TOTAL REVENUE...........................................................................................................................156
Page 9

BREEDE VALLEY MUNICIPALITY ANNUAL REPORT 2010/11
TABLE 129: REPAIRS & MAINTENANCE AS % OF TOTAL OPEX............................................................................................................157TABLE 130: CAPITAL FUNDED BY SOURCE........................................................................................................................................159
LIST OF FIGURES
FIGURE 1: WESTERN CAPE AREA MAP..............................................................................................................................................21FIGURE 2: STRATEGY MAP.............................................................................................................................................................81FIGURE 3: SDBIP MEASUREMENT CATEGORIES..................................................................................................................................83
LIST OF GRAPHS
GRAPH 1: TOTAL % INDIGENT HOUSEHOLDS WITHIN THE MUNICIPAL AREA..............................................................................................22GRAPH 2: VACANCY RATE..............................................................................................................................................................67GRAPH 3: PERFORMANCE PER NATIONAL KEY PERFORMANCE AREA.......................................................................................................84GRAPH 4: WATER SERVICE DELIVERY LEVELS.....................................................................................................................................109GRAPH 5: WATER WITH MINIMUM SERVICE LEVEL............................................................................................................................109GRAPH 6: SANITATION/SEWERAGE SERVICE DELIVERY LEVELS.............................................................................................................111GRAPH 7: SANITATION/SEWERAGE MINIMUM STANDARDS.................................................................................................................111GRAPH 8: ELECTRICITY SERVICE DELIVERY LEVELS.............................................................................................................................113GRAPH 9: REFUSE REMOVAL SERVICE DELIVERY LEVELS.......................................................................................................................115GRAPH 10: OVERALL PERFORMANCE OF DIRECTORATES.....................................................................................................................137GRAPH 11: OFFICE OF THE MUNICIPAL MANAGER SUB-DIRECTORATE PERFORMANCE..............................................................................138GRAPH 12: OPERATIONAL SERVICES SUB-DIRECTORATE PERFORMANCE.................................................................................................141GRAPH 13: FINANCIAL SERVICES SUB-DIRECTORATE PERFORMANCE......................................................................................................143GRAPH 14: PUBLIC SAFETY AND COMMUNITY DEVELOPMENT SERVICES SUB-DIRECTORATE PERFORMANCE..................................................145GRAPH 15: CORPORATE SERVICES SUB-DIRECTORATE PERFORMANCE....................................................................................................147GRAPH 16: REVENUE..................................................................................................................................................................151GRAPH 17: OPERATING EXPENDITURE............................................................................................................................................152GRAPH 18: DEBT PER TYPE OF SERVICE...........................................................................................................................................153GRAPH 19: RELIANCE ON GRANTS AS %..........................................................................................................................................154GRAPH 20: REVENUE STREAMS.....................................................................................................................................................157GRAPH 21: REPAIRS AND MAINTENANCE AS PERCENTAGE OF OPEX.....................................................................................................158GRAPH 22: CAPITAL FUNDED BY SOURCE.........................................................................................................................................159
Page 10

BREEDE VALLEY MUNICIPALITY ANNUAL REPORT 2010/11
EXECUTIVE MAYOR’S FOREWORD
MAYOR’S FOREWORD
I have great pleasure to introduce the 2010/2011 Annual Report of the Breede Valley Municipality. In terms of Section 46 of the Municipal Systems Act No. 32 of 2000 and Section 121 (2) of the Municipal Finance Management Act No. 56 of 2003 municipal entities must prepare an annual report for each financial
year, reflecting on their performances – comparing performances with the targets of the previous financial year and setting out measures taken to improve performance. This Annual Report represents the Breede Valley Municipality’s accomplishments and challenges in exercising its developmental responsibility as the tier of government closest to the people.
Notwithstanding some complex challenges during the year under review I am satisfied that the Breede Valley Municipality complied with statutory requirements and succeeded in maintaining a satisfactory level of service delivery. The upgrading of the sewerage works, the construction of the N1 intersection and expansion of the existing road network are of special significance since it will most definitely enhance the Municipality’s competitiveness with regard to economic investment. It will also contribute to the broadening of the tax base and stimulate investor confidence.
In terms of administration, in addition to optimal service delivery, Council is striving to improve on the past three financial years’ unqualified audits, to attain a clean report by 2013.
In terms of developmental local government, the recent country wide service delivery protests signal an important message, namely the inclusion of our communities in the matters of local government.
South African society, following the first democratic elections in 1994 has entered an era of hope with high expectations of a better life for all its citizens. Although political liberation was obtained, social and economic inequalities continue to haunt South Africans with many still living under the poverty line. This is also the case in the Breede Valley.
To address these inequalities and heightened expectations, post-apartheid South Africa opted for a developmental approach with local government identified as the key site of delivery and development. Local government in terms of policy and legislation is at the coalface of development, entrusted with the responsibility to turn around the plight of the poor through participatory democracy and the implementation of development and service delivery programs.
Page 11

BREEDE VALLEY MUNICIPALITY ANNUAL REPORT 2010/11
In order to accommodate the economic and social needs of our people and to address inequalities in our communities it is of paramount importance that development in its broadest sense is attended to as a matter of urgency.
The challenge for Council is to address inequalities and expectations without compromising stability and recent successes in service delivery as portrayed in this annual report. A balanced and inclusive approach must be pursued.
I would like to thank all members of council for their participation and contribution during the course of the 2010/2011 financial year. A special word of thanks goes to our management and staff, who in terms of the Breede Valley Municipality’s mission, are treasured as the organisation’s most valuable resource and key to service delivery.
Cllr. Basil Kivedo
Executive Mayor
Page 12

BREEDE VALLEY MUNICIPALITY ANNUAL REPORT 2010/11
MUNICIPAL MANAGER’S FOREWORD
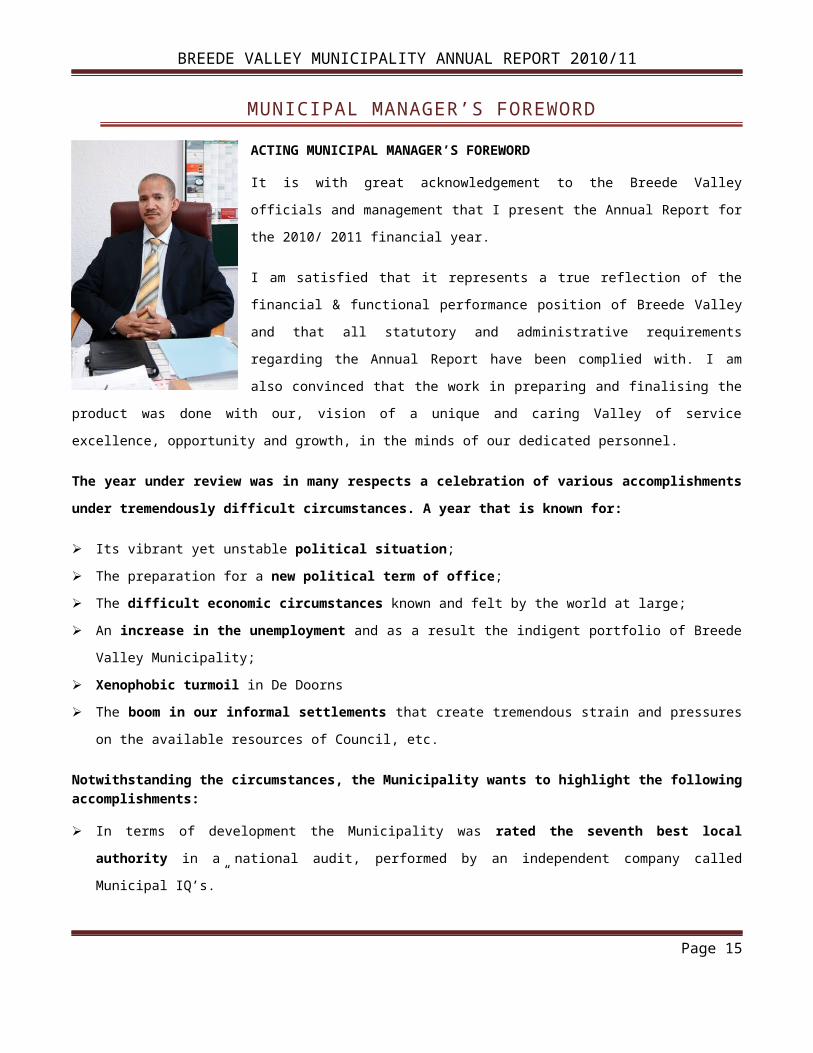
ACTING MUNICIPAL MANAGER’S FOREWORD
It is with great acknowledgement to the Breede Valley officials and management that I present the Annual Report for the 2010/ 2011 financial year.
I am satisfied that it represents a true reflection of the financial & functional performance position of Breede Valley and that all statutory and administrative requirements regarding the Annual Report have been complied with. I am also convinced that the work in preparing and finalising the product was done with our, vision of a unique and caring Valley of service excellence, opportunity and growth, in the minds of our
dedicated personnel.
The year under review was in many respects a celebration of various accomplishments under tremendously difficult circumstances. A year that is known for:
Its vibrant yet unstable political situation; The preparation for a new political term of office; The difficult economic circumstances known and felt by the world at large; An increase in the unemployment and as a result the indigent portfolio of Breede Valley
Municipality; Xenophobic turmoil in De Doorns The boom in our informal settlements that create tremendous strain and pressures on the
available resources of Council, etc.
Notwithstanding the circumstances, the Municipality wants to highlight the following accomplishments:
In terms of development the Municipality was rated the seventh best local authority in a national audit, performed by an independent company called Municipal IQ’s.”
The multi million rand upgrading of our sewerage works and road network to accommodate the need for commercial expansion will open up new investment opportunities, which will most certainly address unemployment;
The cooperation in bringing about the new bridge on the N1 interchange a definite first for Worcester along with the traffic circles that resulted out of the initiative;
Major housing projects as well as sustainable service delivery benefitted our communities;
Page 13

BREEDE VALLEY MUNICIPALITY ANNUAL REPORT 2010/11
After a succession of unqualified audit reports the past few years we are looking forward to improve on these achievements;
This annual report is a team effort, a combination of the skill and wisdom of various partners in excellence;
The Auditor-General acknowledged the progress made in the drivers of internal control to achieve clean administration, most notably the improved quality of the financial statements submitted for auditing, as well as the improvements effected to the performance management system of the municipality, which for the first time resulted in the production of an annual performance report. The Municipality again received an unqualified audit opinion with other matters.
I believe that with all requirements been addressed and our performance management system fully functional we are in a position to attain a clean report by 2013; and
An objective independent Credit Rating of A3 that is indicative of a healthy and sustainable financial position; and
With great appreciation to the response of the Breede Valley community and other stakeholders, on our call for debt recovery the Municipality accomplishes a 97% debt recovery rate.
The Municipality is also faced with different challenges that need to be addressed, such as:
Low morale & unacceptable conduct of staff Greater focus on Local Economic. Broadening the Tax base Create a greater sense of responsibility in the broader Breede Valley community Squatter Control Proper prioritisation of limited resources to. Seek for innovative ways to provide services Constant and continuous improvement of debt recovery; Expenditure Management such as Fleet management, Overtime, Telephone Cost, Leave
administration, etc.; Restructuring and alignment of the organisational structure To ensure the successful implementation of the Vision, Mission and objectives of the
new political regime, etc.
It is with great appreciation that I acknowledge the efforts of the Breede Valley Management team and Official with the specific acknowledgement of the constructive contribution from the previous Municipal Manager, Mr. Allan Paulse, who lead the team during the financial year under review. I
Page 14
BREEDE VALLEY MUNICIPALITY ANNUAL REPORT 2010/11
also want to acknowledge the constant political guidance received from the Breede Valley Municipal Council.
But mostly, as a public servant, who is constantly reminded by the plea of the poor and society at large, respectfully acknowledge and thank the Breede Valley community for their patience, constant sensitisation and demand for a better life for all.
Acting Municipal Manager
Breede Valley Municipality
DAVID McTHOMAS
Page 15

BREEDE VALLEY MUNICIPALITY ANNUAL REPORT 2010/11
Page 16
CHAPTER 1
MUNICIPAL OVERVIEW

BREEDE VALLEY MUNICIPALITY ANNUAL REPORT 2010/11
CHAPTER 1: INTRODUCTION AND MUNICIPAL OVERVIEW
1.1 MUNICIPAL OVERVIEW
This report addresses the performance of the Breede Valley Municipality in the Western Cape in respect of its core legislative obligations. Local government must create the participatory framework that defines and enhances the relationship between elected leaders and their communities. This requires that the council of the municipality provides regular and predictable reporting on programme performance and the general state of affairs in their locality.
The 2010/11 Annual Report reflects on the performance of the Breede Valley Municipality for the period 1 July 2010 to 30 June 2011. The Annual Report is prepared in terms of Section 121(1) of the Municipal Finance Management Act (MFMA), in terms of which the Municipality must prepare an Annual Report for each financial year.
1.1.1 VISION AND MISSION
The Breede Valley Municipality committed itself to the vision and mission of:
Vision:“A Unique and caring valley of service excellence, opportunity and growth”
Mission:“To provide sustainable and affordable services in a safe and healthy environment whilst promoting
social and economic welfare through participative governance and committed service orientated approach to treasure the staff as the organisation’s most valuable resource and key to service
delivery”
1.1.2 DEMOGRAPHIC INFORMATION
A) MUNICIPAL GEOGRAPHICAL INFORMATION
The most striking feature of the Breede Valley in the Western Cape is its scenic beauty. Majestic mountains, fertile valleys, vineyards and vast plains, covered with indigenous semi-desert vegetation, captivate the soul. The Region has an estimated population of 198 700 (inclusive of the informal settlements), covers an area of 3 015 km² and comprises of the towns Worcester, De Doorns, Rawsonville, Touws River and the Matroosberg rural area. The Breede valley has a
Page 17

BREEDE VALLEY MUNICIPALITY ANNUAL REPORT 2010/11
vibrant economy, based on strong agricultural, manufacturing and tourism sectors. The commercial and service sectors are also well-developed.
Wards
The Municipality is currently structured into the following 21 Wards:
WARD AREAS1 The entire community of Touws river, including business and residential areas2 De Doorns South Stofland, Hasie Square, Ekuphumleni3 The Centre of De Doorns4 De Doorns Town Centre and adjacent Farm Areas5 De Doorns Farming areas including Brandwag, De Wet and Sand Hills
6N1 Worcester entrance, Altona, Brandwag, Tuindorp, Bergsig, Van Riebeeck Park, Panorama
7 Residential areas of partly Esselenpark and Worcester West8 The Chessies and part of Worcester South9 Roodewal Area
10 Hexpark and Johnsonspark Area11 Noble Park 12 OVD, Parkersdam and Russell Scheme13 Avianpark 14 Riverview Flat and Parkersdam Area15 Langerug, Panorama and Goudini16 Zwelethemba17 Zwelethemba Residential space next to R300 on Robertson Road18 Zwelethemba 19 Part of the centre of Rawsonville and outlaying farming community20 Part of the centre of Rawsonville, and areas towards N121 Avianpark and all surrounding informal areas
Table 1: Municipal Wards
De Doorns, Hex River Valley
De Doorns lies on the main route to and from Cape Town, Johannesburg and Port Elizabeth. With its wide range of service and commercial facilities, De Doorns has become the business and shopping centre for the entire valley and surrounding towns. De Doorns is a town with a particularly impressive cultural heritage. In 1819 De Doorns was proclaimed a sub-drostdy of Tulbagh. Two
Page 18

BREEDE VALLEY MUNICIPALITY ANNUAL REPORT 2010/11
farms were bought for the purpose of laying out a town. In 1822 De Doorns was proclaimed a full drostdy.
The little town of De Doorns lies at the centre of the Hex River Valley only one and a half hours’ drive from Cape Town, just off the N1 and 35 kilometres north of Worcester, in the midst of South Africa’s Table Grape industry. This is a valley of vineyard upon vineyard, historical Cape Dutch homesteads, and snow-capped mountains during winter that combine to make it one of the most picturesque valleys, particularly during autumn when the different vines give rise to a display of variegated colour so rich that all who see it are inspired and none left untouched by its beauty.
De Doorns literally translated means ‘the thorns’ in Dutch and refers to the Acacia thorn trees that dominate the Hex River banks. De Doorns’ wine cellar boasts the longest harvest season in the world, from December through until April, and the area exports some 17 million cartons of grapes annually. Farms here lie nestled between the Hex and Quadou Mountains, which provide much in the way of hiking, mountain biking and rock climbing.
Rawsonville
Rawsonville is a small wine growing and farming community in the Breede River Valley of the Western Cape province of South Africa. The town forms part of the Breede Valley Local Municipality, and is located in a scenic portion of the valley on the eastern flanks of the Du Toitskloof Mountains.
The climate is hinterland (further from oceanic influences) Mediterranean, with cool, rainy winters and warm, dry summers. Due to its more inland location, winters can sometimes get frosty, with heavy snowfalls sometimes falling on the surrounding high-ground, summers are generally pleasant, although some February and March days can reach 38°C or higher.
The area is known for the Breedekloof Wine Route with its 22 Cellars and Wine Estates and also hosts the annual Breedekloof extreme sports festival. The economy remains heavily reliant on serving the agricultural community, however tourism in the form of weekend retreats are becoming more important to the town's income. Rawsonville is 90 km to the east of Cape Town and 15 km to the west of the large town of Worcester.
Touws River
On 7 November 1877, the Worcester-Matjiesfontein section of the Cape Government Railways’ Cape Town-Kimberley main line was opened to traffic. The line included a station, originally named "Montagu Road", where the line bridged the Touws River. The name was given in reference to the
Page 19

BREEDE VALLEY MUNICIPALITY ANNUAL REPORT 2010/11
town of Montagu, which lies about 90 kilometres (56 mi) to the south by road. In 1883 the station was renamed "Touwsrivier".
The town of Touws River developed around the railway depot, at which locomotives were changed after the climb over the Hex River Pass. It was particularly busy because of the need to bank trains over the pass; banking locomotives were turned at Touws River to return to De Doorns. From 1924 it also served as the junction for the branch line to Ladismith. The closing of the Ladismith branch in 1981 and the opening of the Hex River Tunnel in 1989 reduced the importance of Touws River as a depot.
Touws River received municipal government in 1962; with the transformation of local government in South Africa it has been incorporated into the Breede Valley Local Municipality. It is located in ward 1 of the local municipality, which in turn falls within the Cape Winelands District Municipality.
Touws River is located at an elevation of 770 meters (2,530 ft) on the south-western edge of the Great Karoo, east of the Hex River Mountains and north of the Langeberg, at the point where the Donkies River flows into the Touws River. It lies just to the south of the N1 highway, 180 kilometres (110 mi) by road from Cape Town. The railway line passes through the town, with the yards and depot being located just to the north-east; by rail it is 257 kilometres (160 mi) from Cape Town.
Worcester
Worcester is a town in the Western Cape, South Africa. It is located 120 km north-east of Cape Town on the N1 highway north to Johannesburg.
The Breede Valley Local Municipality was formed in December 2000 encompassing the towns of Touws River, De Doorns, Worcester and Rawsonville.
Worcester is the largest town in the Breede Valley Municipality, home to approximately 100 000 people, including those people living on the surrounding farms. It is an old town established in 1820 and named after Lord Charles Somerset’s nephew, the Marquis de Worcester. In 1823 there were only 10 houses in Worcester. It also serves as the administrative capital of the Breede Valley Local Municipality and as regional headquarters for most National and Provincial Government Departments. The town also serves as the hub of the Western Cape's interior commercial, distribution and retail activity with a shopping mall, well developed central business district and infrastructure.
Worcester is also the largest wine growing region in South Africa, both in number of vines and volume of wine produced, accounting for 20% of the total production. There is plenty to see and do
Page 20

BREEDE VALLEY MUNICIPALITY ANNUAL REPORT 2010/11
in the area and being so centrally situated with the surrounding towns and other places of interest an hour or less drive from Worcester it is an ideal base from which to explore the region.
Page 21

BREEDE VALLEY MUNICIPALITY ANNUAL REPORT 2010/11
Below is a map that indicates the five municipalities within the Cape Winelands District area:
Figure 1: Western Cape Area map
B) POPULATION
Population size provides an indication of the volume of demand for government services in a particular geographical space. It also serves as a planning measure to assist budget planners to match available resources to address the relative demand for services. Breede Valley has the 3rd largest population in Cape Winelands District with a population size of 134 270 in 2007 in accordance with the census of Stats SA.
a) Total Population
The table below indicates the total population within the municipal area from the Stats SA, Community Survey of 2007:
2001 2007146 028 134 270
Table 2: Demographic information of the municipal area – Total population
Source: Stats SA, Community Survey 2007
Page 22

BREEDE VALLEY MUNICIPALITY ANNUAL REPORT 2010/11
C) HOUSEHOLDS
The total number of households within the municipal area decreased from 26 317 households in 2009/10 financial year to a total of 25 791 households in 2010/11 financial year. This indicates a decrease in the total number of households within the municipal area over the two years.
Households 2008/09 2009/10 2010/11Number of households in municipal area *24 936 *26 317 *25 791Number of indigent households in municipal area 6 227 6 429 6 560
Table 3: Total number of households
*Note: The numbers of the households were amended and will therefore not match the figures in the previous year annual report.
The graph below shows that the total number of indigent households increased from 6 429 in 2008/09 to 6 560 in 2010/11 financial year.
Graph 1: Total % indigent households within the municipal area
Page 23

BREEDE VALLEY MUNICIPALITY ANNUAL REPORT 2010/11
Page 24

BREEDE VALLEY MUNICIPALITY ANNUAL REPORT 2010/11
D) KEY ECONOMIC ACTIVITIES
Intensive agricultural areas are located along river courses. The Municipality is dependent upon the following economic activities:
Key Economic Activities Description
AgricultureWineryTable grapes, olives, dairy
TourismAgri- and Outdoor Tourism, Wine Route, Big 5, Guesthouses and B&B’s, Canoeing and fishing, Hiking in mountains
Manufacturing Textiles, Steel tankers, Food processing, Brandy and Wood products
Table 4: Key Economic activities
1.1.3 SOCIO ECONOMIC INFORMATION
A) SOCIO ECONOMIC GROWTH
The socio-economic information for the municipal area is as follows:
Housing BacklogUnemployment
Rate Households with
No IncomePeople older than 14 years illiterate
HIV/AIDS Prevalence
% # % %25 300 19.7 3 138 20.1 8.8
Table 5: Socio Economic information
1.1.4 MUNICIPAL CHALLENGES
The following general challenges are experienced by the Municipality:
CHALLENGES ACTIONS TO ADDRESS
Local Economic Development and as a result broadening of the Tax base
The Municipality is in process to upgrade certain of its bulk services, such as the Worcester Waste Water Treatment Plant in order to create the capacity for future developments
High economic pressures during the 2010/ 2011 financial year that had a negative impact on service delivery
Improve the debt recovery rate furtherEnhance LED to eventually broaden the Tax base and promote employment creationCreate an understanding with management and the community that it can’t be business as usual.
Low moral & unacceptable conduct of staff that sometimes culminates in unprofessional and disloyal behaviour.
The implementation of an appropriate code of conduct, strengthened by a performance management system that speaks to all levels of the municipality will
Page 25

BREEDE VALLEY MUNICIPALITY ANNUAL REPORT 2010/11
CHALLENGES ACTIONS TO ADDRESSdefinitely assist to address the issue.Staff moral need to be further enhanced through a proper PMS that is linked to a recognition and reward system
Greater focus on Local Economic Development. The collaboration with other stakeholders, such as business, to ensure that the investment made in the upgrading of our bulk services, with reference to the Worcester Waste Water Treatment Plant, is being capitalised on, especially with the aim in mind to better the life of the poor through job creation.
Broadening the Tax base of the Municipality. To ensure an appropriate revenue resource based that will enhance financial health and sustainability.
Create a greater sense of responsibility in the broader Breede Valley community.
Create a sense of responsibility that speaks to the moral generation of a society with self-respect and pride and an understanding that something, like for instance irresponsible refuse/ rubbish distribution, above others, can create a high cost burden on the coffers of the municipalities and may result in unnecessary tariff increases for the community’s pockets.
Squatter Control and control on informal settlements. There’s a need that squatter control be constructively implemented to reduce the further expansion of a situation that will not only become uncontrollable but will impact negatively on the resources and pockets of the Breede Valley Society.
Proper prioritisation of limited resources. To efficiently, effectively and economically address the ultimate priorities of basic service delivery and as a result proper control over expenditures, such as proper fleet management, etc. Will assist that limited resources end up in the right priorities.
Seek for innovative ways to provide/ render services. To ensure that the required standard of service delivery, such as refuse removal & filling of potholes etc. is rendered, it is important that new ways are found to deal with service delivery, due to the fact that we know that resources are limited. It can’t be business as usual.
Constant and continuous improvement of debt recovery;
Although the debt recovery rate is good, the good is not well enough anymore and BVM acknowledges that it needs to pull out all stops to improve on the current rate.
Restructuring and alignment of the organisational structure.
To really ensure that we use our staff compliment in the most effective and efficient way it became a priority to ensure that we review the organisational structure in the context of proper alignment to ensure effectiveness and efficiency in service delivery along with economy in resource utilization.
To ensure the successful implementation of the Vision, Mission and objectives of the new political regime, etc.
This really indicates the importance of the alignment of the administration to ensure the staff is keen to implement the objectives to the best of their ability.
Expenditure Management To ensure that proper control takes place over expenditures such as, Fleet Management, Overtime,
Page 26

BREEDE VALLEY MUNICIPALITY ANNUAL REPORT 2010/11
CHALLENGES ACTIONS TO ADDRESStelephones, Leave Administration, etc.
Table 6: Municipal Challenges
Page 27

BREEDE VALLEY MUNICIPALITY ANNUAL REPORT 2010/11
Page 28
CHAPTER 2
Governance

BREEDE VALLEY MUNICIPALITY ANNUAL REPORT 2010/11
CHAPTER 2: Governance
Good governance has 8 major characteristics. It is participatory, consensus oriented, accountable, transparent, responsive, effective and efficient, equitable and inclusive and follows the rule of law. It assures that corruption is minimized, the views of minorities are taken into account and that the voices of the most vulnerable in society are heard in decision-making. It is also responsive to the present and future needs of society.
2.1 NATIONAL KEY PERFORMANCE INDICATORS - GOOD GOVERNANCE AND PUBLIC PARTICIPATION
The following table indicates the municipality’s performance in terms of the National Key Performance Indicators required in terms of the Local Government: Municipal Planning and the Performance Management Regulations 796 of 2001 and section 43 of the MSA. This key performance indicator is linked to the National Key Performance Area - Good Governance and Public Participation.
KPA & INDICATORS
MUNICIPAL ACHIEVEMEN
T
MUNICIPAL ACHIEVEMEN
T
MUNICIPAL ACHIEVEMEN
T2008/09 2009/10 2010/11
The percentage of a municipality’s capital budget actually spent on capital projects identified for a particular financial year in terms of the municipality’s integrated development plan
82.49 92.48 93.48
Table 7: National KPIs - Good Governance and Public Participation Performance
2.2 PERFORMANCE HIGHLIGHTS - GOOD GOVERNANCE AND PUBLIC PARTICIPATION
Highlight Description
Audit Committee New Audit Committee was appointed and is fully operational
Seventh most productive local municipality in the Municipal Productivity Index (MPI)
Breede Valley has been named as the seventh most productive local municipality in Municipal IQ‘s fifth annual Municipal Productivity Index (MPI) for the 2010/11 financial year
Table 8: Good Governance and Public Participation Performance Highlights
2.3 CHALLENGES - GOOD GOVERNANCE AND PUBLIC PARTICIPATION
Page 29

BREEDE VALLEY MUNICIPALITY ANNUAL REPORT 2010/11
Description Actions to addressThe lack of proper Council Chambers with separate Caucus rooms, data projector, recording, sound and translation system, catering facilities, etc. hampers efficient Council meetings and the hiring of alternative venues and service providers to be able to provide an acceptable if not totally efficient service is expensive (approximately R16 500 per meeting).
A Memorandum of Agreement (Reciprocity Agreement) with the Cape Winelands District Municipality to utilise their Council Chambers, meeting facilities and Translation Service Providers is being investigated which will provide far more efficient meetings and be more cost effective (approximately R7 000 per meeting).
The Internal Audit Unit is ineffective due to insufficient staff, budget & a lack of system descriptions.
The lack of resources (staff, budget, etc.) has been reported to the Audit Committee, and the committee has recommended that it be addressed with the urgency it deserves. Current cost savings on Internal Audit’s budget will be utilised to appoint temporary staff to assist with the ineffectiveness. The ineffective Internal Audit structure has also been changed to reflect current Internal Audit best practice and legislated approach. Prioritising of focus areas in terms of our Audit Plan taking into consideration available resources.
The role and function of Internal Audit is misunderstood.
Through the Audit Committee’s support and assistance the role & function of Internal Audit is emphasized. Continuous education of the auditees on the role and function of Internal Audit through the formal internal audit process.
Internal Audit is held responsible for functions outside its scope of operation, such as Risk Management, Fraud Prevention & Investigations.
Provincial Treasury is responsible to monitor, evaluate and support municipalities with regards to the implementation of good governance principles (i.e. risk management & fraud prevention). The Bi-Annual Corporate Governance Assessment Report of Provincial Treasury communicates to the relevant stakeholders key concerns identified, and the required actions which need to be taken by the Municipality linked to timeframes and responsible officials to improve the status of governance within the Municipality.
The importance of Internal Audit in the municipality is not realised.
The Audit Committee supports and assists in clarifying the role & function of Internal Audit, as well as emphasizing our importance. Continuous education of the auditee on the importance of Internal Audit; as well as support from Provincial Treasury in monitoring and evaluating the effectiveness of Internal Audit, as an assurance provider with regards to the implementation of good governance principles in municipalities.
The value which Internal Audit could add, once fully effective, is underestimated.
The Audit Committee supports and assists in emphasizing our importance, as well as the value which Internal Audit could add to the municipality once fully effective. Continuous education of the auditee on the importance and value add which could
Page 30

BREEDE VALLEY MUNICIPALITY ANNUAL REPORT 2010/11
Description Actions to addressbe derived from Internal Audit, as a management tool. Support from Provincial Treasury (as an oversight body) in monitoring and evaluating the effectiveness of Internal Audit, as an assurance provider regards the implementation of good governance principles in municipalities.
Table 9: Good Governance and Public Participation Challenges
2.4 GOVERNANCE STRUCTURE
2.4.1 POLITICAL GOVERNANCE STRUCTURE
The council performs both legislative and executive functions. It focuses on legislative, oversight and participatory roles, and has delegated its executive function to the Executive Mayor and the Mayoral Committee. It’s primary role is to debate issues publicly and to facilitate political debate and discussion. Apart from their functions as policy makers, Councillors are also actively involved in community work and the various social programmes in the municipal area.
A) COUNCIL
Below is a table that categorised the councillors within their specific political parties and wards before 18 May 2011:
Name of councillor Capacity Political Party Ward representing or proportional
C. Ntsomi Executive Mayor ANC proportionalT.J. Pedro (Until 28 March 2011) Deputy Executive Mayor NPP proportional
B.J. Damons (From 20 April 2011) Deputy Executive Mayor NPP proportional
J.J. Januarie (Until 19 August 2010) The Speaker, Councillor ANC Ward 1
H. Willemse (20 August 2010 – 22 November 2010)
The Speaker, Councillor Independent Ward 8
C. Ismail (23 November 2010 - 15 April 2011)
The Speaker, Councillor ANC Ward 14
L. Richards (From 20 April 2011 to 18
The Speaker, Councillor ANC Ward 13
Page 31

BREEDE VALLEY MUNICIPALITY ANNUAL REPORT 2010/11
Name of councillor Capacity Political Party Ward representing or proportional
May 2011)M.N. Lubisi Councillor ANC Ward 2F. Speelman Councillor Independent Ward 3P. Marran Councillor ANC Ward 4C.N Barends Councillor ANC Ward 5J.P. Kritzinger Councillor DA Ward 6N. Nel Councillor DA Ward 7G.L. Daames Councillor NPP Ward 9G. Stalmeester Councillor DA Ward 10A.H.E. Uys Councillor DA Ward 11E.Y. Sheldon Councillor DA Ward 12N.P. Mercuur Councillor DA Ward 15P. Tyira Councillor Independent Ward 16N.S. Ndyalvan Councillor ANC Ward 17V.V. Malangeni Councillor ANC Ward 18S. Goedeman Councillor DA Ward 19P.B.B. Du Toit Councillor DA Ward 20C. Africa Councillor DA proportionalN. H. Africa Councillor NPP proportionalJ. Brand Councillor NPP proportionalM.N. Bushwana Councillor ANC proportionalA. Cuttings Councillor ID proportionalA.M. Du Toit Councillor DA proportionalS. Geldenhuys Councillor ANC proportionalS.E. James Councillor ANC proportionalA.E. Jordaan Councillor DA proportionalE.S.C. Manel Councillor DA proportionalT.B. Mbhele Councillor DA proportionalS.B. Mfutwana Councillor ANC proportionalM. Sampson Councillor DA proportionalA. Steyn Councillor DA proportionalS. Syster Councillor NPP proportionalA.C. Titus Councillor NPP proportionalJ.W. Van Der Westhuizen Councillor FF+ proportionalA.J. Williams Councillor ANC proportional
Page 32

BREEDE VALLEY MUNICIPALITY ANNUAL REPORT 2010/11
Name of councillor Capacity Political Party Ward representing or proportional
C.F. Wilskut Councillor BO proportional
Table 10: Council until 18 May 2011
Below is a table that categorised the councillors within their specific political parties and wards after 18 May 2011:
Name of councillor Capacity Political Party Ward representing or proportional
B.D. Kivedo Executive Mayor DA proportionalJ.D. Levendal Deputy Executive Mayor DA proportionalA. Steyn The Speaker DA Ward 6J.P. Appels Councillor BO proportionalP.G. Smith Councillor COPE Ward 1M.N. Lubisi Councillor ANC Ward 2P.B. Januarie Councillor ANC Ward 3P. Marran Councillor ANC Ward 4B.J. Kriegler Councillor DA Ward 5W.R. Meiring Councillor DA Ward 7N.V. Steto Councillor ANC Ward 8G. Stalmeester Councillor DA Ward 10M. Sampson Councillor DA Ward 11E.Y. Sheldon Councillor DA Ward 12R. Farao Councillor DA Ward 13C. Ismail Councillor Independent Ward 14J.A. Boshoff Councillor DA Ward 15N. Jali Councillor ANC Ward 16P. Tyira Councillor ANC Ward 17T.B. Dyonta Councillor DA Ward 18S. Goedeman Councillor DA Ward 19R. Blom Councillor DA Ward 20T.M. Wehr Councillor DA Ward 21
Page 33
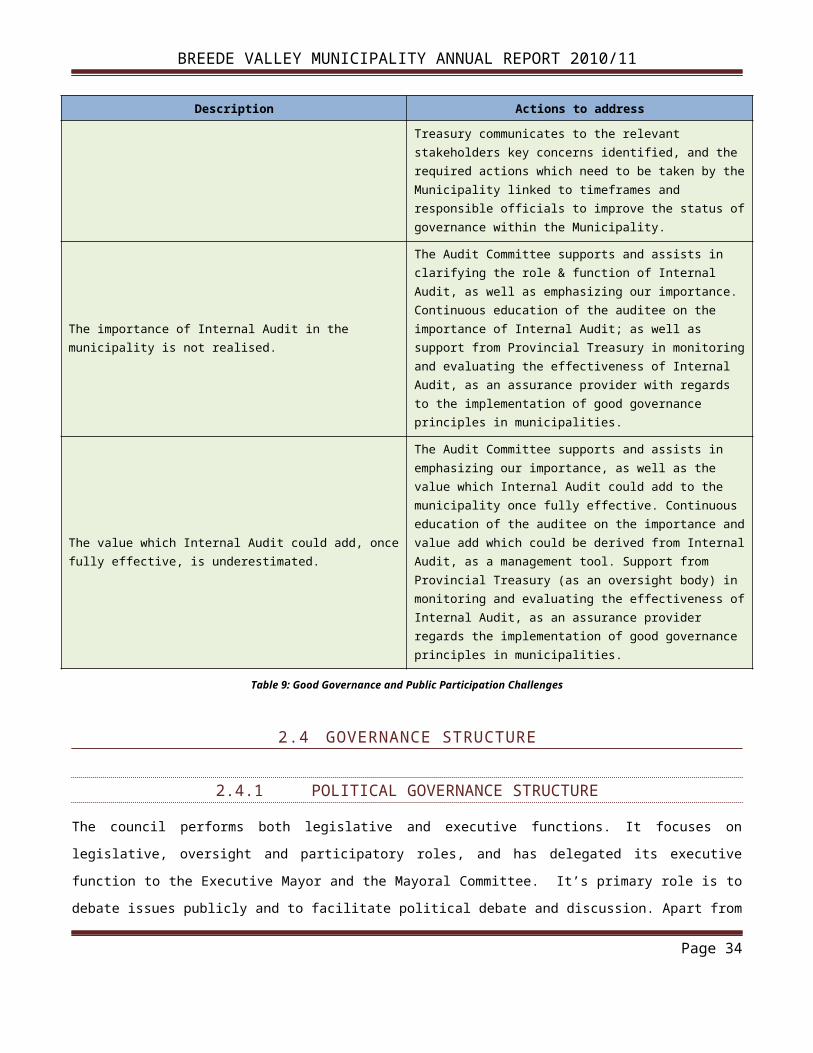
BREEDE VALLEY MUNICIPALITY ANNUAL REPORT 2010/11
Name of councillor Capacity Political Party Ward representing or proportional
W.M. Blom Councillor DA proportionalM.N. Bushwana Councillor ANC proportionalA.M. Du Toit Councillor DA proportionalL. Dyabooi Councillor ANC proportionalS.E. James Councillor ANC proportionalJ.J. Januarie Councillor ANC proportionalA.E. Jordaan Councillor DA proportionalB.V. Klein Councillor ANC proportionalS. Lakey Councillor DA proportionalE.S.C. Manel Councillor DA proportionalS.J. Mei Councillor DA proportionalS.B. Mfutwana Councillor ANC proportionalB.W. Ntshingila Councillor ANC proportionalL. Richards Councillor ANC proportionalJ. Schneider Councillor DA proportionalJ.F. Van Zyl Councillor DA proportionalH. Willemse Councillor CI proportionalC.F. Wilskut Councillor BO proportional
Table 11: Council after 18 May 2011
Below is a table which indicates the Council meetings attendance for the 2010/11 financial year:
Meeting dates Number of items submitted
Percentage Council Meetings Attendance
Percentage Apologies for non-attendance
30 July 2010 9 97 319 August 2010 3 100 -25 August 2010 2 97 3
13 September 2010 11 95 326 October 2010 6 85 15
18 November 2010 11 85 1322 November 2010 3 90 1015 December 2010 19 77 13
31 January 2011 13 92 515 February 2011 1 79 1528 February 2011 20 95 3
31 March 2011 7 97 320 April 2011 2 87 3
Page 34

BREEDE VALLEY MUNICIPALITY ANNUAL REPORT 2010/11
Meeting dates Number of items submitted
Percentage Council Meetings Attendance
Percentage Apologies for non-attendance
5 May 2011 5 97 331 May 2011 20 100 -
Table 12: Council meetings
B) EXECUTIVE MAYORAL COMMITTEE
The Executive Mayor of the Municipality, Councillor C. Ntsomi (prior to 18 May 2011) and Councillor B.D. Kivedo (after 18 May 2011), assisted by the Mayoral Committee, heads the executive arm of the Municipality. The Executive Mayor is at the centre of the system of governance, since executive powers are vested in him to manage the day-to-day affairs. This means that he has an overarching strategic and political responsibility. The key element of the executive model is that executive power is vested in the Executive Mayor, delegated by the Council, and as well as the powers assigned by legislation. Although accountable for the strategic direction and performance of the Municipality, the Executive Mayor operates in concert with the Mayoral Committee.
The name and portfolio of each Member of the Mayoral Committee is listed in the table below for the period 1 July to 18 May:
Name of member CapacityThe Executive Mayor, Cllr. C. Ntsomi Chairperson
The Deputy Executive Mayor, Cllr. T.J. Pedro MMC: Spatial & Development Planning, LED, Tourism & Sport portfolio
The Deputy Executive Mayor, Cllr. B.J. Damons MMC: Spatial & Development Planning, LED, Tourism & Sport portfolio
Cllr. P. Marran MMC: Community Protection Services portfolioCllr. L. Richards MMC: Corporate Services portfolioCllr. C. Ismail MMC: Financial Services portfolioCllr. P. Tyira MMC: Housing portfolio
Cllr. S.B. Mfutwana MMC: Social Development & Human Capital Development portfolio
Cllr. G.L. Daames MMC: Vulnerable Groups portfolio
Page 35

BREEDE VALLEY MUNICIPALITY ANNUAL REPORT 2010/11
Name of member CapacityCllr. M.N. Bushwana MMC: Corporate Services portfolioCllr. J.J. Januarie MMC: Financial Services portfolioCllr. N.H. Africa MMC: Vulnerable Groups portfolio
Table 13: Executive Mayoral Committee until 18 May 2011
Page 36

BREEDE VALLEY MUNICIPALITY ANNUAL REPORT 2010/11
The name and portfolio of each member of the Mayoral Committee is listed in the table below for the period 19 May to 30 June 2011:
Name of member CapacityThe Executive Mayor: Cllr. B.D. Kivedo Chairperson
The Deputy Executive Mayor: Cllr. J.D. Levendal MMC: Basic Services, Traffic, Community Safety, Ombudsman
Cllr. W.M. Blom MMC: Financial Services, Internal Audit, IDP
Cllr. A.E. Jordaan MMC: Agriculture & Rural Development, Disaster Management (Fire & Rescue included)
Cllr. A.M. Du Toit MMC: LED & Tourism (Business & Agri-business included)
Cllr. S. Goedeman MMC: Environment & Recreation, Sport; Arts & Culture (Heritage matters included)
Cllr. M. Sampson MMC: Community Services, Social Development, Women, Youth, Disabled, Library Services
Cllr. E.Y. Sheldon MMC: Housing
Cllr. W.R. Meiring MMC: Human Resources, PMS, Technical Services (Civil & Planning Services)
Cllr. J.F. Van Zyl MMC: Corporate Services, Communication & Marketing
Table 14: Executive Mayoral Committee after 18 May 2011
The table below indicates the dates of the Committee meetings and the number of reports submitted to Council for the 2010/11 financial year:
Meeting date Number of items submitted to council17 August 2010 (100% attendance) 11 items under delegated authority
26 November 2010 (63% attendance) 10 items under delegated authority3 February 2011 (63% attendance) 1 item under delegated authority
4 April 2011 (38% attendance) 3 items under delegated authority16 May 2011 (83% attendance) 7 items under delegated authority
Table 15: Committee Meetings
(Please note that the name and functions of the committees have on numerous occasions been altered due to the change of council.)
Page 37
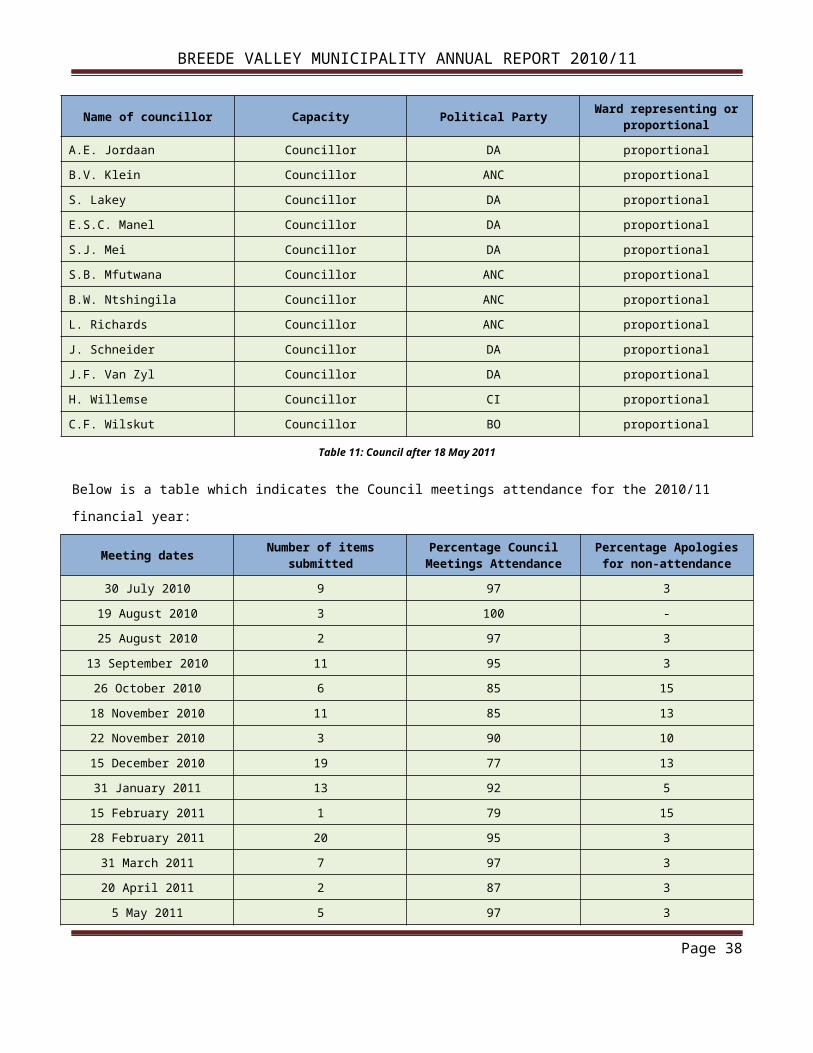
BREEDE VALLEY MUNICIPALITY ANNUAL REPORT 2010/11
C) COMMITTEES
On 28 January 2008 Council resolved that there would be three types of “Council” meetings:
Plenary Committee (only for want of a different name) that should meet on the first Tuesday of every month to discuss matters that need to be referred to MAYCO or Council and to make suitable recommendations;
MAYCO Committee that should meet on the third Tuesday of every month to consider the recommendations of the Plenary Committee and to resolve all matters referred to it in terms of delegated authority; and
Council Meetings that should meet at least four times a year to resolve matters that have not been delegated to officials or MAYCO.
The Plenary Committee is chaired by the Speaker and all councillors attend; MAYCO is chaired by the Executive Mayor and the Deputy Executive Mayor and six “portfolio” councillors serve on MAYCO (we do not have portfolio committees, the portfolio councillors on MAYCO are responsible for motivating matters applicable to their respective portfolios); Council meets to meet legislative compliance issues (only four matters which they cannot delegate – passing of by-laws, approval of budgets, imposition of rates and other taxes, levies and duties and the raising of loans).
The Plenary Committee was accepted instead of Section 79 or Section 80 Committees. However, on the few occasions when Plenary Committee meetings were scheduled, the meetings were adjourned, for various reasons, before any items could be discussed. Consequently, during the year under review, all items were resolved by either MAYCO (under delegated authority) or Council.
2.4.2 ADMINISTRATIVE GOVERNANCE STRUCTURE
The Municipal Manager is the Chief Accounting Officer of the Municipality. He is the head of the administration, and primarily has to serve as chief custodian of service delivery and implementation of political priorities. He is assisted by his direct reports, which constitutes the Management Team, whose structure is outlined in the table below:
Name of Official DepartmentPerformance agreement signed
(Yes/No)Mr. A.A. Paulse Municipal Manager YesMr. M.K. Gagu Corporate Services YesMr. D. McThomas Financial Services YesMr. W.H. Visser Operational Services YesDr. W.R. Murray Public Safety and Community Yes
Page 38

BREEDE VALLEY MUNICIPALITY ANNUAL REPORT 2010/11
Name of Official DepartmentPerformance agreement signed
(Yes/No)Development
Table 16: Administrative Governance Structure
2.5 PUBLIC ACCOUNTABILITY
Section 16 of the Municipal Systems Act (MSA) refers specifically to the development of a culture of community participation within municipalities. It states that a municipality must develop a culture of municipal governance that complements formal representative government with a system of participatory governance. For this purpose it must encourage and create conditions for the local community to participate in the affairs of the community. Such participation is required in terms of:
the preparation, implementation and review of the IDP;
establishment, implementation and review of the performance management system;
monitoring and review of the performance, including the outcomes and impact of such performance; and
preparation of the municipal budget.
2.5.1 WARD COMMITTEES
The ward committees support the Ward Councillor who receives reports on development, participate in development planning processes, and facilitate wider community participation. To this end, the municipality constantly strives to ensure that all ward committees function optimally with community information provision; convening of meetings; ward planning; service delivery; IDP formulation and performance feedback to communities.
Ward 1: The entire community of Touws River, including business and residential areas
Name of representative Capacity representing Number meetings held during the year
Mr. John Sass Education 4Mr. Daantjies Prins HealthMs. Ria Kock HousingMs. Magdeleen Prins WomenMr. Gerrit Jaftha Community safetyMr. Eusewes Prins Sport
Page 39

BREEDE VALLEY MUNICIPALITY ANNUAL REPORT 2010/11
Name of representative Capacity representing Number meetings held during the year
Ms. Elmarie Prins YouthMr. Gerrit Theunissen BusinessMs. Jacky Nicholas Women, Children and Youth
Table 17: Ward 1 Committee Meetings
Page 40

BREEDE VALLEY MUNICIPALITY ANNUAL REPORT 2010/11
Ward 2: De Doorns South, Stofland, Hasie Square, and Ekuphumleni
Name of representative Capacity representing Number meetings held during the year
Mr. Xolani Cesiko Sport
4
Mr. Poulus Khuselo Mpondwana Small FarmersMs. Ester Mfuthwana WomenMs. Buyelwa Qodolwana EducationMr. Vatsha Makaleni ReligionMs. Sara Smith HealthMs. Wilhelmina Fuller ElderlyMr. Themba Mbhele YouthMr. Johannes Rathipe DisabledMr. Patrick Nbalma Farm Workers
Table 18: Ward 2 Committee Meetings
Ward 3: The Centre of De Doorns
Name of representative Capacity representing Number meetings held during the year
Mr. Eric Thomas Education
4
Mr. Keith Solomons YouthMs. Olga Pendu ElderlyMs. Magaret Jacobs FarmsMs. Anna Steyller DisabledMr. Doris Du Preez HealthMs. Anna Thomas Safety and SecurityMs. Cynthia Mema WomenMr. Kosie Pozyn BusinessMr. Isak Pekaan Arts & Culture
Table 19: Ward 3 Committee Meetings
Page 41

BREEDE VALLEY MUNICIPALITY ANNUAL REPORT 2010/11
Ward 4: De Doorns Town Centre and adjacent Farm Areas
Name of representative Capacity representing Number meetings held during the year
Mr. Louis Flippies Elderly
4
Mr. B Patrick Safety and SecurityMr. Prent Sammy SportMs. Magrieta Pieterse HealthMs. Cecilia Cewana EducationMr. Bongile Gidela YouthMs. Sokhaba Nolitha WomenMr. Cewana Mpumelelo HousingMr. Hennie Windvogel Farm areas
Table 20: Ward 4 Committee Meetings
Ward 5: De Doorns Farming areas including Brandwag, De Wet and Sand Hills
Name of representative Capacity representing Number meetings held during the year
Ms. Evelyn Mekriga Youth
4
Mr. Willem Vermeulen ElderlyMs. Michelle Stredders EducationMr. Andrew Jantjies FarmsMs. Veronica Jabane WomenMr. Dennis Libo ChurchesMr. Nomgqibelo Kweza DisabledMr. Jack Swartz Housing
Table 21: Ward 5 Committee Meetings
Page 42

BREEDE VALLEY MUNICIPALITY ANNUAL REPORT 2010/11
Ward 6: N1 Worcester entrance, Altona, Brandwag, Tuindorp, Bergsig, Van Riebeeck Park, Panorama
Name of representative Capacity representing Number meetings held during the year
Mr. Hugo Geldenhuys Community Services
0
Ms. Tinkie Conradie ChurchesMr. Karel Dienner Safety and SecurityMs. Alida Basson DisabledMr. Amdreas van Lil HealthMr. Stefans Els Business
Table 22: Ward 6 Committee Meetings
Ward 7: Residential areas of partly Esselenpark and Worcester West
Name of representative Capacity representing Number meetings held during the year
Mr. Kobus Neethling Safety and Security
0
Mr. Johan Van Der Walt ElderlyMr. Jacobus Naude Senior CitizensMr. Desmond De Koker DisabledMr. Willmar Jaftha YouthMr. J.C Cupido Senior citizens EsselenparkMs. Let Williams Women
Table 23: Ward 7 Committee Meetings
Ward 8: The Chessies and part of Worcester South
Name of representative Capacity representing Number meetings held during the year
Ms. Fronana Visagie Labour
4
Ms. Maria Kampher HealthMs. Angelique Kamfer DisabledMs. Irene Plaatjies WomenMr. Graham Farland YouthMr. Warren Hendriks Business
Table 24: Ward 8 Committee Meetings
Page 43

BREEDE VALLEY MUNICIPALITY ANNUAL REPORT 2010/11
Ward 9: Roodewal Area
Name of representative Capacity representing Number meetings held during the year
Ms. Belinda Booysen Housing
4
Ms. Francis Moos SafetyMs. Lilian Prins Senior CitizensMs. Jessica Williams BusinessMs. Susan Booysen ReligionMs. Christina Moos TourismMs. Marlene Jaftha EducationMs. Drien Olkers Women
Mr. Etienne Cupido Youth
Table 25: Ward 9 Committee Meetings
Ward 10: Hexpark and Johnsonspark Area
Name of representative Capacity representing Number meetings held during the year
Ms. Lien Daniels Health
4
Ms. Spasie Kees Old AgesMr. Andre Diedericks AgricultureMs. Elde Wilskut DisabledMr. Wilfred V Niekerk EducationMs. Kette Eland WomenMs. Dulci Thomas Churches
Table 26: Ward 10 Committee Meetings
Page 44

BREEDE VALLEY MUNICIPALITY ANNUAL REPORT 2010/11
Ward 11: Noble Park
Name of representative Capacity representing Number meetings held during the year
Mr. Alver Uys Sport
4
Mr. James Cupido EducationMr. Trevor Karriem Security and SafetyMs. Mina Demas ElderlyMs. Wilhelmina Jones DisabledMr. Adam Williams Youth
Table 27: Ward 11 Committee Meetings
Ward 12: OVD, Parkersdam and Russel Scheme
Name of representative Capacity representing Number meetings held during the year
Ms. Evelyn Johnson Disabled
4
Ms. Veronica Grootboom ReligionMr. Jobin Carnow Arts and CultureMr. Amanda Smit DisabledMr. Anna Esau Social HealthMr. Rieyaaz Savahl YouthMs. Sophie Williams ElderlyMr. Charles Nonney InformalMs. Siena Booysen WomenMr. Trevor Samson HealthMr. Freek Masimala Community Safety
Table 28: Ward 12 Committee Meetings
Page 45

BREEDE VALLEY MUNICIPALITY ANNUAL REPORT 2010/11
Ward 13: Avian Park
Name of representative Capacity representing Number meetings held during the year
Ms. Natasha Triskey Youth
4
Ms. Emily Solomons ElderlyMs. Lenie Pierce DisabledMs. Esther Fushana Safety & SecurityMs. Martha Jaftha EducationMs. Bertha Klein Day CareMs. Lindie Angeline WomenMr. Christie Fransman SportMr. Derick Goodheart HousingMr. Zolile April Arts & Culture
Table 29: Ward 13 Committee Meetings
Ward 14: Riverview Flat and Parkersdam Area
Name of representative Capacity representing Number meetings held during the year
Ms. Joan Abrahams Youth
4Mr. Jacobus Wyngaard HousingMs. Dora Esau Senior CitizensMs. Valencia Wilskut Women
Table 30: Ward 14 Committee Meetings
Page 46

BREEDE VALLEY MUNICIPALITY ANNUAL REPORT 2010/11
Ward 15: Langerug, Panorama and Goudini
Name of representative Capacity representing Number meetings held during the year
Mr. Rodney Karriem Sport and Recreation
4
Ms. Francis Hugo ElderlyMr. Pieters Francis DisabledMr. Willem Welgemoed Safety & SecurityMs. E Hamman Women & Children and YouthMr. Hubert Johnson ReligionMr. Lesley Cornelius Social Services
Table 31: Ward 15 Committee Meetings
Ward 16: Zwelethemba
The committee does not exist anymore as per a letter written by Councillor P Tyira to the Speaker.
Ward 17: Zwelethemba Residential space next to R300 on Robertson Road
Name of representative Capacity representing Number meetings held during the year
Ms. Mimi Williams Women
4
Mr. Mbuyiselo Weliso DisabledMr. Simphiwe Ndzima EducationMs. Thandanani Ntuli Social DevelopmentMr. Maphingane Madoda SportMs. Neliswa Ndzeku YouthMs. Portia Allam Safety and SecurityMr. Thabo Mohlauli HealthMr. Mvula Ndzeku BusinessLt. Col. Parks Maliti Business
Table 32: Ward 17 Committee Meetings
Page 47

BREEDE VALLEY MUNICIPALITY ANNUAL REPORT 2010/11
Ward 18: Zwelethemba
Name of representative Capacity representing Number meetings held during the year
Mr. B Ramasesane Religion
4
Ms. Hapiness Jacobs HousingMr. Pololo Thaliwe Safety and SecurityMs. Nomabhongo Mnyuka Old AgeMs. Thuliswa Nonkonana YouthMs. Nosiseko Kelepu EducationMr. Luyanda George SportsMs. Ntombomzi Zathu HealthMs. Nozinzile Nkumatela WomenMr. Vuyane Gqandu DisabledMr. Moroesi Monlakola Small Farmers
Table 33: Ward 18 Committee Meetings
Page 48

BREEDE VALLEY MUNICIPALITY ANNUAL REPORT 2010/11
Ward 19: Part of the centre of Rawsonville and outlaying farming community
The ward stretches over a wide and vast area, including mainly farming communities. The structure of the ward committee reflected the vastness of the area with representatives residing in differing outlaying corners of the ward. The ambition was to reflect a better representative structure than with previous years, though implementation remained a huge challenge amidst resource challenges. The ward councillor therefore initiated ward committee meetings with selected ward committee members though addressing issues which affect the entire ward. This remains a challenge as innovativeness and more resources would be required in the new term to address matters of this nature.
Name of representative Capacity representing Number meetings held during the year
Ms. Fransiena Van Rooy Elderly
0
Ms. Cecilia Bratt Social ServicesMr. Wayne Bratt SportMs. Sophia Swartz TransportMs. Sharon Pietersen HousingMr. Jannie Claasen DisabledMr. Piet Hendricks AgricultureMs. Elsabe Davids WomenMr. Steven Bosman HealthMs. Richelle Davids Local Economic DevelopmentMs. Fransiena Van Rooy Elderly
Table 34: Ward 19 Committee Meetings
Ward 20: Part of the centre of Rawsonville, and areas towards N1
Upon the election of the ward 20 ward committee no formal ward committee activities were recorded by the coordinating office. A number of activities undertaken centred mainly on ward based projects initiated by the ward councillor in collaboration with self-identified volunteers. A more concerted effort is required in the new financial year and term of council to ensure functionality of the current and foreseen ward committee, to strengthen participatory government in this ward.
Ward 21: Avian Park and surrounding informal areas
Page 49

BREEDE VALLEY MUNICIPALITY ANNUAL REPORT 2010/11
Ward 21 did not exist for the bigger part of the financial year; it was only constituted in terms of the new demarcation.
2.5.2 FUNCTIONALITY OF WARD COMMITTEE
The purpose of a ward committee is:
to get better participation from the community to inform council decisions;
to make sure that there is more effective communication between the Council and the community; and
to assist the ward councillor with consultation and report-backs to the community.
Ward committees should be elected by the community they serve. A ward committee may not have more than 10 members and women should be well represented. The ward councillor serves on the ward committee and act as the chairperson. Although ward committees have no formal powers, they advise the ward councillor who makes specific submissions directly to the council. These committees play a very important role in the development and annual revision of the integrated development plan of the area.
The table below provides information on the establishment of Ward Committees and their functionality:
Ward Number
Committee
established:
Yes / No
Number of reports
submitted to the
Speakers/IDP Office
Number meetings
held during the
year
Committee
functioning
effectively:
Yes / No
Actions to address
1 Yes 4 4 Yes Capacitating of ward committees and the provision of a Ward Office2 Yes 4 4 Yes
3 Yes 4 4 Yes4 Yes 4 4 Yes5 Yes 4 4 Yes6 Yes 0 0 No7 Yes 0 0 No8 Yes 4 4 Yes9 Yes 4 4 Yes
10 Yes 4 4 Yes11 Yes 4 4 Yes
Page 50

BREEDE VALLEY MUNICIPALITY ANNUAL REPORT 2010/11
Ward Number
Committee
established:
Yes / No
Number of reports
submitted to the
Speakers/IDP Office
Number meetings
held during the
year
Committee
functioning
effectively:
Yes / No
Actions to address
12 Yes 4 4 Yes13 Yes 4 4 Yes14 Yes 4 4 Yes15 Yes 4 4 Yes16 Yes 4 4 Yes17 Yes 4 4 Yes18 Yes 4 4 Yes19 Yes 0 0 No20 No 0 0 No21 No 0 0 No
Table 35: Functioning of Ward Committees
Page 51

BREEDE VALLEY MUNICIPALITY ANNUAL REPORT 2010/11
2.5.3 REPRESENTATIVE FORUMS
A) LABOUR FORUM
The table below specifies the members of the Labour forum for the 2010/11 financial year:
Name of representative Capacity Meeting datesL Richards Cllr
1 September 20109 November 201014 December 2010
S Geldenhuys CllrP Marran CllrB Mfutwana CllrC Ismail CllrA Du Toit CllrG Stalmeester CllrP Du Toit CllrA Titus CllrA Paulse Municipal ManagerD McThomas Director: FinanceWR Murray Director: Community ServicesW Visser Director: OperationsM Gagu Director: CorporateW Soldaat SAMWUZ Petersen SAMWUD Wehr SAMWUJ Damens SAMWUZ Sophi SAMWUJ George SAMWUW Visagie IMATUD Maart IMATUR Plaatjies IMATUR Oliphant IMATUG Pharo IMATUJ France Manager: HRW Cloete Labour Relations Officer
Table 36: Labour Forum
Page 52

BREEDE VALLEY MUNICIPALITY ANNUAL REPORT 2010/11
B) IDP FORUM
Breede Valley municipality constituted a Ward Committee Summit which acted as an IDP Forum where prioritising of ward needs were dealt with.
2.6 CORPORATE GOVERNANCE
Corporate governance is the set of processes, practices, policies, laws and stakeholders affecting the way an institution is directed, administered or controlled. Corporate governance also includes the relationships among the many stakeholders involved and the goals for which the institution is governed.
2.6.1 ANTI-CORRUPTION AND ANTI-FRAUD
Section 83(c) of the MSA refers to the implementation of effective bidding structures to minimize the possibility of fraud and corruption and the Municipal Finance Management Act (MFMA), section 112(1) (m)(i) identify supply chain measures to be enforced to combat fraud and corruption, favouritism and unfair and irregular practices. Section 115(1) of the MFMA states that the accounting officer must take steps to ensure mechanisms and separation of duties in a supply chain management system to minimize the likelihood of corruption and fraud.
A) DEVELOPED STRATEGIES
Name of strategy DevelopedYes/No Date Adopted/Reviewed
Anti-corruption strategy Yes Adopted at Audit Committee only Fraud prevention strategy Yes Adopted at Audit Committee only
Table 37: Strategies
B) IMPLEMENTATION OF STRATEGIES
Strategies to implement Key Risk Areas Key measures to curb corruption and fraud
Organisational Culture Setting the tone at the top
Transparency Public awareness
Commitment to creating an environment that is based on the prevention of fraud and corruption. This is achieved by promoting openness and honesty in all Council activities. The Council requires all individuals and organisations associated in whatever way with the Council to act with integrity and that Council Members and Employees, at all levels, will lead by example in these matters. The Council’s Members and Employees play an important part in creating, maintaining and promoting this culture. They are encouraged to voice any serious concerns about any aspect of the Council’s activities. The Council has drafted a ‘Whistle blowing’ policy, which
Page 53

BREEDE VALLEY MUNICIPALITY ANNUAL REPORT 2010/11
Strategies to implement Key Risk Areas Key measures to curb corruption and fraud
ensures that concerns raised will be properly investigated in a professional and confidential manner.
Prevention
Recruitment and Selection policies
Code of conduct for Councillors and Employees
The Council recognises that a key preventative measure in the fight against fraud and corruption is to employ staffs who have high standards in terms of propriety and integrity. The Council strives to achieve this through effective recruitment policies and procedures which include:i) obtaining written references prior to appointing staff,
including those employed on a temporary or contract basis
ii) undertaking police checks for designated posts where the post holder may deal with vulnerable people or where the duties require the highest level of propriety
Upon appointment all staff is issued with the Employee Code of Conduct and are required to sign a statement to the effect that this has been read and understood. The Employee Code of Conduct details the standards all employees must uphold to maintain the integrity of the Council’s activities. The Code includes rules regarding relationships, personal interests, gifts and hospitality and confidentiality. The Code may be amended due to requirements from time to time and employees are expected to comply with the amended requirements from the date they are introduced. More particularly, all of the Council’s contracts of employment will also incorporate mandatory requirements arising from any Employee Code of Conduct for local authority employees issued by government.
Detection
Efficient and Effective systems of control.
Availability of open confidential communication channels
The preventative measures undertaken by the Council, particularly the implementation of sound control systems, have been designed to deter fraud and provide indicators of fraudulent activity. It is often the alertness of employees and the public to such indicators that enables detection to occur and the appropriate to take place when there is evidence that fraud or corruption may be in progress. Despite the best effort of financial managers and internal audit many incidents of fraud are discovered by chance or ‘tip-off’ and the Council has in place arrangements to enable such information to be properly dealt with.
Investigation Objectivity and independence of investigating team.
Appropriate and uniform sanctions
The investigation of any other suspected fraud or corruption is carried out by either in-house or externally appointed forensic investigators. Upon completion of the investigation, a report is issued to the Municipal Manager who, with the CFO, has joint responsibility for determining what further action to take. A copy of the report will also be issued to the Head of Department concernedThe reporting procedure is essential as it ensures:i) the consistent treatment of information regarding any
suspected fraud and/or corruptionii) an effective investigation by an experienced investigative
teamiii) the proper implementation of a structured response to
any suspected act of fraud and/or corruptioniv) that the investigation will be undertaken in accordance
Page 54
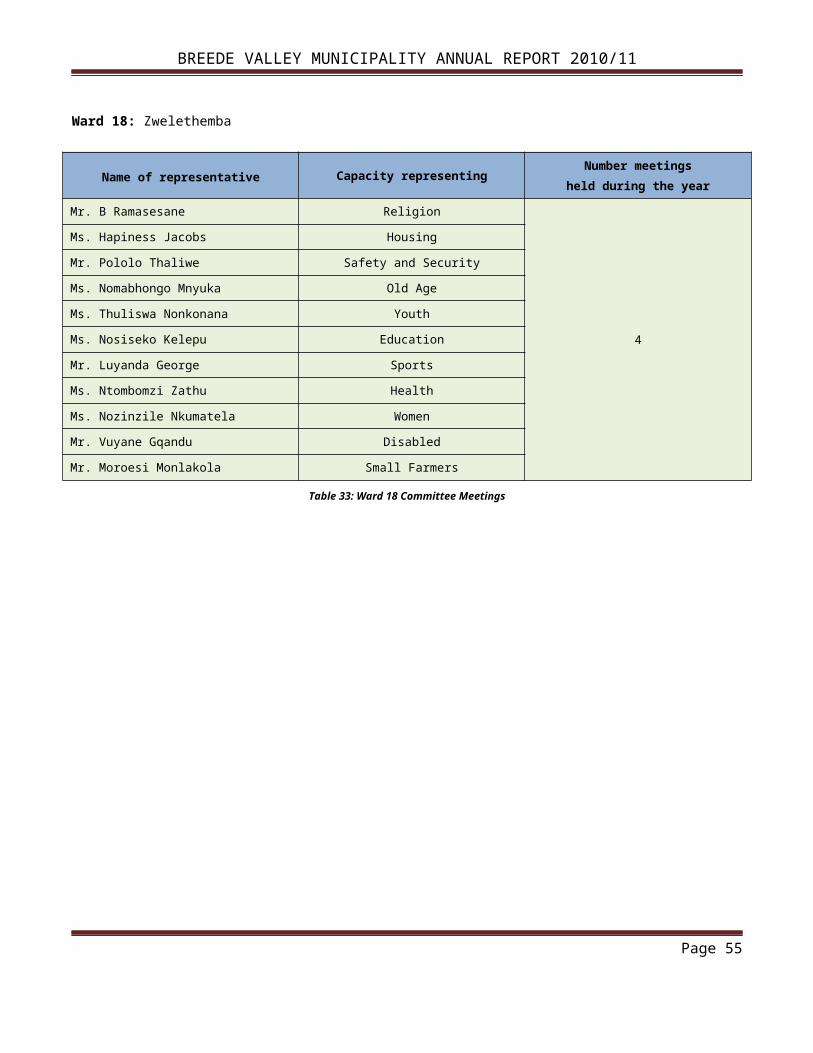
BREEDE VALLEY MUNICIPALITY ANNUAL REPORT 2010/11
Strategies to implement Key Risk Areas Key measures to curb corruption and fraud
with the Prevention of Corrupt Activities Act of 2004.
Education and Training
Efficient and effective implementation of training and induction programmes
The Council recognises that the continuing success of the Anti-Fraud and Corruption Policy, and its credibility, will depend largely on the effectiveness of staff throughout the organization. Senior management will be responsible for ensuring that all staff are properly trained in the procedures that they should follow when undertaking their duties.
Table 38: Implementation of the Strategies
2.6.2 AUDIT COMMITTEE/S
Section 166(2) of the MFMA states that an audit committee is an independent advisory body which must –
(a) advise the municipal council, the political office-bearers, the accounting officer and the management staff of the municipality, on matters relating to – internal financial control; risk management; performance management; and effective governance.
A) FUNCTIONS OF THE AUDIT COMMITTEE
The previous audit committee was not functional and a new functional Audit Committee was appointed on 28 February 2011, which has a dual role as a Performance Audit Committee as well.
The Audit Committee have the following main functions as prescribed in section 166 (2) (a-e) of the Municipal Finance Management Act, 2003 and the Local Government Municipal and Performance Management Regulation:
To advise the Council on all matters related to compliance and effective governance.
To review the annual financial statements to provide Council with an authoritative and credible view of the financial position of the municipality, its efficiency and its overall level of compliance with the MFMA, the annual Division of Revenue Act (DoRA) and other applicable legislation.
Respond to the council on any issues raised by the Auditor-General in the audit report.
To review the quarterly reports submitted to it by the internal audit.
Page 55

BREEDE VALLEY MUNICIPALITY ANNUAL REPORT 2010/11
To evaluate audit reports pertaining to financial, administrative and technical systems.
To review the performance management system and make recommendations in this regard to Council.
To identify major risks to which Council is exposed and determine the extent to which risks have been minimised.
Review the plans of the Internal Audit function and in so doing; ensure that the plan addresses the high-risk areas and ensure that adequate resources are available.
Provide support to the Internal Audit function.
Ensure that no restrictions or limitations are placed on the Internal Audit section.
Evaluate the activities of the Internal Audit function in terms of their role as prescribed by legislation.
B) MEMBERS OF THE AUDIT COMMITTEE
Name of representative Capacity Meeting datesMr. B.J. Lodewyk Chairman
12 April 201125 May 201129 June 2011
Dr. B. Jansen van Rensburg MemberMs. N. Salie MemberMr. A.P. Croutz Member
Table 39: Members of the Audit Committee
2.6.3 PERFORMANCE AUDIT COMMITTEE
The Regulations require that the performance audit committee is comprised of a minimum of three members, the majority of whom are external (neither a councillor nor an employee) of the municipality. Section 14(2) (b) of the Regulations further stipulates that the performance audit committee must include at least one person who has expertise in performance management. It is also a requirement of the Regulations in Section 14(2)(d) that the Council of a municipality designate a member of the performance audit committee who is neither a councillor nor an employee of the municipality as the chairperson of the committee.
In terms of Section 166(4) (a) of the MFMA, an audit committee must consist of at least three persons with appropriate experience, of who the majority may not be in the employ of the municipality.
Page 56

BREEDE VALLEY MUNICIPALITY ANNUAL REPORT 2010/11
Section 166(5) of the MFMA, requires that the members of an audit committee must be appointed by the council of the municipality. One of the members, not in the employ of the municipality, must be appointed as the chairperson of the committee. No councillor may be a member of an audit committee.
Both the Regulations and the MFMA, indicate that three is the minimum number of members needed to comprise a performance audit committee. While the regulations preclude the appointment of a councillor as chairperson of the performance audit committee, the MFMA excludes the involvement of a councillor in the composition of a performance audit committee entirely.
Section 14(3) (a) of the Regulations requires that the performance audit committee of a municipality must meet at least twice during each financial year. However, additional special meetings of the performance audit committee may be called for by any member of the committee, where sufficient justification exists in terms of Section 14(3) (b) of the Regulations.
A) FUNCTIONS OF THE PERFORMANCE AUDIT COMMITTEE
In terms of Section 14(4) (a) of the Regulations the performance audit committee has the responsibility to -
(i) review the quarterly reports produced and submitted by the internal audit process;
(ii) review the municipality’s performance management system and make recommendations in this regard to the council of the municipality; and
(iii) at least twice during each financial year submit a performance audit report to the council of the municipality.
B) MEMBERS OF THE PERFORMANCE AUDIT COMMITTEE
Name of Member Capacity Experience Meeting datesMr. B.J. Lodewyk Chairman Chartered Accountant(SA)
15 June 2011Dr. B. Jansen van Rensburg Member Doctorate in Economics
Ms. N. Salie Member BCom Finance(Hons)Mr. A.P. Croutz Member B. Proc
Table 40: Members of the Performance Audit Committee
2.6.4 INTERNAL AUDITING
Section 165 (2) (a), (b) and (c) of the MFMA requires that:
Page 57

BREEDE VALLEY MUNICIPALITY ANNUAL REPORT 2010/11
The internal audit unit of a municipality must –
(a) prepare a risk based audit plan and an internal audit program for each financial year; and
(b) advise the accounting officer and report to the audit committee on the implementation on the internal audit plan and matters relating to:
(i) Internal audit;(ii) internal controls;(iii) accounting procedures and practices;(iv) risk and risk management;(v) performance management;(vi) loss control; and(vii) compliance with this Act, the annual Division of Revenue Act and any other applicable legislation; and
(c) perform such other duties as may be assigned to it by the accounting officer.
Breede Valley Municipality has an in-house Internal Audit function consisting of three auditors and two clerks; the Chief Audit Executive position however, has been vacant from 1st March 2011.
The Strategic Audit Plan sets out the scope, conduct and timing of internal audit work all areas audited after the organization’s risks were reviewed from the rolling three year Strategic Audit Plan and all risk areas not addressed provided the basis for the Annual Audit Plan for 2010/2011. The Strategic Audit Plan is reviewed each year so that it can be amended to reflect changing priorities and meet the emerging needs of Breede Valley Municipality.
High level overview of our approach
In line with the relevant legislative requirements(MFMA including Treasury Regulations), together with Internal Audit International Best Practice as prescribed by the Institute of Internal Auditors(IIA), we have tailored a risk based approach designed to provide a high value service specifically designed to meet our needs.
Some of the key objectives identified include:
Developing a comprehensive internal audit approach with the existing resources;
Perform an organisation wide risk assessment in accordance with good governance standards and leading practice methodologies;
Page 58

BREEDE VALLEY MUNICIPALITY ANNUAL REPORT 2010/11
Devise a comprehensive internal audit plan for the next twelve months and identify areas to be covered during the next three year period.
In particular, we are of the view that the Auditor-General is a key stakeholder and through our development process, we will ensure that duplication of work is minimised and that a greater degree of reliance may be placed on the internal audit coverage and work performed.
To ensure that we meet Internal Audit’s objective of adding value and improving BVM’s operations, we propose to develop and agree a ‘Value Charter’ for Internal Audit. This tailored BVM Internal Audit Charter will clearly specify our requirements from our service, the assignment objectives and appropriate performance measurement criteria against which the performance of our internal audit service will be measured.
We will discuss and agree this with appropriate levels of management to ensure a firm understanding of management’s key concerns and ascertain risk criteria and business objectives on which the risk assessment and audit planning phases will be based.
Risk assessment phase
The risk assessment phase is focused on identifying those risks which potentially impair the achievement of BVM’s objectives. We will work with management and other key stakeholders to leverage our knowledge of the municipality to establish risk priorities for auditable units. BVM’s internal audit methodology shifts the focus of assurance from controls on individual transactions, to controls on business processes, and then assesses risks within those processes.
In undertaking the risk assessment we would give consideration to the following areas:
BVM’s integrated development plan and strategic objectives.
The issues covered by the reports issued by the Office of the Auditor-General.
The impact of any pending new legislation on key business processes.
Outputs from our high-level process walk-through’s and discussions with management.
The appropriate level of interaction with BVM management to consolidate their concerns and facilitate their participation in the risk assessment process.
Past incidences of fraud or material breakdown in internal control.
Internal Audit will use the outputs from the risk assessment phase to develop a risk based inventory of business process which we use to define and assign internal audit priorities for BVM’s various departments. Audit planning activities will be supported by our extensive knowledge resources that
Page 59

BREEDE VALLEY MUNICIPALITY ANNUAL REPORT 2010/11
will provide us with innovative and field-tested audit strategies, leading practices, value ideas and other subject matter expertise.
Our combined methodology will be used to develop a comprehensive 12 month audit plan and three year rolling coverage strategy based on outputs and prioritised according to high risk areas and critical municipal processes.
In undertaking our work we considered the extent of assurance required after taking into account other internal and external reviews delivered by the Auditor General and any other relevant assurance providers over the past twelve months.
The final internal audit plan was agreed with management prior to submission to the Audit Committee for approval. The three year rolling coverage plan compiled formed the foundation of the execution of the internal audit activities. Having been validated with management, the three year rolling coverage plan is a sound basis for ensuring a cost effective resource utilisation, which is aligned to your objectives and address the areas which stakeholders and management were most concerned about.
Execution phase
The execution phase would typically involve the following activities:
Validate Initial Scope
The individual internal audit scope and objectives will be validated and agreed upon prior to commencing the execution of each individual audit assignment. The internal audit scope and objectives would be clearly linked to the risk assessment and internal audit coverage areas as identified in the internal audit planning phase.
Assignment Execution
During audit execution, internal audit will perform detailed reviews of agreed-upon areas and processes to establish the adequacy and effectiveness of current internal controls in place to counter the internal and external risks facing the BVM.
The execution process facilitates the identification of areas of over- and under-control which potentially results in duplication of effort, fruitless expenditure and uncontrolled exposures.
Reporting
Internal audit will communicate risk, control and process issues, and co-develop appropriate corrective action plans with relevant management. Once validated and agreed, formal audit reports are presented for distribution in terms of the pre-agreed communication protocols.
Page 60

BREEDE VALLEY MUNICIPALITY ANNUAL REPORT 2010/11
Follow-up of corrective action plans
At agreed intervals, internal audit will assess the degree of corrective action taken to satisfactorily resolve previously reported audit issues. Internal audit will communicate the status of corrective action, and develop with management appropriate remedial action plans to satisfactorily resolve previously reported issues. Formal follow-up audit reports are presented for distribution as per the pre-agreed communication protocols.
Communicating Results
Internal Audit should present to the Audit Committee on a regular basis, the results of internal audit activities that have been performed over reporting periods.
Typically the report should include feedback on the following:
Status of audit coverage achieved against the plan
Executive summary of significant issues
Status of follow-up corrective action
Significant risk areas identified outside internal audit scope
Performance results against the Value Charter
Page 61

BREEDE VALLEY MUNICIPALITY ANNUAL REPORT 2010/11
Annual Audit Plan
The Risk Based Audit Plan for 2010/11 which was executed based on the above Approach and Methodology; was only implemented 17% with available resources, which is attributable to vacancies and lack of capacity. The table below provides detail on audits completed:
BREEDE VALLEY MUNICIPALITY – ANNUAL AUDIT PLAN 2010/2011
DescriptionNo of Hours
estimated
Date completed
Phase 1Risk profile and priorities-update 200 30 June 2010Pro Audit Process Inputs 200 30 June 2010
Phase 2Compiling Risk Based Audit Plan 40 30 June 2010Management Meetings 300 30 June 2011
Phase 3
Audit Engagement
Departmental System Detail No of
Hours Date completed
Finance Financial Services
Revenue: Sundries & Rentals 400 Rolled over to the 2011/12 Internal Audit PlanAnnual Stock Take 200 23 June 2011Stores/Follow Up 100 28 February 2011Payroll: Deductions 200 Rolled over to the 2011/12 Internal Audit PlanSupply Chain/Procurement 400 Rolled over to the 2011/12 Internal Audit PlanTenders/Contracts 200 Rolled over to the 2011/12 Internal Audit Plan
Corporate Services
Human Resources
WSP Training Budget vs. Implementation 300 Not executed due to lack of staff
Recruitment & Selection Policy 200 Not executed due to lack of staff
Performance Information Governance
Performance Bonuses 100 Not executed due to lack of staff
Performance Information 200 Not executed due to lack of staff & non-availability of quarterly performance reports.
Operational Services Services
Cemeteries/follow up 100 Rolled over to the 2011/12 Internal Audit PlanSDBIP’s 300 Not executed due to lack of staff
Continuous Auditing/Consulting 1 000 30 June 2011Junior Internal Audit Assistance 240 30 June 2011Ad Hoc audits 200 23 June 2011Training CPD 200 30 June 2011
Total Hours 5 080 -
Page 62

BREEDE VALLEY MUNICIPALITY ANNUAL REPORT 2010/11
Table 41: Internal Audit Coverage Plan
Below are the functions of the Internal Audit Unit that was performed during the financial year under review:
Function Date/NumberRisk analysis completed/reviewed 30 June 2010Risk based audit plan approved for 2010/11 financial year 29 June 2011Internal audit programme drafted and approved 29 June 2011Number of audits conducted and reported on 3
Audit reports included the following key focus areas:Internal controls 3Accounting procedures and practices 3Risk and risk management 3Performance management -Loss control 1Compliance with the MFMA and other legislation 3
Table 42: Internal Audit Functions
2.6.5 BY-LAWS AND POLICIES
Section 11 of the MSA gives municipal Councils the executive and legislative authority to pass and implement by-laws and policies.
No by-laws were revised/adopted during the 2010/11 financial year.
Below is a list of all the municipal by-laws:By-laws developed/revised Date of Publication
Aerodrome by-law 22 October 2008Cemeteries and crematoria by-law 22 October 2008Commonage by-law 22 October 2008Electricity supply by-law 22 October 2008Fences and fencing by-law 22 October 2008Fire safety by-law 22 October 2008Impoundment of animals by-law 22 October 2008Outdoor advertising and signage by-law 22 October 2008Property rates by-law 22 October 2008By-law relating to prevention of public nuisance and public nuisance arising from keeping of animals 22 October 2008
By-law relating to roads and streets 22 0ctober 2008
Page 63

BREEDE VALLEY MUNICIPALITY ANNUAL REPORT 2010/11
By-laws developed/revised Date of PublicationInformal trading by-law 22 October 2008Public amenities by-law 22 October 2008Sporting facilities by-law 22 October 2008Storm water management by-laws 22 October 2008Sanitation services and industrial effluent 22 October 2008By-law relating to water supply 22 October 2008Solid waste disposal by-law 22 October 2008
Table 43: By-laws
Below is a list of all the policies developed and reviewed during the financial year:
Policies developed/ revised Date adopted
Public Participation Conducted Prior to adoption of policy
(Yes/No)Date of Publication
Asset management 5 May 2011 Yes 1 July 2011Fund & reserves 5 May 2011 Yes 1 July 2011Cash & investment 5 May 2011 Yes 1 July 2011Standby allowance 5 May 2011 Yes 1 July 2011Overtime 5 May 2011 Yes 1 July 2011Property rates 5 May 2011 Yes 1 July 2011Tariffs 5 May 2011 Yes 1 July 2011Customer care and management 5 May 2011 Yes 1 July 2011
Debt collection 5 May 2011 Yes 1 July 2011Indigent 5 May 2011 Yes 1 July 2011Cell phone 5 May 2011 Yes 1 July 2011Acting allowance section 57 employees 5 May 2011 Yes 1 July 2011
Supply chain management 5 May 2011 Yes 1 July 2011
Table 44: Policies
2.6.6 COMMUNICATION
Local government has a legal obligation and a political responsibility to ensure regular and effective communication with the community. The Constitution of the Republic of South Africa Act 1996 and other statutory enactments all impose an obligation on local government communicators and
Page 64

BREEDE VALLEY MUNICIPALITY ANNUAL REPORT 2010/11
require high levels of transparency, accountability, openness, participatory democracy and direct communication with the communities to improve the lives of all.
The communities, on the other hand, have a right and a responsibility to participate in local government affairs and decision-making and ample provision is made in the abovementioned legislation for them to exercise their right in this respect. Our democratic government is committed to the principle of Batho Pele and this, in simple terms, means that those we elect to represent us (councillors at the municipal level) and those who are employed to serve us (the municipal officials at municipal level) must always put people first in what they do.
Below is a communication checklist of the compliance to the communication requirements:Communication activities Yes/No
Communication unit Yes, comprises of 3 officialsCommunication strategy Yes, still in draftCommunication policy Yes, still in draft
Customer satisfaction surveys Yes, part of satisfaction surveys by Cape Winelands District Municipality
Functional complaint management systems Yes, complaints systems are currently not integrated, but all complaints are managed at departmental level
Newsletters distributed at least quarterly Newsletters are issued monthly, attached to municipal accounts
Table 45: Communication Activities
2.6.7 WEBSITE
A municipal website should be an integral part of a municipality’s communication infrastructure and strategy. It serves as a tool for community participation, improves stakeholder involvement and facilitates stakeholder monitoring and evaluation of municipal performance. Section 75 of the MFMA requires that the municipalities place key documents and information on their website, including the IDP, the annual budget, adjustments budgets and budget related documents and policies.
Below is a website checklist to indicate the compliance to Section 75 of the MFMA:Documents published on the Municipal website Date Published
Current annual and adjustments budgets and all budget-related documents 31 March 2011All current budget implementation policies 31 March 2011
Tariff policy 12 August 2011Credit control policy 12 August 2011Valuation policy 12 August 2011SCM policy 12 August 2011
Page 65

BREEDE VALLEY MUNICIPALITY ANNUAL REPORT 2010/11
Documents published on the Municipal website Date Published
Annual report (2009/10) 16 May 2011Performance agreements required in terms of section 57 (1) (b) of the Municipal Systems Act for 2010/11 22 February 2011
All service delivery agreements for 2010/11 12 August 2011All long-term borrowing contracts for 2010/11 n/aAll supply chain management contracts above the prescribed value for 2010/11 MonthlyInformation statement containing a list of assets over a prescribed that have been disposed of in terms of section 14 (2) or (4) of the MFMA during 2010/11 14 April 2011
Contracts agreed in 10/11 to which subsection (1) of section 33 of the MFMA apply, subject to subsection (3) of that section n/a
Public-private partnership agreements referred to in section 120 of the MFMA made in 2010/11 n/a
All quarterly reports tabled in the council in terms of section 52 (d) of the MFMA during 2010/11 12 August 2011
Table 46: Website Checklist
Page 66

BREEDE VALLEY MUNICIPALITY ANNUAL REPORT 2010/11
Page 67
CHAPTER 3
ORGANISATIONAL DEVELOPMENT PERFORMANCE

BREEDE VALLEY MUNICIPALITY ANNUAL REPORT 2010/11
CHAPTER 3: ORGANISATIONAL DEVELOPMENT PERFORMANCE
3.1 NATIONAL KEY PERFORMANCE INDICATORS – MUNICIPAL TRANSFORMATION AND ORGANISATIONAL DEVELOPMENT
The following table indicates the municipality’s performance in terms of the National Key Performance Indicators required in terms of the Local Government: Municipal Planning and the Performance Management Regulations of 2001 and section 43 of the MSA. These key performance indicators are linked to the National Key Performance Area – Municipal Transformation and Organisational Development.
KPA & INDICATORS
MUNICIPAL ACHIEVEMEN
T
MUNICIPAL ACHIEVEMEN
T
MUNICIPAL ACHIEVEMEN
T
2008/09 2009/10 2010/11
The number of people from employment equity target groups employed in the three highest levels of management in compliance with a municipality’s approved employment equity plan
6 3 0
The percentage of a municipality’s budget actually spent on implementing its workplace skills plan 0.65 0.51 0.26
Table 47: National KPIs– Municipal Transformation and Organisational Development
3.2 PERFORMANCE HIGHLIGHTS – MUNICIPAL TRANSFORMATION AND ORGANISATIONAL DEVELOPMENT
Highlight Description
Various Human Resources Policies were approved by Council Occupational Health and Safety Attendance and Punctuality Success Planning Scarce Skills Policy Training Policy Recruitment and Selection Policy
Each policy was first submitted to the Local Labour Forum for consultation, and then submitted to Council for approval on 20 February 2011.
Skills Audit forms were completed for each employee and the Skills Development Plan for 2011/2012 was compiled
The skills audit forms indicate the possible gaps of people in various positions which need to be addressed through training and development
Table 48: Performance Highlights– Municipal Transformation and Organisational Development
Page 68

BREEDE VALLEY MUNICIPALITY ANNUAL REPORT 2010/11
Page 69

BREEDE VALLEY MUNICIPALITY ANNUAL REPORT 2010/11
3.3 CHALLENGES – MUNICIPAL TRANSFORMATION AND ORGANISATIONAL DEVELOPMENT
Challenge Actions to address
Finalisation of the new Organisation Structure The old approved 2006 Organisation Structure did not make provision for strategic positions required for services delivery as identified in the annual Integrated Development Plan
The completion of the training in the Minimum Competency Modules, prescribed by National Treasury, remains concern and a challenge. All financial staff have to comply by 1 January 2013, as well as Senior Managers.
Three groups were identified at Breede Valley Municipality who started the training. A large group of senior managers and senior operational staff attend the training sessions on a monthly basis, causing many work and performance related problems due to their absence from work.
Table 49: Challenges – Municipal Transformation and Organisational Development
3.4 INTRODUCTION TO THE MUNICIPAL WORKFORCE
The Breede Valley Municipality currently employs 913 (excluding non-permanent positions) officials, who individually and collectively contribute to the achievement of Municipality’s objectives. The primary objective of Human Resource Management is to render an innovative HR service that addresses both skills development and an administrative function.
3.4.1 EMPLOYMENT EQUITY
The Employment Equity Act (1998) Chapter 3, Section 15 (1) states that affirmative action measures are measures designed to ensure that suitable qualified people from designated groups have equal employment opportunities and are equitably represented in all occupational categories and levels in the workforce of a designated employer. The national performance indicator also refers to: “Number of people from employment equity target groups employed in the three highest levels of management in compliance with a municipality’s approved employment equity plan”
A) EMPLOYMENT EQUITY TARGETS/ACTUAL
Please note that we currently do not have an Employment Equity plan for the years 2010-2015, as stipulated in our challenges. We have appointed an Acting Employment Equity Officer to help us overcome the current challenge.
Page 70

BREEDE VALLEY MUNICIPALITY ANNUAL REPORT 2010/11
B) EMPLOYMENT EQUITY VS. POPULATION
Description African Coloured Indian White TotalPopulation numbers 29 235 95 790 516 20 492 146 033% Population 20.01 65.59 0.35 14.03 100Number for positions filled 261 564 2 86 913Number for positions filled for the 2010/11 financial year 12 35 0 5 52
% for Positions filled 28.59 61.77 0.22 9.42 100
Table 50: EE population 2010/11
Note: The total population numbers is based on projection done by the Breede Valley municipality
C) OCCUPATIONAL CATEGORIES – RACE
Below is a table that indicate the number of employees by race within the specific occupational categories:
Posts filled
Occupational Male FemaleTotal
categories A C I W A C I W
Legislators, senior officials and managers 4 9 1 8 0 0 0 2 24
Professionals 3 11 0 5 2 4 0 3 28
Technicians and associate professionals 3 30 1 13 1 7 0 3 58
Clerks 19 51 0 9 31 79 0 18 207
Service and sales workers 14 33 0 11 5 14 0 1 78
Craft and related trades workers 10 62 0 13 1 1 0 0 87
Plant and machine operators and assemblers 11 41 0 0 0 2 0 0 54
Elementary occupations 127 150 0 0 30 70 0 0 377
Total permanent 191 387 2 59 70 177 0 27 913
Non- permanent 56 96 0 0 13 46 0 0 211
Grand total 247 483 2 59 83 223 0 27 1 124
Table 51: Occupational Categories
Page 71

BREEDE VALLEY MUNICIPALITY ANNUAL REPORT 2010/11
D) OCCUPATIONAL LEVELS - RACE
The table below categories the number of employees by race within the occupational levels:Occupational Male Female
TotalLevels A C I W A C I W
Top Management 1 3 0 1 0 0 0 0 5Senior management 2 7 1 11 0 1 0 2 24Professionally qualified and experienced specialists and mid- management
2 16 0 6 2 1 0 0 27
Skilled technical and academically qualified workers, junior management, supervisors, foremen and superintendents
40 115 1 33 39 89 0 25 342
Semi-skilled and discretionary decision making 19 65 0 8 9 33 0 0 134
Unskilled and defined decision making 127 181 0 0 20 53 0 0 381
Total permanent 191 387 2 59 70 177 0 27 913Non- permanent employees 56 96 0 0 13 46 0 0 211Grand total 247 483 2 59 83 223 0 27 1 124
Table 52: Occupational Levels
E) DEPARTMENTS - RACE
The following table categories the number of employees by race within the different departments:
DepartmentMale Female
TotalA C I W A C I W
Municipal Manager 2 5 0 2 2 3 0 1 15Corporate Services 12 23 0 6 9 15 0 4 69Financial Services 16 36 0 5 15 36 0 14 122Public Safety and Community Services 26 46 2 16 16 58 0 6 170
Operational Services 135 277 0 30 28 65 0 2 537Total permanent 191 387 2 59 70 177 0 27 913Non- permanent 56 96 0 0 13 46 0 0 211Grand total 237 483 2 59 83 223 0 27 1 124
Table 53: Department - Race
Page 72

BREEDE VALLEY MUNICIPALITY ANNUAL REPORT 2010/11
3.4.2 VACANCY RATE
The approved organigram for the municipality had 945 posts for the 2010/11 financial year. The actual positions filled are indicated in the tables below by post level and by functional level. 32 Posts were vacant at the end of 2010/11, resulting in a vacancy rate of 3.4%.
Below is a table that indicates the vacancies within the municipality:
PER POST LEVELPost level Filled Vacant
MM & MSA section 57 & 56 5 0Middle management 24 2Professionals 27 3Skilled technical and academically qualified workers, junior management, supervisors, foremen and superintendents
342 8
Unskilled and defined decision making 132 10General Workers 383 9Total 913 32
PER FUNCTIONAL LEVELFunctional area Filled Vacant
Municipal Manager 15 2Corporate Services 69 7Financial Services 121 8Public Safety and Community Services 176 3Operational Services 532 12Total 913 32
Table 54: Vacancy rate per post and functional level
Page 73

BREEDE VALLEY MUNICIPALITY ANNUAL REPORT 2010/11
The table below indicates the number of staff per level expressed as total positions and current vacancies express as full time staff equivalents:
Salary LevelNumber of
current critical vacancies
Number total posts as per organigram
Vacancy job titleVacancies (as a proportion of
total posts per category)
Municipal Manager 0 1 n/a 0.0%Chief Financial Officer 0 1 n/a 0.0%
Other Section 57 Managers 0 3 n/a 0.0%
Senior management 2 24 HR Manager
Audit Manager 8.3%
Highly skilled supervision 3 27 Head Technical x2
Engineer Technical 11.1%
Total 5 56 - 9.0%
Table 55: Vacancy rate per salary level
The folowing graph specifies the vacancy rate as a persentage per salary level:
Graph 2: Vacancy rate
Page 74

BREEDE VALLEY MUNICIPALITY ANNUAL REPORT 2010/11
3.4.3 TURNOVER RATE
A high turnover may be costly to a municipality and might negatively affect productivity, service delivery and institutional memory/organizational knowledge. Below is a table that shows the turnover rate within the municipality. The turnover rate shows a decrease from 8.2% in 2009/10 to 4.4% in 2010/11.
The table below indicates the turn-over rate over the last three years:
Financial yearTotal no
appointments at the end of each Financial Year
New appointments No Terminations during the year Turn-over Rate
2008/09 860 132 62 7.2
2009/10 911 89 75 8.2
2010/11 913 52 40 4.4
Table 56: Turnover Rate
The reason for the decrease in the turnover rate for the 2010/11 financial year is because there were less retirements, dismissals and resignations.
Page 75

BREEDE VALLEY MUNICIPALITY ANNUAL REPORT 2010/11
3.5 MANAGING THE MUNICIPAL WORKFORCE
Managing the municipal workforce refers to analysing and coordinating employee behaviour.
3.5.1 INJURIES
An occupational injury is a personal injury, disease or death resulting from an occupational accident. Compensation claims for such occupational injuries are calculated according to the seriousness of the injury/disease and can be costly to a municipality. Occupational injury will influence the loss of man hours and therefore financial and productivity performance.
The injury rate shows a slight decrease for the 2010/11 financial year from 127 employees injured against 134 employees in the 2009/10 financial year.
Incidents are investigated to determine whether there was any negligence involved to ensure that it is an actual injury on duty.
The table below indicates the total number of injuries within the different directorates:Directorates 2008/09 2009/10 2010/11
Municipal Manager 0 0 1Corporate Services 7 5 6Financial Services 3 8 6Public Safety and Community Services 8 8 7
Operational Services 71 113 107Total 89 134 127
Table 57: Injuries
Injuries in the Operational Services are normally higher due to the nature of work and the constant handling of equipment and machinery.
Page 76

BREEDE VALLEY MUNICIPALITY ANNUAL REPORT 2010/11
3.5.2 SICK LEAVE
The number of day’s sick leave taken by employees has service delivery and cost implications. The monitoring of sick leave identifies certain patterns or trends. Once these patterns are identified, corrective action can be taken.
The total number of employees that have taken sick leave during the 2010/11 financial year shows a slight increase when comparing it with the 2009/10 financial year.
The table below indicates the total number sick leave days taken within the different directorates:Department 2008/09 2009/10 2010/11
Municipal Manager 57.00 105.00 68.00Corporate Services 640.50 763.00 726.50Financial Services 897.50 1 391.50 1 225.50Public Safety and Community Services 1 732.00 1 959.50 2119Operational Services 4 384.00 5 854.50 6 029.50
Total 7 711.00 10 073.50 10 168.50
Table 58: Sick Leave
52 New appointments were made which caused an increase in the number of sick leave days taken.
Page 77
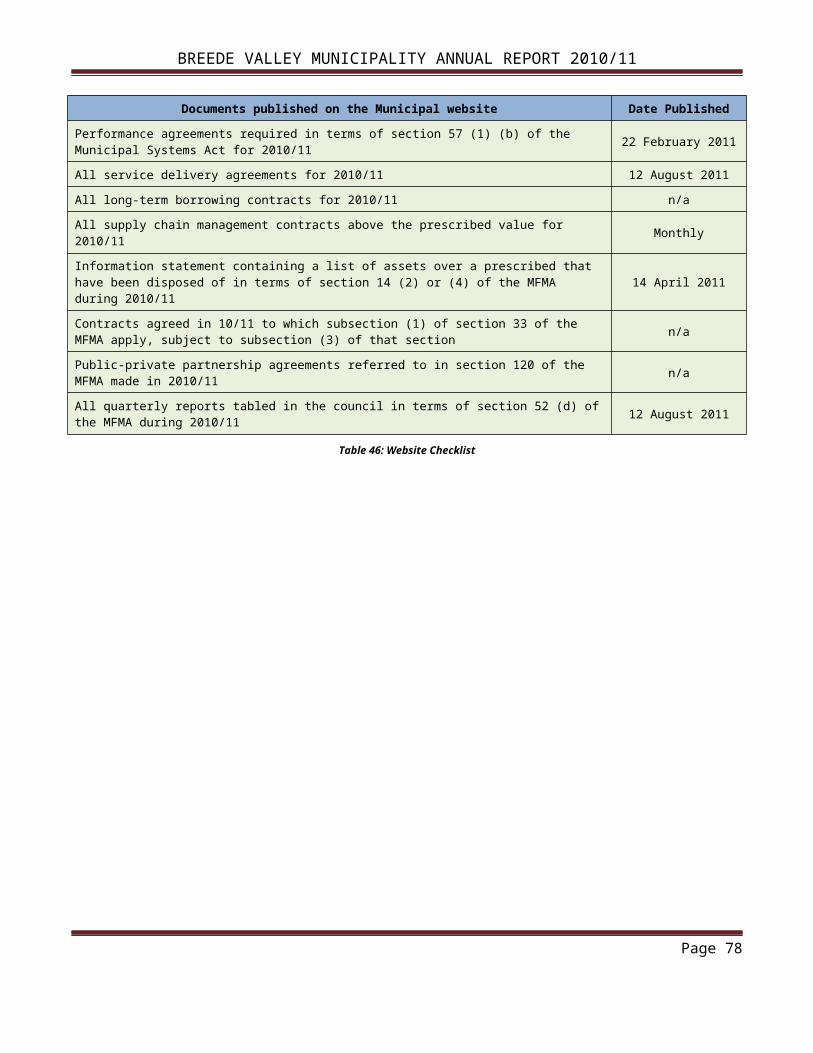
BREEDE VALLEY MUNICIPALITY ANNUAL REPORT 2010/11
3.5.3 HR POLICIES AND PLANS
Policies and plans provide guidance for fair and consistent staff treatment and a consistent approach to the managing of staff.
The table below shows the HR policies and plans that are approved and that still needs to be developed:
Approved policiesName of policy Date approved/ revised
Occupational Health and Safety Policy 28 February 2011Attendance and Punctuality 28 February 2011Succession Planning 28 February 2011Scarce Skills Policy 28 February 2011Training Policy 28 February 2011Recruitment and Selection Policy 28 February 2011
Policies still to be developedName of policy Proposed date of approval
HIV and AIDS policy 31 March 2012Smoking policy 31 March 2012Bursary policy 31 December 2012Essential users scheme policy 31 March 2012
Table 59: HR policies and plans
The Human Resources department submits policies to the Local Labour Forum on a regular basis for review purposes.
Page 78

BREEDE VALLEY MUNICIPALITY ANNUAL REPORT 2010/11
3.5.4 EMPLOYEE PERFORMANCE REWARDS
In accordance with regulation 32, a performance bonus, based on affordability, may be paid to an employee, after -(1) The annual report for the financial year under review has been tabled and adopted by the
municipal council;
(2) an evaluation of performance in accordance with the provisions of regulation 23; and
(3) approval of such evaluation by the municipal council as a reward for outstanding performance.
The evaluation of the performance of Section 57 managers forms the basis for rewarding outstanding performance.
The table below shows the total number of Section 57 that received performance rewards for the 2009/10 financial year. The 2010/11 financial year’s performance bonuses will only be awarded after the annual report was tabled:
Race Gender Number of beneficiaries
Total number of employees received
performance rewards
% Employees received
performance rewards
AfricanFemale 0 0 0
Male 1 1 100
AsianFemale 0 0 0
Male 0 0 0
ColouredFemale 0 0 0
Male 3 3 100
WhiteFemale 0 0 0
Male 1 1 100
DisabilityFemale 0 0 0
Male 0 0 0Total 5 5 100
Table 60: Performance Rewards
The Performance Management System will (was) be rolled out to all employees from post level 1 to post level 6 in 2011/2012.
Page 79

BREEDE VALLEY MUNICIPALITY ANNUAL REPORT 2010/11
3.6 CAPACITATING THE MUNICIPAL WORKFORCE
Section 68(1) of the MSA states that a municipality must develop its human resource capacity to a level that enables it to perform its functions and exercise its powers in an economical, effective, efficient and accountable way. For this purpose the human resource capacity of a municipality must comply with the Skills Development Act (SDA), 1998 (Act No. 81 of 1998), and the Skills Development Levies Act, 20 1999 (Act No. 28 of 1999).
3.6.1 SKILLS MATRIX
The table below indicates the number of employees that received training in the year under review:
Management level Gender
Number of employees identified for training at
start of the yearNumber of Employees that
received training
MM and S57Femal
e 0 0
Male 5 5
Legislators, senior officials and managers
Female 13 0
Male 27 0
Associate professionals and Technicians
Female 7 7
Male 25 25
ProfessionalsFemal
e 3 0
Male 15 2
ClerksFemal
e 67 45
Male 65 53
Service and sales workersFemal
e 58 1
Male 72 10
Craft and related trade workersFemal
e 0 0
Male 0 0
Plant and machine operators and assemblers
Female 12 6
Male 53 46
Elementary occupationsFemal
e 99 82
Male 166 119
Page 80

BREEDE VALLEY MUNICIPALITY ANNUAL REPORT 2010/11
Management level Gender
Number of employees identified for training at
start of the yearNumber of Employees that
received training
Sub totalFemal
e 259 141
Male 428 260Total 687 401
Table 61: Skills Matrix
Note: The reason why the figures differ from those in table 63 is due to the fact that some employees that have been identified for training are being identified for more than one training/workshop/skills course. In some instances the employees that are attending learnerships are also booked for a skills course.
The reason for the total work force not being trained is due to the following:
Insufficient funds budgeted for training Shortage of staff to be released for training
The following training was provided for employees trained:
Skills programs and other short courses Minimum competencies Water learner ships Admin and bookkeeping learner ship Telematic water learner ship Local Government Accounting certificate Internal audit technician
Page 81

BREEDE VALLEY MUNICIPALITY ANNUAL REPORT 2010/11
3.6.2 SKILLS DEVELOPMENT – TRAINING PROVIDED
The Skills Development Act (1998) and the Municipal Systems Act, (2000), require employers to supply employees with the necessary training in order to develop its human resource capacity. Section 55(1)(f) states that as head of administration the Municipal Manager is responsible for the management, utilization and training of staff.
Occupational categories Gender
Number of
employees as at
the beginning of the financial
year
Training provided within the reporting period
LearnershipsSkills
programmes & other short
coursesTotal
Actual Target Actual Target Actual Target%
Variance
MM and S57Female 0 0 0 0 0 0 0 0
Male 5 4 5 2 5 6 10 (40)Legislators, senior officials and managers
Female 4 1 4 0 0 1 4 (75)Male 21 8 15 4 10 12 25 (52)
ProfessionalsFemale 20 6 10 5 10 11 20 (45)
Male 25 17 25 7 15 24 40 (40)Technicians and associate professionals
Female 20 1 4 6 10 7 14 (50)Male 70 1 3 10 30 11 33 (66)
ClerksFemale 128 8 15 12 30 20 45 (55)
Male 78 17 30 12 30 29 60 (51)
Service and sales workers
Female 24 12 24 7 15 19 39 (51)Male 30 0 0 10 15 10 15 (33)
Craft and related trade workers
Female 2 0 0 0 0 0 0 0Male 30 4 4 13 20 17 24 (29)
Plant and machine operators and assemblers
Female 17 0 0 2 10 2 10 (80)Male 53 0 0 8 25 8 25 (68)
Elementary occupations
Female 87 0 0 40 60 40 60 (33)Male 299 0 0 120 160 120 160 (25)
Sub totalFemale 302 28 57 72 135 100 192 (47)
Male 611 51 82 186 310 237 392 (39)Total 913 79 139 258 445 337 584 (42)
Table 62: Skills Development
Page 82

BREEDE VALLEY MUNICIPALITY ANNUAL REPORT 2010/11
Page 83

BREEDE VALLEY MUNICIPALITY ANNUAL REPORT 2010/11
3.6.3 SKILLS DEVELOPMENT - BUDGET ALLOCATION
The table below indicates that a total amount of R 1 315 223 were allocated to the workplace skills plan and that 100.91% of the total amount was spent in the 2010/11 financial year:
Total personnel budget Total Allocated Total Spend % Spent
R 175 407 246 R 1 315 223 R 1 327 143 100.91
Table 63: Budget allocated and spent for skills development
The reason for the above is because of the non-availability of providers and the high cost of identified training.
LGSETA requires all municipalities to submit monthly training reports with evidence of attendance in order to ensure that actual training is taking place in terms of the Skills Development Plan submitted for the 2010/2011 financial year.
3.7 MANAGING THE MUNICIPAL WORKFORCE EXPENDITURE
Section 66 of the MSA states that the accounting officer of a municipality must report to the Council on all expenditure incurred by the municipality on staff salaries, wages, allowances and benefits. This is in line with the requirements of the Public Service Regulations, (2002), as well as National Treasury Budget and Reporting Regulations SA22 and SA23.
3.7.1 PERSONNEL EXPENDITURE
The percentage personnel expenditure is essential in the budgeting process as it reflects on current and future efficiency. The table below indicates the percentage of the municipal budget that was spent on salaries and allowance for the past three financial years and that the municipality is well within the national norm of between 35 to 40%:
Financial yearTotal Expenditure
salary and allowancesTotal Operating
Expenditure Percentage
R’000 R’000 (%)2008/09 *126 187 433 849 *292009/10 *158 528 *471 632 *342010/11 175 407 564 531 31
Table 64: Personnel Expenditure
Page 84

BREEDE VALLEY MUNICIPALITY ANNUAL REPORT 2010/11
*Note: figures in the previous years were amended and will therefore not match the figures in the previous year annual report.
Below is a summary of Councillor and staff benefits for the year under review:
Financial year 2007/08 2008/09 2009/10 2010/11
DescriptionActual Actual Actual Original
BudgetAdjusted Budget Actual
R’000 R’000 R’000 R’000 R’000 R’000Councillors (Political Office Bearers plus Other)
Salary 5 090 6 105 6 821 10 066 7 710 7 344Pension Contributions 107 679 783 0 777 763
Medical Aid Contributions 626 139 173 0 163 150Motor vehicle allowance 0 1443 1 313 0 1 225 1 208
Cell phone allowance 0 451 487 533 533 509Housing allowance 0 197 193 0 191 171Other benefits or
allowances 2 189 0 0 0 0 0
In-kind benefits 0 0 0 0 0 0Sub Total - Councillors 8 012 9 014 9 770 10 599 10 599 10 145% increase/ (decrease) - 12.5 8.4 8.5 – (4.3)
Senior Managers of the MunicipalityPension Contributions 1 807 2 473 2 949 3 137 2 932 3 269Pension Contributions 0 0 0 331 295 207
Medical Aid Contributions 0 0 0 91 91 84Motor vehicle allowance 424 530 551 598 551 551
Cell phone allowance 0 0 0 0 0 0Housing allowance 0 0 0 0 0 0Performance Bonus 83 228 444 566 579 519Other benefits or
allowances 267 285 288 208 185 8
In-kind benefits 0 0 0 0 0 0Sub Total - Senior
Managers of Municipality
2 581 3 516 4 232 5 203 4 741 4 638
% increase/ (decrease) - 36.2 20.4 16.5 (6.0) (0.1)Other Municipal Staff
Basic Salaries and Wages 69 470 73 817 89 598 112 920 102 457 99 036Pension Contributions 11 253 20 550 14 513 17 136 16 878 16 418
Medical Aid Contributions 7 671 8 935 10 415 13 450 13 816 11 805
Page 85

BREEDE VALLEY MUNICIPALITY ANNUAL REPORT 2010/11
Financial year 2007/08 2008/09 2009/10 2010/11
DescriptionActual Actual Actual Original
BudgetAdjusted Budget Actual
R’000 R’000 R’000 R’000 R’000 R’000Motor vehicle allowance 0 *2 955 3 539 4 353 4 097 3 971
Cell phone allowance 0 0 *0 63 359 454Housing allowance 0 1 663 1 251 1 198 1010 972
Overtime 6 985 8 255 9 448 5 999 9 867 10 239Other benefits or
allowances *(3 985) *(2 519) *15 761 *(1 284) *17 704 *17 729
Sub Total - Other Municipal Staff 91 394 113 656 144 526 153 837 166 189 160 624
% increase/ (decrease) - 24.4 27.2 6.4 8.0 (3.3)Total Municipality 101 987 126 187 158 528 169 639 181 530 175 407
% increase/ (decrease) - 23.7 25.6 6.8 7.1 (3.3)
Table 65: Personnel Expenditure
*Note: figures in the previous years were amended and will therefore not match the figures in the previous year annual report.
Page 86

BREEDE VALLEY MUNICIPALITY ANNUAL REPORT 2010/11
Page 87
CHAPTER 4
STRATEGIC PERFORMANCE

BREEDE VALLEY MUNICIPALITY ANNUAL REPORT 2010/11
Chapter 4: Strategic Performance
This chapter will provide information on the strategic performance of the municipality and will indicate how well the municipality is meeting its objectives and which policies and processes are working. All government institutions must report on strategic performance to ensure that service delivery is efficient, effective and economical. Municipalities must develop strategic plans and allocate resources for the implementation. The implementation must be monitored on an ongoing basis en the results must be reported on during the financial year to various role-players to enable them to timeously implement corrective measures where required.
This chapter speaks to the strategic performance highlights in terms of the Municipality’s IDP and the performance on basic service delivery. Additionally it also reflects in particular on the historical infra-structure, maintenance and service delivery backlogs and how these are addressed in part through the MIG projects. Moreover it also speaks to the spending priorities for the following year. Finally, it addresses the communication and public participation processes of the Municipality to give a holistic view of how the Municipality communicates performance to its stakeholders.
The Strategy map in figure 2 specifies the strategic link of the focus areas of the Breede Valley Municipality aligned with the National Key Performance Areas. The National Key Performance Areas are aligned with the Strategic Objectives that were identified in the 2010/11 reviewed IDP. The strategic objectives are linked to the outcomes for 2010/11. These alignments are directly linked to the Breede Valley municipality’s vision and mission.
Page 88
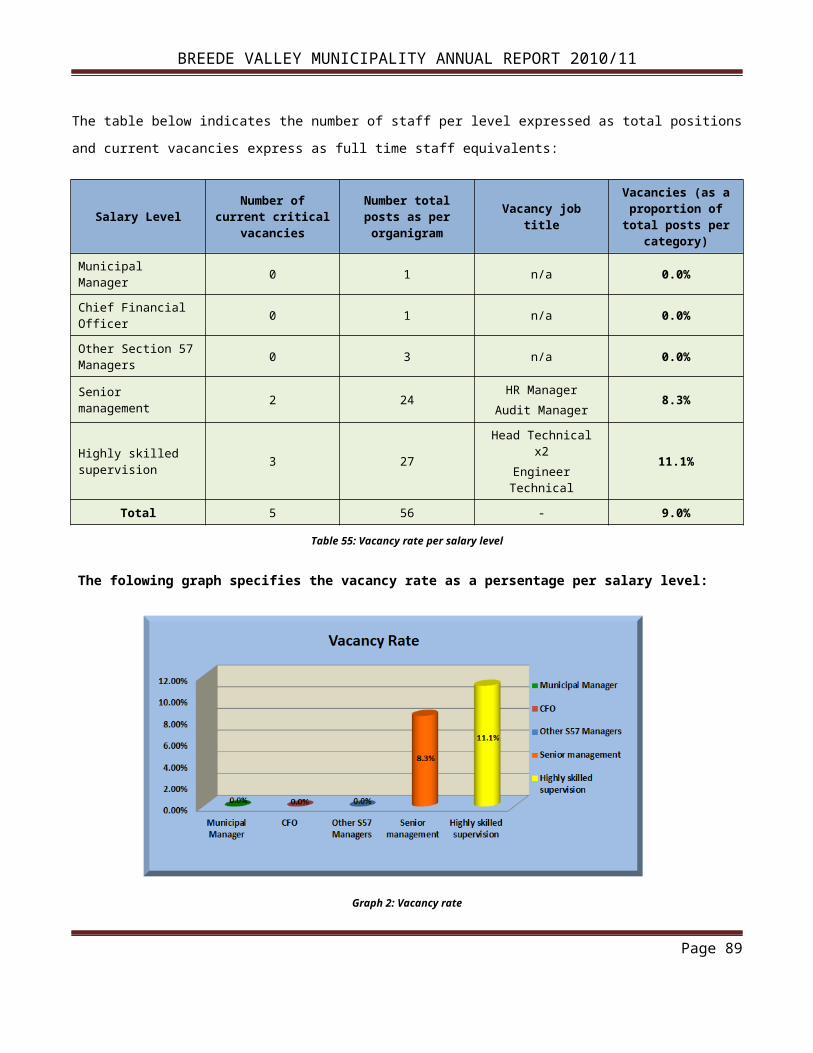
BREEDE VALLEY MUNICIPALITY ANNUAL REPORT 2010/11
Strategic Objectives
National KPAs
"A Unique and caring valley of service excellence, opportunity and growth"VISION
Municipal Transformation and
Institutional Development
Basic Service DeliveryMunicipal Financial
Viability and Management
Local Economic Development
Good Governance and Public Participation
To create an enabling environment for employment
and poverty eradication through proactive economic
development and tourism
To create a unique and caring valley of service excellence,
opportunity and growth
To actively participate in determining the future of our
country
"To provide sustainable and aff ordable services in a safe and healthy environment whilst promoting social and economic welfare through participative governance and committed service orientated approach to tersure the staff as the organisation's
most valuable resource and key to service delivery”
To ensure a healthy and productive work environment -
happy employees supported by a proactive accountable leadership
team
To provide and maintain basic services and ensure social
upliftment of the Breede valley community
MISSION
Assure financial viability and sustainable growth
To ensure a safe, healthy, clean and sustainable external
environment for all Breede Valley's people
To assure efficient and effective service delivery - A Rand's worth of service for every Rand Breede
valley gets paid
Figure 2: Strategy Map
The Municipal Systems Act, 2000 (Act 32 of 2000) and the Local Government: Municipal Planning and the Performance Management Regulations 2001 require municipalities to adopt a performance management system. Once the IDP and budget have been prepared and approved, the Municipality prepared their Service Delivery and Budget Implementation Plan (SDBIP) in accordance with the MFMA and MFMA Circular 13. The SDBIP indicates monthly performance targets, financial performance targets and assigns responsibility to execute the respective performance targets. The
Page 89

BREEDE VALLEY MUNICIPALITY ANNUAL REPORT 2010/11
Municipality assessed its performance on a monthly basis and reported progress on performance against targets set to Council quarterly and ultimately presents the annual performance results in this annual report.
4.1 NATIONAL KEY PERFORMANCE INDICATORS – BASIC SERVICE DELIVERY AND LOCAL ECONOMIC DEVELOPMENT
The following table indicates the municipality’s performance in terms of the National Key Performance Indicators required in terms of the Local Government: Municipal Planning and the Performance Management Regulations of 2001 and section 43 of the MSA. These key performance indicators are linked to the following two National Key Performance Areas: Basic Service Delivery and Local Economic Development.
KPA & INDICATORS
MUNICIPAL ACHIEVEMEN
T
MUNICIPAL ACHIEVEMEN
T
MUNICIPAL ACHIEVEMEN
T2008/09 2009/10 2010/11
Basic Service DeliveryThe number of households earning less than R 1 100 per month with access to free basic services No records 6 227 6 560
The percentage of households with access to basic level of water 99.50 98.81 100
The percentage of households with access to basic level of sanitation 94.57 94.20 94.30
The percentage of households with access to basic level of electricity 100 100 100
The percentage of households with access to basic level of solid waste removal 100 100 100
Local economic developmentThe number of jobs created through municipality’s local economic development initiatives including capital projects
No records 384 613
Table 66: National KPIs – Basic Service Delivery and Local Economic Development
Note: The percentages in the table above shows percentages of erven within the urban edge areas.
4.2 STRATEGIC SERVICE DELIVERY BUDGET IMPLEMENTATION PLAN (TOP LAYER)
The purpose of strategic performance reporting is to report specifically on the implementation and achievement of IDP outcomes. This section should provide an overview on the strategic achievement of a municipality in terms of the strategic intent and deliverables achieved as stated in the IDP. The top layer (strategic) SDBIP is the Municipality’s strategic plan and shows the
Page 90
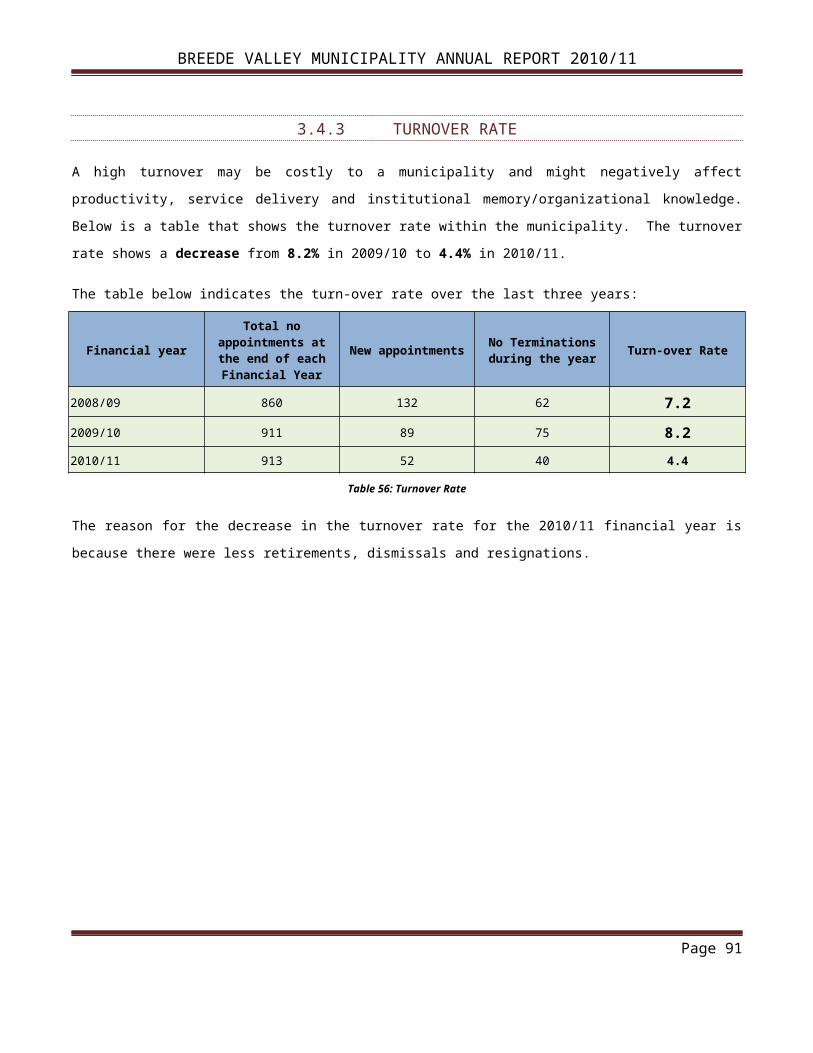
BREEDE VALLEY MUNICIPALITY ANNUAL REPORT 2010/11
strategic alignment between the different documents. (IDP, Budget and Performance Agreements). The Municipality compiled a top layer SDBIP for the first time in the 2010/11 financial year.
In the paragraphs below the performance achieved, is illustrated against the top layer SDBIP according to the 5 National Key Performance Areas linked to the Municipal Key Performance Areas and IDP (strategic) Objectives.
The following figure illustrates the method in which the strategic service delivery budget implementation plan is measured:
Figure 3: SDBIP Measurement Categories
The overall performance results achieved by the Municipality in terms of the Top Layer SDBIP are indicated in the table and graph below:
Directorates Total KPIsKPIs
Extremely Well Met
KPIs Well Met KPIs Met KPIs almost
MetKPIs not
Met
Basic Service Delivery 65 0 22 26 14 3Good Governance and Public Participation 24 1 1 13 6 3
Local Economic Development 2 1 0 1 0 0
Municipal Financial Viability and Management
13 2 3 5 1 2
Municipal Transformation and Institutional Development
5 2 1 2 0 0
Breede valley Municipality 109 6 27 47 21 8
Table 67: Top Layer SDBIP Performance per National KPA
Page 91

BREEDE VALLEY MUNICIPALITY ANNUAL REPORT 2010/11
The graph below displays the performance per National Key Performance Areas:
Graph 3: Performance per National Key Performance Area
Below is the top level SDBIP according to the 5 National Key Performance Areas linked to the Municipal Key Performance Areas and IDP strategic objectives.
4.2.1 TOP LEVEL SDBIP - GOOD GOVERNANCE AND PUBLIC PARTICIPATION
The National Key Performance Area Good Governance and Public Participation is linked to the strategic objective: “To actively participate in determining the future of our country”
KPI NameUnit of
Measurement
Wards
Baseline
Actual Performance 09/10
Annual
Target
Overall Performance for the Year Performance
commentTarge
t Actual
Approval of SDBIP
Approval of SDBIP before legislative deadline
All 100% New KPI 100% 100% 100% n/a
IDP endorsed by all wards
No of ward committees endorsing IDP
All 20 New KPI 21 21 20Endorsement of the IDP was conducted at a 'Ward Committee Summit'
IDP endorsed by community organisations and stakeholders as local social compacts
% of community organisations and stakeholders endorsing IDP
All 50% New KPI 80% 80% 100% n/a
IDP to include all required sectoral plans
No of required sectoral plans included
All 8 New KPI 8 8 7 The outstanding Sector Plan, Pollution Management Plan is not a priority for BVM, though funding will be sourced to draft this
Page 92

BREEDE VALLEY MUNICIPALITY ANNUAL REPORT 2010/11
KPI NameUnit of
Measurement
Wards
Baseline
Actual Performance 09/10
Annual
Target
Overall Performance for the Year Performance
commentTarge
t Actual
Sector Plan
Reviewed IDPIDP reviewed by May Annually
All 100% New KPI 100% 100% 100% IDP was reviewed with the budget.
Strengthen role of communities
No of ward based development plans completed, by March annually
All 20 New KPI 21 21 17 n/a
Annual performance reporting
Draft Annual report submitted to AG by end September
All 1 New KPI 1 1 1 n/a
Annual performance reporting
Final Annual report and oversight report of council submitted before legislative deadline
All 1 New KPI 4 1 1 n/a
Functional performance audit committee
No of meetings of the performance audit committee
All 0 New KPI 4 4 1
The Audit Committee was only appointed on 28 February 2011, and has a dual role as Performance Audit Committee; and due to time constraints could only hold 1 meeting during May 2011, and was not able to comply to legislation which prescribes 2 Performance Audit Committee meetings per year (Section 14(3)(a) of LG: Municipal Planning and Performance Management Regulations, 2001).Corrective action:Compliance to the above legislation will be ensured for the 2011/2012 financial year.
Institutional Performance
Individual performance
All Level 19
New KPI 100% 80% 60% A dedicated section for individual performance
Page 93

BREEDE VALLEY MUNICIPALITY ANNUAL REPORT 2010/11
KPI NameUnit of
Measurement
Wards
Baseline
Actual Performance 09/10
Annual
Target
Overall Performance for the Year Performance
commentTarge
t Actual
management system in place
management system implemented up to the lowest level
management will be established under the auspices of the Human Resources Department. It is envisages that IPM will be cascaded incrementally over three financial years.
Institutional Performance management system in place
No of performance agreements signed on time
All 5 New KPI 100 5 5 n/a
Effective communication with communities
Development or review of communication policy
All 0% New KPI 100% 100% 100% n/a
Effective functioning of ward committees
No of ward committee meetings per ward per annum
All 4 New KPI 1 4 6 n/a
Improved good governance
% Implementation of anti-corruption policy
All 0 New KPI 100% 100% 0%
The Anti-Corruption Policy was approved at Audit Committee level, but not yet approved by Council.Corrective action:It is foreseen that the Anti-Corruption Policy, which forms part of the Fraud Prevention Plan as prescribed by DPLG (Department: Provincial & Local Government) as part of its Local Government Anti-Corruption Strategy (LGACS) will be approved by Council in the new financial year.
Effective functioning of committee system
No of sec 79 committee meetings per committee per annum
All 11 New KPI 11 11 11 Although Council resolved to introduce Section 79 Committees, Chairpersons were never officially appointed so the Committees have never been convened. A new Council was inaugurated on 31 May 2011 but it was resolved that the item concerning the Structuring of Council stands over to the next
Page 94

BREEDE VALLEY MUNICIPALITY ANNUAL REPORT 2010/11
KPI NameUnit of
Measurement
Wards
Baseline
Actual Performance 09/10
Annual
Target
Overall Performance for the Year Performance
commentTarge
t Actual
Council meeting.
Reaching of employment equity targets
% of targets reached All 80% New KPI 90% 90% 35%
Some positions have been identified as scarce skills, thus resulting in targets not being reached.
IDP and sectoral plans aligned with Spatial development plan
% alignment All 100% New KPI 100% 100% 80%
The Management Team which monitors implementation of the IDP will scrutinise alignment of all Sector plans with the SDF
Functional Internal Audit unit
Approved Risk based audit plan by September 2010
All 100% New KPI 100% 100% 100%
The new Audit Committee was appointed by Council on 28 February 2011, and the 1st Audit Committee Meeting was held on 12 April 2011. The IA Plan for 2010/2011 was put on the agenda of 12 April 2011 for approval. The AC resolved that this item stand over to the next meeting. The IA Plan for 2010/2011 was then put on the agenda of the meeting of 25 May 2011, for approval by the AC. It was once again decided by the AC for the item to stand over to the next meeting. The approval of the 2010/2011 IA Plan is placed on the agenda for 29 June 2011, together with the approval of the 2011/2012 Risk Based IA Plan. The RBAP for 2010/2011 was approved on the Audit Committee meeting of 29 June 2011.
Municipality complying with all relevant legislation
% compliance with legislation
All 50% New KPI 70% 90% 90%Comply with policies. All finance policies were approved.
Complaints and customer care
% of complaints attended to within 48 hours
2 90% New KPI 90% 90% 72.08%
All complaints was been dealt with in a professional manner. No complaints are outstanding. the only challenge when it
Page 95

BREEDE VALLEY MUNICIPALITY ANNUAL REPORT 2010/11
KPI NameUnit of
Measurement
Wards
Baseline
Actual Performance 09/10
Annual
Target
Overall Performance for the Year Performance
commentTarge
t Actual
comes to service delivery complaints, was the supply chain processes
Spatial development plan aligned with PSDF and PGDS
% alignment All 100% New KPI 100% 100% 100% n/a
Creation of effective capacity
Vacancy level as % of approved organigram of funded
All 70% New KPI 100% 100% 100%
Vacancy filled internally with the same staff member that was seconded from Operations by June.
Approval of adjustments budget
Approval of adjustments budget before legislative deadline
All 100% New KPI 100% 100% 100%Budget 2011/2012 was tabled on 28 February 2011 and approved on time.
Approval of Main budget
Approval of Main budget before legislative deadline
All 100% New KPI 100% 100% 100%Budget 2011/2012 was tabled on 28 February 2011 and approved on time.
Table 68: Top Layer SDBIP – Good Governance and Public Participation
Page 96

BREEDE VALLEY MUNICIPALITY ANNUAL REPORT 2010/11
4.2.2 TOP LAYER SDBIP - MUNICIPAL TRANSFORMATION AND INSTITUTIONAL DEVELOPMENT
The National Key Performance Area Municipal Transformation and Institutional Development is linked to the strategic objective: “To ensure a healthy and productive work environment – happy employees supported by a productive accountable leadership team”
KPI NameUnit of
Measurement
Wards
Baseline
Actual Performance 09/10
Annual
Target
Overall Performance for the Year Performance
commentTarg
et Actual
Effective and up to date By-laws
% of By-laws revised annually
All 100% New KPI 100% 100% 100% n/a
Effective and up to date HR policies
Revision of all HR policies annually by 30 June 2010
All 100% New KPI 100% 100% 100% n/a
Effective labour relations
No of meetings of the LLF
All 4 New KPI 4 4 13 4 meetings already held by December.
Targeted skills development
% Implementation of skills development plan within budget
All 100% New KPI 100% 100% 150% A total of 370 staff members were trained.
Table 69: Top Layer SDBIP – Municipal Transformation and Institutional Development
Page 97

BREEDE VALLEY MUNICIPALITY ANNUAL REPORT 2010/11
4.2.3 TOP LAYER SDBIP - MUNICIPAL FINANCIAL VIABILITY AND MANAGEMENT
The National Key Performance Area Municipal Financial Viability and Management is linked to the strategic objective: “Assure financial viability and sustainable growth”
KPI NameUnit of
Measurement
Wards Baseline
Actual Performance 09/10
Annual
Target
Overall Performance for
the Year Performance comment
Target ActualImproved revenue collection
% Debt recovery rate All 97% New KPI 80% 80% 97% n/a
Percentage of property valuations disputed
% disputed All 3% New KPI 3% 3% 0%No objections were received for the supplementary valuation roll
Preparation of financial statements
Financial statements submitted on time
All 1 New KPI 1 1 1 n/a
Improvement in conditional grant spending - capital
% of total conditional capital grants spent
All 60% New KPI 100% 100% 94.21% n/a
Improvement in conditional grant spending - operational
% of total conditional operational grants spent
All 50% New KPI 100% 100% 67.53%Actual operating grants spent via budget
Updated indigent register for the provision of free basic services
Updated indigent register by 30 June 2010 Annually
All New KPI 100% 100% 100%
The list was sent through to SAMRAS for 4677 household who had applied by the 30th of June 2011 and is available electronically.
Clean audit
# of qualifications raised by AG in AG report addressed
All 0% New KPI 0 0 0
The following documents were compiled to ensure that the goal is accomplish: -BVM Audit Action Plan -Financial Year End Programme -Key Control Checklist List of Monthly Recons to be completed.
Clean audit
#of other matters raised by AG in AG report addressed
All 0% New KPI 0 0 0
Effective No of All 4 New KPI 3 0 0 n/a
Page 98

BREEDE VALLEY MUNICIPALITY ANNUAL REPORT 2010/11
KPI NameUnit of
Measurement
Wards Baseline
Actual Performance 09/10
Annual
Target
Overall Performance for
the Year Performance comment
Target ActualSCM system
successful appeals
Asset management
Maintained asset register All 4 New KPI 4 4 14 Preliminary
Table 70: Top Layer SDBIP – Municipal Financial Viability and Management
Page 99

BREEDE VALLEY MUNICIPALITY ANNUAL REPORT 2010/11
4.2.4 TOP LAYER SDBIP - LOCAL ECONOMIC DEVELOPMENT
The National Key Performance Area Local Economic Development is linked to the strategic objective: “To create an enabling environment for employment and poverty and poverty eradication through proactive economic development and tourism”
KPI NameUnit of
Measurement
Wards
Baseline
Actual Performance 09/10
Annual
Target
Overall Performance for the Year Performance
commentTarget Actual
Employment through job creation schemes
No of temporary jobs created
All 100 New KPI 120 120 613 Person days - 128 108
Reviewed and aligned LED strategy
LED strategy reviewed every 5 years
All 100% New KPI 100% 100% 100% n/a
Table 71: Top Layer SDBIP – Local Economic Development
4.2.5 TOP LAYER SDBIP - BASIC SERVICE DELIVERY
The National Key Performance Area Basic Service Delivery is linked to the strategic objectives: “To ensure a safe, healthy, clean and sustainable external environment for all Breede Valley’s people”, “To create a unique and caring valley of service excellence, opportunity and growth” and “To provide an maintain basic services and ensure social upliftment of the Breede Valley community”
KPI NameUnit of
Measurement
Wards Baseline
Actual Performance 09/10
Annual
Target
Overall Performance for
the Year Performance comment
Target Actual
Maintenance of grave yards
% of maintenance budget of grave yards spent
All 50% New KPI 100% 100% 82%
Urgent instruction has been given to speed up expenditure. Major works currently in progress and will be reflected in next report.
Maintenance of grave yards
Implementation of Master plan for grave yards
All 100% New KPI 100% 100% 92.50% Master Plan requirements are implemented as these become necessary. (Done in accordance with approved capital budget and
Page 100

BREEDE VALLEY MUNICIPALITY ANNUAL REPORT 2010/11
KPI NameUnit of
Measurement
Wards Baseline
Actual Performance 09/10
Annual
Target
Overall Performance for
the Year Performance comment
Target Actual
availability of funds.)
Maintenance of recreational areas
% of maintenance budget of recreational areas spent
All 50% New KPI 100% 100% 95.40%
Delays experienced in appointment of General Workers (beyond control of Civil Works Dept.) No Foreman in place. Foreman appointed as from 1 March 2011. Anticipated that performance will be positively addressed going forward. Foreman appointed as from 1 March 2011.
Maintenance of recreational areas
Development and implementation of maintenance plan for recreational areas
All 0 New KPI 1 1 1 n/a
Effective capital spending
% spent of approved electricity capital projects
All 50% New KPI 85% 85% 63.92%Purchase orders been cancelled / request for rollover
Effective capital spending
% spent of approved electricity capital projects
All 50% New KPI 80% 80% 66.70%
No Warehouse stock (light fittings) available to complete project - Avian Park
Effective management public lighting budget
% spent of approved public lighting budget
All 50% New KPI 90% 90% 105.87%
Over expenditure / June labour costs
Maintenance of electricity assets
% of maintenance budget of electricity spent
All 50% New KPI 80% 80% 106.24%
Over expenditure / June labour costs [
Maintenance of electricity assets
% of maintenance budget of electricity spent
All 50% New KPI 80% 80% 110.15%
Over expenditure / June labour costs [
Network capacity utilisation
% of Notified Maximum Demand (NMD)
All 40% New KPI 80% 80% 90.44% n/a
Page 101

BREEDE VALLEY MUNICIPALITY ANNUAL REPORT 2010/11
KPI NameUnit of
Measurement
Wards Baseline
Actual Performance 09/10
Annual
Target
Overall Performance for
the Year Performance comment
Target Actual
Network Load Factor
System Down time correct within 2 days
All 60% New KPI 100% 100% 100% n/a
Network losses % - kWh lost All 16% New KPI 15% 15% 6.61% n/a
Network losses
KW billed/ KW used by Municipality (kWh lost)
All 16% New KPI 15% 15% 6.61%Still be determined from SAMRAS system
Occupational Health and Safety
Nr of disabling incidents
All 5 New KPI 10 10 1.5Still be determined from SAMRAS system
Occupational Health and Safety - Number of disabling incidents
# - Incidents All 5 New KPI 10 10 13 n/a
Land Use Planning Ordinance (LUPO)
Implementation of the Land Use Planning Ordinance (LUPO) within legislative timeframes
All 75% New KPI 100% 80% 80% n/a
Effective capital spending
% spent of approved Municipal roads capital projects
All 90% New KPI 95% 95% 100% n/a
Km of new road for previously un-serviced areas
No of kilometres All 100% New KPI 100% 100% 75%
None done as no capital roads project has been approved for this financial year
Maintenance of Municipal roads
% of maintenance budget of Municipal roads spent
All 90% New KPI 95% 95% 94.40%
Figures based on SAMRAS expenditure. (Final 2010 / 2011 figures for all towns.)
Maintenance of Municipal roads
Kms of roads patched and resealed according to approved maintenance plan
All 4.6km New KPI 2 2 2 n/a
Sport facilities
% of the budget spent for the operation and maintenance of sport
All 50% New KPI 100% 100% 83.10% n/a
Page 102

BREEDE VALLEY MUNICIPALITY ANNUAL REPORT 2010/11
KPI NameUnit of
Measurement
Wards Baseline
Actual Performance 09/10
Annual
Target
Overall Performance for
the Year Performance comment
Target Actual
facilities% of HH receiving free basic refuse removal
% of HH All 100% New KPI 100% 100% 100% n/a
% of HH that meet agreed sanitation service standards (at least once a week): Formal areas
% of HH without that meet minimum standard sanitation
All 100% New KPI 100% 100% 100% n/a
%o of HH that meet agreed sanitation service standards (at least once a week): informal areas
% of HH without/ No of HH that meet minimum standard sanitation
All 100% New KPI 100% 100% 100% n/a
Effective capital spending
% spent of approved waste management capital projects
All 60% New KPI 95% 95% 100% n/a
Maintenance of refuse removal assets
% of approved operational and maintenance budget spend
All 90% New KPI 95% 95% 93.80% n/a
Maintenance of refuse sites
% of approved operational and maintenance budget spend
All 70% New KPI 95% 95% 95% n/a
Effective capital spending
% spent of approved storm water capital projects
All 100% New KPI 100% 100% 100% n/a
Effective capital spending
% spent of approved waste water management capital projects
All 60% New KPI 95% 95% 101.89% Worcester WwTW
Improvement % spent of All 100% New KPI 100% 100% 101.73 Additional budget for
Page 103

BREEDE VALLEY MUNICIPALITY ANNUAL REPORT 2010/11
KPI NameUnit of
Measurement
Wards Baseline
Actual Performance 09/10
Annual
Target
Overall Performance for
the Year Performance comment
Target Actual
of sanitation system capacity
approved sanitation capital projects
%
De Doorns South of N1 development was made available by the Department Human Settlement.
Maintenance of sanitation assets (Bulk services)
% of approved operational and maintenance budget spend
All 90% New KPI 95% 95% 97%
Total budget for four Wastewater plants R2,274,460 expenditure R2,213,352 - 97,3%
Maintenance of sanitation assets (Reticulation)
% of approved operational and maintenance budget spend
All 90% New KPI 95% 95% 86.70% n/a
Maintenance of storm water assets
% of operational and maintenance budget spent
All 100% New KPI 100% 100% 105.70%
Over-expenditure caused by additional work shortly before the end of the financial year caused by excessive heavy rains with resultant flooding of the informal squatters' are (A.S.)
Percentage of HH that meet agreed sanitation service standards (at least VIP on site): Formal areas
% of HH that meet agreed minimum standard sanitation
All 100% New KPI 100% 100% 100% n/a
Percentage of HH that meet agreed sanitation service standards (at least VIP on site): Informal areas
% of HH that meet minimum standard sanitation
All 100% New KPI 100% 100% 95%
95% of informal households within the urban edge do have excess to basic sanitation services (at least VIP on site). Informal households outside formal township developments do not have excess to basic sanitation services (at least VIP on site).
Percentage of HH with storm water system: Informal areas
% of HH that meet agreed standards
All 100% New KPI 100% 100% 100% n/a
Percentage % of HH that All 100% New KPI 100% 100% 100% n/a
Page 104

BREEDE VALLEY MUNICIPALITY ANNUAL REPORT 2010/11
KPI NameUnit of
Measurement
Wards Baseline
Actual Performance 09/10
Annual
Target
Overall Performance for
the Year Performance comment
Target Actual
of House Holds with storm water system: Formal areas
meet agreed standards
Quality of waste water discharge
% water quality level of waste water discharge
All 40% New KPI 70% 70% 77.38% n/a
Effective capital spending
% spent of approved water capital projects
All 60% New KPI 95% 95% 101.10%
Additional funding was made available by the Department of Human Settlement for the De Doorns South of N1 Development.
Effective capital spending
% spent of approved water purification capital projects
All 60% New KPI 95% 95% 100% No budget approved
Excellent water quality (SANS 241)
% water quality level as per blue drop project
All 98% New KPI 99% 99% 99% n/a
Maintenance of water assets (Bulk services)
% of approved operational and maintenance budget spend
All 90% New KPI 95% 95% 93%
Total budget R2,366,460 - Expenditure R2,196,486 - 92.8% - Under spent due to Pipeline maintenance could not be finalised because of inclement weather conditions.
Maintenance of water assets (Reticulation)
% of approved operational and maintenance budget spend
All 90% New KPI 95% 95% 90.40% n/a
New water connections
% of new water connections as projected within the budget
All 90% New KPI 95% 95% 100% n/a
Percentage of HH that meet agreed service standards
% of HH achieving agreed service standards
All 100% New KPI 100% 100% 100% n/a
Page 105

BREEDE VALLEY MUNICIPALITY ANNUAL REPORT 2010/11
KPI NameUnit of
Measurement
Wards Baseline
Actual Performance 09/10
Annual
Target
Overall Performance for
the Year Performance comment
Target Actual
(cleaned piped water 200m from household): Informal areasPercentage of HH that meet agreed service standards (cleaned piped water 200m from household): Formal areas
% of HH achieving agreed service standards
All 100% New KPI 100% 100% 100% n/a
Percentage water losses
KL billed/ KL used by Municipality (%)
All 33% New KPI 25% 25% 33.70%
1. Non-Revenue Water Basic % System Input By Value = 33.7% 2. Real Losses Detailed Infrastructure Leakage Index = 7.1
New electricity connections as per applications made
No of new electricity connections
All 225 New KPI 300 300 149
Only 149 new applications received. Budget for 149 connections spent.
Maintenance of halls and facilities
% of maintenance budget of halls and facilities spent
All 85% New KPI 95% 95% 100%Budget was exceeded by about R7000.00.
Maintenance of halls and facilities
Development and implementation of maintenance plan for halls and facilities
All 0% New KPI 85% 85% 85%
A schedule of what needs to be checked and the frequency of each item's checking was developed for all the buildings.
No of HH receiving free basic electricity
No of indigent households receiving free basic water
All 6227 New KPI 6,227 6,227 6,560 The list is available electronically
Quantum of free basic electricity received
Kwh per month per household
All 50 New KPI 50 50 50 n/a
Quantum of free basic refuse removal
R value per month per household
All 105 New KPI R 114 R 114 R 114 n/a
Page 106

BREEDE VALLEY MUNICIPALITY ANNUAL REPORT 2010/11
KPI NameUnit of
Measurement
Wards Baseline
Actual Performance 09/10
Annual
Target
Overall Performance for
the Year Performance comment
Target Actual
receivedPercentage of HH receiving free basic sanitation
% of HH All 100% New KPI 100% 100% 100% n/a
Quantum of free basic sanitation received
R value per month per household
All 120 New KPI R 145 R 145 R 145 n/a
No of HH receiving free basic water
# of households that received 6kl of free basic water
All 17400 New KPI 17,400 17,400 18,064 n/a
No of HH receiving free basic water
# of indigent households that received 10kl of free basic water
All 6227 New KPI 6,227 6,227 6,560
The list of indigent household who are eligible for 10 KL of free basic water is available electronically.
Quantum of free basic water received
Kl per month per household
All 6kl New KPI 6 6 6Every household receives free 6 kilolitres of water.
Quantum of free basic water received
Kl per month per indigent household
All 10kl New KPI 10 10 10 Refer to the invoice on the file
% of HH that meet agreed stds (all existing informal settlements to be formalised with land use plans for econ and social facilities and with the provision of permanent basic services)
80% of HH that meet standards
3; 4; 5; 6; 80% New KPI 10% 80% 85% 85% of HH that meet
agreed stds
Implementation of Integrated Human Settlement Strategy
40% implemented to policy or 3 projects
3; 4; 5; 6; 10; 100% New KPI 100% 100% 100%
3 Projects were already in implementation stage by June 2011.
Develop and % Decrease All 31% New KPI 100% 28.50 28.50% n/a
Page 107

BREEDE VALLEY MUNICIPALITY ANNUAL REPORT 2010/11
KPI NameUnit of
Measurement
Wards Baseline
Actual Performance 09/10
Annual
Target
Overall Performance for
the Year Performance comment
Target Actual
implement a comprehensive law enforcement strategy
in traffic violations %
Effective fire brigade service
% of Fire Brigade service that meets agreed standards
All 15% New KPI 27% 20% 15%
Other than upgrade of satellite fire station, no substantive change due to no improvement in staff establishment and fleet resources
Reviewed Disaster Management Framework/ Plan
Disaster Management Framework/ Plan reviewed Annually
All 100% New KPI 1 1 1 n/a
Percentage of HH with no recreational areas
% of towns without recreational areas
All 0% New KPI 0% 0% 0% n/a
Table 72: Top Layer SDBIP – Basic Service Delivery
4.3 DEVELOPMENT AND SERVICE DELIVERY PRIORITIES FOR 2011/12
The main development and service delivery priorities for 2011/12 forms part of the Municipality’s top layer SDBIP for 2011/12 and are indicated in the table below:
4.3.1 ASSURE FINANCIAL VIABILITY AND SUSTAINABLE GROWTH
KPI Unit of Measurement Wards Annual Target
Financial viability measured in terms of the available cash to cover fixed operating expenditure
Cost coverage ((Available cash + investments)/ Monthly fixed operating expenditure
All 2.08
Financial viability measured in terms of the Municipality's ability to meet its service debt obligations
Debt coverage ((Total operating revenue-operating grants received)/debt service payments due within the year)
All 8.7
Financial viability measured in terms of the outstanding service debtors
Service debtors to revenue: (Total outstanding service debtors/ revenue received for services)
All 14.2
Compliance with GRAP 16, 17 & 102 to ensure effective asset management
No. of findings in the audit report on non-compliance All 0
Compliance with the SCM Regulations (MFMA) measured by the limitation of
No. of successful appeals All 0
Page 108

BREEDE VALLEY MUNICIPALITY ANNUAL REPORT 2010/11
KPI Unit of Measurement Wards Annual Target
successful appeals against the MunicipalityImproved revenue collection % Debt recovery rate All 95%Improvement in capital conditional grant spending measured by the % spent % of the grant spent All 100%
Improvement in operational conditional grant spending measured by the % spent % of the grant spent All 95%
No of Root causes of issues raised by AG in AG report of the previous financial year addressed to promote a clean audit
No of Root causes addressed All 20
Review of valuation roll by June 2010 Review by June 2010 All 100%
Table 73: Services Delivery Priorities for 2011/12
Page 109

BREEDE VALLEY MUNICIPALITY ANNUAL REPORT 2010/11
4.3.2 TO ACTIVELY PARTICIPATE IN DETERMINING THE FUTURE OF OUR COUNTRY
KPI Unit of Measurement Wards Annual Target
Effective functioning of council measured in terms of the number of council meetings per annum
No of council meetings per annum All 4
Effective functioning of the executive Mayoral committee measured by the number of MAYCO meetings
No of MAYCO meetings per annum All 10
Functional performance audit committee measured by the number of meetings per annum
No of meetings held All 4
No of Section 57 performance agreements signed by the end of July No of performance agreements signed All 5
Annual revision of the anti-corruption policy and implementation of quarterly awareness actions
Number of actions implemented All 4
Average Citizen satisfaction rate as per the survey % Citizen satisfaction rate All 70
Effective functioning of ward committees to ensure consistent and regular communication with residents
No of ward committee meetings per ward per annum All 84
IDP reviewed and approved annually by the end of May IDP approved by the end of May All 100%
Review of communication policy by end June to ensure effective communication with the community
Communication policy reviewed by end June All 100%
Risk based audit plan approved by June Plan approved All 100%Strengthen the role of communities by facilitating ward based development plans
No of ward based development plans completed All 21
The Municipality comply with all the relevant legislation
No. of findings in the audit report on non-compliance with laws and regulations All 0
The Municipality listens and talks back to its people by ensuring that the IDP is endorsed by all wards
No of ward committees endorsing the IDP (One per Town) All 4
The Municipality listens and talks back to its people by ensuring that the IDP is endorsed by community organisations and stakeholders as local social compacts
No of community organisations and stakeholders endorsing the IDP All 4
The IDP is comprehensive and complies with the requirements of the Systems Act
No of required sectoral plans included in the IDP All 6
Table 74: Services Delivery Priorities for 2011/12
Page 110

BREEDE VALLEY MUNICIPALITY ANNUAL REPORT 2010/11
4.3.3 TO CREATE AN ENABLING ENVIRONMENT FOR EMPLOYMENT AND POVERTY ERADICATION THROUGH PROACTIVE ECONOMIC DEVELOPMENT AND TOURISM
KPI Unit of Measurement Wards
Annual Target
Maintenance of halls and facilities % of maintenance budget of halls and facilities spent All 95%
Review the maintenance plan for halls and facilities by end of June 2012 for the 2012/13 financial year
Plan reviewed by the end of June All 100%
The number of jobs created through Municipality’s local economic development initiatives including capital projects
Number of jobs created of contracts assigned to SMME's All 120
Recreational areas is maintained measured by the % of the maintenance budget spent
% of budget spent All 98%
Municipal parks and recreational areas is provided to all households measured by the provisioning of recreational areas for all new formal and informal developments
% of recreational areas for all new developments All 100%
Re-establishment of the sport office to service community sport needs, including a sport strategic framework by Mar 2012
Office established and framework submitted All 100%
Table 75: Services Delivery Priorities for 2011/12
4.3.4 TO ENSURE A HEALTHY AND PRODUCTIVE WORK ENVIRONMENT - HAPPY EMPLOYEES SUPPORTED BY A PROACTIVE ACCOUNTABLE LEADERSHIP TEAM
KPI Unit of Measurement Wards Annual Target
Targeted skills development measured by the implementation of the workplace skills plan
% of the budget spent on implementation of the WSP All 1
Institutional Performance management system in place and implement levels 0 - 6 (Van der Merwe system)
Number of levels implemented All 6
Effective and up to date By-laws No of By-laws review annually All 18Effective labour relations by facilitating regular LLF meetings per annum No of meetings of the LLF per annum All 4
Review the Information and Communication Technology master systems plan by end June
Plan reviewed by the end of June All 100%
Revise identified HR policies by the end of June to ensure compliant and up to date HR policies
No of policies reviewed All 5
Page 111

BREEDE VALLEY MUNICIPALITY ANNUAL REPORT 2010/11
KPI Unit of Measurement Wards Annual Target
Creation of an effective institution with sustainable capacity
% Budgeted vacancy level as % of approved organigram (National norm between 10-15%)
All 15%
Implementation of skills development plan with targeted skills development
No of personnel actually trained as per the approved budget All 200
Table 76: Services Delivery Priorities for 2011/12
4.3.5 TO ENSURE A SAFE, HEALTHY, CLEAN AND SUSTAINABLE EXTERNAL ENVIRONMENT FOR ALL BREEDE VALLEY'S PEOPLE
KPI Unit of Measurement Wards Annual Target
Disaster Management plan reviewed by the end of June Plan reviewed by the end of June All 100%
High profile community complaints effectively negotiated and resolved within one month after complaint has been lodged
Number of results achieved / number of high profile complaints lodged (%) All 95%
Implement a comprehensive law enforcement strategy to decrease high risk violations
2% decrease in high risk violations All 2%
Review the Fire Management Plan by end March Review by the end of March All 100%
Table 77: Services Delivery Priorities for 2011/12
4.3.6 TO PROVIDE AND MAINTAIN BASIC SERVICES AND ENSURE SOCIAL UPLIFTMENT OF THE BREEDE VALLEY COMMUNITY
KPI Unit of Measurement WardsAnnu
al Targe
tAll existing informal settlements are formalised with land use plans for economic and social facilities and with the provision of permanent basic services
No of households that meet standards All 500
Implementation of Integrated Human Settlement Strategy measured by the number of projects (De Doorns - phase 4, Zwelethemba – phase 2, Avian Park – phase 3) complying with approved strategy by the end of June
Number of projects implemented All 3
Provision of free basic electricity in terms No of households receiving free basic All 6 800
Page 112
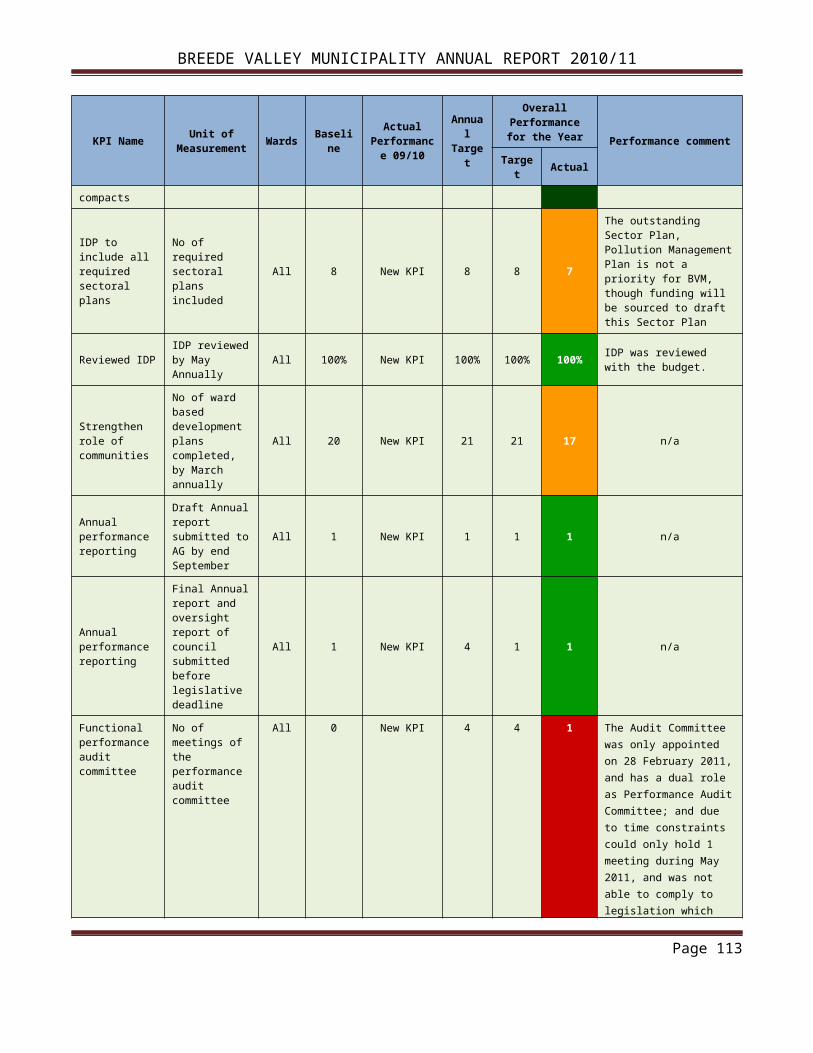
BREEDE VALLEY MUNICIPALITY ANNUAL REPORT 2010/11
KPI Unit of Measurement WardsAnnu
al Targe
tof the equitable share requirements electricityProvision of free basic electricity in terms of the equitable share requirements
Quantum of free basic electricity per household All 50
Provision of free basic refuse removal in terms of the equitable share requirements
No of households receiving free basic refuse removal All 6 800
Provision of free basic refuse removal in terms of the equitable share requirements
Quantum of free basic refuse removal per month per household All 122.9
9Provision of free basic sanitation in terms of the equitable share requirements
No of households receiving free basic sanitation All 6 800
Provision of free basic sanitation in terms of the equitable share requirements
Quantum of free basic sanitation provided per households All 174
Provision of free basic water in terms of the equitable share requirements
No of households receiving free basic water All 6 800
Quantum of free basic water per household in terms of the equitable share requirements
Quantum of free basic water provided per household All 10
Value of contracts assigned to SMME's to enhance economic development Value of contracts assigned All 3 300
000Provision of electricity that are connected to the municipal electricity grid to all informal areas
No of informal areas that meet agreed service standards
2; 12; 18 500
Provision of electricity that are connected to the municipal electricity grid to all formal areas
No of formal areas that meet agreed service standards All 22
641
Provision of refuse removal, refuse dumps and solid waste disposal to all formal areas
No of formal households for which refuse is removed at least once a week All 22
641Provision of refuse removal, refuse dumps and solid waste disposal to all informal areas
No of informal households for which refuse is removed at least once a week
2; 12; 18 500
Provision of sanitation systems limited to domestic waste water and sewerage disposal to formal households
No of formal households that have at least VIP on site All 22
641
Provision of sanitation systems limited to domestic waste water and sewerage disposal to informal households
No of informal households that have at least VIP on site
2; 12; 18 500
Provision of storm water management systems in built up areas to all formal households
No of households with All 22 641
Provision of cleaned piped water to all formal households within 200m from the household
No of formal households that meet agreed service standards for piped water All 22641
Provision of cleaned piped water to all informal households within 200m from the household
No of informal households that meet agreed service standards for piped water
2; 12; 18 500
Page 113

BREEDE VALLEY MUNICIPALITY ANNUAL REPORT 2010/11
KPI Unit of Measurement WardsAnnu
al Targe
tGraveyards is maintained measured by the % of the maintenance budget spent % of budget spent All 98%
Effective electricity capital spending measured by the % of budget spent
% spent of approved electricity capital projects All 98%
Effective management of electricity provisioning systems % of total electricity losses All 3%
Electricity assets is maintained in terms of the prioritised maintenance per the maintenance plan within approved maintenance budget
% of maintenance budget of electricity spent All 96%
Electricity connections to provide electricity reticulation to new housing developments
No of new electricity connections All 200
New 11/66kV electricity Substation at Worcester % Of project completed
9; 10; 11; 12; 13; 14
100%
Spatial development framework aligned with PSDF and PGDS by the end of October
Review and submitted to PGWC annually by the end of June All 100%
Spatial Development Framework reviewed and submitted to the Department of Environmental Affairs and Development Planning by the end of December
Framework submitted All 100%
Maintenance of municipal roads % of maintenance budget of municipal roads spent All 98%
Municipal roads is maintained measured by the kms of roads resealed according to approved maintenance plan
Km’s of roads resealed All 2.5km
Revision and update of the maintenance plan for municipal roads by January 2012 % completion of the revised plan All 100%
Maintenance of refuse removal assets % of maintenance budget of refuse removal spent All 98%
Initiate a business plan towards the improvement of the landfill site capacity subject to the Regional Integrated Waste Management Plan by the end July 2011
Consultant appointed All 100%
Development of a Storm water Master Plan by the end of June % completion of the Plan All 20%
Improvement of sewerage purification systems (Bulk services) in Worcester by the end of June
% completion of the project All 100%
Storm water assets is maintained in terms of the maintenance budget spent
% of maintenance budget of storm water spent All 98%
Upgrading of the Worcester Wastewater Treatment Works
% of upgrading completed 5; 6; 7; 8; 9;
10; 11;
100%
Page 114

BREEDE VALLEY MUNICIPALITY ANNUAL REPORT 2010/11
KPI Unit of Measurement WardsAnnu
al Targe
t12; 13; 14; 15; 16; 17; 18; 19
Quality of waste water discharge measured by the % waste water discharge that comply with microbial content
% waste water discharge that comply with microbial content All 95%
Augmentation of the Stetteynskloof Bulk Water Supply at Worcester and Rawsonville
% of project completed
5; 6; 7; 8; 9;
10; 11; 12; 13; 14; 15; 16; 17; 18; 19; 20; 21
100%
Effective management of water provisioning systems to limit unaccounted water
% of water unaccounted for All 30%
Effective water capital spending measured by the % of budget spent % spent of approved water capital projects All 98%
New water connections to provide for potable water supply systems No of new water connections per quarter All 200
Water assets are maintained in terms of the maintenance budget spent % of maintenance budget of water spent All 98%
Excellent water quality measured by the quality of water as per SANS 241 criteria % water quality level All 95%
Execution of water saving awareness initiative in terms of the Water Demand Management plan
Number of initiatives All 2
Table 78: Basic Service Delivery Priorities for 2011/12
4.4 BASIC SERVICE DELIVERY
4.4.1 BASIC SERVICES DELIVERY PERFORMANCE HIGHLIGHTS
Highlight DescriptionCommencement with WWwTW substation project Construction of a new 66 / 11 kV SubstationCommencement of renovation of municipal flats into new administrative office block.
Two municipal flats are being converted into office accommodation.
Upgrading switchgear at Protea Substation Replaced old 11kV switchgear with new panels.Upgrading switchgear at Brewelskloof Hospital Substation Replaced old 11kV switchgear with new panels.
Upgrading of Worcester Waste Water Treatment Plant (WWwTW)
An investment of R250 million was done over the period of the project to upgrade the WWwTW plant and
Page 115

BREEDE VALLEY MUNICIPALITY ANNUAL REPORT 2010/11
Highlight Descriptionan electricity substation as part of the improvement of bulk services to unblock future economic development in the BVM region
Table 79: Basic Services Delivery Highlights
4.4.2 BASIC SERVICES DELIVERY CHALLENGES
Service Area Challenge Actions to address
Hasie Square – De DoornsRemoval of existing services to facilitate re allocating of residents to Stofland
n/a
Ekuphumleni – De DoornsRemoval of existing services to facilitate re allocating of residents to Stofland
n/a
MV / HV Switchgear maintenance program
To complete as much of the programmed maintenance work within the available financial resources for the financial year.
To complete as much of the programmed maintenance work within the available financial resources for the financial year.
LV Network maintenance programTo complete as much of the programmed maintenance work within the available financial resources for the financial year.
To complete as much of the programmed maintenance work within the available financial resources for the financial year.
Vehicle fleet To maximize on the availability of vehicles available in the fleet
The replacement of aging vehicles within the fleet
Table 80: Basic Services Delivery Challenges
Page 116
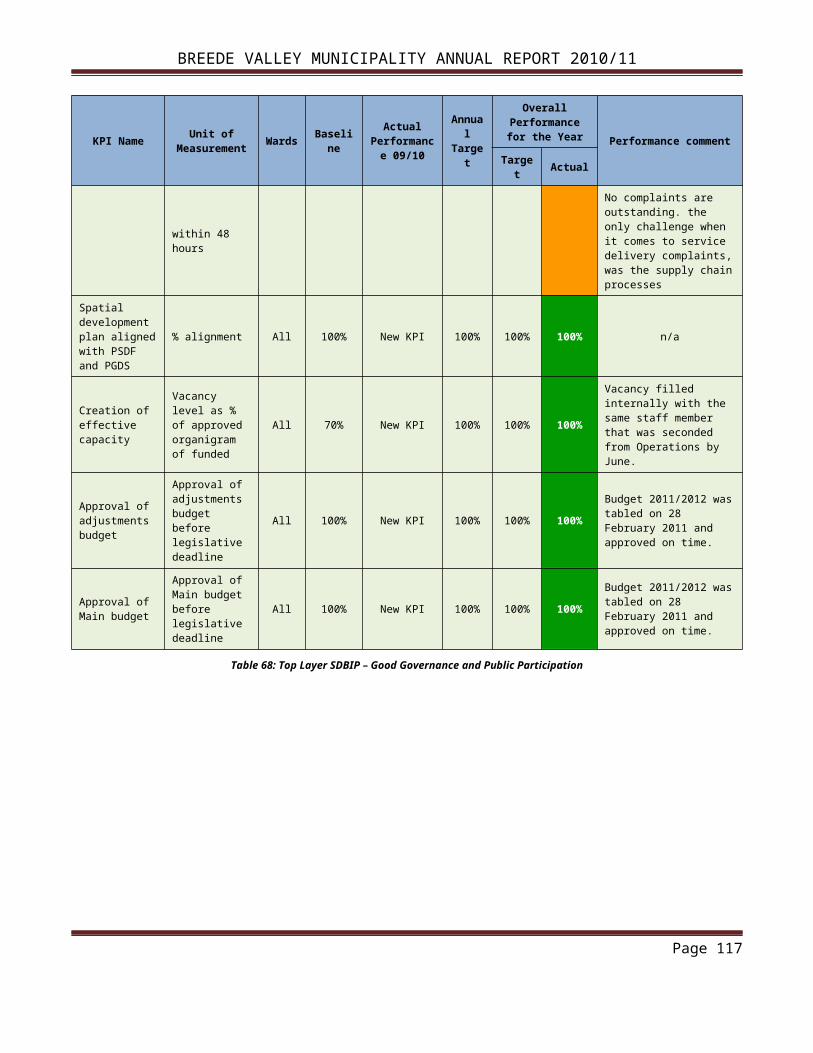
BREEDE VALLEY MUNICIPALITY ANNUAL REPORT 2010/11
4.4.3 ACCESS TO FREE BASIC SERVICES
The following table indicates the percentage of indigent households that have access to free basic municipal services. In accordance with the approved indigent policy of the municipality, all households earning less than R 2 700 per month will receive the free basic services as prescribed by national policy.
The access to free basic services is summarised into the different services as specified in the following table:
Electricity
Financial year
Indigent Households Non-indigent households Households in Eskom areas
No of HH
Unit per HH (kwh)
Value No of HH
Unit per HH (kwh)
Value No of HH
Unit per HH (kwh)
Value
R’000 R’000 R’000
2008/09 6 227 50 1 250 0 0 0 135 50 392009/10 6 429 50 2 084 0 0 0 135 50 782010/11 6 560 50 3 031 0 0 0 905 50 302
Table 81: Free basic Electricity services to indigent households
Water
Financial yearIndigent Households Non-indigent households
No of HH Unit per HH (kl)
ValueNo of HH Unit per
HH (kl)Value
R’000 R’0002008/09 6 227 10 1 297 17 891 6 3 7272009/10 6 429 10 1 490 18 071 6 4 1882010/11 6 560 10 1 680 18 426 6 4 721
Table 82: Free basic Water services to indigent households
Sanitation
Financial year
Indigent Households Non-indigent households
No of HH R value per HH
ValueNo of HH
Unit per HH per month
Value
R’000 R’000
2008/09 6 227 103 3 451 0 0 02009/10 6 429 121 4 500 0 0 02010/11 6 560 145 4 853 0 0 0
Table 83: Free basic Sanitation services to indigent households
Page 117
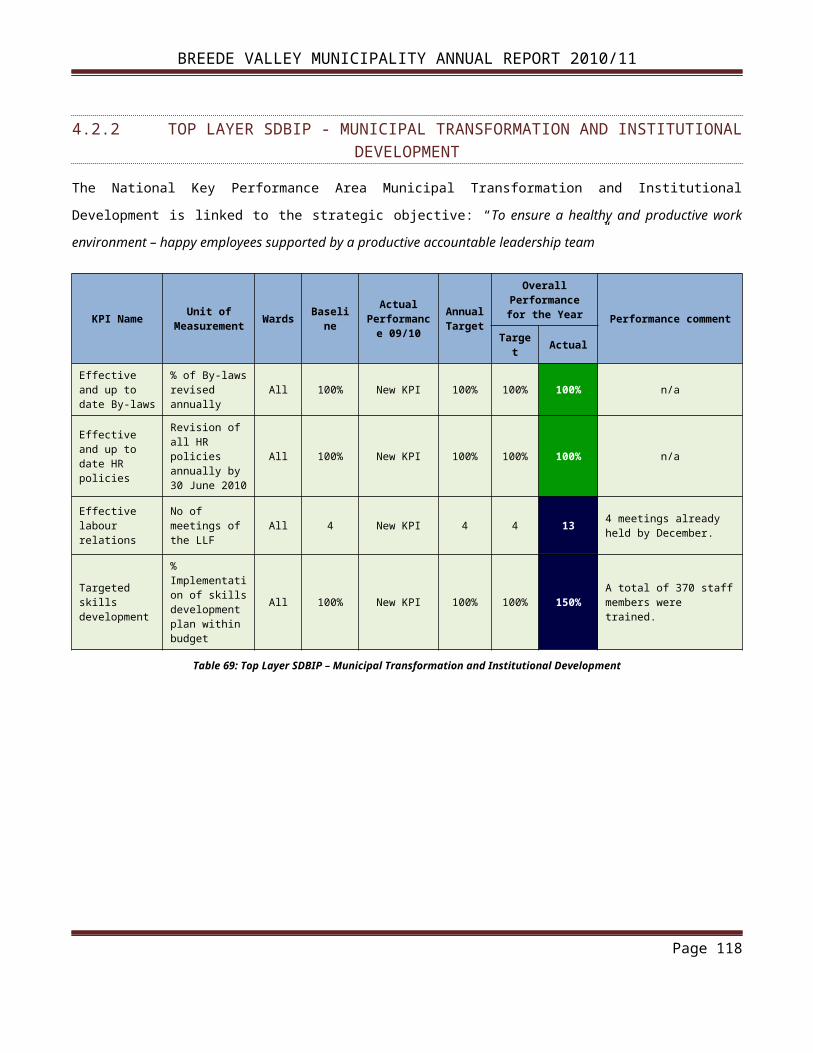
BREEDE VALLEY MUNICIPALITY ANNUAL REPORT 2010/11
Page 118

BREEDE VALLEY MUNICIPALITY ANNUAL REPORT 2010/11
Refuse Removal
Financial year
Indigent Households Non-indigent households
No of HHService per HH
per week
ValueNo of HH
Unit per HH per month
Value
R’000 R’000
2008/09 6 227 1 3 253 0 0 02009/10 6 429 1 4 357 0 0 0
2010/11 6 560 1 3 836 0 0 0
Table 84: Free basic Refuse Removal services to indigent households per type of service
4.4.4 ACCESS TO BASIC LEVEL OF SERVICES
The following table indicates the number of households that gained access for the first time to the different types of basic services during the 2010/11 financial year:
Type of service 2007/08 2008/09 2009/10 2010/11Housing 50 214 100 161Serviced Sites 0 653 577 473Water 187 411 577 473Sanitation 0 411 577 473Refuse removal 0 411 577 473Electricity 1 355 1 134 1 066 139Streets & Storm Water 0 411 577 473
Table 85: Access to basic level of services
A) CAPITAL BUDGET SPENT ON MUNICIPAL SERVICES
The percentage (%) of the total approved capital budget spent on each municipal service respectively for the 2008/09, 2009/10 and 2010/11 financial years respectively are as follows:
Financial Year
Housing Water Sanitation Refuse Removal Electricity
Streets & Storm Water
Community facilities
(%) (%) (%) (%) (%) (%) (%)
2008/09 Part of Opex *17.96 *19.27 *0 *14.83 *18.81 *0
2009/10 Part of Opex *19.94 *38.44 *0 *14.26 *15.05 *0
2010/11 Part of Opex 4.41 *62.38 *0 *10.19 *11.53 *0.37
Table 86: Capex
Page 119

BREEDE VALLEY MUNICIPALITY ANNUAL REPORT 2010/11
*Note: figures in the previous years were amended and will therefore not match the figures in the previous year annual report.
The following table indicates the total amount of capital expenditure on assets by asset class for the past three financial years:
Description
2007/08 2008/09 2009/10 2010/11
Actual Actual Actual Original Budget
Adjustment Budget
Actual Expenditur
eCapital expenditure on new assets by Asset Class/Sub-class (R’000)
Infrastructure *63 328 70 185 119 389 117 365 137 832 132 471Infrastructure - Road transport *10 765 18 419 20 337 1 931 17 263 16 957
Roads, Pavements & Bridges n/a n/a n/a 1 931 11 756 11 450
Infrastructure - Electricity *8 883 14 521 19 263 31 476 22 661 14 986
Transmission & Reticulation n/a n/a n/a 31 476 22 576 14 946
Street Lighting n/a n/a n/a 0 85 41Infrastructure - Water *6 659 17 582 26 939 530 6 922 6 489
Dams & Reservoirs n/a n/a n/a 0 0 0
Infrastructure - Sanitation *36 715 18 871 51 934 81 928 89 523 94 040
Reticulation n/a n/a n/a 0 7 595 7 641Infrastructure - Other *306 792 916 1 500 1 463 0
Waste Management n/a n/a n/a 0 0 0
Other n/a n/a n/a 1 500 1 463 2 268Community n/a n/a n/a 0 0 543
Parks & gardens n/a n/a n/a 0 0 0Sports fields & stadia n/a n/a n/a 0 0 0Community halls n/a n/a n/a 0 0 0Recreational facilities n/a n/a n/a 0 0 125Other n/a n/a n/a 0 0 0Heritage assets n/a n/a n/a 0 0 0
Investment properties n/a n/a n/a 0 0 0
Other assets *29 314 *10 383 5 370 4 916 9 094 4 378General vehicles n/a n/a n/a 420 1 375 822
Page 120

BREEDE VALLEY MUNICIPALITY ANNUAL REPORT 2010/11
Description
2007/08 2008/09 2009/10 2010/11
Actual Actual Actual Original Budget
Adjustment Budget
Actual Expenditur
ePlant & equipment n/a n/a n/a 388 1 033 566Furniture and other office equipment n/a n/a n/a 487 992 467
Civic Land and Buildings n/a n/a n/a 0 0 1 923
Other n/a n/a n/a 0 2 5Agricultural assets n/a n/a n/a 0 0 0Biological assets n/a n/a n/a 0 0 0
Intangibles 114 208 181 178 196 142Total Capital
Expenditure on new assets
92 756 80 777 124 940 122 459 147 122 137 534
Table 87: Total capital expenditure on assets
*Note: figures in the previous years were amended and will therefore not match the figures in the previous year annual report.
B) PERCENTAGE SPENDING ON TOTAL CAPITAL BUDGET
The total percentage (%) of the capital budget for the past three years is indicated in the table below:
Financial year
% of Capital budget spent
Reasons for under spending
2007/08 89.26 Delay in appointment of Contractors & Non-performance of Contractors: Unspent portion transferred to 2008/09
2008/09 82.49 Delay in appointment of Contractors: Unspent portion transferred to 2009/10
2009/10 92.48 Planning for new Electrical substation delayed/Vehicles delivered late/Contractors for extension to Fire station not appointed: Unspent portion transferred to 2010/2011
2010/11 93.48Appointment of Contractor for Electrical Substation delayed: Unspent portion transferred to 2011/12 / Electrification Avian Park delayed because of late transfers of Grant: Included in 2011/12 Budget
Table 88: Total capital expenditure
C) SUMMARY OF BACKLOGS THAT MUST STILL BE ADDRESSED
The following backlogs exist in the municipal area that must still be addressed:
Page 121

BREEDE VALLEY MUNICIPALITY ANNUAL REPORT 2010/11
AreaTotal nr of households
affectedTimeframe to be
addressedCost to address
R’000
Housing 23 500 About 30 years 500 000
Water (on site) 3 918 Approximately 10 years 44 500
Sanitation 3 918 Approximately 10 years 50 400
Refuse removal (at least once a week at site) 3 918 Approximately 10
years 5 000
Electricity (in house) 0 n/a n/a
Streets and storm water 3 918 Approximately 10 years 70 300
Table 89: Backlogs
Note: The backlogs for basic services are for households outside the urban edge
4.4.5 WATER AND SANITATION
Water is probably the most fundamental and indispensable of natural resources – fundamental to life, the environment, food production, hygiene and power generation. Poverty reduction and improved water management are inextricably linked. Section 4B of the Constitution lists water and sanitation services limited to potable water supply systems and domestic wastewater and sewerage disposal systems as a local government function. Basic water is defined as 25 litres of potable water per day supplied within 200 meters of a household.
A) WATER SERVICE DELIVERY LEVELS
Below is a table that specifies the different water service delivery levels per households within the urban edge area for the financial years 2007/08, 2008/09, 2009/10 and 2010/11:
Description2007/08 2008/09 2009/10 2010/11Actual Actual Actual Actual
HouseholdWater: (above minimum level)
Piped water inside dwelling 13 461 13 641 14 074 14 235Piped water inside yard (but not in dwelling) 1 773 2 384 3 469 3 942Using public tap (within 200m from dwelling ) 3 704 3 978 3 663 3 663Other water supply (within 200m) 0 0 0 0
Minimum Service Level and Above Sub-total 18 938 20 003 21 206 21 940
Minimum Service Level and Above Percentage 100.00 99.50 98.81 100.00
Page 122

BREEDE VALLEY MUNICIPALITY ANNUAL REPORT 2010/11
Description2007/08 2008/09 2009/10 2010/11Actual Actual Actual Actual
Water: (below minimum level)Using public tap (more than 200m from
dwelling) 0 100 255 0Other water supply (more than 200m from
dwelling 0 0 0 0No water supply 0 0 0 0
Below Minimum Service Level Sub-total 0 100 255 0Below Minimum Service Level Percentage 0.00 0.50 1.19 0
Total number of households (formal and informal) 18 938 20 103 21 461 21 940
Table 90: Water service delivery levels
Page 123

BREEDE VALLEY MUNICIPALITY ANNUAL REPORT 2010/11
The graph below shows the different water service delivery levels per total households and the progress per year:
Graph 4: Water service delivery levels
The graph below reflects the water service level below and above minimum standards:
Graph 5: Water with minimum service level
Page 124

BREEDE VALLEY MUNICIPALITY ANNUAL REPORT 2010/11
B) SANITATION SERVICE DELIVERY LEVELS
Below are a table that specifies the different sanitation service delivery levels per households within the urban edge area for the financial years 2007/08, 2008/09, 2009/10 and 2010/11:
Description2007/08 2008/09 2009/10 2010/11Actual Actual Actual Actual
HouseholdSanitation/sewerage: (above minimum level)
Flush toilet (connected to sewerage) 15 934 16 664 17 956 18 274Flush toilet (with septic tank) 100 100 100 100Chemical toilet 1 661 2 011 1 985 1 985Pit toilet (ventilated) 0 0 0 0Other toilet provisions (above minimum service level) 0 0 0 0
Minimum Service Level and Above Sub-total 17 695 18 775 20 041 20 359
Minimum Service Level and Above Percentage 94.31 94.57 94.20 94.30
Sanitation/sewerage: (below minimum level)Bucket toilet 0 0 0 0Other toilet provisions (below minimum service level) 0 0 0 0
No toilet provisions 1 067 1 078 1 233 1 233Below Minimum Service Level Sub-total 1 067 1 078 1 233 1 233
Below Minimum Service Level Percentage 5.69 5.43 5.80 5.71
Total number of households 18 762 19 853 21 274 21 592
Table 91: Sanitation service delivery levels
Page 125

BREEDE VALLEY MUNICIPALITY ANNUAL REPORT 2010/11
The graph below shows the different sanitation/sewerage service delivery levels per total households and the progress per year:
Graph 6: Sanitation/Sewerage Service Delivery Levels
The graph below shows the total number of households which are
below and above minimum sanitation standards:
Graph 7: Sanitation/Sewerage minimum standards
Page 126

BREEDE VALLEY MUNICIPALITY ANNUAL REPORT 2010/11
4.4.6 ELECTRICITY
Local Government plays a very important role in the provision of electricity. Section 153 of the Constitution places the responsibility on municipalities to ensure the provision of services to communities in a sustainable manner for economic and social support. The table below indicates the different service delivery level standards for electricity in all formal areas within the Municipality:
The Energy Losses for the 2009/10 financial year was 10.41% whilst the losses in the 2010/2011 financial year were only 6.61%. This outcome gives an end result of 3.8% reduction in energy losses that is a huge achievement for the Municipality.
The table below indicates the different service delivery level standards for electricity within the urban edge area of the Municipality:
Description2007/08 2008/09 2009/10 2010/11Actual Actual Actual Actual
HouseholdEnergy: (above minimum level)
Electricity (at least minimum service level) 6 394 6 409 6 423 6 560Electricity - prepaid (minimum service level) 17 408 18 527 19 894 19 231
Minimum Service Level and Above Sub-total 23 802 24 936 26 317 25 791
Minimum Service Level and Above Percentage 100 100 100 100
Energy: (below minimum level)Electricity (< minimum service level) 0 0 0 0Electricity - prepaid (< min. service level) 0 0 0 0Other energy sources 0 0 0 0
Below Minimum Service Level Sub-total 0 0 0 0Below Minimum Service Level Percentage 0 0 0 0
Total number of households 23 802 24 936 26 317 25 791
Table 92: Electricity service delivery levels
Page 127

BREEDE VALLEY MUNICIPALITY ANNUAL REPORT 2010/11
The following graph shows the number of households categorised into the different service levels:
Graph 8: Electricity Service Delivery Levels
Page 128

BREEDE VALLEY MUNICIPALITY ANNUAL REPORT 2010/11
4.4.7 HOUSING
The following table shows the increase in the number of people on the housing waiting list. There are currently approximately 25 300 applicants on the waiting list.
Housing waiting list Nr of people on Housing waiting list % Housing waiting list increase
2007/08 13 540 252008/09 23 657 802009/10 24 200 102010/11 25 300 10
Table 93: Housing waiting list
A total amount of R 32 000 000 was allocated to build houses and to service sites during the financial year under review. A summary of houses built and sites serviced includes:
Financial yearAllocation Amount spent % spent Number of
houses builtNumber of
sites serviced(R’000) (R’000) (%) (#) (#)
2007/08 31 556 2 952 9 35 02008/09 44 110 34 863 79 214 6532009/10 52 255 34 012 65 100 5772010/11 32 000 58 413 182 280 700
Table 94: Housing
Page 129

BREEDE VALLEY MUNICIPALITY ANNUAL REPORT 2010/11
4.4.8 REFUSE REMOVAL
The table below indicates the different refuse removal service delivery level standards within the urban edge area of the Municipality:
Description2007/08 2008/09 2009/10 2010/11Outcome Actual Actual Actual
HouseholdRefuse Removal: (Minimum level)
Removed at least once a week 18 938 20 052 21 284 21 940Minimum Service Level and Above Sub-
total 18 938 20 052 21 284 21 940
Minimum Service Level and Above Percentage 100 100 100 100
Refuse Removal: (Below minimum level)Removed less frequently than once a week 0 0 0 0Using communal refuse dump 0 0 0 0Using own refuse dump 0 0 0 0Other rubbish disposal 0 0 0 0No rubbish disposal 0 0 0 0
Below Minimum Service Level Sub-total 0 0 0 0Below Minimum Service Level percentage 0 0 0 0
Total number of households 18 938 20 052 21 284 21 940
Table 95: Refuse removal service delivery levels
The following graph indicates the different refuse removal standards which the households are receiving:
Page 130

BREEDE VALLEY MUNICIPALITY ANNUAL REPORT 2010/11
Graph 9: Refuse removal service delivery levels
Page 131

BREEDE VALLEY MUNICIPALITY ANNUAL REPORT 2010/11
4.4.9 ROADS
The following tables give an overview of the total kilometres of roads maintained and new roads tarred:
A) TARRED ROADS
Financial year Total km tarred roads
Km of new tar roads
Km existing tar roads re-
tarred
Km of existing tar roads re-
sheetedKm tar roads maintained
2008/09 316 0.42 0 19 3162009/10 316 0 0 12 3162010/11 321.4 1.7 0 1.5 321.4
Table 96: Tarred roads
B) GRAVELLED ROADS
Financial year Total km gravel roads
Km new gravel roads constructed
Km gravel roads upgraded to tar
Km gravel roads graded/maintaine
d2008/09 36.5 4.4 0 36.52009/10 40.9 6.2 0 40.92010/11 40.3 0 0 40.3
Table 97: Gravelled roads
C) COST OF CONSTRUCTION/MAINTENANCE
The table below shows the costs involved for the maintenance and construction of roads within the municipal area:
Financial year
Gravel TarNew
R’000Gravel – Tar
R’000Maintained
R’000New
R’000Re-worked
R’000Maintained
R’0002007/08 0 2 246 97 0 0 8432008/09 6 492 0 244 1 404 0 2 1192009/10 9 594 0 258 0 0 2 2392010/11 0 0 517 16 000 0 2 489
Table 98: Cost of Road Construction
Page 132

BREEDE VALLEY MUNICIPALITY ANNUAL REPORT 2010/11
4.4.10 STORM WATER
A) STORM WATER INFRASTRUCTURE
The table below shows the total kilometres of storm water maintained and upgraded as well as the kilometres of new storm water pipes installed:
Financial year Total km storm water measures
Km new storm water measures
Km storm water measures upgraded
Km storm water measures
maintained2008/09 87.5 0.711 88.2 88.22009/10 88.2 1.846 90 902010/11 90 0 0 90
Table 99: Storm water infrastructure
B) COST OF CONSTRUCTION/MAINTENANCE
The table below indicates the amount of money spend on storm water projects:
Financial yearStorm water Measures
CapitalR’000
MaintainedR’000
2007/08 0 5512008/09 4 400 5322009/10 5 351 6412010/11 0 994
Table 100: Cost of construction/maintenance of storm water systems
Page 133

BREEDE VALLEY MUNICIPALITY ANNUAL REPORT 2010/11
4.5 MUNICIPAL INFRASTRUCTURE AND OTHER GRANTS
The Municipality had a total amount of R 49 542 892 for infrastructure and other capital projects available that was received in the form of grants from the National and Provincial Governments during the 2010/11 financial year. The performance in the spending of these grants is summarised as follows:
Description
2008/09 2009/10 2010/11Amount Receive
d
Amount
Spent
Amount Receive
d
Amount
Spent
Amount Receive
d
Amount
SpentR’000
National Government:Integrated National Electrification Programme 152 1 178 6 000 7 643 - -MIG 8 857 15 567 34 267 12 363 - 18 390
Provincial Government:De Doorns Taxi Shelter 0 50 0 0 - -Speed calming: Springveld Str. 0 90 0 0 - -Zwelethemba Taxi rank 0 5 0 0 - -Dept Of Transport (Received prior 2008) 0 35 0 0 - -Zwelethemba hostel upgrading (Received prior 2008) 0 22 0 381 - -Department Sport 650 0 0 0 - -Library equipment 157 157 46 46 169 169Resealing Proclaimed roads 764 764 1 680 1 680 1 545 1 545Extension Worc WwTW 200 200 0 0 - -G I S 0 0 104 104 - -Man Supp Grant: HR 0 0 50 37 - 4Zwelethemba Services (2008/09 = refund on previously spent) 18 613 18 077 608 1 002 - -UISP: De Doorns Services 0 0 25 000 27 497 28 494 27 717
District Municipality:Equipment: Waste water purification 0 49 0 0 - -Purchase land Hasie Square (Received prior 2008) 0 0 0 0 - -Housing Consumer Education 0 0 0 0 - -Upgrading Pump Station 510 510 0 0 - -Water System 600 600 0 0 - -Waste Disposal Equipment Sandhills 200 0 0 200 - -Water Project: Taps 90 90 0 0 - -Bitumen Surface: Paving Man System 0 0 1 500 1 500 1 300 1 300Water Reticulation: Informal areas 0 0 420 420 - -
Page 134

BREEDE VALLEY MUNICIPALITY ANNUAL REPORT 2010/11
Description
2008/09 2009/10 2010/11Amount Receive
d
Amount
Spent
Amount Receive
d
Amount
Spent
Amount Receive
d
Amount
SpentR’000
Other grant providers:Nat Lottery: Zwelethemba Sport 500 39 0 0 - 125United Bulk: Tanker - - - - 100 100Workmanship and Materials - - - - 190 190Waterloo library: Books - - - - 2 2
Table 101: Spending of grants
4.6 ADDITIONAL PERFORMANCE
The table below enclose all additional performance of the Municipality:Type of service 2008/09 2009/10 2010/11
General Law enforcement
Motor vehicle licenses processed 103 351 109 193 111 689Learner driver licenses processed 25 152 24 141 24 785Driver licenses issued 915 896 1 885Fines issued for traffic offenses 29 212 13 629 13 388R-value of fines collected 9 816 280 8 911 231 7 579 772Operational call-outs No records No records 55Roadblocks held No records No records 26
Complaints attended to by Traffic Officers No records No records Included under operational call-outs
Special Functions – Escorts No records No records 209Awareness initiatives on public safety No records No records 117
Fire Services
Operational call-outs 518 656 603Estimated Fire Losses R 8 646 200 R 40 833 700 R 31 441 600Awareness initiatives on fire safety 440 Scholars Trained 1039 Scholars Trained 658 Scholars Trained
Town Planning and Building Control
Building plans application processed 726 705 973Total surface (m2 ) 71 126 67 955 22 544Approximate value R 317 615 000 R 288 918 000 R 322 648 000
New residential dwellings 79 92 332Residential extensions 325 320 274New Business buildings 10 5 2
Page 135

BREEDE VALLEY MUNICIPALITY ANNUAL REPORT 2010/11
Type of service 2008/09 2009/10 2010/11
Business extensions 91 59 54Rural applications 101 74 71
Land use applications processed No records No records68 (applications
approved)84 (applications
received)Libraries
Library members 30 595 29 241 31 035Books circulated 504 000 513 777 504 647Exhibitions held 80 148 255Internet users - - 23 370New library service points or Wheelie Wagons 1 - 1
Children programmes 34 100 plus 2101 Toy Library participants
166 plus 2272 Toy Library participants
Visits by school groups 7 17 20Book group meetings for adults 5 4 4Primary and Secondary Book Education sessions 6 12 15
Social Services
Trees planted No records 250 550Veggie gardens established No records No records 2Soup kitchens established or supported No records No records 2Initiatives to increase awareness on child abuse No records No records 4Youngsters educated and empowered No records No records 4Initiatives to increase awareness on women No records No records 4Initiatives to increase awareness on Early Childhood Development No records No records 4
Initiatives to increase awareness on substance abuse and high drug and alcohol related crimes No records No records 2
Special events hosted (World’s Aids Day, World Arbour day, World Disability Day, Youth Day, 16 Days of activism against women abuse)
No records No records 2
Local economic development initiatives
Small businesses assisted No records No records 104SMME’s trained No records No records 172Community members trained for tourism No records No records 24Local artisans and crafters assisted No records No records 18Recycling awareness programmes No records No records 1
Table 102: Additional Performance
Page 136

BREEDE VALLEY MUNICIPALITY ANNUAL REPORT 2010/11
4.7 LED
4.7.1 HIGHLIGHTS: LED
The following performance highlights with regard to the implementation of the LED strategy are:
Highlights DescriptionA big project in wine and olive industry is in its final planning phase in the Worcester East Irrigation areas
Core Dept Rural development and Land Reform priorities on infrastructure and rural development projects
New council embrace a Public Partnership which will pave the way for complimentary service delivery activities in The Worcester East Irrigation Scheme
We will resume implementation of Public Private Partnership (PPP) in Worcester CBD
Investment Promotion Investment Promotion completed with the input of the business chambers
Global insight were procured which make economic analysis much more easier Economic analysis can be done internally
Table 103: LED Highlights
4.7.2 CHALLENGES: LED
The following challenges with regard to the implementation of the LED strategy are:
Description Actions to address
No involvement of strategic managers in LED LED outputs must be written in the performance contracts of MM and it Directors
Limited operational budget provision for LED Principle decision to incorporate a tariff to fund economic growth activities
No capacity to undertake LED Political decision to implement the proposed organisational structure for LED
Implement the Public Private Partnership as a point of priority
This project will effect cooperation between the Municipality and the local private sector
Table 104: Challenges LED
4.7.3 LED STRATEGY
The LED strategy, along with the LED process plan, is completed and is being implemented. Breede Valley Municipality has an established a LED forum comprising of diverse membership emanating from various sectors of society. The LED is built around commitment to develop a climate in which economic development and economic growth can prosper.
With reference to our new organisational design the section for LED and Tourism are placed under the cluster Department Planning and Economic Development and are reporting to the Senior
Page 137

BREEDE VALLEY MUNICIPALITY ANNUAL REPORT 2010/11
Manager: Planning and Economic Development. The implementation of project actions relies heavily on the availability of funding to fund our envisaged interventions.
The activities that are performed in the department range from the following:
Facilitating training for new and emerging businesses.
Assistance with project concepts for emerging groups within the Municipality.
Attend to clients who were referred by ward councillor and require general assistance with a business and land reform.
Perform adjudicatory duties in district wide funding allocation forum as per working agreement with the various B municipalities and the District Municipality.
Attend to potential investors which need information and guidance from the Municipality.
Manage partnership between Municipality and Local Tourism organisation based on service level agreements in relation to tourism marketing work.
Serve in project management capacity to steer land reform implementation projects in the municipality and furthermore serve on the District committee where funding for agricultural development and land free form is approved.
Review strategies and lease with potential funders to fund project earmarked to enhance local economic development.
Referral of entrepreneurs for mentorship in their businesses.
Attendance to suppliers of services that wish to partner with the Municipality around our LED and tourism programmers.
Engage in local and regional economic strategic planning and reviews.
In Breede Valley Municipality which has an agricultural based economy, our LED interventions must try to effect transformation by introducing new entrants to established industries with a view to effect empowerment and ownership. In selecting partnerships with the private sector is essential when we target projects in the business value chain aimed at empowerment and ownership.
Page 138

BREEDE VALLEY MUNICIPALITY ANNUAL REPORT 2010/11
The LED strategy identifies various issues and strategic areas for intervention such as:
Strategic areas DescriptionUse tourism to effect BEE and build brand of origin Develop an anchor attraction near Kleinplasie
Promote projects to initiate the growth of a local olive industry
Project aimed at using extra water rights to effect empowerment are in a planning phase in The Worcester East Planning unit. Key departments involved are the Department of Water Affairs and the Department of Rural Development and Land Reform
Assessment of structures and define complementary roles
Have partnerships with wine and tourist organisations working on a proposal to propose a project to the National Department of tourism to rehabilitate and upgrade buildings and infra- structure at Kleinplasie.
Define a coherent marketing strategy for tourism
Service level agreements are with Local Tourism Associations to assist us with marketing. We put in resources to develop our brands and we use all funding to our disposal to exhibit our new BVM BRANDS, through great corporate gifts, publications etc.
BiotechnologyProgramme suspended as we don’t implement projects of a municipality but rather create the environment for business to develop.
Building entrepreneurship A series of training and mentorship are in place to effect entrepreneurial development in our municipal area.
Ascertain the infrastructure backlogs to become an area that attract outside investment
Our Strategic planning framework will exhibit all the constraints as identified by local business
Table 105: LED Strategic areas
The progress with regard to the implementation of the LED strategy can be summarised as follows:
There is little progress as the senior management never used the LED Strategy as a planning - and reference tool to determine budget priorities. It was rather left to the official tasked with LED activities to propose projects to a range of government departments for funding. After the election there was more ownership and leadership to affect LED. We are now in a Strategic planning process driven by the Mayoral committee, the private sector and official in planning and LED to determine long term economic growth objectives.
The LED strategy identifies various issues and strategic areas for intervention such as:
Objectives StrategiesDevelopment of anchor attraction for tourism Apply for conditional grant to upgrade KleinplasieFormulate new long term goals in partnership with private sector and provincial government
A new document that will guide future actions with regards to local economic development
Develop an organisation that can undertake LED interventions.
Recruit professionals to execute LED activities
Table 106: LED Objectives and Strategies
Page 139

BREEDE VALLEY MUNICIPALITY ANNUAL REPORT 2010/11
Page 140

BREEDE VALLEY MUNICIPALITY ANNUAL REPORT 2010/11
4.7.4 ECONOMIC ACTIVITY
The table below identifies the economic activity within the different sectors:Sector 2008/09
Agric, forestry and fishing 18.85Mining and quarrying 0.23Manufacturing 14.21Wholesale and retail trade 18.1Finance, property, etc. 13.65Community and social services 5.68Infrastructure services 1.02Transport and Communication 10.39General Government Services 14.07Construction 3.8Total 100
Table 107: Economic activity by sector
4.7.5 LED INITIATIVES
With a limited budget for LED Projects and one official assisting with LED implementation the following has been initiated as set out in the table below and identifies the detail of the various LED initiatives in the municipal area:
Description of project No of Jobs created
Total Investme
nt
Amount spent to
datePerformance Highlights
An investment promotion programme was initiates whereby company profile and strength were exhibited in electronic journals over a period of 12 months to establish contact with potential trade partners.
Unable to provide figure
as jobs is created in
Private sector
80 000 80 000 New markers were sourced for wine exporters
Participate with the roll-out of SEED funding grants: although funded by CWDM, the LED offices assisted entrepreneurs to access the grants
52 jobs CWDM Funding
From CWDM budget
Partnership emerged as various institutions of the public sector collaborate to support emerging entrepreneurs
All new interventions are subject to the outcome of our strategic planning phase that will commence in October
None. This project is a
detailed strategic planning
400 000(external
payment of facilitator)
PAWC We depend on the ability of the private sector to create jobs
Page 141

BREEDE VALLEY MUNICIPALITY ANNUAL REPORT 2010/11
Description of project No of Jobs created
Total Investme
nt
Amount spent to
datePerformance Highlights
exercise amongst role
players
Table 108: LED initiatives
4.8 TOURISM
4.8.1 AIM AND FUNCTION OF TOURISM SECTION
The Tourism Sector had TV coverage nationally as well as internationally. Fiesta, a KykNet production had a focus on the Breedekloof Wine & Tourism’s Soetes and Soup. Hex River Valley Tourism had an insert on Pasella, a SABC2 production. Pasella also visited Touws River and we had requests for accommodation via their website. Worcester featured on DSTV’s sport channels with the ABSA Cape Epic’s visit during March 2011. Exposure of this calibre can only promise a steady flow of visitors and investors, which can be verified with the monthly statistics held in the Tourism Office. Intensive marketing in Europe is a bare necessity to establish partnerships for the local economic development in tourism for the Breede Valley Municipal Area. The Tourism Sector is growing in strength by building on the strong partnership with the Private Sector.
4.8.2 THE LOCAL TOURISM ORGANISATION (LTO)
The LTO is chaired by the Portfolio Head of LED & Tourism from the Breede Valley Municipality. Seats are for the three accredited Local Tourism Associations (LTA), which comprises of Breedekloof Wine and Tourism, Worcester Tourism Association and Hex River Valley Tourism as well as the officials from the Breede Valley Municipality involved with Planning, Local Economic Development and Tourism.
The Service Level Agreements with a grant of R50 000 for each town is still in place and enable the LTA to better marketing of their town as well as developing the PDI sector.
The LTO’s objectives are:
Co-ordinate events and marketing shows Promoting the Breede Valley as a tourism destination Development of tourism routes i.e. Agri Tourism, Historic Routes, etc. Compiling of packages to target tour operators Create awareness of tourism products and attractions
Page 142

BREEDE VALLEY MUNICIPALITY ANNUAL REPORT 2010/11
Establish an Arts & Crafts Association to develop this dynamic sector in tourism
4.8.3 THE CAPE WINELANDS DISTRICT MUNICIPALITY (CWDM) LTA STRUCTURE
The CWDM invites all LTA’s and LTO’s to be a part of their marketing strategy as we all work together in one goal – promote the District as a Tourism Destination. Each financial year they inform the various organisations of their planned attendance of exposés. Due to this, there are bi-monthly meetings to update on arrangements and feedback on projects. CWDM fund each LTA for a development project. The LTA submits a Business Plan of the development project upon which a SLA is signed by the Municipal Manager. A report on the project must be submitted. During the financial year 2010/2011 we participated in the following meetings:
28 July 2010 in Stellenbosch 29 September 2010 in Wolseley 24 November 2010 in De Doorns 26 January 2011 in Franschhoek 30 March 2011 in Robertson 25 May 2011 in Drakenstein
Marketing 2010/2011
The exposés attended for the said period:
Getaway: September 2010 in Johannesburg Annual Worcester Agricultural Show: 26 – 30 January 2011 Beeld Holiday Makers Show: 11 – 13 February 2011 in Johannesburg ABSA Cape Epic: 30 March – 1 April 2011 in Worcester Tourism Indaba: 7 – 10 May 2011 in Durban Outdoor and Adventure Expo: 10 – 12 June 2011 in Johannesburg
Beeld Holiday Makers Show
Page 143

BREEDE VALLEY MUNICIPALITY ANNUAL REPORT 2010/11
The above exposés were well attended. The branding of Breede Valley Tourism is more familiar to the public each year. There is still room for improvement, but the steady growth in enquiries and follow up requests are satisfying.
Successful marketing is repetitive and visible. The first print of the regional brochure is out of stock. This booklet was very popular at the Beeld Holiday Makers Show, which emphasizes the need for marketing material. Itineraries are being set out to invite various tour operators to the Breede Valley to hook in on the market of tour busses.
Page 144
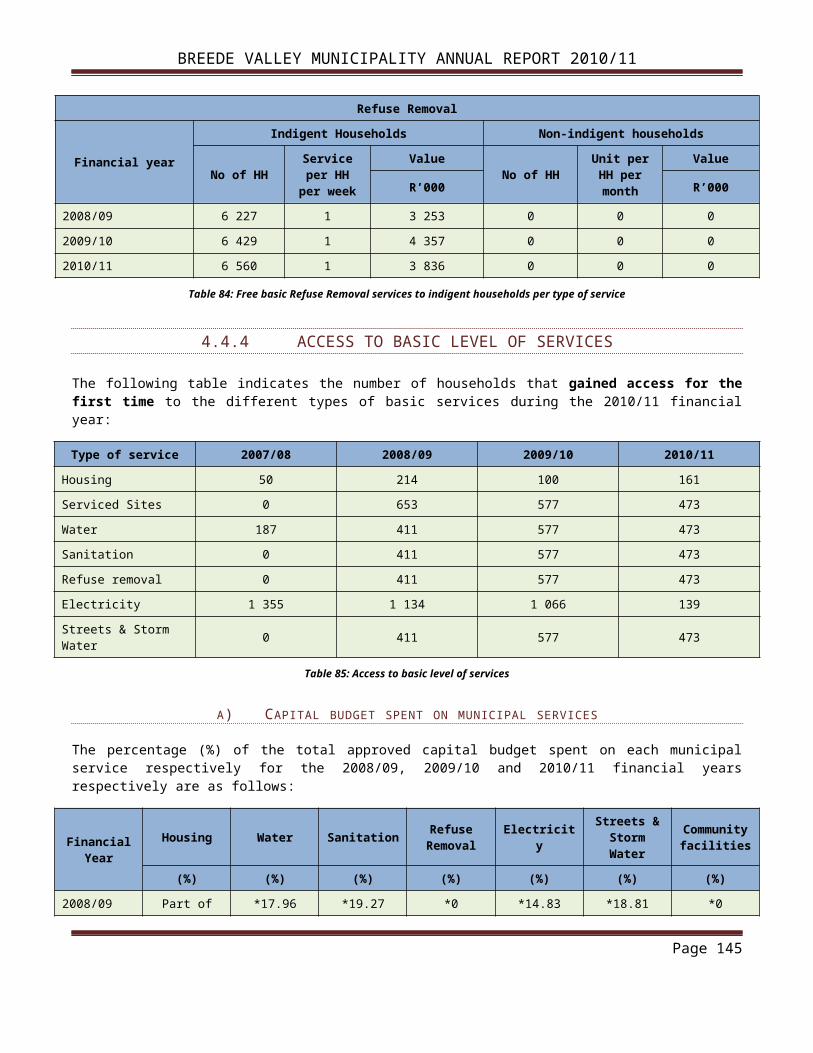
BREEDE VALLEY MUNICIPALITY ANNUAL REPORT 2010/11
4.8.4 TRAINING/DEVELOPMENT
Arts & Crafts are important attractions as visitors / tourists always want memorabilia of the town / region they visited. The Tourism Department works closely with the Cape Craft and Design Institute (CCDI). The following workshops were presented:October 2010’s Business Training focused on:
Business Administration Costing and Pricing Sales Techniques and Negotiations
March 2011’s Creativity Training was for: Visual Awareness Basic Drawing Skills Trends and Colours
The funding from CWDM was used for Corporate Training of a Tourism Student. Shameelah Ismail is from Worcester, but studies in Cape Town. She assisted with organising of events, basic office administration, and telephonic enquiries as well as assisting tourists with information.
4.8.5 TOURISM AWARENESS/EVENTS
Annual events in the Breede Valley Municipal Region:Annual Event Date
Wine, Woman and Song was held in De Doorns, introducing the women to tourism July 2010
Breedekloof Soetes & Soup July 2010Breedekloof Outdoor Festival October 2010International Day for the Disabled at Worcester Museum December 2010
Worcester Agricultural Show at Kleinplasie with Huisgenoot January 2011
A Love Affair Arts & Crafts Market in De Doorns February 2011Harvest of Joy in Scherpenheuvel, Worcester March 2011RAMfest at Nekkies March 2011Nuy Valley Fest by Worcester Wine Route May 2011
Table 109: Tourism Awareness/Events
Numerous smaller events were also hosted and attended.
Breede Valley Tourism links in with Cape Winelands District Municipality in the Tourism Awareness Schools Project.
Page 145

BREEDE VALLEY MUNICIPALITY ANNUAL REPORT 2010/11
4.9 SERVICE PROVIDERS STRATEGIC PERFORMANCE
During the year under review the Municipality did not have a formal system in place to measure the performance of all service providers. The implementation of the performance framework will include measures to measure the performance of service providers. Each manager, however, regularly monitored and ensured that service providers complied with the requirements of the appointed contract. Details regarding service providers appointed will be included in the Municipality’s Annual Report for 2011/2012.
Page 146

BREEDE VALLEY MUNICIPALITY ANNUAL REPORT 2010/11
Page 147
CHAPTER 5
FUNCTIONAL PERFORMANCE

BREEDE VALLEY MUNICIPALITY ANNUAL REPORT 2010/11
Chapter 5: FUNCTIONAL PERFORMANCE
This chapter provides information on the functional performance of the Municipality on the implementation of the Top Layer and Departmental SDBIP for 2010/11.
The municipal functional areas are as indicated below:
Municipal Function Municipal Function:Yes / No
Constitution Schedule 4, Part B functions:Air pollution NoBuilding regulations YesChild care facilities NoElectricity and gas reticulation YesFire fighting services YesLocal tourism YesMunicipal airports YesMunicipal planning YesMunicipal health services NoMunicipal public transport YesMunicipal public works only in respect of the needs of municipalities in the discharge of their responsibilities to administer functions specifically assigned to them under this Constitution or any other law
Yes
Pontoons, ferries, jetties, piers and harbours, excluding the regulation of international and national shipping and matters related thereto No
Storm water management systems in built-up areas yesTrading regulations YesWater and sanitation services limited to potable water supply systems and domestic waste-water and sewage disposal systems Yes
Constitution Schedule 5, Part B functions:Beaches and amusement facilities NoneBillboards and the display of advertisements in public places YesCemeteries, funeral parlours and crematoria YesCleansing YesControl of public nuisances YesControl of undertakings that sell liquor to the public YesFacilities for the accommodation, care and burial of animals NoFencing and fences YesLicensing of dogs YesLicensing and control of undertakings that sell food to the public No
Page 148

BREEDE VALLEY MUNICIPALITY ANNUAL REPORT 2010/11
Municipal Function Municipal Function:Yes / No
Local amenities YesLocal sport facilities YesMarkets YesMunicipal abattoirs NoMunicipal parks and recreation YesMunicipal roads YesNoise pollution YesPounds NoPublic places YesRefuse removal, refuse dumps and solid waste disposal YesStreet trading YesStreet lighting YesTraffic and parking Yes
Table 110: Functional Areas
5.1 PERFORMANCE HIGHLIGHTS PER FUNCTIONAL AREAS
Directorate/ Functional
areaSub Directorate Highlights
Office of the Municipal Manager Area Manager: De
Doorns
The successful relocation of families from the dangerous ‘ Riverbed in Hasie Square’ to the municipal serviced sites, south of the N1The resolve and closure of the ‘Foreign National’s CAMP’ and rehabilitation of the De Doorns –West Sports ground. Foreign nationals were successfully resettled.
Area Manager: Touws River
Creating of approximately 300 temporary employment opportunities for residents of Touws River.Successfully preventing the erection/development of an informal/squatter housing area next to the N1. The allocation of a Mobile Fire station to the Touws River community is viewed as an achievement amidst threat to personal and public property due/by sporadic fires.
Corporate Communication and marketing
Finalisation of the municipal logo and municipal council communication strategy Finalisation of council communication policy
IDPDevelopment and approval of ward based plans for specific wards as models for the 3rd Generation IDPAdoption of the 2010/2011 IDP Review by Council
Internal Audit A new functional Audit Committee was appointed on 28 February 2011, which also functions as a Performance Audit Committee.
Page 149

BREEDE VALLEY MUNICIPALITY ANNUAL REPORT 2010/11
Directorate/ Functional
areaSub Directorate Highlights
The approved Internal Audit Charter was amended by the above Audit Committee on 29 June 2011.The Annual Risk Assessment for 2011/2012 was completed on 24 June 2011.The 2011/2012 Internal Audit Plan was approved on 29 June 2011.The whole Internal Audit Unit was registered on an internal audit learnership (Diploma: Technician: Internal Audit)(NQF6) on 23 March 2011, which is in line with the Continuing Professional Development of internal auditors, as prescribed by the International Standards for the Professional Practice of Internal Auditing of the Institute of Internal Auditors(IIA).
PMS Implementation of the Live Performance Management System in Breede Valley Municipality
Strategic Services Facilitating Ward Committee SummitBulk Services: Commonage
Appointment of security personnel to result in less vandalism along the fence between Zwelethemba and the adjacent farming community.
Planning: GIS
Significant progress was made in GIS in the financial year 2010/11. Most notable of these achievements was the following: Phase B of the GIS Treasury Layer Project was completed. A second (replacement) GIS assistant was appointed to complete Phase
B of the GIS Treasury Layer Project. Four ArcGIS 9.3.1 Single User software packages were upgraded to the
latest version, ArcGIS 10. Worcester has been completed in the zoning verification project. The ArcGIS Server (A system that allows for the publishing of
inter/intranet based maps and info) was migrated from a desktop computer to a virtual server.
The streets database has been updated with the latest information. The street number database has been updated with the latest
information. The farms cadastral database has been updated with the latest
information. The erven cadastral database has been updated with the latest
information. Updated and more detailed street maps for all four towns were produced. A project was initiated in which a complete spatial analysis of all
accounts of all properties was implemented. A partnership between the Department Planning, Development and
Building Control and the Department Civil Works was developed in which all civil works spatial datasets, currently maintained by the IMQS, will be migrated to the ArcGIS format and be maintained in house.
Progress has been made with regards to the partnership formed with the Municipality of Sneek (Located in the Netherlands), the Wetterskip Fryslân (Water Board Located in the Netherlands) and the Breede Overstrand Catchment Agency (BOCMA) in which solutions will be sought using GIS to locate water loss.
Development of an inter-municipal GIS partnership between the BVM and Witzenberg
Civil works: Building Outsourcing of building maintenance activities.
Page 150
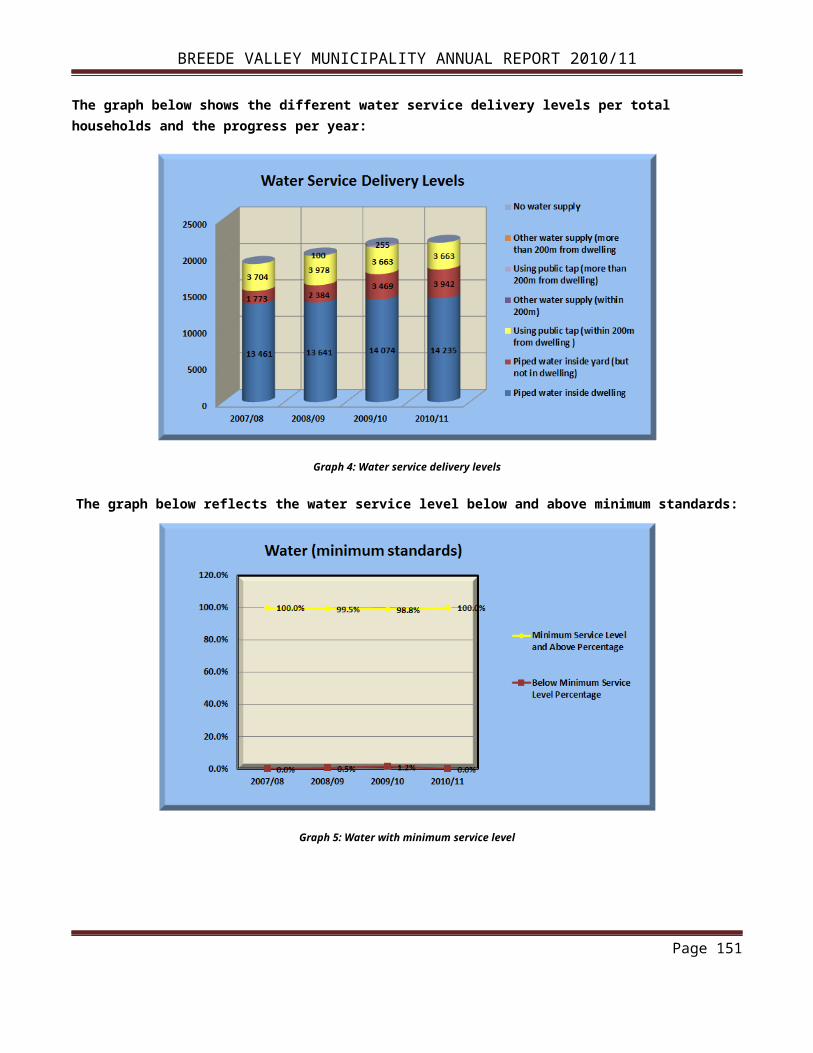
BREEDE VALLEY MUNICIPALITY ANNUAL REPORT 2010/11
Directorate/ Functional
areaSub Directorate Highlights
MaintenanceNew appointments enable more tasks to be carried out internally.Employment and training EPWP personnel resulted in positive outcomes.
Civil works: Cemeteries
Elaborate landscaping and beautification of New Worcester Cemetery.Painting of New Worcester Cemetery facilities.On-going development of burial methods.
Civil works: Environmental Management
Appointment of suitably qualified staff resulted in positive outcomes.Tree planting projects at various locations.Deforestation in Rawsonville area.
Planning: LED
We have cemented our partnership with the local business to such an extent that Council is considering entering into a legally constituted Public Private Partnership to manage certain complementary service delivery activities in the CBD.We earned widespread respect as we have assisted around twelve firms to establish national and international connectivity through subscribing to an online investment promotion newsletter.We have accurate economic and demographic data which get updated every quarter. This will assist us to make important management decisions around interventions to support local economic development.
Electricity
Commencement with WWwTW substation projectCommencement of renovation of municipal flats into new administrative office block.Upgrading switchgear at Protea & Brewelskloof Substations
Civil works: Mechanical Workshop
Problematic Supply Chain issues resolved (procurement processes streamlined)Employment and training EPWP personnel resulted in positive outcomes.
Civil works: Municipal Roads
Appointment of Roads Foreman accelerated general road maintenance.Employing and training EPWP personnel resulted in positive outcomes.Resealing of various municipal and proclaimed roads - approx. 1.2 kms.
Civil works: Recreational Facilities
Upgrading of various sports ground buildings.
Civil works: Refuse removal: Disposal
Appointed new Foreman / 2x Truck Drivers / 1 x Tractor Driver / 2 x General WorkersApprox. 59 Small Contractors utilised for general cleansing operations creating approx. 550 temporary (projects) job opportunities.Additional 20 skip bins acquired and distributed in informal and low cost housing areas. Roll-out of Wheelie Bins continued. Cumulative @ 43 % in Worcester and 100% in Rawsonville.
Bulk services: Refuse removal:
We managed to stem the illegal entry into the site by vagrants. The direct result is that the Department of Environmental Affairs commended us (BVM)
Page 151

BREEDE VALLEY MUNICIPALITY ANNUAL REPORT 2010/11
Directorate/ Functional
areaSub Directorate Highlights
Landfill sites in complying with regulations.Civil works: Refuse removal: Recycling
Basic recycling continues at Touws River Waste Transfer Station (forerunner to bigger facilities).
Bulk services: Resorts and swimming pools
Successfully staging social events which include RAM Fest, Earth Dance and Swallows Biker Rally.
Bulk services: Sewerage purification
BVM managed to improve its Green Drop score from 33% in 2009 to 78,5% in 2011. Funding from Department of Water Affairs and the Netherlands enabled us to up-skill a number of staff members.
Civil works: Sewerage: Network
Reconstruction of manholes in Hex River following DWAF Directive (December 2010)Structured High Pressure cleaning programme in place.
Planning: Town Planning
During September 2010, the Breede Valley Municipality was notified that it has been selected as one of 6 Municipalities within the Western Cape Province to receive support in undertaking a gap analysis of the Spatial Development Framework, Human Settlement Plan and strategic argument of the IDP via the next phase of the Built Environment Support Programme (BESP), a joint initiative from the Department of Environmental Affairs and Development Planning (DEADP) and the Department of Human Settlements (DHS). DEADP and DHS will jointly appoint and manage the consultant, fund the BESP as well as provide funding for the review of the SDF.The predominant amount of urban development applications are for residential purposes, mainly featuring group housing and flats. The demand for housing is still in the foreground with individual subdivisions as well as higher density residential developments taking precedence. The following applications were approved: Altona Residential development (2600 residential units as well as business component), Barclay Farm (183 residential units), Worcester Hills Development (±64 964m² of mixed residential and business development) and the Worcester Island Development (±124.35hectares business development). In the rural areas, non- agricultural development was still mainly tourist orientated with restaurants, conference facilities, guest houses and resorts predominant. Two applications were received for the development of Solar Farms within the BVM near Touws River and Worcester. The establishment of renewable energy technology is supported by the Government’s White Paper of Renewable Energy Policy (2003), and applications are currently in process.
Bulk Services: Water supply
Even though BVM only increased it Blue Drop score from 74% to 85.9%, we were commended by the assessors for the improvement since the previous cycle.
Financial Services
Financial Planning Unqualified audit report for the last 3 years with full GRAP implementation
RevenueIncreased payment rate to 97.05%7 Officials completing CPMD course with WITS University
Valuations Implementation of 6th supplementary rollPublic Fire, Rescue and 131 Dangerous Goods Permits Issued
Page 152

BREEDE VALLEY MUNICIPALITY ANNUAL REPORT 2010/11
Directorate/ Functional
areaSub Directorate Highlights
Safety and Community Development Services
disaster management services: Fire safety & risk management
206 Fire Clearances Issued
417 Fire Regulatory Inspections Conducted / 711 Building Plans Scrutinised
Fire, Rescue and disaster management services: Office of the chief fire officer
100 % Completion of Satellite Fire Station UpgradeDisaster Risk Management Plan and Framework for 2012 IDP Completed
Fire Services Master Plan reviewed and updated
Fire, Rescue and disaster management services: Operations
00:06:43 Average Attendance Times to Incidents36% Average Rider Availability
339 Operational Risk Visits Conducted / 762 Fire Hydrants Tested
Fire, Rescue and disaster management services: Training & Support Services
14 Trench Rescue Technicians Qualified 16 Confined Space Rescue Technicians Qualified
30 seconds Average Call Receipting Time
Library & information services
Sandhills Wheelie Wagon Project (Official opening: November 2010)Goudini Library: Internet Connectivity Project (Officially started December 2010)Esselen Library: Internet Connectivity Project (Officially started January 2011)
Traffic & Law Enforcement Services: Administration
Establish a speed- and red-light offence management systemIntroduce a parking management system for the Worcester CBDUpgrading of security with the installation of CCTV cameras
Traffic & Law Enforcement Services: Law Enforcement
An additional facility was created at the De Doorns Traffic Centre for the collection of traffic fines.Introduce a parking management system for the Worcester CBDAn Anti-Alcohol and Drugs Centre (SHADOW) was established at the Traffic Department in partnership with the Department of Transport and Public Works.
Traffic & Law Enforcement Services: Licensing
The establishment of an administrative back office in Rawsonville for the management of speed violations.The extension of working hours to increase service delivery to the public. The appointment of the first female employee to the rank of Superintendent.
Corporate Services
Corporate SupportImprovement of the electronic records management system (Collaborator) year on year. The acceptance of the Committee Management Module in Collaborator by Executive Management which we hope to implement fully in the 2011 / 2012 financial year.
ICT
Disaster Preparedness and ManagementPart of being prepared for disasters has been the virtualising of the servers in our server room. Three HP servers, on which VMWARE has been installed, form the platform of our virtual system. Windows and Linux servers were set up on VMWARE and the data migrated from the physical servers to the
Page 153

BREEDE VALLEY MUNICIPALITY ANNUAL REPORT 2010/11
Directorate/ Functional
areaSub Directorate Highlights
“virtual” servers.
Housing
Avian Park Housing development took off after long drawn out delays due to not getting suitable tenderersRelocated people from slum area to serviced sitesTender process finalised for development of Zwelethemba phase 2
Table 111: Performance highlights per functional area
Page 154
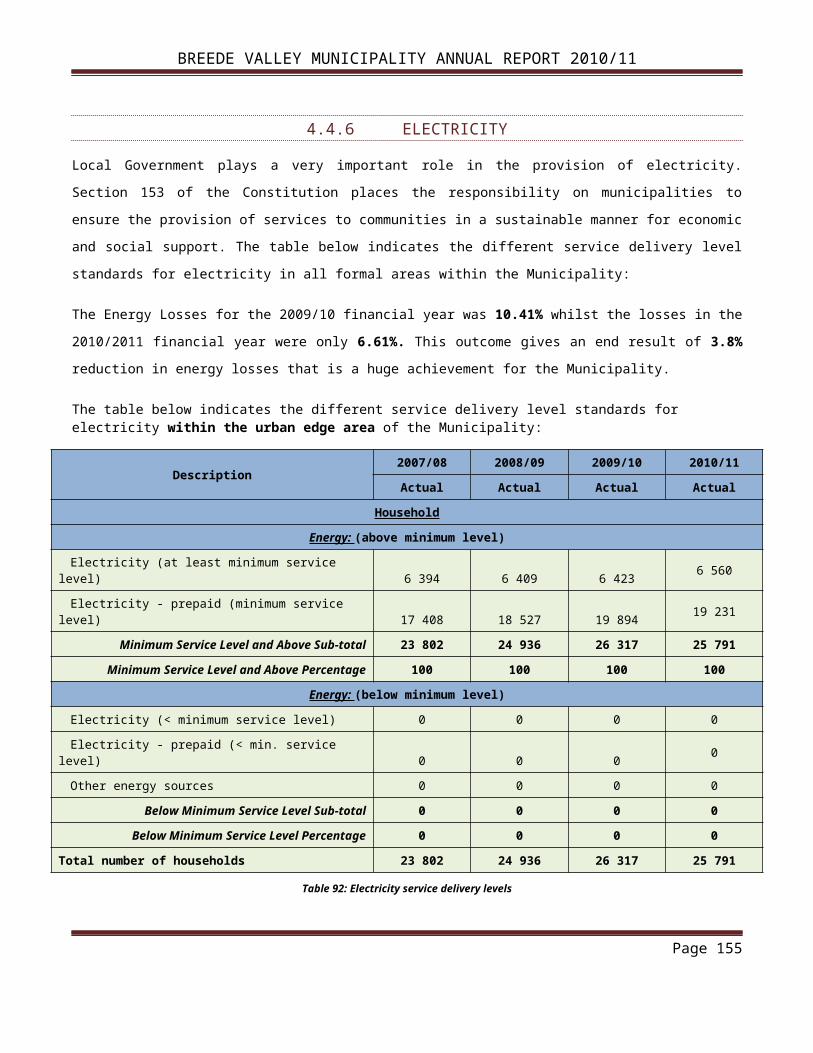
BREEDE VALLEY MUNICIPALITY ANNUAL REPORT 2010/11
5.2 OVERVIEW OF PERFORMANCE
The performance statistics in the table below and all the graphs in the following sub paragraphs include performance in terms of the Departmental SDBIP, which measures operational performance, as well as, the performance in terms of the Top Layer SDBIP. The graph for each directorate is an overview of the overall results of all the KPIs measured in terms of the municipal SDBIP performance management system.
Directorates Financial Year Total KPIs
KPIs Extremely Well Met
KPIs Well Met KPIs Met KPIs
almost MetKPIs not
Met
Office of the Municipal Manager
2009/10 42 n/a n/a 34 0 82010/11 114 5 6 66 18 19
Financial Services2009/10 68 n/a n/a 56 5 72010/11 123 9 16 69 20 9
Operational Services2009/10 104 n/a n/a 79 19 62010/11 197 5 45 115 30 2
Public Safety & Community Development Services
2009/10 41 n/a n/a 35 2 4
2010/11 93 12 16 42 13 10
Corporate Services2009/10 43 n/a n/a 38 5 02010/11 100 7 20 43 17 13
Breede Valley Municipality
2009/10 298 n/a n/a 242 31 252010/11 627 38 103 335 98 53
Table 112: Summary of total performance
Note: The table above does not include KPI’s not measured yet in the Top Layer and Departmental SDBIP and two KPIs were deleted in terms of the applicable protocol. A reason for the deletion was that there were no targets for these specific KPIs.
Page 155
BREEDE VALLEY MUNICIPALITY ANNUAL REPORT 2010/11
The following graph indicates the overall results of all the KPIs measured of the various directorates in terms of the municipal SDBIP performance management system:
Graph 10: Overall performance of directorates
5.3 PERFORMANCE PER FUNCTIONAL AREA (DEPARTMENTAL/OPERATIONAL SDBIP)
5.3.1 OFFICE OF THE MUNICIPAL MANAGER
The Office of the Municipal Manager SDBIP consists of the following divisions:
Municipal Manager
Area Manager: De Doorns
Area Manager: Touws River
Corporate Communication and Marketing
IDP
Internal Audit
Ombudsman
PMS
Strategic Services
Admin & Mayoral Office
Page 156

BREEDE VALLEY MUNICIPALITY ANNUAL REPORT 2010/11
The Operational Key Performance Indicators for Office of the Municipal Manager are aligned to the following National Key Performance Areas, Municipal Key Performance Areas and the IDP Strategic Objectives:
National Key Performance Area
Municipal Key Performance Area
IDP Strategic Objectives
Good Governance and Public Participation
Good Governance and Public Participation
To actively participate in determining the future of our country
Municipal Financial Viability and Management
Municipal Financial Viability and Management Assure financial viability and sustainable growth
Municipal Transformation and Institutional Development
Municipal Transformation and Institutional Development
To ensure a healthy and productive work environment – happy employees supported by a productive accountable leadership team
Basic Service Delivery Basic Service Delivery
To ensure a safe, healthy, clean and sustainable external environment for all Breede Valley’s peopleTo create a unique and caring valley of service excellence, opportunity and growthTo provide an maintain basic services and ensure social upliftment of the Breede Valley community
Local Economic Development
Local Economic Development
To create an enabling environment for employment and poverty and poverty eradication through proactive economic development and tourism
Table 113: Functional alignment – Office of the Municipal Manager
The following graph indicates the performance of the various sub-directorates within Office of the Municipal Manager directorate in terms of the municipal SDBIP
performance management system:
Graph 11: Office of the Municipal Manager, sub-directorate performance
Page 157

BREEDE VALLEY MUNICIPALITY ANNUAL REPORT 2010/11
5.3.2 OPERATIONAL SERVICES
The Operational Services SDBIP consists of the following divisions:
Director: Operational Services
Planning: Building Control
Bulk Services: Commonage
Planning: GIS
Civil works: Building Maintenance
Civil works: Cemeteries
Civil works: Environmental Management
Planning: LED
Electricity
Civil works: Mechanical Workshop
Civil works: Municipal Roads
Project Management: Capital
Civil works: Recreational Facilities
Civil works: Refuse removal: Disposal
Bulk services: Refuse removal: Landfill sites
Civil works: Refuse removal: Public Toilets
Civil works: Refuse removal: Recycling
Bulk services: Resorts and swimming pools
Bulk services: Sewerage purification
Civil works: Sewerage: Network
Civil works: Storm water
Planning: Town Planning
Bulk Services: Water supply
Civil works: Water services: Networks
Page 158

BREEDE VALLEY MUNICIPALITY ANNUAL REPORT 2010/11
The Operational Key Performance Indicators for Operational Services are aligned to the follow National Key Performance Areas, Municipal Key Performance Areas and the IDP Strategic Objectives:
National Key Performance Area
Municipal Key Performance Area
IDP Strategic Objectives
Good Governance and Public Participation
Good Governance and Public Participation
To actively participate in determining the future of our country
Municipal Financial Viability and Management
Municipal Financial Viability and Management Assure financial viability and sustainable growth
Municipal Transformation and Institutional Development
Municipal Transformation and Institutional Development
To ensure a healthy and productive work environment – happy employees supported by a productive accountable leadership team
Basic Service Delivery Basic Service Delivery
To ensure a safe, healthy, clean and sustainable external environment for all Breede Valley’s peopleTo create a unique and caring valley of service excellence, opportunity and growthTo provide and maintain basic services and ensure social upliftment of the Breede Valley community
Local Economic Development
Local Economic Development
To create an enabling environment for employment and poverty and poverty eradication through proactive economic development and tourism
Table 114: Functional alignment – Operational Services
Page 159

BREEDE VALLEY MUNICIPALITY ANNUAL REPORT 2010/11
The following graph indicates the performance of the various sub-directorates within Operational Services directorate in terms of the municipal SDBIP performance
management system:
Graph 12: Operational Services sub-directorate performance
Page 160

BREEDE VALLEY MUNICIPALITY ANNUAL REPORT 2010/11
5.3.3 FINANCIAL SERVICES
The Financial Services SDBIP consists of the following divisions:
Director: Financial Services
Financial Planning
Revenue
SCM: Logistics
SCM: Expenditure
SCM: Procurement
Valuations
The Operational Key Performance Indicators for Financial Services are aligned to the following National Key Performance Areas, Municipal Key Performance Areas and the IDP Strategic Objectives:
National Key Performance Area
Municipal Key Performance Area
IDP Strategic Objectives
Good Governance and Public Participation
Good Governance and Public Participation
To actively participate in determining the future of our country
Municipal Financial Viability and Management
Municipal Financial Viability and Management Assure financial viability and sustainable growth
Municipal Transformation and Institutional Development
Municipal Transformation and Institutional Development
To ensure a healthy and productive work environment – happy employees supported by a productive accountable leadership team
Basic Service Delivery Basic Service Delivery
To ensure a safe, healthy, clean and sustainable external environment for all Breede Valley’s peopleTo create a unique and caring valley of service excellence, opportunity and growthTo provide an maintain basic services and ensure social upliftment of the Breede Valley community
Table 115: Functional alignment – Financial Services
Page 161

BREEDE VALLEY MUNICIPALITY ANNUAL REPORT 2010/11
The following graph indicates the performance of the various sub-directorates within Financial Services directorate in terms of the municipal SDBIP performance
management system:
Graph 13: Financial Services sub-directorate performance
Page 162

BREEDE VALLEY MUNICIPALITY ANNUAL REPORT 2010/11
5.3.4 PUBLIC SAFETY AND COMMUNITY DEVELOPMENT SERVICES
The Public Safety and Community Development Services SDBIP consist of the following divisions:
Director: Public Safety and Community Development Services
Fire, rescue and disaster management services: Fire safety & Risk management
Fire, rescue and disaster management services: Office of the Chief Fire Officer
Fire, rescue and disaster management services: Operations
Fire, rescue and disaster management services: Training & Support Services
Library & information services
Arts and Culture
Traffic & Law enforcement services: Administration
Traffic & Law enforcement services: Law enforcement
Traffic & Law enforcement services: Licensing
The Operational Key Performance Indicators for Public Safety and Community Development Services are aligned to the following National Key Performance Areas, Municipal Key Performance Areas and the IDP Strategic Objectives:
National Key Performance Area
Municipal Key Performance Area
IDP Strategic Objectives
Good Governance and Public Participation
Good Governance and Public Participation
To actively participate in determining the future of our country
Municipal Financial Viability and Management
Municipal Financial Viability and Management Assure financial viability and sustainable growth
Municipal Transformation and Institutional Development
Municipal Transformation and Institutional Development
To ensure a healthy and productive work environment – happy employees supported by a productive accountable leadership team
Basic Service Delivery Basic Service Delivery
To ensure a safe, healthy, clean and sustainable external environment for all Breede Valley’s peopleTo create a unique and caring valley of service excellence, opportunity and growthTo provide an maintain basic services and ensure social upliftment of the Breede Valley community
Local Economic Development
Local Economic Development
To create an enabling environment for employment and poverty and poverty eradication through proactive economic development and tourism
Table 116: Functional alignment – Public Safety and Community Development Services
Page 163

BREEDE VALLEY MUNICIPALITY ANNUAL REPORT 2010/11
The following graph indicates the performance of the various sub-directorates within Public Safety and Community Development Services directorate in terms of the
municipal SDBIP performance management system:
Graph 14: Public Safety and Community Development Services sub-directorate performance
Page 164

BREEDE VALLEY MUNICIPALITY ANNUAL REPORT 2010/11
5.3.5 CORPORATE SERVICES
The Corporate Services SDBIP consists of the following divisions:
Director: Corporate Services
Corporate Support
Human Resources
ICT
Legal Services
Logistic Services
Housing
The Operational Key Performance Indicators for Corporate Services are aligned to the following National Key Performance Areas, Municipal Key Performance Areas and the IDP Strategic Objectives:
National Key Performance Area
Municipal Key Performance Area
IDP Strategic Objectives
Good Governance and Public Participation
Good Governance and Public Participation
To actively participate in determining the future of our country
Municipal Financial Viability and Management
Municipal Financial Viability and Management Assure financial viability and sustainable growth
Municipal Transformation and Institutional Development
Municipal Transformation and Institutional Development
To ensure a healthy and productive work environment – happy employees supported by a productive accountable leadership team
Basic Service Delivery Basic Service Delivery
To ensure a safe, healthy, clean and sustainable external environment for all Breede Valley’s peopleTo create a unique and caring valley of service excellence, opportunity and growthTo provide an maintain basic services and ensure social upliftment of the Breede Valley community
Table 117: Functional alignment – Corporate Services
Page 165

BREEDE VALLEY MUNICIPALITY ANNUAL REPORT 2010/11
The following graph indicates the performance of the various sub-directorates within Corporate Services directorate in terms of the municipal SDBIP performance
management system:
Graph 15: Corporate Services sub-directorate performance
Page 166

BREEDE VALLEY MUNICIPALITY ANNUAL REPORT 2010/11
Page 167
CHAPTER 6
FINANCIAL PERFORMANCE

BREEDE VALLEY MUNICIPALITY ANNUAL REPORT 2010/11
Chapter 6: Financial Performance
6.1 FINANCIAL VIABILITY HIGHLIGHTS
Highlight Description
The Breede Valley Municipality upheld its Credit Rating status for the past 3 years even under the current economic circumstances.
The following information was received from Moody’s Investors Services, an independent company that did our Credit Rating. The A3.za national scale issuer rating of Breede Valley primarily reflects its sound liquidity position, which offsets the fiscal pressure arising from its high debt exposure. The rating also reflects the narrow financial performance and the modest economic base, which is concentratedOn grape farming, with an associated growing manufacturing industry.National Peer Comparison: Breede Valley Municipality is rated in the mid-range of the 17 local municipalities rated by Moody's in South Africa, whose ratings span from A1.za to Baa2.za. Breede Valley's relative position reflects higher-than-average debt and debt service levels, offset by adequate - albeit volatile - operating balances and a stronger liquidity position compared to its national peers
Credit strengthsSound liquidity positionAdequate, albeit narrow, financial resultsGood administration and governance
Table 118: Financial Viability Highlights
6.2 FINANCIAL VIABILITY CHALLENGES
Challenge Action to address
Credit challengesHigh debt exposureFinancing requirements for its large capital expenditure budget
Good stable credit ratingImprovement only possible through broadening of the Tax base via Local Economic Development.Ensure also decrease in debt exposure.
Successful implementation of GRAP Implementation of a proper year end process plan for the 2010/ 2011 financial year
Successful implementation and maintenance of Budget Reforms
Constant planning and maintenance of the budget reforms and processes to comply with new requirements
Completion of Asset register for all assets and proper maintenance of such a register
Constant improvement in the control processes to uphold and improve the asset management process through a proper asset register
Daily bank reconciliations Daily bank reconciliations that result in accurate monthly bank reconciliations are done
Page 168

BREEDE VALLEY MUNICIPALITY ANNUAL REPORT 2010/11
Challenge Action to address
Very good debt collection rate
The Municipality accomplish a very good debt collection rate of 97% - even taking into account the current economic circumstances that impacted negatively on payers’ ability within the BVM region and elsewhere.
Limited tax baseBorrowing to upgrade the bulk services such as the Worcester Waste Water Treatment Plant and corresponding electricity substation. To unblock LED and as a result broaden the Tax base.
Clean Audit reportsTo ensure that the Municipality achieve a clean audit report in according to the requirements in future. To adhere to legislative, governance, internal audit, performance management and GRAP requirements.
Proper Budgetary planning and control Ensure that proper planning, prioritisation and control take place as far as budgets are concerned.
Improve the Supply Chain Management system to respond appropriately to the service delivery needs of the organisation
Review the Supply Chain Management policy and assessment document by Provincial Treasury and implement recommendations and best practices.Implementation of an electronic SCM system.
New valuation role to be implemented 2012A proper plan is already in place to update the valuation roll and is in a very advance stage of completion.
Enhancement of debt recovery strategyReview of the current system and processes will be done and new dimensions will be implemented to enhance the debt recovery rate etc.
Table 119: Financial Viability Challenges
6.3 FINANCIAL SUSTAINABILITY
A) NATIONAL KEY PERFORMANCE INDICATORS - MUNICIPAL FINANCIAL VIABILITY AND MANAGEMENT
The following table indicates the Municipality’s performance in terms of the National Key Performance Indicators required in terms of the Local Government: Municipal Planning and the Performance Management Regulations of 2001 and section 43 of the MSA. These key performance indicators are linked to the National Key Performance Area namely Municipal Financial Viability and Management.
KPA & INDICATOR 2008/09 2009/10 2010/11Debt coverage ((Total operating revenue-operating grants received)/debt service payments due within the year) 6.77 12.02 10.41
Service debtors to revenue – (Total outstanding service debtors/ revenue received for services) *14.38% *11.45% 11.78%
Cost coverage ((Available cash+ investments)/ Monthly fixed operating expenditure) 3.08 2.96 2.71
Table 120: National KPIs for financial viability and management
Page 169

BREEDE VALLEY MUNICIPALITY ANNUAL REPORT 2010/11
*Note: figures in the previous years were amended and will therefore not match the figures in the annual performance report.
6.3.1 OPERATING RESULTS
The table below shows a summary of performance against budgets:
FinancialYear
Revenue Operating expenditureBudget Actual Diff.
%Budget Actual Diff.
%R’000 R’000 R’000 R’000 R’000 R’000
2007/08 330 405 338 332 7 927 102.4 332 025 385 648 53 623 116.22008/09 468 642 462 441 (6 201) 98.7 459 551 433 849 (25 702) 94.42009/10 473 273 468 822 4 451 99 489 103 471 632 17 471 96.432010/11 587 856 565 578 (22 278) 96.21 585 564 564 531 (21 033) 96.41
Table 121: Performance against budgets
The Municipality received R565,578 million revenue for the year of which R564,531 million was utilised for operating expenditure. Salaries, allowances and expenditure with regards to bulk services make up most of the total operating expenditure of the Municipality. Electricity and Grants account for most of the revenue for the year under review.
The following graph indicates the various types of revenue items in the municipal final budget for 2010/11:
Graph 16: Revenue
Page 170
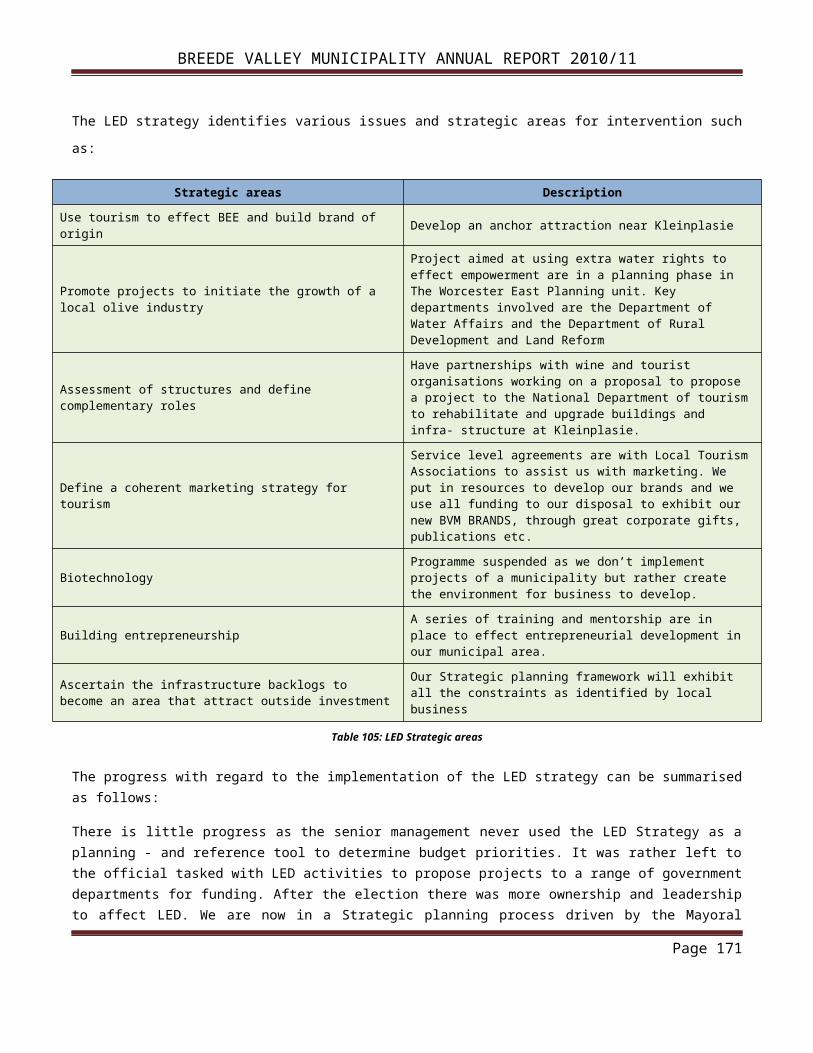
BREEDE VALLEY MUNICIPALITY ANNUAL REPORT 2010/11
The following graph indicates the various types of expenditure items in the municipal budget for 2010/11:
Graph 17: Operating expenditure
6.3.2 OUTSTANDING DEBTORS
A) GROSS OUTSTANDING DEBTORS PER SERVICE
Financial year
Rates
Trading services
Economic services Housing
rentals Other Total(Electricity and Water)
(Sanitation and Refuse)
R’000 R’000 R’000 R’000 R’000 R’0002008/09 12 830 33 712 14 829 3 124 11 625 76 1202009/10 11 123 34 250 12 338 2 988 9 087 69 7862010/11 9 745 40 018 11 424 3 677 8 597 73 461Difference (1 378) 5 768 (914) 689 (490) 3 675% growth year on year 13.27 54.48 15.55 5.01 11.70 100.00
Table 122: Gross outstanding debtors per service
Page 171

BREEDE VALLEY MUNICIPALITY ANNUAL REPORT 2010/11
The following graph indicates the total outstanding debt per type of service for 2010/11:
Graph 18: Debt per type of service
B) TOTAL DEBTORS AGE ANALYSIS
Financial yearLess than 30
daysBetween 30-
60 daysBetween 60-
90 daysMore than 90
days Total
R’000 R’000 R’000 R’000 R’0002008/09 34 152 3 023 1 925 37 020 76 1202009/10 28 622 2 830 1 581 36 754 69 7862010/11 42 178 2 958 1 824 26 501 73 461Difference 13 556 128 243 (10 253) 3 675% growth year on year 47 5 15 (28) 5
Table 123: Service debtor age analysis
Note: Figures exclude provision for bad debt.
Page 172

BREEDE VALLEY MUNICIPALITY ANNUAL REPORT 2010/11
6.3.3 VIABILITY INDICATORS
A) LEVEL OF RELIANCE ON GRANTS AND SUBSIDIES
Financial year
Total grants and subsidies
recognised
Total Operating Revenue Percentage (%)
R’000 R’0002007/08 46 529 *338 332 132008/09 136 847 462 441 302009/10 113 363 *468 822 242010/11 141 283 565 578 25
Table 124: Reliance on grants
*Note: figures in the previous years were amended and will therefore not match the figures in the previous year annual report.
The Municipality is more reliant on grants to finance expenditure than other municipalities with the same nature, due to our limited revenue raising capacity.
The following graph indicates the Municipality’s reliance on grants as percentage for the last three financial years:
Graph 19: Reliance on grants as %
Page 173

BREEDE VALLEY MUNICIPALITY ANNUAL REPORT 2010/11
B) LIQUIDITY RATIO
Financial yearNet current assets Net current liabilities
RatioR’000 R’000
2007/08 175 925 99 089 1.78:12008/09 180 508 83 372 2.17:12009/10 185 278 134 018 1:38:12010/11 195 523 128 579 1:52:1
Table 125: Liquidity ratio
Although the Municipality’s liquidity ratio has declined over the past three financial years, it is still in a favourable position to meet its current liabilities and the ratio is within the national norm of 1.5:1.
6.3.4 AUDITED OUTCOMES
Year 2005/2006 2006/2007 2007/2008 2008/2009 2009/2010 2010/11Status Qualified Qualified Unqualified Unqualified Unqualified Unqualified
Table 126: Audit outcomes
The following table provides the details on the audit outcomes for the previous financial year with the corrective steps implemented:
2010/11Issue raised Corrective step implemented
Emphasis of matter:Significant uncertainties
As disclosed in note 40 to the financial statements, the Municipality is a defendant in one lawsuit, 136 public liability claims and 16 claims for damages. The outcome of these matters cannot presently be determined.
n/a
Contingent assetsAs disclosed in note 40 to the financial statements, the Municipality holds a claim on the reimbursement of legal fees and the recovery of funds from former employees. Furthermore, the Municipality lodged a dispute with the South African Revenue Service on the assessment of the Municipality’s value-added tax (VAT) resulting from the outcome of an audit conducted by SARS on the Municipality’s VAT account.
Dispute raised with SARS regarding VAT assessment and plans to consult with labour unions to start with the recovery of money due by employees
Restatement of corresponding figuresAs disclosed in note 42 to the financial statements, the corresponding figures for 30 June 2010 have been restated as a result of errors discovered during the 2010-11 financial year in the financial statements of the Breede
GRAP training for all individuals who assists with the compilation of AFS
Page 174

BREEDE VALLEY MUNICIPALITY ANNUAL REPORT 2010/11
2010/11Issue raised Corrective step implemented
Valley Municipality at, and for the year ended 30 June 2010.
Emphasis of matter:Material losses
As disclosed in appendix E to the financial statements, the Municipality incurred water losses amounting to R15, 9 million (4 949 987 kilolitre or 32, 65% of the units supplied) during the financial year.
Proper recording of the unmetered water portion. Ensure that the disclosures regarding losses are properly done. The constant implementation of the aspects indicated under the comments of management
Emphasis of matter:Subsequent eventAs disclosed in note 48 to the financial statements the services of the Municipal Manager was terminated during September 2011.
n/a
Emphasis of matter:Additional matters
Material inconsistenciesNo material inconsistencies were identified between the draft annual reports submitted for review and the financial statements. The final printer’s proof of the annual report will be reviewed on receipt thereof any material inconsistencies then identified will be communicated to management. Should the inconsistencies not be corrected, it may result in the matter being included in the audit report.
n/a
Unaudited supplementary schedulesThe supplementary information set out on pages 61 to 87 does not form part of the financial statements and is presented as additional information. I have not audited these schedules and accordingly I do not express an opinion thereon.
None
Table 127: 2010/11 Detail on audit outcomes
6.3.5 EQUITABLE SHARE VS TOTAL REVENUE
Description of revenue
Amount recognised
2007/08
Amount recognised
2008/09
Amount recognised
2009/10
Amount recognised
2010/11 R’000 R’000 R’000 R’000
Equitable share 26 082 34 956 41 482 53 333Capital grants 9 436 91 755 58 752 49 543Operating grants 11 011 10 135 13 130 38 407Own revenue *291 803 325 594 *355 459 424 295
Total revenue *338 332 462 441 *468 822 565 578
Page 175

BREEDE VALLEY MUNICIPALITY ANNUAL REPORT 2010/11
Description of revenue
Amount recognised
2007/08
Amount recognised
2008/09
Amount recognised
2009/10
Amount recognised
2010/11 R’000 R’000 R’000 R’000
Table 128: Equitable share vs. total revenue
*Note: figures in the previous years were amended and will therefore not match the figures in the previous year annual report.
The following graph indicates the various revenue streams of the Municipality for the past three financial years:
Graph 20: Revenue streams
6.3.6 REPAIRS AND MAINTENANCE
Description2007/2008 2008/2009 2009/2010 2010/11
R’000 R’000 R’000 R’000Total Operating Expenditure 385 648 *433 849 471 632 564 531
Repairs and Maintenance *35 519 *34 224 *40 872 *35 896
% of total OPEX *9.21 *8.10 *8.67 *6.36
Table 129: Repairs & maintenance as % of total OPEX
*Note: figures in the previous years were amended and will therefore not match the figures in the previous year annual report.
Page 176

BREEDE VALLEY MUNICIPALITY ANNUAL REPORT 2010/11
Page 177

BREEDE VALLEY MUNICIPALITY ANNUAL REPORT 2010/11
The following graph indicates the percentage of the budget that was spent on repairs & maintenance in relation to the operational budget:
Graph 21: Repairs and maintenance as percentage of OPEX
Page 178

BREEDE VALLEY MUNICIPALITY ANNUAL REPORT 2010/11
6.3.7 CAPITAL FUNDED BY SOURCE
Description Source2008/2009 2009/2010 2010/11
R’000 R’000 R’000External loans 25 333 *36 650 77 981Grants and subsidies 37 663 52 874 51 268Public contributions and donations 0 *224 291
Own funding 17 781 *35 192 *7 994Other 0 0 0
Total capital expenditure 80 777 124 940 137 534
Table 130: Capital funded by source
*Note: figures in the previous years were amended and will therefore not match the figures in the previous year annual report.
The following graph indicates capital expenditure funded by the various sources:
Graph 22: Capital funded by source
Page 179

BREEDE VALLEY MUNICIPALITY ANNUAL REPORT 2010/11
LIST OF ABBREVIATIONS
AG Auditor-General
BVM Breede Valley Municipality
CAPEX Capital Expenditure
CBP Community Based Planning
CFO Chief Financial Officer
DPLG Department of Provincial and Local Government
DWAF Department of Water Affairs and Forestry
EE Employment Equity
GAMAP Generally Accepted Municipal Accounting Practice
GRAP Generally Recognised Accounting Practice
HR Human Resources
IDP Integrated Development Plan
IFRS International Financial Reporting Standards
IMFO Institute for Municipal Finance Officers
KPA Key Performance Area
KPI Key Performance Indicator
LED Local Economic Development
MAYCO Executive Mayoral Committee
MFMA Municipal Finance Management Act (Act No. 56 of 2003)
MMC Member of the Mayoral Committee
MIG Municipal Infrastructure Grant
MM Municipal Manager
MMC Member of Mayoral Committee
MSA Municipal Systems Act No. 32 of 2000
Page 180

BREEDE VALLEY MUNICIPALITY ANNUAL REPORT 2010/11
MTECH Medium Term Expenditure Committee
NGO Non-governmental organisation
NT National Treasury
OPEX Operating expenditure
PMS Performance Management System
PT Provincial Treasury
SALGA South African Local Government Organisation
SAMDI South African Management Development Institute
SCM Supply Chain Management
SDBIP Service Delivery and Budget Implementation Plan
SDF Spatial Development Framework
PPP Public Private Partnership
Page 181

BREEDE VALLEY MUNICIPALITY ANNUAL REPORT 2010/11
ANNEXURE A: FINANCIAL STATEMENTS

BREEDE VALLEY MUNICIPALITY ANNUAL REPORT 2010/11
ANNEXURE B: REPORT OF THE AUDITOR-GENERAL

BREEDE VALLEY MUNICIPALITY ANNUAL REPORT 2010/11
ANNEXURE B: REPORT OF THE AUDITOR-GENERAL
REPORT OF THE AUDITOR-GENERAL TO THE WESTERN CAPE PROVINCIAL PARLIAMENT AND THE COUNCIL ON BREEDE VALLEY MUNICIPALITYREPORT ON THE FINANCIAL STATEMENTSIntroduction 1. I have audited the accompanying financial statements of the Breede Valley Municipality, which
comprise the statement of financial position as at 30 June 2011, and the statement of financial performance, statement of changes in net assets and cash flow statement for the year then ended, and a summary of significant accounting policies and other explanatory information, as set out on pages 6 to 60 of Annexure A.
Accounting officer’s responsibility for the financial statements2. The accounting officer is responsible for the preparation and fair presentation of these financial
statements in accordance with South African Standards of Generally Recognised Accounting Practice (SA Standards of GRAP) and the requirements of the Local Government: Municipal Finance Management Act of South Africa, 2003 (Act No. 56 of 2003) (MFMA) and the Division of Revenue Act of South Africa, 2010 (Act No. 1 of 2010) (DoRA), and for such internal control as management determines necessary to enable the preparation of financial statements that are free from material misstatement, whether due to fraud or error.
Auditor-General’s responsibility 3. As required by section 188 of the Constitution of the Republic of South Africa, 1996 and section 4
of the Public Audit Act of South Africa, 2004 (Act No. 25 of 2004) (PAA), my responsibility is to express an opinion on these financial statements based on my audit.
4. I conducted my audit in accordance with International Standards on Auditing and General Notice 1111 of 2010 issued in Government Gazette 33872 of 15 December 2010. Those standards require that I comply with ethical requirements and plan and perform the audit to obtain reasonable assurance about whether the financial statements are free from material misstatement.
5. An audit involves performing procedures to obtain audit evidence about the amounts and disclosures in the financial statements. The procedures selected depend on the auditor’s judgement, including the assessment of the risks of material misstatement of the financial statements, whether due to fraud or error. In making those risk assessments, the auditor considers internal control relevant to the entity’s preparation and fair presentation of the financial statements in order to design audit procedures that are appropriate in the circumstances, but not for the purpose of expressing an opinion on the effectiveness of the entity’s internal control. An audit also includes evaluating the appropriateness of accounting policies used and the reasonableness of accounting estimates made by management, as well as evaluating the overall presentation of the financial statements.
6. I believe that the audit evidence I have obtained is sufficient and appropriate to provide a basis for my audit opinion.
Page 1

BREEDE VALLEY MUNICIPALITY ANNUAL REPORT 2010/11
Opinion7. In my opinion, the financial statements present fairly, in all material respects, the financial position
of the Breede Valley Municipality as at 30 June 2011, and its financial performance and cash flows for the year then ended in accordance with SA Standards of GRAP and the requirements of the MFMA and DoRA.
Emphasis of matters8. I draw attention to the matters below. My opinion is not modified in respect of these matters:
Significant uncertainties9. As disclosed in note 40 to the financial statements, the municipality is a defendant in one lawsuit,
136 public liability claims and 16 claims for damages. The outcome of these matters cannot presently be determined.
Contingent assets
10. As disclosed in note 40 to the financial statements, the municipality holds a claim on the reimbursement of legal fees and the recovery of funds from former employees. Furthermore, the municipality lodged a dispute with the South African Revenue Service on the assessment of the municipality’s value-added tax (VAT) resulting from the outcome of an audit conducted by SARS on the municipality’s VAT account.
Restatement of corresponding figures11. As disclosed in note 42 to the financial statements, the corresponding figures for 30 June 2010
have been restated as a result of errors discovered during the 2010-11 financial year in the financial statements of the Breede Valley Municipality at, and for the year ended 30 June 2010.
Material losses12. As disclosed in appendix E to the financial statements, the municipality incurred water losses
amounting to R15,9 million (4 949 987 kilolitre or 32,65% of the units supplied) during the financial year.
Subsequent event13. As disclosed in note 48 to the financial statements the services of the municipal manager was
terminated during September 2011.
Additional matter14. I draw attention to the matter below. My opinion is not modified in respect of this matter:
Unaudited supplementary schedules15. The supplementary information set out on pages 61 to 87 of Annexure A does not form part of the
financial statements and is presented as additional information. I have not audited these schedules and accordingly I do not express an opinion thereon.
Page 2

BREEDE VALLEY MUNICIPALITY ANNUAL REPORT 2010/11
REPORT ON OTHER LEGAL AND REGULATORY REQUIREMENTS16. In accordance with the PAA and in terms of General notice 1111 of 2010, issued in Government
Gazette 33872 of 15 December 2010, I include below my findings on the annual performance report as set out on pages 82 to 96 and material non-compliance with laws and regulations applicable to the municipality.
Predetermined objectives 17. There are no material findings on the annual performance report.
Compliance with laws and regulationsStrategic planning and performance management 18. The accounting officer of the municipality did not by 25 January 2011 assess the performance of
the municipality during the first half of the financial year, taking into account the municipality’s service delivery performance during the first half of the financial year and the service delivery targets and performance indicators set in the service delivery and budget implementation plan as required by section 72(1)(a)(ii) of the MFMA.
19. The accounting officer of the municipality did not submit the results of the assessment on the performance of the municipality during the first half of the financial year to the mayor of the municipality and the provincial treasury as required by section 72(1)(b) of the MFMA.
Budgets20. The municipality incurred expenditure in excess of the limits of the amounts provided for in the
votes in the approved budget, in contravention of section 15 of the MFMA.
21. The total unforeseen and unavoidable expenditure incurred for which no provision was made in the approved budget, exceeded R15 million in contravention of regulation 72(c) of the Municipal Budget and Reporting Regulation, 2009.
22. The mayor did not submit three out of the four quarterly reports to council on the implementation of the budget and the financial state of affairs of the municipality within 30 days after the end of each quarter, as required by section 52(d) of the MFMA.
Audit committee 23. The audit committee, which also serves as the performance audit committee, did not function
during the first nine months of the financial year, as required by section 166 of the MFMA and by regulation 14(3)(a) and 14(4)(a) of the Municipal Planning and Performance Management Regulations, 2001, in that it did not advise the council, the accounting officer and/or the management staff of the municipality on matters relating to internal financial control and internal audits, risk management, accounting policies, performance management, effective governance, compliance with applicable legislation and performance evaluation for the first nine months of the year. It also did not respond to the council on any issues raised by the Auditor-General in the audit report, review the quarterly reports of the internal auditors on their audits of the performance measurements of the municipality and review the municipality’s performance management system. The audit committee further did not make recommendations to the council of the municipality and submit a report to the council regarding the performance management system at least twice during
Page 3

BREEDE VALLEY MUNICIPALITY ANNUAL REPORT 2010/11
the financial year.
Internal audit 24. The internal audit unit did not function, as required by section 165(2) of the MFMA, in that internal
audit did not report to the audit committee on matters relating to internal audit, internal controls, accounting procedures and practices, risk and risk management and loss control during the first nine months of the financial year.
25. Internal audit did not, during the first nine months of the financial year, report to the audit committee on matters relating to compliance with the MFMA, the DoRA and other applicable legislation, as required by section 165(2)(b) of the MFMA.
26. The internal audit processes and procedures did not include assessments of the functionality of the municipality’s performance management system and whether the system complied with the requirements of the Municipal Systems Act, 2000 (Act No. 32 of 2000) as required by regulation 14(1)(b)(i) and 14(1)(b)(ii) of the Local Government: Municipal Planning and Performance Management Regulations, 2001, General Notice R. 796, issued in Government Gazette 22605 of 24 August 2001.
27. The internal audit processes and procedures did not include assessments of the extent to which the municipality’s performance measurements were reliable in measuring the performance of the municipality on key as well as general performance indicators as required by regulation 14(1)(b)(iii) of the Municipal Planning and Performance Management Regulations, 2001.
28. The internal auditors of the municipality did not audit the performance measurements on a continuous basis and did not submit quarterly reports on their audits to the municipal manager and the performance audit committee as required by the Municipal Planning and Performance Management Regulations, 2001.
Procurement and contract management 29. Awards were made to providers who are persons in service of other state institutions or whose
directors/ principal shareholders are persons in service of other state institutions in contravention of the requirements of the Municipal Supply Chain Management (SCM) Regulations (GNR. 868 of 30 May 2005), regulations 44. Furthermore, the providers failed to declare that they were in the service of the state, as required by SCM regulation 13(c).
Expenditure management 30. The accounting officer did not take reasonable steps to prevent irregular expenditure, as required
by section 62(1)(d) of the MFMA.
Page 4

BREEDE VALLEY MUNICIPALITY ANNUAL REPORT 2010/11
INTERNAL CONTROL31. In accordance with the PAA and in terms of General notice 1111 of 2010, issued in Government
Gazette 33872 of 15 December 2010, I considered internal control relevant to my audit, but not for the purpose of expressing an opinion on the effectiveness of internal control. The matters reported below are limited to the significant deficiencies that resulted in the findings on the annual performance report and the findings on compliance with laws and regulations included in this report.
Leadership32. The accounting officer did not implement adequate processes to complete and submit the mid-year
assessment of the performance of the municipality within the deadline required by section 72(1) of the MFMA, nor did council exercise oversight responsibility regarding performance reporting and compliance to ensure that it was done.
33. The Speaker did not ensure that council meetings were held within the 30 day deadline to enable the Mayor to submit all quarterly reports, as stipulated in section 52(d) of the MFMA, nor did the mayor monitor and enforce the requirement. Leadership, therefore, did not exercise oversight responsibility regarding financial and performance reporting and compliance.
34. The accounting officer and his delegated officials did not exercise adequate oversight responsibility over compliance with laws and regulations to prevent irregular expenditure.
Financial and performance management35. The municipality did not implement controls over daily and monthly processing and reconciling of
transactions to prevent unauthorised expenditure. Furthermore, management did not sufficiently monitor that transactions were incurred within the limits of the approved appropriation per vote even though monthly budget statements were produced in terms of section 71 of the MFMA.
Governance36. The audit committee did not promote accountability and service delivery through evaluating and
monitoring responses to risks and providing oversight over the effectiveness of the internal control environment including financial and performance reporting and compliance with laws and regulations, since the audit committee which was in place for the first nine months of the year did not adequately deliver on its mandate.
37. The leadership of the municipality did not ensure that there was an adequately resourced and functioning internal audit unit that identified internal control deficiencies and recommends corrective action effectively. The internal audit was not given direction by the audit committee during the first nine months of the year and, therefore, could not audit and report in terms of the internal audit plans. Although the internal audit had included the auditing of predetermined objectives in its audit plan for 2010-11, this work could not be completed before the end of the financial year due to capacity constraints and the non-availability of quarterly performance reports.
Page 5

BREEDE VALLEY MUNICIPALITY ANNUAL REPORT 2010/11
OTHER REPORTSInvestigations38. One criminal investigation into the alleged irregular and unlawful conduct relating to the theft of
monies in the previous financial year was in progress at year-end. As per note 47 to the financial statements another such criminal investigation commenced after year- end.
39. Irregular expenditure was incurred for the past three years in relation to a contract entered into with a supplier. An investigation was conducted into this matter and the applicable official dismissed. The appeal of the official’s dismissal was still in progress at year-end.
Cape Town
30 November 2011
Page 6

ANNEXURE C: REPORT OF THE PERFORMANCE AUDIT COMMITTEE

BREEDE VALLEY MUNICIPALITY ANNUAL REPORT 2010/11
ANNEXURE C: REPORT OF THE PERFORMANCE AUDIT COMMITTEE
REPORT OF THE AUDIT COMMITTEE
The Audit Committee reports in terms of its responsibilities arising from section 166 of the MFMA.
The members of the Audit Committee for the 2011/2012 financial year consist of the following individuals:
Mr. B.J. Lodewyk (Chairperson)
Dr. B.P. Jansen van Rensburg
Ms. N. Salie
Mr. A.P. Croutz
Evaluation of Annual Financial Statements for the 2010/2011 financial year
The Audit Committee has
Reviewed and discussed with the Accounting Officer the Audited Annual Financial Statements to be included in the Annual Report;
Reviewed the Auditor-General’s management letter and responses from management; Reviewed significant adjustments resulting from the audit.
The Audit Committee concurs and accepts the conclusion of the Auditor-General on the Audited Annual Financial Statements and is of the opinion that the Audited Annual Financial Statements, read together with the Report of the Auditor-General, be accepted.
Chairperson of the Audit Committee
Date: 11 January 2012
Page 1

ANNEXURE D: OVERSIGHT REPORT ON ANNUAL REPORT

BREEDE VALLEY MUNICIPALITY ANNUAL REPORT 2010/11
ANNEXURE D: OVERSIGHT REPORT ON ANNUAL REPORT
Page 1


![Bcom Project[1]](https://static.documents.pub/doc/80x56/577ce70c1a28abf103943b23/bcom-project1.jpg)


