112
(A free translation of the original in Portuguese) Listed Company CNPJ: 89.850.341/0001-60 NIRE: 23300021118-CE Management Report 2016

(A free translation of the original in Portuguese)
Listed Company
CNPJ: 89.850.341/0001-60
NIRE: 23300021118-CE
Management Report 2016

2 Management Report 2016
BOARD OF DIRECTORS
Alexandre Grendene Bartelle
Chairman of the Board of Directors
Pedro Grendene Bartelle Vice-Chairman of the Board of Directors
Members of the Board of Directors
Maílson Ferreira da Nóbrega Oswaldo de Assis Filho
Renato Ochman Walter Janssen Neto
-----------------------------------------------------------------------------------
STATUTORY AUDIT BOARD
João Carlos Sfreddo
Chair of the Audit Board
Members of the Audit Board Eduardo Cozza Magrisso Herculano Aníbal Alves
-----------------------------------------------------------------------------------
EXECUTIVE BOARD
Rudimar Dall’ Onder Chief Executive Officer
Gelson Luis Rostirolla
Deputy Chief Executive Officer
Francisco Olinto Velo Schmitt Chief Finance Officer and Investor Relations Officer
-----------------------------------------------------------------------------------
Luiz Carlos Schneider
Accountant – CRC/CE – SEC – 70.520/O-5

3 Management Report 2016
MANAGEMENT REPORT 2016
Dear Stockholders:
In accordance with the provisions of law and the by-laws, the management of Grendene S.A. presents to you,
below, the Report of Management and the Consolidated Financial Statements prepared in accordance with
International Financial Reporting Standards (IFRS) issued by the International Accounting Standards Board
(IASB) and also based on accounting practices adopted in Brazil and the rules of the Brazilian Securities
Commission (CVM). The Company has adopted all the rules, revisions of rules and interpretations issued by IASB
which are in effect for financial statements at December 31, 2016.

4 Management Report 2016
CONTENTS
I. Message from Management 05
II. Main consolidated indicators (IFRS) 08
III. Market and macroeconomic conditions 09
IV. Economic and financial performance 10
1. Gross sales revenue 10
2. Net sales revenue 12
3. Cost of goods sold 12
4. Gross profit 13
5. Operational expenses (SG&A) 14
1. Selling expenses 14
1. Advertising expenses 14
2. General and administrative expenses (G&A) 15
6. EBIT and EBITDA 15
1. EBIT 15
2. EBITDA 16
7. Net financial revenue (expenses) 17
8. Net profit for the year 18
9. Cash generation 18
10. Net cash 18
11. Capital expenditure (Capex) 19
12. Independent auditors – CVM Instruction 381/03 20
1. Statement of justification in relation to independent auditors 20
V. Capital markets and corporate governance 21
1. Capital markets 21
2. Dividends 23
1. Dividend policy 23
2. Dividends and Interest on Equity declared 23
3. Corporate governance best practices 26
1. Commitment clause 26
2. Statement by the Executive board 26
3. Awards and recognition 27
VI. Social and environmental responsibility 29
VII. Human resources 31
VIII. Statement of value added 32
IX. Final considerations and outlook 33
X. Opinion of the Audit board Appendix I
XI. Individual and consolidated financial statements Appendix II

5 Management Report 2016
I. Message from management
Grendene reports net profit for 2016 of R$ 634 million, representing a return of 25.2% on the company’s Stockholder’s equity at the beginning of the year. Of this profit, the company has proposed a distribution of dividends and Interest on Equity totalling R$ 351.4 million, reinvesting the rest in the Company. The book value of our share thus increased in the year from R$ 8.70 to R$ 9.72. In the period since its IPO in 2004, the Company has re-invested R$ 2.2 billion which has been absorbed into its Stockholder’s equity, and increased its annual profit by R$ 400 million. In this period the Company has paid a total of dividends and Interest on Equity (including the amounts proposed for the 2016 business year) of R$ 2.4 billion.
The results have been good, but the difficulties have increased significantly, especially as from 2013 with the continuous fall in consumption of footwear in Brazil. In 2016, our fears were confirmed. It was a year of continuous economic deterioration, and great political instability. To this somber scenario in the domestic market was added an international situation that was a source of concern, with economic slowdown in numerous markets, and economies increasingly having recourse to protectionist measures, which have the effect of reducing levels of international trade.
However, it is part of our culture to face the facts head-on, and confront the challenges. We have built a good result, increasing profits, expanding margins, maintaining the return on our investments, and paying increasing dividends to stockholders. We have done this without omitting to invest in our brands, and invest in renewal of our product portfolios, while also strengthening our relationship with the channels of distribution: in other words, without omitting to strengthen our position for the future.
As a preliminary note: the results for 2015 that are the basis for our comparison this year contained adjustments. In that year, as widely reported, we made a provision for loss of the total of our investments in the furniture sector, with an accounting effect of R$ 52 million. This loss had no effect on cash flow in the year, nor in the future, and is non-recurrent.
For maximum clarity, this table shows the adjustments made in 2015:
Account lines
Consolidated result
(formal accounting) Adjustments Adjusted result
2015 % of net revenue 2015 % of net revenue
Gross profit 1,067,883 48.5% (1,887) 1,065,996 48.4%
Operational expenses (667,151) (30.3%) 55,864 (611,287) (27.8%)
EBIT 400,732 18.2% 53,977 454,709 20.7%
Net profit 551,223 25.0% 51,809 603,032 27.4%
Depreciation and amortization 53,652 2.4% (1,397) 52,255 2.4%
EBITDA 454,384 20.6% 52,580 506,964 23.0%
Our net profit in 2016 gave us a net margin of 31%, and was 5.2% higher than the adjusted net profit for 2015 (also, 15.1% higher than the unadjusted accounting profit for 2015); our 2016 adjusted net margin was 3.6 percentage points (pp) higher than in 2015 (and 6.0 pp higher than the margin based on the unadjusted accounting).
Operational cash flow in 2016 was R$ 566.5 million; and the dividends proposed represent a payout (sum of dividends and Interest on Equity, divided by accounting profit) of 53.1%, and dividend yield of 6.3%. We achieved these results in spite of falls in volume of pairs sold of 8.1% in the domestic market, and 13.0% in exports – partly compensated by a 4.1% increase in unit prices – resulting in net revenue 7.1% lower year-on-year.
On a longer view, our management has been generating value for stockholders, providing a significant return on equity, as this table shows (all amounts for profit in the table are the original accounting, with no adjustment):

6 Management Report 2016
R$ ‘000
Year
Initial Stockholders’
equity1
Net profit Dividendos Reinvestiment Return on Equity Final
Stockholders’ equity
1
2004 692,726 204,865 64,152 140,713 29.6% 733,566
2005 733,566 200,116 81,181 118,935 27.3% 847,373
2006 847,373 257,343 128,261 129,082 30.4% 998,510
2007 998,510 260,508 119,724 140,784 26.1% 1,132,718
2008 1,132,718 239,367 109,000 130,367 21.1% 1,274,080
2009 1,274,080 272,211 110,000 162,211 21.4% 1,430,569
2010 1,430,569 312,399 121,738 190,661 21.8% 1,624,542
2011 1,624,542 305,446 219,526 85,920 18.8% 1,713,743
2012 1,713,743 429,003 293,503 135,500 25.0% 1,848,309
2013 1,848,309 433,540 300,057 133,483 23.5% 1,957,295
2014 1,957,295 490,244 220,814 269,430 25.0% 2,232,649
2015 2,232,649 551,223 275,925 275,298 24.7% 2,520,866
2016 2,520,866 634,492 351,383 283,109 25.2% 2,792,976
Accumulated 4,590,757 2,395,264 2,195,493 1,241.5%
1) End-of-year stockholders’ equity, i.e. excluding dividends, etc. proposed for subsequent year.
In this 12-year period the book value per share grew from R$ 2.44 to R$ 9.72, with a compound average growth rate (CAGR) of 12.2% p.a.
Grendene’s share price was R$ 10.33 at the beginning of the period, and R$ 17.58 at the end of the period (adjusted for number of shares). With this variation and taking into account reinvestment of dividends paid, the share, GRND3, presented an average annual total return to stockholders of 10.8% p.a., less than the gain that would be indicated by the formal accounting results, but even so, more than the average total return for the Bovespa index (also based on reinvestment of the dividends), of 7.2% p.a.
In terms of brand building, we made progress with the Clube Melissa project, exceeding the initial estimate, made in 2012, of 200 stores by 2017: at the end of the year Clube Melissa had 241 franchised stores, an increase of 33 in a year of strong retraction in retailing. Also, we strengthened our traditional brands - Rider, Cartago, Ipanema, Zaxy, Grendha and Grendene Kids – with enumerable actions in marketing and communication.
Important progress was also made in our strategy of differentiation of products by design and innovation. Melissa continues its strategy based on three pillars: fashion, art and design – and also partnerships with renowned design names such as Karl Lagerfeld, Zaha Hadid, Gaetano Pesce and J. Maskrey. We launched products in partnership with designers including Salinas, Jeremy Scott, Vitorino Campos, Cartel 011, Fábula CSC, Cambridge Satchel Co, and Jason Wu.
Ipanema sandals are celebrating their 15th birthday, and to tell a little bit of this story, Casa Ipanema presented a
sensory, collaborative telling of the story Ipanema – 15 Anos de Bossa, remembering highlights and milestones from the brand’s history. This year it launched partnerships with leading names including Clau Cicala, Animale, Dress to and Cia Marítima. The Ipanema brand was present at Sao Paulo Fashion Week through its partnership with the brands A. Brand and Lenny Niemeyer.
The Rider brand celebrated its 30th birthday by bringing back its most important iconic product, the first vamp of
1986, with design identical to the original, and important technical alterations – with three special editions signed by Sneakersbr.
These efforts, among others, have ensured that the brands grow in the Grendene’s principal markets, and also as a percentage of Grendene’s total business, with recognition by awards in the market.
In our assessment, once again we have set the country’s economic crisis aside and achieved results that have been possible only due to the discipline and application of our management team – which has, on average, more than 20 years’ experience with the Company, with very low management-level turnover, and has provided continuous improvement in our processes – and also due to the great commitment of our 20,000 employees.
In our 46 years of existence we have won a significant leadership position in the footwear sector, and we continue to believe in the strengthening of our brands, our growth in the domestic and international markets, with confidence for the future and in our potential. The continuous and persistent gain in market share that we have

7 Management Report 2016
achieved, with robust return on equity for stockholders, provides an indication of this leadership, and of the competitive advantages that we have built.
From our calculations and assessment, we believe we achieved a small gain in market share by volume in some of our target markets, and we also improved net margin, as we had determined that we would. For the coming years, we aim to sustain this level of margins, consolidating the trend established and if possible improve it. The quality of our products, the strength of our brands and recognition by retailers and final clients, and our operational efficiency, serve as the basis for this expectation.
To achieve this regularity of results, we highlight our skill in building strong brands that have a privileged relationship with clients, and developing solid relationships with the distribution channels through a long-term process with cumulative effects. In the last 12 years, among many other efforts, we have invested approximately R$ 1.6 billion in advertising, as a means of consolidating construction of value, and in coming years we will seek this approximation with Grendene’s final clients with even greater vigor. We believe that understanding of our client’s needs is a fundamental factor for the success of our business model.
All these actions are coherent with our Values, which highlight precisely the aspects for which we have received reiterated public recognition: profitability, competitiveness, innovation, agility, ethics.
Importantly, in these 46 years we have not lacked the decisive support and trust of suppliers, clients, partners, stockholders and, especially, thousands of employees dedicated and committed to our Business Vision and Values.
To all of these, we extend our sincere thanks, and with them we share our success.
The management

8 Management Report 2016
II. Main consolidated indicators (IFRS)
R$ mn 2011 2012 2013 20141 2015
1 2016
Change 16/15
CAGR2
16/11
Gross revenue from sales 1,831.6 2,324.5 2,711.4 2,719.4 2,630.0 2,483.0 (5.6%) 6.3%
Domestic market 1,489.9 1,845.4 2,146.9 2,077.7 1,899.2 1,870.3 (1.5%) 4.7%
Exports 341.7 479.1 564.5 641.7 730.8 612.7 (16.2%) 12.4%
Net revenue 1,481.1 1,882.3 2,187.3 2,232.4 2,201.1 2,045.1 (7.1%) 6.7%
Cost of goods sold (840.5) (1,000.2) (1,193.6) (1,206.8) (1,135.1) (1,048.6) (7.6%) 4.5%
Gross profit 640.6 882.1 993.7 1,025.6 1,066.0 996.5 (6.5%) 9.2%
Operational expenses (453.3) (519.3) (594.5) (625.7) (611.3) (596.9) (2.3%) 5.7%
EBIT 187.3 362.8 399.2 399.9 454.7 399.6 (12.1%) 16.4%
EBITDA 216.2 394.5 435.9 447.3 507.0 457.5 (9.8%) 16.2%
Net financial revenue (Exp.) 153.0 132.5 103.6 135.1 184.3 268.5 45.7% 11.9%
Net Profit 305.4 429.0 433.5 493.7 603.0 634.5 5.2% 15.7%
R$ 2011 2012 2013 2014 2015 2016 Change
16/15 CAGR
2
16/11
Average price 12.20 12.56 12.54 13.27 14.58 15.18 4.1% 4.5%
Domestic market 13.85 13.21 12.96 13.60 14.12 15.13 7.2% 1.8%
Exports 8.04 10.56 11.17 12.29 15.91 15.33 (3.6%) 13.8%
Exports (US$) 4.80 5.40 5.18 5.22 4.78 4.39 (8.2%) (1.8%)
R$ 2011 2012 2013 2014 2015 2016 Change
16/15 CAGR
2
16/11
Basic profit per share 1.0157 1.4266 1.4421 1.6328 1.8342 2.1101 15.0% 15.7%
Diluted profit per share 1.0123 1.4195 1.4367 1.6293 1.8305 2.1058 15.0% 15.8%
Dividend per share 0.7300 0.9760 0.9985 0.7351 0.9177 1.1686 27.3% 9.9%
Million of pairs 2011 2012 2013 2014 2015 2016 Change
16/15 CAGR
2
16/11
Volumes 150.1 185.0 216.2 204.9 180.4 163.6 (9.3%) 1.7%
Domestic market 107.6 139.7 165.7 152.7 134.5 123.6 (8.1%) 2.8%
Exports 42.5 45.3 50.5 52.2 45.9 40.0 (13.0%) (1.2%)
Margin, % 2011 2012 2013 20141 2015
1 2016
Change p.p.
3 16/15
Change p.p.
3 16/11
Gross 43.3% 46.9% 45.4% 45.9% 48.4% 48.7% 0.3 p.p. 5.4 p.p.
EBIT 12.6% 19.3% 18.3% 17.9% 20.7% 19.5% (1.2 p.p.) 6.9 p.p.
EBITDA 14.6% 21.0% 19.9% 20.0% 23.0% 22.4% (0.6 p.p.) 7.8 p.p.
Net 20.6% 22.8% 19.8% 22.1% 27.4% 31.0% 3.6 p.p. 10.4 p.p.
R$ 2011 2012 2013 2014 2015 2016 Change
16/15 CAGR
2
16/11
US dollar at the end of the year 1.8758 2.0435 2.3426 2.6562 3.9048 3.2591 (16.5%) 11.7%
US dollar – average 1.6750 1.9546 2.1576 2.3536 3.3315 3.4901 4.8% 15.8%
Note:
1) Adjusted numbers, excluding the non-recurring effect – A3NP.
2) CAGR: Compound annual growth rate.
3) p.p.: percentage points.

9 Management Report 2016
III. Market and macroeconomic conditions
The economic context developed in 2016 not much differently from 2015: very adversely. The bill for the fiscal misadjustments finally arrived and had to be paid: consumption was strongly hit by unemployment, fall in personal income, and even delays in payment of local government workers in some states. With interest rates continuing to be high, high unemployment – some 13 million Brazilians without jobs – will continue to have a negative effect on consumption in 2017. The high leverage of Brazilian individuals, families and companies – with record applications by companies for judicial recovery, and default by individuals – indicate only a slow, timid recovery in 2017.
In 2016 we faced our third consecutive year of decline in the consumption and output of footwear: a return to the levels of 2011. Even so, in 2016 we delivered a slightly higher volume of pairs than in 2011 (164 million pairs in 2016, vs. 150 million pairs in 2011), but – in an indication of how much we have progressed in efficiency of our operations – we made more than double the profit (R$ 634mn this year, vs. R$ 305mn in 2011).
Unemployment has affected propensity to consume since 2015; we expect it now to stabilize in the first half of 2017, and the beginnings of a reaction in the second half of the year. We can, indeed, report that early 2017 is already better than early 2016, in terms of demand in the market – attenuating our expectations for this year.
We have no doubt that 2017 will once again be a difficult year. In our assessment it will be some time before we see an effect on consumption from: reduction of interest rates and inflation; reduction of individuals’ and companies’ indebtedness; and the government’s continuing fiscal adjustment. We believe, indeed, that the path of the public debt continues to be a fundamental uncertainty – as also does the reform of the social security system. In our view, any hesitation on these subjects could abort the timid recovery in the economy expected for this year.
On the international scene, we highlight an escalation of protectionism, which we believe might be exacerbated by the positioning of the new US government.
We believe that Brazil has probably now passed the worst economic moment of what has been, for it, a devastating crisis, and companies like Grendene, which knew how to strengthen themselves during this period, are preparing to reap the results of a healthier economy: if these results do not appear this year, they will appear next year. This is our expectation, and we are confident.
Brazilian Footwear – Production and apparent consumption
Brasil (millions of pairs) 2011 2012 2013 2014 2015 2016 Change,
16/15
CAGR
16/11
Production 838 997 1.036 998 944 868* (8.1%) 0.7%
Imports 34 36 39 37 33 23 (30.9%) (7.5%)
Exports 113 113 123 130 124 126 1.5% 2.2%
Apparent consumption 759 920 952 905 853 765* (10.3%) 0.2%
Consumption per capita (pairs) 3.8 4.6 4.7 4.5 4.2 3.7* (11.9%) (0.5%)
Source: IBGE / Secex / Abicalçados / (*) Estimated by Grendene.
Some figures are re-presented to include effects of some updating / revision in the date sources used.
Grendene
Million of pairs 2011 2012 2013 2014 2015 2016 Change,
16/15
CAGR
16/11
Volumes 150.1 185.0 216.2 204.9 180.4 163.6 (9.3%) 1.7%
Share volume – Production 17.9% 18.6% 20.9% 20.5% 19.1% 18.8% (0.3 p.p.) (0.9 p.p.)
Domestic market 107.6 139.7 165.7 152.7 134.5 123.6 (8.1%) 2.8%
Share volume – Domestic market 14.2% 15.2% 17.4% 16.9% 15.8% 16.2% 0.4 p.p. 2.0 p.p.
Exports 42.5 45.3 50.5 52.2 45.9 40.0 (13.0%) (1.2%)
Share volume – exports 37.6% 40.0% 41.1% 40.3% 37.0% 31.7% (5.3 p.p.) (5.9 p.p.)
Source: Grendene S.A.

10 Management Report 2016
IV. Economic and financial performance
1. Gross sales revenue
The 5.7% reduction in gross revenue from 2015 to 2016 brings the CAGR down to 5.8% p.a. in 2008–16 – from 7.6% in 2008–15. This is below the lower limit of our guidance forecast rate of between 8% and 12%.
These tables show the last 6 years:
R$ mn 2011 2012 2013 2014 2015 2016 Change
16/15
CAGR
16/11
Consolidated gross revenue 1,831.6 2,324.5 2,711.4 2,720.3 2,631.8 2,483.0 (5.7%) 6.3%
Domestic market 1,489.9 1,845.4 2,146.9 2,077.7 1,899.8 1,870.3 (1.6%) 4.7%
Exports 341.7 479.1 564.5 642.6 732.0 612.7 (16.3%) 12.4%
Exports, US$ 204.0 245.1 261.6 272.6 219.3 175.5 (20.0%) (3.0%)
Million of pairs 2011 2012 2013 2014 2015 2016 Change
16/15
CAGR
16/11
Volumes 150.1 185.0 216.2 204.9 180.4 163.6 (9.3%) 1.7%
Domestic market 107.6 139.7 165.7 152.7 134.5 123.6 (8.1%) 2.8%
Exports 42.5 45.3 50.5 52.2 45.9 40.0 (13.0%) (1.2%)
R$ 2011 2012 2013 2014 2015 2016 Change
16/15
CAGR
16/11
Average price 12.20 12.56 12.54 13.27 14.58 15.18 4.1% 4.5%
Domestic market 13.85 13.21 12.96 13.60 14.12 15.13 7.2% 1.8%
Exports 8.04 10.56 11.17 12.29 15.91 15.33 (3.6%) 13.8%
Exports, US$ 4.80 5.40 5.18 5.22 4.78 4.39 (8.2%) (1.8%)
1,490 1,845 2,147 2,078 1,900 1,870
342
479 565 643 732 613 1,832
2,325 2,711 2,720 2,632 2,483
2011 2012 2013 2014 2015 2016
R$
mil
lio
n
Gross sales revenue
Domestic market Exports
81% 79% 79% 76% 72% 75%
19% 21% 21% 24% 28% 25%
2011 2012 2013 2014 2015 2016
%
Domestic sales and exports as % of gross sales revenue
Domestic market Exports

11 Management Report 2016
According to figures from the Foreign Trade Ministry, the Central Bank Foreign Trade Service (Secex), and the Brazilian Footwear Manufacturers’ Association (Abicalçados), Brazilian footwear export volume (number of pairs) in 2016 was up 1.2% from 2015, export revenues in dollars were 3.9%, and average price in US$ were 2.7% higher.
Our share in total Brazilian footwear exports in 2016 was 31.8% by volume, and 17.6% by value in US$. By volume, we maintained the leadership in Brazilian footwear exports, for the 14
th year running.
107 140
166 153 134 124
43
45 51 52
46 40
150
185 216 205
180 164
2011 2012 2013 2014 2015 2016
Mil
lio
n o
f p
air
s
Volume of pairs sold
Domestic market Exports
72% 76% 77% 75% 75% 76%
28% 24% 23% 25% 25% 24%
2011 2012 2013 2014 2015 2016
%
Domestic and exports sales as % of total number of pairs sold
Domestic market Exports
13.85 13.21 12.96 13.60 14.12 15.13
8.04
10.56 11.17 12.29
15.91 15.33
12.20 12.56 12.54 13.27 14.58 15.18
2011 2012 2013 2014 2015 2016
R$
Average price
Domestic market Exports Total

12 Management Report 2016
2. Net sales revenue
R$ mn 2011 2012 2013 2014 2015 2016 Change
16/15
CAGR
16/11
Gross sales revenue 1,831.6 2,324.5 2,711.4 2,720.3 2,631.8 2,483.0 (5.7%) 6.3%
Domestic market 1,489.9 1,845.4 2,146.9 2,077.7 1,899.8 1,870.3 (1.6%) 4.7%
Exports 341.7 479.1 564.5 642.6 732.0 612.7 (16.3%) 12.4%
Deduction from sales (350.5) (442.2) (524.1) (487.0) (429.0) (437.9) 2.1% 4.6%
Returns and taxes on sales (255.3) (328.6) (393.3) (383.0) (336.4) (346.7) 3.1% 6.3%
Discounts given to clients (95.2) (113.6) (130.8) (104.0) (92.6) (91.2) (1.6%) (0.9%)
Net sales revenue 1,481.1 1,882.3 2,187.3 2,233.3 2,202.8 2,045.1 (7.2%) 6.7%
3. Cost of goods sold
In the last five years, with all the FX volatility, increases in the minimum wage, and inflationary pressures, in Brazil our unit cost grew at the rate of 2.7% p.a., much lower than the inflation rates in the period. An element of this was the benefit of the ‘de-burdening of payroll’ put in place by the federal government starting in 2011, partially reversed in December 2015. Over the whole of this period (as a whole), total COGS grew by less than the growth in net revenue (which grew 6.7% p.a.)
Cost discipline has played a fundamental role in our results.
R$ mn 2011 2012 2013 2014 2015 2016 Change
16/15
CAGR
16/11
Cost of goods sold 840.5 1,000.2 1,193.6 1,207.4 1,134.9 1,048.6 (7.6%) 4.5%
R$ per pair 2011 2012 2013 2014 2015 2016 Change
16/15
CAGR
16/11
Cost of goods sold per pair 5.60 5.40 5.52 5.89 6.29 6.41 1.9% 2.7%
1,481
1,882
2,187 2,233 2,203 2,045
2011 2012 2013 2014 2015 2016
R$
mil
lio
n
Net sales revenue
841
1,000
1,194 1,207 1,135
1,049
2011 2012 2013 2014 2015 2016
R$
mil
lio
n
COGS

13 Management Report 2016
4. Gross Profit
In spite of the reduction in 2016, our gross profit has expanded at the rate of 9.2% p.a. over the last five years.
R$ mn 2011 2012 2013 2014 2015 2016 Change
16/15
CAGR
16/11
Gross profit (Formal accounting) 640.6 882.1 993.7 1,025.9 1,067.9 996.5 (6.7%) 9.2%
Gross margin, % 43.3% 46.9% 45.4% 45.9% 48.5% 48.7% 0.2 p.p. 5.4 p.p.
(*) I.E. excluding the non-recurring effect of A3NP.
5.60 5.40 5.52 5.89
6.29 6.41
2011 2012 2013 2014 2015 2016
R$
COGS per pair
641 882
994 1,026 1,066 997
43.3% 46.9% 45.4% 45.9% 48.4% 48.7%
2011 2012 2013 2014* 2015* 2016
Gro
ss
ma
rgin
R
$ m
illi
on
Adjusted gross profit Adjusted gross margin, %

14 Management Report 2016
5. Operational expenses (SG&A)
5.1. Selling expenses Grendene’s selling expenses are predominantly in the variables freight, licensings, commissions, advertising and marketing, and over the period remained at approximately 24% of net revenue.
R$ mn 2011 2012 2013 2014 2015 2016 Change
16/15
CAGR
16/11
Selling expenses 394.5 451.0 521.2 543.7 523.7 490.6 (6.3%) 4.5%
% of net sales revenue 26.6% 24.0% 23.8% 24.3% 23.8% 24.0% 0.2 p.p. (2.6 p.p.)
(*) I.E. excluding the non-recurring effect of A3NP.
5.1.1 Advertising expenses The expense on advertising was lower than in 2015, at 6.0% of net revenue – a lower percentage than we normally invest. On the other hand, we carried out other strategic brand positioning activities and projects which, although they are not classified in the accounting as advertising expenses, are considered in our internal analysis to be marketing efforts. These activities are, principally, events held in the Melissa Galerias in São Paulo, New York and London, and regional events which, in 2016, accounted for total expenditure of R$ 9.7 mn (R$ 6.7mn in 2015). This type of expenditure was made in previous years, but not in significant amounts.
If we add these expenses (all classified as selling expenses in 2015 and 2016) to advertising expenses, the percentage of net revenue increases from 6.8% to 7.1% and 6.0% to 6.5% respectively, which we believe better represents our brand building efforts.
R$ mn 2011 2012 2013 2014 2015 2016 Change
16/15
CAGR
16/11
Advertising expenses 138.7 147.0 163.7 169.2 148.9 122.8 (17.5%) (2.4%)
% of net sales revenue 9.4% 7.8% 7.5% 7.6% 6.8% 6.0% (0.8 p.p.) (3.4 p.p.)
Strategic brand projects - - - - 6.7 9.7 44.3% -
Total 138.7 147.0 163.7 169.2 155.6 132.5 (14.8%) (0.9%)
% of net sales revenue 9.4% 7.8% 7.5% 7.6% 7.1% 6.5% (0.6 p.p) (2.9 p.p.)
395 451 521 538 518 491
26.6% 24.0% 23.8% 24.1% 23.5% 24.0%
2011 2012 2013 2014* 2015* 2016
% o
f ne
t sa
les
reve
nu
e
R$
mil
lio
n
Selling expenses % of net sales revenue
139 147 164 169 156 133
9.4% 7.8% 7.5% 7.6% 7.1%
6.5%
2011 2012 2013 2014 2015 2016
% o
f ne
t sa
les
reve
nu
e
R$ m
illi
on
Advertising expense + Strategic projects % of net sales revenue

15 Management Report 2016
5.2. General and administrative expenses (G&A)
General and administrative expenses were 4.1% lower in 2016 than 2015, and as a percentage of net revenue were 4.8% – higher than the ratio we had aimed for.
However, adjustment to exclude the effects of A3NP in consolidated results – equal to R$ 13.1mn in 2015 – gives adjusted 2015 G&A of R$ 88.6mn, or 4.0% of 2015 net revenue, i.e. in reality these expenses were 10.1% higher in 2016 than in 2015.
R$ mn 2011 2012 2013 2014 2015 2016 Change
16/15
CAGR
16/11
G&A expenses 61.2 70.4 79.0 91.3 101.7 97.5 (4.1%) 9.8%
% of net sales revenue 4.1% 3.7% 3.6% 4.1% 4.6% 4.8% 0.2p.p. 0.7 p.p.
(*) I.E. excluding the non-recurring effect of A3NP.
6. Ebit e Ebitda
6.1. Ebit
EBIT – earnings before interests and taxes. We believe that because we have a high cash position which generates significant financial revenues, the operational profit of our activity is best characterized by Ebit.
Reconciliation: Accounting Ebit / Ebitda * / R$ mn
2011 2012 2013 2014 2015 2016 Change
16/15
CAGR
16/11
Net profit for the year 305.4 429.0 433.5 490.2 551.2 634.5 15.1% 15.7%
Non-controlling stockholders - 0.9 - (5.0) (11.9) (0.5) (95.5%) (354.8%)
Taxes on profit 34.9 65.4 68.8 39.7 43.8 34.1 (22.0%) (0.4%)
Net financial revenue (expenses) (153.0) (132.5) (103.6) (135.5) (182.4) (268.5) 47.3% 11.9%
Ebit 187.3 362.8 399.2 389.4 400.7 399.6 (0.3%) 16.4%
Depreciation and amortization 28.9 31.7 36.7 47.5 53.7 57.9 7.9% 14.9%
Ebitda 216.2 394.5 435.9 436.9 454.4 457.5 0.7% 16.2%
Ebit margin 12.6% 19.3% 18.3% 17.4% 18.2% 19.5% 1.3 p.p. 6.9 p.p.
Ebitda margin 14.6% 21.0% 19.9% 19.6% 20.6% 22.4% 1.8 p.p. 7.8 p.p.
* Figures for accounting Ebit and Ebitda are stated as per CVM instruction 527 of October 4, 2012.
61 70 79 86 89 98
4.1% 3.7% 3.6% 3.9% 4.0%
4.8%
2011 2012 2013 2014* 2015* 2016
% o
f ne
t sa
les
reve
nu
e
R$
mil
lio
n
G&A expenses % of net sales revenue

16 Management Report 2016
Reconciliation of Ebit / Ebitda
R$ million 2015 2016 Change 16/15
Net profit for the year – Recurrent 603.0 634.5 5.2%
Non-recurring effect (51.8) 0.0 -
Net profit for the year – Accounting 551.2 634.5 15.1%
Non-controlling stockholders (11.9) (0.5) (95.8%)
Taxes on profit 43.8 34.1 (22.1%)
Net financial revenue (expenses) (182.4) (268.5) 47.2%
Ebit – Accounting 400.7 399.6 (0.3%)
Non-recurring item 54.0 8.8 (83.7%)
Ebit – Recurrent 454.7 408.4 (10.2%)
Depreciation and amortization 53.7 57.9 7.8%
Ebitda – Accounting 454.4 457.5 0.7%
Ebitda – Recurrent 507.0 466.3 (8.0%)
Ebit margin – Accounting 18.2% 19.5% 1.3 p.p.
Ebit margin – Recurrent 20.7% 20.0% (0.7 p.p.)
Ebitda margin – Accounting 20.6% 22.4% 1.8 p.p.
Ebitda margin – Recurrent 23.0% 22.8% ( 0.2 p.p.)
(*) I.E. excluding the non-recurring effect of A3NP.
6.2. Ebitda
Our business is low capital-intensive. Depreciation is around 2.5% of net revenue (2.1% in 2014, 2.4% in 2015 and 2.8% in 2016). Grendene regularly invests an amount equivalent to depreciation in any period, to keep its production capacity up to date. It also maintains positive net cash, and has no financial costs that need to be paid with funds from operations. As a result we believe that Ebit is the best indicator for operational analysis by the Company’s management.
187
363 399 400 455 408
12.6%
19.3% 18.3% 17.9%
20.7% 20.0%
2011 2012 2013 2014* 2015* 2016
EB
IT m
arg
in
R$ m
illi
on
Adjusted Ebit Adjusted Ebit margin
454.4 507.0 52.6
Ebitda, 2015
Non-recurring effect
Adjusted Ebitda, 2015
R$ m
illi
on
457.5 466.3 8.8
Ebitda, 2016
Non-recurring effect
Adjusted Ebitda, 2016
R$ m
illi
on

17 Management Report 2016
(*) I.E. excluding the non-recurring effect of A3NP.
7. Net financial revenue (expenses)
Grendene has a solid cash position, and financial revenues are an important part of its net profit. The aim of its foreign exchange transactions is hedging, mainly of receivables from exports. In these transactions Grendene is vendor of dollars, and the aim is that their net result in the long term should be very close to zero. Thus the result of Financial revenue (expenses) is basically influenced by the interest rate (Selic), and the average level of cash held by the Company.
For 2016 Grendene reports Net financial revenues, of R$ 268.5 mn, which is 47.3% more than in 2015, as follows:
R$ mn 2011 2012 2013 2014 2015 2016 Change
16/15
CAGR
16/11
Interest received from clients 2.9 1.9 1.9 1.9 2.9 2.2 (24.2%) (5.4%)
Revenue from cash investments 128.8 93.7 81.9 100.1 168.2 207.7 23.5% 10.0%
Other financial revenues 2.6 3.5 2.2 5.2 4.1 3.3 (20.1%) 5.0%
Subtotal 134.3 99.1 86.0 107.2 175.2 213.2 21.7% 9.7%
Costs of financings (15.0) (9.2) (19.6) (21.8) (20.5) (18.3) (10.3%) 4.0%
Cofins and PIS taxes on Financial revenues - - - - (5.0) (11.0) 119.6% 0.0%
Other financial expenses (4.3) (4.2) (5.2) (5.6) (9.6) (4.9) (48.8%) 2.8%
Subtotal (19.3) (13.4) (24.8) (27.4) (35.1) (34.2) (2.3%) 12.1%
Net financial revenues (expenses) (1) 115.0 85.7 61.2 79.8 140.1 179.0 27.7% 9.3%
Revenue from FX derivatives – BM&FBovespa 3.9 14.8 18.2 16.6 66.3 49.1 (26.0%) 65.6%
Foreign exchange gains 35.5 49.7 40.2 41.9 118.8 69.7 (41.3%) 14.5%
Subtotal 39.4 64.5 58.4 58.5 185.1 118.8 (35.8%) 24.7%
Op. expenses on FX derivatives – BM&FBovespa (5.3) (11.3) (26.2) (24.0) (123.6) (11.6) (90.6%) 16.8%
Expenses of FX variation (38.2) (47.7) (28.5) (33.5) (80.3) (82.4) 2.5% 16.7%
Subtotal (43.5) (59.0) (54.7) (57.5) (203.9) (94.0) (53.9%) 16.7%
Net gain (loss) on FX variations (2) (4.1) 5.5 3.7 1.0 (18.8) 24.8 (232.0%) (243.6%)
Adjustments to present value (APV) 42.1 41.3 38.7 54.7 61.0 64.7 6.1% 9.0%
Financial result – APV (3) 42.1 41.3 38.7 54.7 61.0 64.7 6.1% 9.0%
Net financial revenues (expenses) (1) + (2) + (3) 153.0 132.5 103.6 135.5 182.3 268.5 47.3% 11.9%
In the consolidated financial statements discounts given to clients are classified as deductions from sales.
216
395 436 447 507 466
14.6%
21.0% 19.9% 20.0%
23.0% 22.8%
2011 2012 2013 2014* 2015* 2016
EB
ITD
A m
arg
in
R$
mil
lio
n
Adjusted Ebitda Adjusted Ebitda margin

18 Management Report 2016
8. Net profit for the year
In the last five years adjusted net profit (there was adjustment only in 2014 and 2015 – and none in the other years) grew at CAGR of 15.7% p.a., with increases in all margins: gross margin, operational margin, and net margin.
Net margin in 2016 was 6.0 p.p. better than in 2015 (unadjusted), and 3.6 p.p. better than in 2015 (adjusted).
R$ mn 2011 2012 2013 2014 2015 2016 Change
16/15
CAGR
16/11
Net profit for the year, formal accounting 305.4 429.0 433.5 490.2 551.2 634.5 15.1% 15.7%
Net margin 20.6% 22.8% 19.8% 22.0% 25.0% 31.0% 6.0 p.p. 10.4 p.p.
(*) I.E. excluding the non-recurring effect of A3NP.
9. Cash generation
Net cash generated by operational activities, of R$ 566.6 mn, was used as follows: investments in fixed and intangible assets R$ 71.5 mn; payment of loans R$ 73.9 mn; financial investments R$ 103.3 mn; payment of dividends totalling R$ 313.7 mn; net loss acquiring shares for stock options R$ 4.6 mn; increase in interest in a subsidiary R$ 0.1 mn, resulting in the amount held in current account for very short-term financial investment being R$ 0.6 mn lower. The complete cash flow can be seen in the financial statements.
We generated R$ 2.1 billion, in total, from our operational activities in the last six years, confirming our excellent operational performance.
10. Net cash
The chart below shows the distribution of the cash position (cash, cash equivalents and short and long-term financial investments), loans and financings (short-term and long-term) and net cash:
305 429 434 494
603 634
20,6% 22,8%
19,8% 22,1%
27,4% 31,0%
2011 2012 2013 2014* 2015* 2016
Ne
t ma
rgin
R$
mil
lio
n
Adjusted net profit Net margin

19 Management Report 2016
11. Capex (in fixed and intangible assets)
In 2016, our main investments were in: maintenance of industrial buildings and facilities; replacement of fixed assets; and acquisition of new equipment for modernization of plant and greater efficiency of production.
We are estimating that we will invest between R$ 100 and R$ 110 mn in 2017.
R$ mn 2011 2012 2013 2014 2015 2016 Change
16/15
CAGR
16/11
Capex 39.4 63.6 154.0 119.1 73.2 71.5 (2.4%) 12.7%
916 874 734
996 1,282
1,589
(111) (138) (118) (171) (213) (125)
805 736 616 825
1,069
1,464
(400)
0
400
800
1200
1600
2000
2011 2012 2013 2014 2015 2016
R$
mil
lio
n
Cash and cash equivalents plus cash investments (ST and LT)
Loans and Financings (ST and LT)
Net cash
39
64
154
119
73 71
2011 2012 2013 2014 2015 2016
R$ m
illi
on
Capex

20 Management Report 2016
12. Independent auditors – CVM Instruction 381/03
To comply with CVM Instruction 381/2003, Grendene S.A. reports that it used the independent auditing services of PricewaterhouseCoopers – Auditores Independentes (PWC), for a special review of its quarterly information and financial statements for the business year ended December 31, 2016, for which its fees totaled R$ 444,800. In the period of that business year PricewaterhouseCoopers Contadores Públicos Ltda was, also, contracted to carry out other services relating to Bloco K and e-Social, in the amount of R$ 193,100, corresponding to 43.4% of the total of the external auditing services.
The Company’s policy in contracting any services not related to external auditing with the independent auditor is based on the principles that preserve the auditors’ independence, namely: (a) the auditor must not audit its own work; (b) the auditor must not exercise management functions in its client; and (c) the auditor must not promote the interests of its client.
The services provided by PWC related to Assurance carried out in accordance with the Brazilian Accounting Rules NBC PA 291 (R1): Independence – Other Assurance Work (Independência – Outros Trabalhos de Asseguração), as approved by Federal Accounting Council Resolution 1311/10 of December 9, 2010. They do not include the services that might compromise independence as described in that Rule.
12.1. Statement of justification in relation to independent auditors – PWC
The provision of other professional services not related to external auditing, described above, does not affect the independence nor the objectivity of the carrying out of the external auditing examinations made to Grendene S.A. and its subsidiaries. The policy of working with Grendene in the provision of services not related to external auditing is based on the principles that preserve the independence of the External Auditor, and all these principles were obeyed in the provision of the said services.

21 Management Report 2016
V. Capital markets and corporate governance
1. Capital markets
In 2016 a total of 70.8 million common shares were traded (0.86 times the total number of shares in the free float), in 336,500 trades, with total financial volume of R$ 1.2 billion. Daily averages were: 284,000 shares (0.34% of the free float); financial volume, R$ 4.9 mn; and number of trades, 1,351.
Over the 12 months of 2016, Grendene’s share (GRND3) provided investors with a gain of 10.5%, including reinvestment of dividends. The stock price varied over a range between a minimum at R$ 14.60, on January 21, 2016, and a maximum at R$ 20.41 on October 28, 2016. The Ibovespa index was 38.9% higher at the end of 2016 than at the close of December, 2016. Dividend yield, calculated on the basis of the weighted average price of the share in 2016, was 6.3% p.a. (vs. 5.2% p.a. in 2015).
This table gives number of trades, number of shares traded, financial volume, and daily average trading:
Year No. of trading
sessions
No. of trades
Number of shares
Volume R$
Price R$ Average no. of shares Average financial
volume R$
Weighted average
Close Per trade Per day Per trade Per day
2011 249 60,621 34,540,900 296,444,307 8.58 7.69 570 138,718 4,890 1,190,539
2012 246 134,570 66,297,600 772,896,090 11.66 16.49 493 269,502 5,743 3,141,854
2013 248 395,765 106,569,600 2,146,610,763 20.14 18.09 269 429,716 5,424 8,655,689
2014 248 352,905 93,691,900 1,422,422,174 15.18 15.30 265 377,790 4,031 5,735,573
2015 246 331,468 78,686,700 1,317,558,400 16.74 16.84 237 319,865 3,975 5,355,928
2016 249 336,512 70,808,700 1,214,895,573 17.16 17.58 210 284,372 3,610 4,879,099
In the period January through April 2017 Grendene will be a component of the following BM&FBovespa indices: IBRA, ICON, IDIV, IGCT, IGCX, IGNM, INDX, ITAG and SMLL.
This chart shows performance of Grendene ON shares compared to the Bovespa index (Base: Dec. 31, 2008 = 100), and daily trading volume.
On December 31, 2016 Brazilian institutional investors held 7.0% of the share capital of Grendene S.A. (25.6% of the free float); foreign investors held 16.3% (59.3% of the free float); small investors including individuals held 4.2% (15.1% of the free float); and the other 72.5% of the share capital was in the possession of the controlling stockholders and managers.
0
100
200
300
400
500
600
700
800
-
5
10
15
20
25
30
35
40
45
50
12/31/08 12/31/09 12/31/10 12/31/11 12/31/12 12/31/13 12/31/14 12/31/15 12/31/16
Ba
sis
10
0 =
De
c. 3
1, 2
00
8
Vo
lum
e -
R$
mil
lio
n
GRND3: Comparison with Ibovespa index and daily trading volume
Daily trading volume, R$ GRND3, with reinvest. of dividends Ibovespa index

22 Management Report 2016
74.9% 74.9% 74.2% 73.6% 72.5% 72.5%
12.6% 11.2% 9.0% 7.7% 8.6% 7.0%
9.5% 10.0% 12.9% 15.2% 15.6% 16.3%
3.0% 3.9% 3.9% 3.5% 3.3% 4.2%
2011 2012 2013 2014 2015 2016
% o
f to
tal o
wn
ers
hip
Profile of stockholders
Controlling stockholders and managers Brazilian institutional investors
Non-Brazilian investors Others
23 Management Report 2016
2. Dividends
2.1 Dividend policy
For 2017, we will maintain our policy, established on February 13, 2014, published in a Material Announcement on that date, of distributing, as dividends, after constitution of the Legal reserve and the Reserve under the by-laws, the totality of such profits as do not originate from tax incentive arrangements with individual Brazilian states. We remind you that these dividends may be paid in the form of Interest on Equity, as allowed by the legislation.
Additionally, we will maintain our policy of quarterly distribution of dividends.
2.2 Dividends and Interest on Equity declared
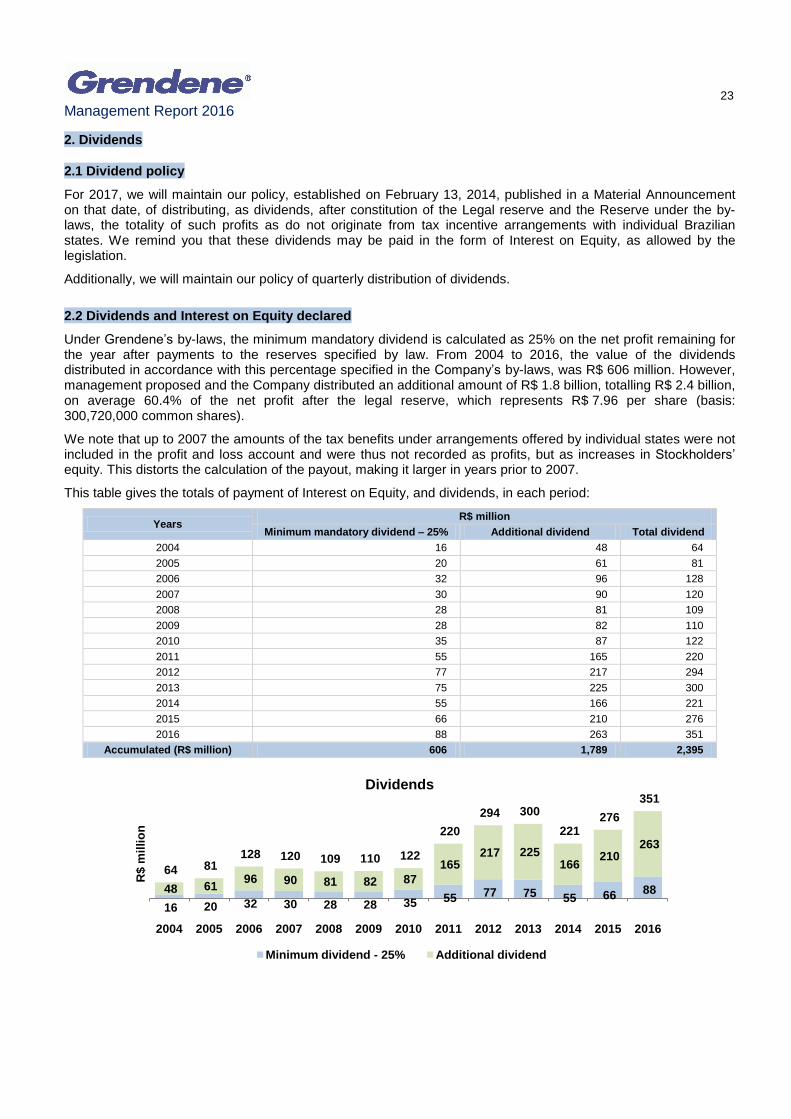
Under Grendene’s by-laws, the minimum mandatory dividend is calculated as 25% on the net profit remaining for the year after payments to the reserves specified by law. From 2004 to 2016, the value of the dividends distributed in accordance with this percentage specified in the Company’s by-laws, was R$ 606 million. However, management proposed and the Company distributed an additional amount of R$ 1.8 billion, totalling R$ 2.4 billion, on average 60.4% of the net profit after the legal reserve, which represents R$ 7.96 per share (basis: 300,720,000 common shares).
We note that up to 2007 the amounts of the tax benefits under arrangements offered by individual states were not included in the profit and loss account and were thus not recorded as profits, but as increases in Stockholders’ equity. This distorts the calculation of the payout, making it larger in years prior to 2007.
This table gives the totals of payment of Interest on Equity, and dividends, in each period:
Years R$ million
Minimum mandatory dividend – 25% Additional dividend Total dividend
2004 16 48 64
2005 20 61 81
2006 32 96 128
2007 30 90 120
2008 28 81 109
2009 28 82 110
2010 35 87 122
2011 55 165 220
2012 77 217 294
2013 75 225 300
2014 55 166 221
2015 66 210 276
2016 88 263 351
Accumulated (R$ million) 606 1,789 2,395
16 20 32 30 28 28 35 55 77 75 55 66 88 48 61 96 90 81 82 87
165 217 225
166 210
263
64 81 128 120 109 110 122
220
294 300
221 276
351
2004 2005 2006 2007 2008 2009 2010 2011 2012 2013 2014 2015 2016
R$ m
illi
on
Dividends
Minimum dividend - 25% Additional dividend

24 Management Report 2016
(*) Payout: Dividend plus net Interest on Equity, divided by net profit after constitution of legal reserves.
(**) Dividend yield: Dividend per share + net Interest on Equity per share in the business year divided by weighted average price of the share in the annualized period.
Under the by-laws and the present dividend policy, and based on the amount shown below, management proposes allocation of the net profit for the 2016 business year as follows:
a) R$87,845,724.55 as minimum mandatory dividend, corresponding to 25% of the base amount for calculation of dividends, shown below; and
b) R$263,537,173.65 in dividends additional to the minimum mandatory dividend.
The sum of these amounts is a total of R$ 351,382,898.20, which after deduction of quarterly interim dividends paid, the gross amount of which totals R$ 202,789,040.29 (total of Interest on Equity, and dividends), results in a balance of R$ 148,593,857.91, which the Company will pay, subject to approval by the Annual General Meeting that approves the accounts for the business year 2016, starting on April 26, 2017 as follows:
a) R$130,000,000.00 as Interest on Equity (gross) calculated as being part of dividends (net amount R$110,500,000.00);
b) R$18,593,857.91 as complementary dividends for the 2016 business year.
The Interest on Equity, and the complementary dividends, will be payable to holders of record of the Company’s shares (GRND3) in the Company’s records on April 12, 2017 (the cut-off date).
As from this date, the credits of Interest on Equity will be credited individually to stockholders, with retention of the income tax applicable at source, in accordance with the legislation.
Thus Grendene shares (GRND3) will be traded ex-dividends and ex-Interest on Equity, on April 13, 2017 on the BM&FBovespa.
R$ 0.730 R$ 0.976 R$ 0.998
R$ 0.736 R$ 0.868
R$ 1.089
74.8% 71.1% 71.8%
46.1% 48.6% 53.1%
8.5% 8.4% 5.0% 4.8% 5.2% 6.3%
2011 2012 2013 2014 2015 2016
%
R$
pe
r s
ha
re
Dividend per share Payout (*) Dividend yield (**)

25 Management Report 2016
Basis for the distribution of dividends in 2016
Grendene S.A. (holding company) R$
Net profit for the year (2016) 634,491,601.48
( - ) Tax incentives reserve (264,614,866.54)
Basis for calculation of the Legal reserve 369,876,734.94
( - ) Constitution of Legal reserve (18,493,836.74)
Basis of calculation of the minimum mandatory dividend relating to the result of the business year 351,382,898.20
Minimum mandatory dividend – 25% 87,845,724.55
Dividend proposed in excess of the minimum mandatory dividend 263,537,173.65
Total of dividends proposed by management (Dividend + Interest on Equity) 351,382,898.20
Allocation of the proposed corporate action payments (Interest on Equity and Dividends)
Total of dividends and Interest on Equity proposed by management 351,382,898.20
( - ) Dividends and I.E. paid in advance (202,789,040.29)
( = ) Balance to be distribute for 2016 business year 148,593,857.91
Balance of dividends 18,593,857.91
Interest on Equity, gross 130,000,000.00
( - ) Income tax withheld at source (15%) 19,500,000.00
( + ) Interest on Equity, net 110,500,000.00
Corporate action payments distributed / proposed
Decision Date approved Ex-dividend
date Date of start of
payment Gross amount
R$ Gross amount per share R$
Net amount R$ Net amount per share R$
Dividend 1 Apr. 28, 2016 May 4, 2016 May 18, 2016 51,190,824.65 0.1702 51,190,824.65 0.1702
I.E. 1 Apr. 28, 2016 May 4, 2016 May 18, 2016 30,000,000.00 0.0998 25,500,000.00 0.0848
Dividend 1 Jul. 28, 2016 Aug. 3, 2016 Aug. 17, 2016 45,505,162.63 0.1513 45,505,162.63 0.1513
Dividend 1 Oct. 20, 2016 Oct. 28, 2016 Nov. 16, 2016 76,093,053.01 0.2530 76,093,053.01 0.2530
Dividend 1 Feb. 16, 2017 Apr. 13, 2017 Apr. 26, 2017 18,593,857.91 0.06182 18,593,857.91 0.06182
I.E. 1 Feb. 16, 2017 Apr. 13, 2017 Apr. 26, 2017 130,000,000.00 0.43242 110,500,000.00 0.36752
Total 351,382,898.20 1.16852 327,382,898.20 1.08862
1 Corporate action payments (Interest on Equity + Dividends) approved ad referendum the Annual General Meeting that will examine the balance sheet and financial statements for the 2016 fiscal year.
2 Amount per share subject to alteration as a result of the balance of shares in treasury on the cutoff date (April 12, 2017).

26 Management Report 2016
3. Corporate governance best practices
Seeking to keep analysts and investors informed on the performance of our business, we have permanent channels of communication, we carry out visits, we take part in conferences and we make presentations in events at various locations around the world. We also maintain a specific site for investor relations in English and Portuguese. Since 2008 we have ceased to prepare the Annual Report, providing all the information on our performance in the Report of Management and Reference Form, both being translated and posted on our site. We carry out quarterly conference calls presenting our results in Portuguese with simultaneous translation in English and we publish a press release with analysis of these results. We also present a non-deal roadshow, quarterly in Brazil and six-monthly outside Brazil, and at least two meetings with Apimec (Sao Paulo, and Rio Grande do Sul) per year.
Since April 14, 2008, as a means of aligning the interests of management with those of stockholders, we have introduced a Stock Options Plan applying to members of the Executive Board and our principal executives. Since the start of the Plan we have already made grants of 8.4 million call options (the figure is adjusted for the stock split of September 23, 2009), equivalent to 2.8% of the Company’s total shares. Of these, 16.8% remain unexercised (1.4 million shares), equivalent to 0.5% of the total shares (base date: December 31, 2016). Our shares are listed on the Novo Mercado of BM&FBovespa, since October 29, 2004. In November 2007 we adjusted our free float to 25%, in accordance with the rules established by the listing regulations of the Novo Mercado. To improve liquidity, we have contracted a market maker for our shares (GRND3) since September 2005, and in September 2009 we made a stock split of the number of shares issued from 100,000,000 to 300,000,000, aiming for better liquidity for the shares and to facilitate their purchase by small investors and consequently expand our stockholder base. On March 22, 2010 we approved an increase in share capital through issuance of 720,000 new common shares without par value, to comply with the Stock Options Plan, increasing the share capital to 300,720,000 common shares. To comply with the other exercises of options the Company acquired shares in the market, and thus stockholders were not diluted. On December 31, 2016 the shares in circulation were 27.5% of the total shares issued.
3.1 Commitment clause
The Company, its stockholders, its managers and the members of its Audit Board undertake to resolve by means of arbitration, before the Market Arbitration Chamber, all and any dispute or controversy that may arise between them, relating to our arising from, in particular, the application, validity, efficacy, interpretation, violation, or their effects, of the provisions contained in the Corporate Law, the Company’s by-laws, the rules issued by the National Monetary Council, by the Brazilian Central Bank or by the Brazilian Securities Commission, or in the other rules applicable to the functioning of the capital market in general, as well as those contained in the Listing Regulations of the Novo Mercado, the Arbitration Regulations, the Sanctions Regulations and the Novo Mercado participation agreement.
3.2 Statement by executive board
In compliance with CVM Instruction 480/09 the members of the Executive Board declare that they have discussed, reviewed and agree with the opinions expressed in the opinion of the external auditors and with the financial statements for the business year ended December 31, 2016.

27 Management Report 2016
3.3 Awards & Recognition
In 2016 Grendene was recognized and praised by various institutions for its performance in various sectors of activity.
For the second year running, Grendene won the most important seal in world design, the If Design Award. Grendene was recognized in the category Architecture and interiors, with the plan for the London Galleria Melissa.
The IF Design Award is considered to be one of the world’s important and complete design awards.
Clube Melissa, the official network of Melissa brand stores, once again received the Franchising Seal of Excellence from the Brazilian Franchising Association – for the fourth time running. The aim of the recognition – delivered in São Paulo on April 15, 2016 – is to supply the franchisor network with a broad-based satisfaction survey from the franchisees of participating brands.
On April 27, 2016, Grendene received the 2015 Champions of Innovation Award, given by Amanhã Magazine. This is the 12
th annual award, organized by the Amanhã Group in
partnership with specialized consultants Edusys and technical support from the Dom Cabral Foundation. The event recognizes the 50 companies with the most innovative and creative practices in the three states of Brazil’s South (Paraná, Santa Catarina and Rio Grande do Sul).
Grendene was award first place in the Leather and Footwear sector in Champions of Innovation, and second place in the ranking overall.
On June 23, 2016 Melissa One by One received significant awards in the 2016 Top XXI Brazil Design Awards in the categories Innovation and Professional Highlight. One of the professionals recognized was Grendene’s Design Director, Edson Matsuo. The awards aim to recognize professionals and companies and strengthen Brazilian design.
Trophy received by
Melissa One by One
Trophy received by
Design Director
Grendene was once again recognized as the best company in the textiles sector by the Melhores e Maiores publication of Exame Magazine. This recognition is based on a technical analysis of companies’ financial statements for 2015. The award event took place in São Paulo on June 29.
Companies are compared on economic/financial criteria – such as profitability, revenue growth, liquidity and wealth creation – by a team of lecturers and technical staff of Fipecafi, a foundation linked to the Economics, Management and Accounting Faculty of São Paulo University.

28 Management Report 2016
September 12, 2016: Grendene won the 2016 Valor 1000 award in the Textile, Leather and Clothing sector. This award, held at the São Paulo Grand Hyatt Hotel, recognized the best companies in 25 sectors of the economy.
September 27, 2016: Our Faça Parte Grendene program was recognized by the Brazilian Human Resources Association, Rio Grande do Sul section (ADRH-RH), with the 2016 Top Ser Humano prize. The program was created in 2012 with the aim of attracting, identifying and selecting professionals aligned with Grendene’s culture and values.
September 29, 2016: Grendene once again received the trophy for best company in the country in the textile sector, in the second annual Empresas Mais publication of the Estado de São Paulo newspaper, prepared jointly with the Management Institute Foundation (FIA). This aims to highlight Brazil’s most efficient and advanced companies, taking into account both economic success and best management practices.
November 9, 2016: Grendene was once again in the ranking of the 500 Maiores do Sul, an initiative of the Amanhã Group in partnership with PwC (PricewaterhouseCoopers). For the last 26 years this project has presented the most complete and important regional ranking in the country, identifying the 500 largest companies in the Southern Region. Classification: 9th among companies of Rio Grande do Sul and Highlight Company in the category Net revenue in companies of the Leather and Footwear sector.
December 1, 2016: Recognized as the fourth largest company in the state in the 16th
Delmiro Gouveia Awards, organized by the O Povo Communications Group and the Albanisa Sarasate Institute (IAS). Grendene has been a Highlight Winner in these awards since they were created in 2001.
December 5, 2016: Grendene was one of the Highlight Companies in the 2016 Brazil Design Award, in the communication category Environment with the Galeria Melissa London – Multi Randolph project, carried out by the Escola Britânica de Artes Criativas (British Creative Arts School – EBAC), with organization by Abedesign (Brazilian Design Companies Association).

29 Management Report 2016
VI. Social and environmental responsibility
We believe that the principal indicator of sustainability of a company is its generation of profit and financial solidity. This factor means that consumers pay for the company’s products more than the inputs extracted from nature to manufacture and distribute these products cost. Further, it ensures continuity of the company and generation of employment, and also satisfaction of the needs of millions of clients that buy and use its products.
However, we recognize that the financial statements do not always portray all the interfaces of a company with its social and environmental surroundings and these financial indicators can react slowly to problems of relationship with society or the environment. Being aware of our responsibility as a benchmark leading Company in our segment and employer of more than 20,000 employees, we have continued to improve our processes so as to reduce the consumption of inputs and raw materials, including water and all the forms of energy, and the generation of all types of waste, loss and wastage of resources that not only represent costs for the company but also exhaust the environment when consumed beyond the level of need. With these objectives, we have carried out a range of actions over the years.
Grendene’s focus in relation to sustainable development is in reduction of waste, optimization of resources (raw materials, equipment, energy and water), recyclability of products, quality of processes and man’s interaction with this context based on the triple principle: reduce, re-use, recycle. We continue to direct special attention to the consumption of water, consumption of energy, and generation of wastes in general. The actions that we take have generated not only reduction in costs and operational risks but also a lower environmental impact. This is a list of some of the reductions we have achieved, from 2015 to 2016:
water consumed per pair produced: 2%;
consumption of electricity per pair produced: 3%;
generation of wastes per pair produced: 9%.
Our principal actions with this focus in 2016 were:
Water consumption – our industrial operations are in an arid region of the country: we act to increase the availability of water, and constantly reduce the impact of our water consumption footprint.
a. At present we have one of the lowest water footprints in footwear production. b. Approximately 80% of our use of water is for human consumption. c. We have a target of re-using 100% of treated effluent by 2020 – i.e. zero disposal of effluent.
Our water consumption indicator has varied as follows:
2015 2016 Change %, 2016/2015
Water consumption (liters/pair) 1.57 1.55 (1.8%)
Water consumption (thousand m³) 259.4 252.9 (2.5%)
Energy efficiency: we are aiming for the lowest energy consumption per pair produced, and the lowest carbon emissions per pair produced.
a. Since 2012 we have invested in energy efficiency, with a range of actions from change of motors to change from traditional illumination to LEDs. With these energy efficiency actions, we have so far reduced electricity consumption per pair produced by 11.8%.
b. 85% of the electricity supplied to the manufacturing units is of renewable origin and has low or zero carbon emission equivalent.
With our actions to increase awareness; our daily indicator of energy efficiency, with targets for managers; our automation projects; and improvements in equipment, in 2016 we avoided a total volume of consumption equivalent to 1.3 million kWh, and with the fall in production, 6.5 million kWh, in the year.
Million / kWh 2015 Reduction by
efficiency Reduction in production
2016 Change %, 2016/2015
Consumption of electricity 106.8 (1.3) (6.5) 99.0 (7.3%)

30 Management Report 2016
Our wastes are 100% recyclable: the materials that comprise our footwear are 100% recyclable, each one having its own characteristic recycling features.
a. As well as our products being recyclable, they also have non-toxic characteristics and do not contain any dangerous or allergenic substances.
b. The advantage for our materials in terms of recycling is that they do not need addition of any chemical
products. In management of wastes, we recycle 92% of the material generated. Of this total, 97% is recycled as produced, and 3% undergoes some process before being re-used.
The figures for the indicator of wastes generated per pair, and total reductions, are as follows:
2015 2016 Change %, 2016/2015
Wastes (grams / pair) 10.67 8.92 (16.4%)
Reduction of wastes (thousand tons) 1.8 1.5 (18.6%)
In 2016, as a result of all the Company’s actions in caring for the environment, Grendene received Recertification by ABVTEX (the Brazilian Textile Retailers’ Association) – it was the first footwear company to receive this certification. The aim of this certificate is to enable the retail sector to certify and monitor its suppliers in relation to practices of Environmental, Social and Employment Relations responsibility.

31 Management Report 2016
VII. Human resources
The performance of our business model requires excellence in the activities of our employees. We are a company whose engine is its people who, the more they are aligned with our Values, the more then will help in achieving the targets. Our human resources management operates on the basis of this conviction.
With the mission of producing results that sustain the strategy of the business, through integrated and competitive management of people, in an environment of respect for our Values, Grendene’s HR is structured in subsystems which are strategically developed in alignment with actions to build, develop and engage teams.
Development of competencies, knowledge and skills of employees is a priority of our model for management of people. In this challenge, the leaders of the company are the principal partners of our human resources staff. This is why, since 2005, we have had the Leaders’ Academy – a program that develops leaders aligned with the business and the market, committed to distinctive results and highly motivated teams. Among the actions for which leaders are prepared are: Formal performance evaluation of teams, providing constant feedback, contributing to full growth of the individual through development plans; identification and selection of the right people for the right places; and promotion of communication at all the levels of the organization.
We also highlight the degree of our care in managing health and safety – going beyond the legal requirements, through constant investment in technologies, machinery, and technical, administrative and medical actions. We also operate awareness-raising campaigns and actions extending to the community where the company works.
The return on the investment in our people is reflected in the Company’s low turnover, and in the maintenance of its track record of good results.
Social and corporate data 2011 2012 2013 2014 2015 2016
Employees (average / year) 24,396 24,084 28,085 26,543 24,176 20,401
Hours of training (per employee) 15 20 32 50 67 79
Meals (year) 5,494,812 5,955,479 6,867,415 4,990,607 4,815,696 5,046,305
Employees with special needs (year) 1,073 1,016 1,288 1,146 1,088 971
Dental care (appointments/year) 19,656 20,485 19,875 17,818 17,555 15,391
Absenteeism 1.81% 1.73% 2.08% 2.47% 2.17% 1.88%
Turnover (month) 1.22% 2.12% 2.00% 1.66% 1.58% 1.72%
‘Basic food baskets’ distributed (units/year)* 346,858 292,398 330,814 317,514 290,269 243,229
(*) Grendene’s policy of distribution of ‘basic food baskets’ aims to reinforce the employee’s food security. It has been in place since 1990. Over time, the effort is to maintain the basket’s nutritional value offering various options of items. All the employees and interns of Grendene, without distinction, receive it after the first month of work, until they leave the Company.

32 Management Report 2016
VIII. Statement of value added
Added value, which is an indication of the wealth added to society by the Company in its economic activity, totaled R$ 1,543 billion in 2016 (R$ 1.557 billion in 2015). The complete statement is a part of the financial statements.
Added value statement
R$ ’000 2011 2012 2013 2014 2015 2016
Personnel 346,200 416,699 515,243 521,449 531,099 518,382
Taxes 218,478 250,761 271,920 240,918 240,350 254,994
Remuneration of external capital 65,787 77,518 86,700 95,615 246,601 135,728
Remuneration of own capital 305,446 429,003 433,540 490,244 539,311 633,955
Total 935,911 1,173,981 1,307,403 1,348,226 1,557,361 1,543,059
37.0% 35.5% 39.4% 38.7% 34.1% 33.6%
23.3% 21.4% 20.8% 17.9% 15.4% 16.5%
7.0% 6.6% 6.6% 7.1% 15.8% 8.8%
32.7% 36.5% 33.2% 36.4% 34.6% 41.1%
0%
25%
50%
75%
100%
2011 2012 2013 2014 2015 2016
%
Distribution of added value
Personnel Taxes Remuneration of external capital Remuneration of own capital

33 Management Report 2016
IX. Final considerations and Outlook
As we have stated, we expect 2017 to be a difficult year, with the start of a slow recovery, many uncertainties in the political field, adjustments in the domestic economy, turbulence and volatility in international markets, and a continuing context of crisis in the traditional export markets.
Although the economic outlook of Brazil is not the best it could be, we derive strong encouragement from the fact that we are in a solid position, and that when the crisis is over we will be ready to return to growth. Crises tend to eliminate the less efficient – and strengthen those that are more able. We have no doubt which group we are a member of.
For a long time we have perceived that quality design at acceptable cost is the consumption dream of the middle class. Our brands and products have stood out in these categories, and provided us with very good results.
Phrases that do justice to our design and product approach include: To deliver value to the client with low cost; – and Famous designers accessible to all income groups; ‘Affordable Luxury’ defines the value proposal that Grendene has been delivering to consumers all over the world.
In 2017 we expect to invest, in maintenance of our production capacity, an amount equivalent to annual depreciation: Between R$ 100 and R$ 110 mn. Clearly this figure is only a reference, and we will not hesitate to invest in any good opportunities, if they appear (at the moment we do not see any).
Lamentably, in our opinion, the footwear sector will continue to suffer from the economic uncertainties. In 2017 we expect a slightly increase in consumption in Brazil, in number of pairs, in the order of 0.5% to 1%, and we have no concrete expectation of returning to the record volume of pairs that we had in 2014. We expect to grow, but we are conscious of the difficulties. Whatever the market situation is, we will seek to obtain better results than those of last year – something which we have been repeatedly achieving.
The increase in margins will have to come from increase in productivity, and rationalization of costs, since increase in volumes will be unlikely. In the last six years apparent consumption of footwear in Brazil has fallen at the rate of 1.6% p.a. (CAGR), while the number of pairs sold by Grendene has increased at 3.2% p.a. (CAGR), thus a higher rate than the market, providing us with significant gains in market share in all the lines in which we operate.
In the external market our strategy of fleeing from the concept of exporting ‘commodities’ has been successful. At the same time, we will be confronting an increasingly adverse international market. We have good margins, and we expect to continue in 2017.
In the domestic market, consumers’ desire for our products has not diminished, but their purchasing power has. Hence our challenge will be to continue to meet the expectations of our consumers with products that fit their budget. We are confident that we will not disappoint them.
We have faced the scenario that presents itself in the same way as always – with determination, courage and lucidity – obtaining strong results, as is our habit. We should re-emphasize the execution of our strategy in 2017 with special attention to growth of market share and maintenance of margins, improving our communication with the market, understanding the needs of the distribution channels, innovating in products, strengthening our brands with aggressive marketing through multiple media, and seeking excellence in the operation through continuous improvements. The objective is to continually strengthen our relationship with our clients, and serve them in a way that is increasingly focused on their needs. We understand that the remuneration of stockholders depends on this.

34 Management Report 2016
Appendix I

35 Management Report 2016
OPINION OF THE AUDIT BOARD
The Audit Board of Grendene S.A., in compliance with the provisions of law and the by-laws, has examined the Report of Management and the Individual financial statements of the Company (holding company), prepared in accordance with accounting practices adopted in Brazil, and the Consolidated financial statements prepared in accordance with International Financial Reporting Standards (IFRS) issued by the International Accounting Standards Board (IASB) for the business year ended December 31, 2016, which were approved by the Company’s Board of Directors on February 16, 2017. Based on our reviews, and further considering the report of PricewaterhouseCoopers Auditores Independentes, without qualification, dated February 15, 2017, and the information and explanations received during the business year, it is the opinion of this Audit Board that the said documents are in the proper condition to be considered by the Annual General Meeting of Stockholders.
Farroupilha, February, 16, 2017.
___________________________________
João Carlos Sfreddo
Member of the Audit Board
___________________________________
Eduardo Cozza Magrisso
Member of the Audit Board
__________________________________
Herculano Aníbal Alves
Member of the Audit Board

36 Management Report 2016
Appendix II

Grendene S.A.
Parent company and consolidated financial statements for the years ended December 31, 2016 and 2015

GRENDENE S.A.
Financial statements December 31, 2016 and 2015 Index Independent auditor's report ............................................................................................................... 1 Financial statements Balance sheet .......................................................................................................................................... 6 Statement of income .............................................................................................................................. 8 Statement of comprehensive income ............................................................................................... 9 Statement of changes in equity ....................................................................................................... 10 Statement of cash flows .................................................................................................................... 11 Statement of value added ................................................................................................................. 12 Notes to the financial statements ................................................................................................... 13

1
INDEPENDENT AUDITOR'S REPORT
To the Board of Directors and Stockholders Grendene S.A. Opinion
We have audited the accompanying parent company financial statements of Grendene S.A. (the "Company" or "Parent Company"), which comprise the balance sheet as at December 31, 2016 and the statements of income, comprehensive income, changes in equity and cash flows for the year then ended, as well as the accompanying consolidated financial statements of Grendene S.A. and its subsidiaries ("Consolidated"), which comprise the consolidated balance sheet as at December 31, 2016 and the consolidated statements of income, comprehensive income, changes in equity and cash flows for the year then ended, and notes to the financial statements, including a summary of significant accounting policies. In our opinion, the financial statements referred to above present fairly, in all material respects, the financial position of Grendene S.A. and of Grendene S.A. and its subsidiaries as at December 31, 2016, and the financial performance and the cash flows for the year then ended, as well as the consolidated financial performance and the cash flows for the year then ended, in accordance with accounting practices adopted in Brazil and with the International Financial Reporting Standards (IFRS) as issued by the International Accounting Standards Board (IASB). Basis for opinion
We conducted our audit in accordance with Brazilian and International Standards on Auditing. Our responsibilities under those standards are further described in the Auditor's Responsibilities for the Audit of the Parent Company and Consolidated Financial Statements section of our report. We are independent of the Company and its subsidiaries in accordance with the ethical requirements established in the Code of Professional Ethics and Professional Standards issued by the Brazilian Federal Accounting Council, and we have fulfilled our other ethical responsibilities in accordance with these requirements. We believe that the audit evidence we have obtained is sufficient and appropriate to provide a basis for our audit opinion. Key audit matters
Key audit matters are those matters that, in our professional judgment, were of most significance in our audit of the financial statements of the current period. These matters were addressed in the context of our audit of the parent company and consolidated financial statements as a whole, and in forming our opinion thereon, and we do not provide a separate opinion on these matters.
Matters
Why it is a Key Audit Matter
How the matter was addressed

2
Why it is a Key Audit Matter How the matter was addressed in the audit
Government grants for investments (Notes to the financial statements 4(m) and 17)
The Company receives incentives related to the Value-added Tax on Sales and Services (ICMS), arising from the Industrial Investment Attraction Program (PROVIN) and the Program of Incentives for the Port and Industrial Activities of Ceará (PROAPI), on its activities located in the state of Ceará, as well as the Foreign Trade Incentive Program (PROCOMEX) and the Program for the Development of Bahia (PROBAHIA), on its activities located in the state of Bahia. These incentives represented a significant portion of the Company's consolidated net revenue, and its recognition is in accordance with the conditions established in the respective agreements, among which, the compliance with the specific clauses related to the considerations required and the effectiveness of the respective programs. This was an area of focus in our audit due to the significance of the tax benefit amounts when compared to the results of operations, and also the strictness necessary to comply with the requirements of each of the agreements.
Our audit approach considered, among other procedures: the understanding and testing of the calculations for the recording of the benefits; the analysis of the documents for the compliance with the conditions for the use of the aforementioned tax incentives; the comparison of the revenue recognized with the respective auxiliary controls; the verification of the reasonableness of the taxes on sales and of the tax benefits recognized in the revenue account in comparison with the net sales and services revenue. We consider that the procedures performed by management and the disclosures in the financial statements are consistent with the information analyzed in our audit.
Utilization of the income tax benefit based on the operating profit and the definition of the effective income tax rate (Notes to the financial statements 24(m), 17 and 18)
The Company receives incentives relating to the reduction of 75% in the income tax rate levied on the profits from operations located in the states of Ceará and Bahia, calculated based on the operating profit. The portion subject to incentive corresponds to a significant reduction in the income tax due. In this context, we considered this an area of focus in our audit due to its significance and the process of calculation of the Corporate Income Tax (IRPJ), which demands controls and criteria for compliance with current legislation.
In respect of this matter, our procedures in this area included, among others: the understanding and testing of the main activities involved in the process of calculation of the IRPJ; the analysis of the procedures adopted for the calculation of the effective rate and tax due, considering the legislation in force; the verification, through tests, of the methodology used to calculate the operating profit; the comparison of the most significant temporary and permanent additions and exclusions carried out by the Company to determine the taxable profit with the corresponding auxiliary records.

3
Why it is a Key Audit Matter How the matter was addressed in the audit
As a result, we consider that the procedures carried out by management related to the recognition of the income tax benefit based on the operating profit, and the definition of the effective income tax rate are, in the context of the significance of the financial statements, consistent with our expectations.
Cut-off in the recognition of sales revenue (Notes to the financial statements 4(a) and 22)
Daily, the Company produces and ships a large quantity of products ordered by its clients, which may exceed, in a single day, the shipment of more than one million pairs of shoes, which are grouped according to the orders, and transported by hundreds of independent transportation trucks, which make deliveries throughout Brazil, for about 15 thousand different clients and approximately 65 thousand points of sale. Due to this significant volume and level of detail of sales, the Company controls the monitoring and the confirmation of delivery of these products for the recording of revenue in the proper accrual period. According to these aspects, we considered this an area of focus in our audit.
In respect of this matter, our procedures in this area included, among others: the understanding and testing of the significant general controls over Information Technology related to the management of changes, accesses and operations, as well as the controls over significant transactions referring to the recognition of revenue in the proper accrual period. Moreover, we tested the sales made at the end of the year to confirm the consistency of the application of the revenue recognition accounting policy. Based on the combination of control tests and transaction tests, we consider that the recognition of revenue in the proper accrual period is reasonable in the context of the financial statements as a whole.

4
Other matters
Statements of Value Added The parent company and consolidated Statements of Value Added for the year ended December 31, 2016, prepared under the responsibility of the Company's management and presented as supplementary information for IFRS purposes, were submitted to audit procedures performed in conjunction with the audit of the Company's financial statements. For the purposes of forming our opinion, we evaluated whether these statements are reconciled with the financial statements and accounting records, as applicable, and if their form and content are in accordance with the criteria defined in Technical Pronouncement CPC 09 - "Statement of Value Added". In our opinion, these Statements of Value Added have been properly prepared in all material respects, in accordance with the criteria established in the Technical Pronouncement, and are consistent with the parent company and consolidated financial statements taken as a whole.
Other information accompanying the parent company and consolidated financial statements and the auditor's report
The Company's management is responsible for the other information that comprises the Management Report. Our opinion on the parent company and consolidated financial statements does not cover the Management Report, and we do not express any form of audit conclusion thereon. In connection with the audit of the parent company and consolidated financial statements, our responsibility is to read the Management Report and, in doing so, consider whether this report is materially inconsistent with the financial statements or our knowledge obtained in the audit or otherwise appears to be materially misstated. If, based on the work we have performed, we conclude that there is a material misstatement in the Management Report, we are required to report that fact. We have nothing to report in this regard. Responsibilities of management and those charged with governance for the parent company and consolidated financial statements
Management is responsible for the preparation and fair presentation of the parent company and consolidated financial statements in accordance with accounting practices adopted in Brazil and with the International Financial Reporting Standards (IFRS) as issued by the International Accounting Standards Board (IASB), and for such internal control as management determines is necessary to enable the preparation of financial statements that are free from material misstatement, whether due to fraud or error. In preparing the parent company and consolidated financial statements, management is responsible for assessing the Company's ability to continue as a going concern, disclosing, as applicable, matters related to going concern and using the going concern basis of accounting unless management either intends to liquidate the Company or to cease operations, or has no realistic alternative but to do so. Those charged with governance are responsible for overseeing the financial reporting process of the Company and its subsidiaries.

5
Auditor's responsibilities for the audit of the parent company and consolidated financial statements
Our objectives are to obtain reasonable assurance about whether the parent company and consolidated financial statements as a whole are free from material misstatement, whether due to fraud or error, and to issue an auditor's report that includes our opinion. Reasonable assurance is a high level of assurance, but is not a guarantee that an audit conducted in accordance with Brazilian and International Standards on Auditing will always detect a material misstatement when it exists. Misstatements can arise from fraud or error and are considered material if, individually or in the aggregate, they could reasonably be expected to influence the economic decisions of users taken on the basis of these financial statements. As part of an audit in accordance with Brazilian and International Standards on Auditing, we exercise professional judgment and maintain professional skepticism throughout the audit. We also: • Identify and assess the risks of material misstatement of the parent company and
consolidated financial statements, whether due to fraud or error, design and perform audit procedures responsive to those risks, and obtain audit evidence that is sufficient and appropriate to provide a basis for our opinion. The risk of not detecting a material misstatement resulting from fraud is higher than for one resulting from error, as fraud may involve collusion, forgery, intentional omissions, misrepresentations, or the override of internal control.
• Obtain an understanding of internal control relevant to the audit in order to design audit
procedures that are appropriate in the circumstances, but not for the purpose of expressing an opinion on the effectiveness of the internal control of the Company and its subsidiaries.
• Evaluate the appropriateness of accounting policies used and the reasonableness of
accounting estimates and related disclosures made by management.
• Conclude on the appropriateness of management's use of the going concern basis of accounting and, based on the audit evidence obtained, whether a material uncertainty exists related to events or conditions that may cast significant doubt on the ability of the Company to continue as a going concern. If we conclude that a material uncertainty exists, we are required to draw attention in our auditor's report to the related disclosures in the parent company and consolidated financial statements or, if such disclosures are inadequate, to modify our opinion. Our conclusions are based on the audit evidence obtained up to the date of our auditor's report. However, future events or conditions may cause the Company to cease to continue as a going concern.
• Evaluate the overall presentation, structure and content of the parent company and
consolidated financial statements, including the disclosures, and whether these financial statements represent the underlying transactions and events in a manner that achieves fair presentation.
• Obtain sufficient appropriate audit evidence regarding the financial information of the
entities or business activities within the Group to express an opinion on the consolidated financial statements. We are responsible for the direction, supervision and performance of the group audit. We remain solely responsible for our audit opinion.
We communicate with those charged with governance regarding, among other matters, the planned scope and timing of the audit and significant audit findings, including any significant deficiencies in internal control that we identify during our audit.

6
We also provide those charged with governance with a statement that we have complied with relevant ethical requirements regarding independence, and to communicate with them all relationships and other matters that may reasonably be thought to bear on our independence, and where applicable, related safeguards. From the matters communicated with those charged with governance, we determine those matters that were of most significance in the audit of the financial statements of the current period and are therefore the key audit matters. We describe these matters in our auditor's report unless law or regulation precludes public disclosure about the matter or when, in extremely rare circumstances, we determine that a matter should not be communicated in our report because the adverse consequences of doing so would reasonably be expected to outweigh the public interest benefits of such communication.4 Porto Alegre, February 15, 2017 PricewaterhouseCoopers Auditores Independentes CRC 2SP000160/O-5 "S" CE Fábio Abreu de Paula Contador CRC 1MG075204/O-0 "S" CE

(A free translation of the original in Portuguese)
6
GRENDENE S.A. Balance sheet December 31, 2016 and 2015 (All amounts in thousands of reais) Parent company Consolidated
Note 2016 2015 2016 2015
Assets
Current assets
Cash and cash equivalents 6 8,184 6,113 20,663 21,285 Financial investments Securities at fair value through profit or loss 7 483,659 390,004 483,659 390,004 Held-to-maturity investments 7 804,411 206,868 804,411 206,868 Trade receivables 8 756,360 832,140 760,953 854,991 Inventories 9 236,470 227,459 260,646 261,462 Tax credits 10 24,093 2,816 29,347 10,990 Income tax and social contribution recoverable 3,208 - 3,681 1,795 Securities receivable 84,584 92,332 84,217 92,449 Costs and prepaid expenses 1,438 1,687 3,677 4,695 Other receivables 41,129 62,795 41,725 64,122
Total current assets 2,443,536 1,822,214 2,492,979 1,908,661 Non-current assets Long-term receivables:
Financial investments Held-to-maturity investments 7 280,645 663,723 280,645 663,723 Judicial deposits 1,003 963 1,073 994 Tax credits 10 533 540 533 540 Receivables from subsidiaries 4,936 - - - Securities receivable - 70 - 70 Deferred income tax and social contribution 18 53,993 43,505 53,932 43,554 Prepaid expenses - - 6,733 11,098
341,110 708,801 342,916 719,979 Investments 11 45,563 66,856 412 412 Property, plant and equipment 12 376,140 367,367 387,071 384,338 Intangible assets 13 27,474 30,238 30,442 32,252
Total non-current assets 790,287 1,173,262 760,841 1,136,981
Total assets 3,233,823 2,995,476 3,253,820 3,045,642
The accompanying notes are an integral part of these financial statements.

(A free translation of the original in Portuguese)
7
GRENDENE S.A. Balance sheet December 31, 2016 and 2015 (All amounts in thousands of reais) Parent company Consolidated
Note 2016 2015 2016 2015
Liabilities
Current liabilities
Borrowings 14 62,920 106,238 70,734 141,652 Trade payables 39,965 38,225 41,369 44,903 Contractual obligations - Licensing 12,542 16,971 14,011 18,337 Commissions payable 39,087 37,470 39,831 37,616 Taxes and contributions 38,035 29,528 38,375 31,251 Income tax and social contribution payable 7,557 13,708 7,560 13,708 Salaries and social security charges payable 50,036 50,483 51,497 52,720 Provision for labor risks 15 1,932 1,769 2,485 2,575 Provision for losses in subsidiary 19 5,449 - - Other payables 4,564 7,845 9,521 11,738
Total current liabilities 256,657 307,686 275,383 354,500 Non-current liabilities Borrowings 14 54,638 71,173 54,638 71,173 Provision for labor risks 15 530 128 710 308 Other debits - - 1,019 2,901
Total non-current liabilities 55,168 71,301 56,367 74,382 Equity 16 Share capital 1,231,302 1,231,302 1,231,302 1,231,302 Capital reserves 6,480 5,261 6,480 5,261 Revenue reserves (1,169) (1,052) (1,169) (1,052) Treasury shares 1,682,354 1,366,468 1,682,354 1,366,468 Other comprehensive income 3,031 14,510 3,031 14,510
Total equity 2,921,998 2,616,489 2,921,998 2,616,489 Non-controlling interests - - 72 271
Total equity 2,921,998 2,616,489 2,922,070 2,616,760
Total liabilities and equity 3,233,823 2,995,476 3,253,820 3,045,642
The accompanying notes are an integral part of these financial statements.

(A free translation of the original in Portuguese)
8
GRENDENE S.A. Statement of income December 31, 2016 and 2015 (All amounts in thousands of reais, except earnings per share) Parent company Consolidated
Note 2016 2015 2016 2015
Net sales revenue 22 2,013,877 2,165,218 2,045,115 2,202,796 Cost of goods sold 24 (1,041,003) (1,129,952) (1,048,588) (1,134,913)
Gross profit 972,874 1,035,266 996,527 1,067,883
Selling expenses 24 (442,938) (471,336) (490,574) (523,709) General and administrative expenses 24 (83,796) (80,839) (97,514) (101,695) Other operating income 25 40,322 6,330 44,454 6,674 Other operating expenses 25 (22,347) (15,453) (53,299) (20,421) Provision for losses in subsidiary 20.d (19) (28,000) - (28,000) Equity in the results of subsidiaries 11 (72,844) (53,817) - -
Operating profit before finance result and taxes
391,252
392,151
399,594
400,732
Finance result 26 Finance income 394,657 412,000 396,698 421,339 Finance costs (117,234) (213,873) (128,180) (238,992)
277,423 198,127 268,518 182,347
Profit before taxation 668,675 590,278 668,112 583,079
Income tax and social contribution 18 Current (44,671) (74,708) (44,713) (74,655) Deferred 10,488 35,653 10,556 30,887
(34,183) (39,055) (34,157) (43,768)
Profit for the year before non-controlling interest
634,492
551,223
633,955
539,311
Total comprehensive income attributed to: Controlling interests 634,492 551,223 634,492 551,223 Non-controlling interests - - (537) (11,912)
633,955 539,311
Basic earnings per share 16.g 2.1101 1.8342 - - Diluted earnings per share 16.g 2.1058 1.8305 - -
The accompanying notes are an integral part of these financial statements.

(A free translation of the original in Portuguese)
9
GRENDENE S.A. Statements of comprehensive income December 31, 2016 and 2015 (All amounts in thousands of reais) Parent company Consolidated
2016 2015 2016 2015
Profit for the year 634,492 551,223 633,955 539,311 Other comprehensive income: Items potentially reclassifiable to the Statement of
income:
Exchange differences on subsidiaries abroad (11,479) 16,856 (11,016) 16,479 Loss in minority interest - - (125) -
Comprehensive income for the year, net of taxes 623,013 568,079 622,814 555,790
Total comprehensive income attributed to: Controlling interests 623,013 568,079 623,013 568,079 Non-controlling interests - - (199) (12,289)
623,013 568,079 622,814 555,790
The accompanying notes are an integral part of these financial statements.

(A free translation of the original in Portuguese)
10
GRENDENE S.A.
Statements of changes in equity December 31, 2016 and 2015 (All amounts in thousands of reais) Capital reserves Revenue reserves Comprehensive income
Note
Share capital
Options granted
Gains from sale of
treasury shares
Treasury shares
Legal reserve
Profit
retention reserve
Reserve for the
acquisition of shares
Tax incentives
Additional proposed dividends
Retained earnings
Other
comprehensive income
Controlling
interests
Non-
controlling interests
Total
On December 31, 2014 1,231,302 5,643 - (10,841) 95,099 - 17,000 884,059 95,458 - (2,346) 2,315,374 12,560 2,327,934
Total comprehensive income - - - - - - - - - 551,223 16,856 568,079 (12,289) 555,790
Profit for the year - - - - - - - - - 551,223 - 551,223 (11,912) 539,311 Exchange differences on subsidiaries abroad 11 - - - - - - - - - - 16,856 16,856 (377) 16,479
Purchase of treasury shares - - - (3,034) - - - - - - - (3,034) - (3,034) Change of the stock option or purchase subscription plan:
Stock options exercised in the exercise - - (12,823) 12,823 - - - - - - - - - - Sale of treasury shares through exercise of purchase options
-
-
8,016
-
-
-
-
-
-
-
-
8,016
-
8,016
Result on sale of shares related to the stock option or subscription plan
21.b
-
(3,925)
4,807
-
-
-
(882)
-
-
-
-
-
-
-
Expenses with stock option or subscription plan
21
-
3,543
-
-
-
-
-
-
-
-
-
3,543
-
3,543
Proposed appropriations: Tax incentives reserve Borrowings - Provin and Proapi 17.a - - - - - - - 195,589 - (195,589) - - - - Income tax 17.c - - - - - - - 76,046 - (76,046) - - - - Reserve reflecting reserve in subsidiary - - - - - - - (10,316) 10,316 - - - - - Legal reserve - - - - 13,979 - - - - (13,979) - - - - Dividends distributed 16.f - - - - - - - - (95,458) (165,031) - (260,489) - (260,489) Additional proposed dividends 16.f - - - - - - - - 578 (578) - - - - Interest on Equity (counted as part of total dividends)
16.f
-
-
-
-
-
-
-
-
85,000
(100,000)
-
(15,000)
-
(15,000)
On December 31, 2015 1,231,302 5,261 - (1,052) 109,078 - 16,118 1,145,378 95,894 - 14,510 2,616,489 271 2,616,760
Total comprehensive income - - - - - - - - - 634,492 (11,479) 623,013 (199) 622,814
Profit for the year - - - - - - - - - 634,492 - 634,492 (537) 633,955
Exchange differences on subsidiaries abroad 11 - - - - - - - - - - (11,479) (11,479) 463 (11,016) Loss on increase in stockholding interest - - - - - - - - - - - - (125) (125)
Purchase of treasury shares - - - (11,020) - - - - - - - (11,020) - (11,020) Change of the stock option or purchase subscription plan:
Stock options exercised in the exercise - - (10,903) 10,903 - - - - - - - - - -
Sale of treasury shares through exercise of purchase options
-
-
6,416
-
-
-
-
-
-
-
-
6,416
-
6,416
Result on sale of shares related to the stock option or subscription plan
21.b
-
(4,064)
4,487
-
-
-
(423)
-
-
-
-
-
-
-
Expenses with stock option or subscription plan
21
-
5,283
-
-
-
-
-
-
-
-
-
5,283
-
5,283
Proposed appropriations: Tax incentives reserve
Borrowings - Provin and Proapi 17.a - - - - - - - 188,830 - (188,830) - - - - Income tax 17.c - - - - - - - 75,785 - (75,785) - - - -
Legal reserve - - - - 18,494 - - - - (18,494) - - - - Dividends distributed 16.f - - - - - - - - (10,894) (172,789) - (183,683) - (183,683)
Additional proposed dividends 16.f - - - - - - - - 18,594 (18,594) - - Interest on Equity distributed 16.f - - - - - - - - (85,000) (30,000) - (115,000) - (115,000)
Interest on Equity (counted as part of total dividends)
16.f
-
-
-
-
-
-
-
-
110,500
(130,000)
-
(19,500)
-
(19,500)
On December 31, 2016 1,231,302 6,480 - (1,169) 127,572 - 15,695 1,409,993 129,094 - 3,031 2,921,998 72 2,922,070
The accompanying notes are an integral part of these financial statements.

(A free translation of the original in Portuguese)
11
GRENDENE S.A.
Statement of cash flows December 31, 2016 and 2015 (All amounts in thousands of reais) Parent company Consolidated
2016 2015 2016 2015
Cash flows from operating activities
Profit for the year 634,492 551,223 633,955 539,311
Adjustments to reconcile results to cash and cash equivalents
generated by operating activities:
Equity in the results of subsidiaries 72,844 53,817 - -
Depreciation and amortization 54,251 50,834 57,878 53,652
Deferred income tax and social contribution (10,488) (35,653) (10,378) (30,024)
Gain on sale and write-off of investment (1,504) - - -
Gain on sale and write-off of property, plant and equipment 4,084 1,759 16,199 10,314
Gain on sale and write-off of intangible assets 456 9 4,758 9,609
Provision for losses / Specific reversal - - (11,793) -
Impairment loss – Goodwill - 8,862 - 8,862
Stock option or subscription plan 5,283 3,543 5,283 3,543
Estimated losses on doubtful receivables 1,923 55 1,490 679
Punctuality discount estimated 730 (2,603) 737 (2,681)
Estimated losses for obsolete inventories 3,605 1,653 3,996 1,678
Provision for labor risks 565 (53) 312 724
Provision for losses in subsidiary (5,430) 5,449 - -
Interest expenses on borrowings 3,967 3,940 9,027 14,958
Interest income on financial investments (204,851) (165,581) (204,851) (165,581)
Foreign exchange variations, net (22,536) 18,248 (30,049) 30,658
537,391 495,502 476,564 475,702
Changes in assets and liabilities:
Trade receivables 73,127 19,936 91,811 54,355
Inventories (12,616) (36,029) (3,180) (49,121)
Other receivables 5,215 (45,093) 15,767 (55,829)
Trade payables 1,740 7,105 (3,534) 8,616
Salaries and social security charges payable (447) (5,996) (1,223) (5,254)
Taxes and contributions 4,007 (40) 2,624 1,271
Income tax and social contribution payable (6,151) 9,572 (6,148) 9,274
Other payables (6,093) 39 (6,210) 3,704
Net cash provided by operating activities 596,173 444,996 566,471 442,718
Cash flows from investing activities:
In investment (56,111) (26,575) - -
In property, plant and equipment (57,903) (65,374) (59,302) (66,072)
In intangible assets (6,897) (7,132) (12,166) (7,153)
Financial investments (2,125,588) (3,053,847) (2,125,588) (3,053,847)
Redemption of financial investments 1,856,314 2,812,321 1,856,314 2,812,321
Interest received 166,005 116,166 166,005 116,166
Loan to subsidiary (4,936) - - -
Net cash provided by (used in) investing activities (229,116) (224,441) (174,737) (198,585)
Cash flows from financing activities:
New borrowings 349,822 412,825 531,301 757,138
Repayments of borrowings (356,300) (377,146) (564,620) (737,197)
Interest paid (34,806) (3,139) (40,625) (13,606)
Dividends paid (183,683) (260,489) (183,683) (260,489)
Interest on Equity paid (130,000) - (130,000) -
Purchase of treasury shares (11,020) (3,034) (11,020) (3,034)
Sale of treasury shares through exercise of purchase options 6,416 8,016 6,416 8,016
Loss on increase in stockholding interest (5,415) - (125) -
Net cash used in financing activities (364,986) (222,967) (392,356) (249,172)
Increase (decrease) in cash and cash equivalents 2,071 (2,412) (622) (5,039)
Changes in cash and cash equivalents
At the beginning of the year 6,113 8,525 21,285 26,324
At the end of the year 8,184 6,113 20,663 21,285
Increase (decrease) in cash and cash equivalents 2,071 (2,412) (622) (5,039)
Item not affecting cash flow:
Foreign exchange variations on investments 11,479 (16,856) - -
The accompanying notes are an integral part of these financial statements.

(A free translation of the original in Portuguese)
12
GRENDENE S.A.
Statement of value added December 31, 2016 and 2015 (All amounts in thousands of reais)
Parent company Consolidated
2016 2015 2016 2015
Revenue
Sales of goods 2,325,840 2,457,693 2,360,146 2,492,451
Other income /expenses 5,908 (568) (6,466) (563)
Provision for impairment of trade receivables (1,923) (55) (1,925) (824)
Provision for losses in subsidiary (19) (28,000) - (28,000)
Impairment loss – Goodwill - (8,862) - (8,862)
2,329,806 2,420,208 2,351,755 2,454,202
Inputs acquired from third parties
Raw materials used (584,992) (667,873) (567,323) (620,146)
Other production costs (3,394) (3,195) (27,403) (54,398)
Materials, electricity, outsourced services and other (509,894) (550,285) (534,334) (588,597)
Impairment/recovery of assets (3,605) (1,653) (20,100) (1,665)
(1,101,885) (1,223,006) (1,149,160) (1,264,806)
Gross value added 1,227,921 1,197,202 1,202,595 1,189,396
Retentions
Depreciation and amortization (52,735) (49,484) (56,349) (53,480)
(52,735) (49,484) (56,349) (53,480)
Net value added 1,175,186 1,147,718 1,146,246 1,135,916
Value added received through transfer
Equity in the results of subsidiaries (72,844) (53,817) - -
Finance income 394,657 412,000 396,698 421,339
Rentals 115 106 115 106
321,928 358,289 396,813 421,445
Value added to distribute 1,497,114 1,506,007 1,543,059 1,557,361
Distribution of value added
Personnel
Direct compensation 407,693 420,908 423,705 438,422
Benefits 51,108 48,799 51,281 49,130 Government Severance Indemnity Fund for Employees (FGTS) 43,017 43,038 43,396 43,547
501,818 33.52% 512,745 34.05% 518,382 33.59% 531,099 34.10%
Taxes and contributions
Federal 209,223 193,340 211,054 201,916 State 41,731 36,348 42,336 36,582 Municipal 608 572 1,604 1,852
251,562 16.80% 230,260 15.29% 254,994 16.53% 240,350 15.43%
Third-party capital remuneration
Interest, discounts and financial charges 106,347 208,908 117,213 233,999 Rentals 2,895 2,871 18,515 12,602
109,242 7.30% 211,779 14.06% 135,728 8.80% 246,601 15.84%
Remuneration of own capital
Dividends 172,789 165,609 172,789 165,609 Interest on Equity (counted as part of total dividends) 160,000 100,000 160,000 100,000 Profits reinvested for the year 301,703 285,614 301,703 285,614 Non-controlling interests in profits reinvested - - (537) (11,912)
634,492 42.38% 551,223 36.60% 633,955 41.08% 539,311 34.63%
1,497,114 100% 1,506,007 100% 1,543,059 100% 1,557,361 100%
The accompanying notes are an integral part of these financial statements.
A free translation of the original in Portuguese)
GRENDENE S.A. Notes to the financial statements December 31, 2016 and 2015 (All amounts in thousands of reais)
13
1. General information
Grendene S.A. (the "Company") is a publicly-held corporation headquartered in Sobral, State of Ceará, Brazil. The manufacturing operations are concentrated mainly in its headquarters located in the municipality of Sobral, State of Ceará. It also has industrial plants in the cities of Fortaleza and Crato in the State of Ceará, Teixeira de Freitas in the State of Bahia and in Farroupilha in the State of Rio Grande do Sul.
Grendene develops, manufactures, distributes and sells footwear for various uses and for all social classes, in the male, female, child and mass market segments.
Due to the characteristics of the footwear sector, the sales volume can fluctuate during the year and a higher sales volume is expected in the second half of the year. In management's opinion, the Company's operations are not impacted by these effects to the extent that would require additional disclosures or information in the notes to the financial statements.
2. Basis of preparation and presentation of the financial statements
Accounting policies and measurement methods adopted in the preparation of the parent company and consolidated financial statements have not changed in relation to the financial statements on December 31, 2015. a) Parent company and consolidated financial statements
At the meeting of the executive board held on February 15, 2017, the financial statements of Grendene S.A. were reviewed and revised, and their issuance was authorized. The parent company financial statements of the Company has been prepared in accordance with accounting policies adopted in Brazil and rules of the Brazilian Securities Commission (Comissão de Valores Mobiliários – CVM), obeying the accounting rules stated in the Brazilian Corporate Law legislation (Law 6,406 of 1976) and also International Financial Reporting Standards (IFRS) issued by the International Accounting Standards Board (IASB). The Company has adopted all standards, revisions of standards and interpretations issued by IASB and that are effective for the financial statements on December 31, 2016. There are no non-current assets held for sale or discontinued operations on December 31, 2016 and 2015.

(A free translation of the original in Portuguese)
GRENDENE S.A. Notes to the financial statements December 31, 2016 and 2015 (All amounts in thousands of reais)
14
2. Basis of preparation and presentation of the financial statements--Continued
b) Standards and interpretations of standards not yet in effect
The standard that will be in effect for the year beginning January 1, 2018 is the following:
IFRS 9 – Financial Instruments – IFRS 9 Financial Instruments completes the project to replace "IAS 39 Financial Instruments: Recognition and Measurement". IFRS 9 uses a single approach to determine whether a financial asset is measured at amortized cost or fair value. The new approach is based on the manner in which an entity manages its financial instruments (its business model) and the contractual cash flow characteristic of financial assets. The standard also requires the adoption of only one method for determining losses on impairment of assets. The Company is evaluating this new rule, but it does not expect any impact from this rule on its financial statements.
IFRS 15 - Revenues under contracts with clients – IFRS 15 will replace practically all the rules for recognition of revenues. This single model aims to achieve greater consistency and comparability of practices for recognition of revenues between sectors; it introduces new estimates and judgements, and new requirements for disclosure. The Company is assessing the effects of adoption of this rule in its financial statements.
There are no other standards and interpretations issued but not yet adopted that may, in the opinion of management, have a significant impact on the Company's disclosed net income or equity.

(A free translation of the original in Portuguese)
GRENDENE S.A. Notes to the financial statements December 31, 2016 and 2015 (All amounts in thousands of reais)
15
3. Consolidated financial statements
The consolidated financial statements include the operations of the Company and its subsidiaries, as follows: Percentage of interest
Corporate name Country 2016 2015
Direct investment Grendene Argentina S.A. Argentina 95.00% 95.00% MHL Calçados Ltda. Brazil 99.998% 99.998% Grendene USA, Inc. USA 100.00% 100.00% Grendene UK Limited United
Kingdom
100.00%
100.00% A3NP Indústria e Comércio de Móveis S.A. Brazil 100.00% 42.50%
Indirect investment Grendene New York, L.L.C. (through Grendene USA,
Inc.) USA
100.00%
100.00% Grendene Italy, S.R.L. (through Grendene UK Limited) Italy 100.00% 100.00% Z Plus EUR Company S.R.L. (through A3NP Indústria e
Comércio de Móveis S.A.)
Italy
100.00%
42.50%
The main characteristics of the subsidiaries included in the consolidation are as follows:
Grendene Argentina S.A.: this company is headquartered in Argentina, and its main objectives are trading in and supplying the local market.
MHL Calçados Ltda.: this company is headquartered in the State of Bahia, Brazil, and its main objectives are the manufacture and trading of footwear.
Grendene USA, Inc.: this company is headquartered in the United States of America, and its main objective is to act as a sales representative by trading and distributing the Company's products in the American market. It is the parent company of Grendene New York, L.L.C., a company headquartered in the USA, which operates in the same segment.
Grendene UK Limited: this company is headquartered in the United Kingdom, and its main objective is to act as a sales representative by trading and distributing the Company's products. It is the parent company of Grendene Italy S.R.L., a company headquartered in Italy, which operates in the same segment.
A3NP Indústria e Comércio de Móveis S.A.: this company is headquartered in Brazil, and its purposes are to manufacture, sell, import and export furniture and supplements made from plastic. It is the parent company of Z Plus EUR Company S.R.L., a company headquartered in Italy, which operates in the same segment.
There were no investments in associates or joint ventures on December 31, 2016
and 2015.

(A free translation of the original in Portuguese)
GRENDENE S.A. Notes to the financial statements December 31, 2016 and 2015 (All amounts in thousands of reais)
16
3. Consolidated financial statements--Continued
The financial years of the subsidiaries included in the consolidation coincide with those of the parent company and the accounting policies were uniformly applied in the subsidiaries and were consistent with the international financial reporting standards. The main consolidation procedures are:
• Elimination of intercompany asset and liability accounts;
• Elimination of the equity interests, reserves and retained earnings of consolidated companies; and
• Elimination of intercompany revenues and expenses, as well as of unrealized profits from intercompany transactions.
4. Accounting policies
a) Revenue recognition
Revenue is recognized when the amount can be reliably measured and it is probable that future economic benefits will flow to the Company and its subsidiaries. Revenue is measured based on the fair value of the consideration received, net of discounts, rebates and taxes or charges on sales. The Company evaluates revenue transactions in accordance with specific criteria in order to determine if it is acting as agent or principal and ultimately concluded that it has been acting as principal in all its revenue contracts. Revenue is not recognized when there is significant uncertainty about its realization. Revenues and expenses are recognized on the accrual basis.
a.1) Sales revenue
The revenue from the sale of products is recognized when all the risks and rewards inherent to the product have been transferred to the buyer and the Company and its subsidiaries no longer have control over, or responsibility for, the product sold.
a.2) Finance income
Interest income is recognized as finance income utilizing the effective interest rate method.

(A free translation of the original in Portuguese)
GRENDENE S.A. Notes to the financial statements December 31, 2016 and 2015 (All amounts in thousands of reais)
17
4. Accounting policies--Continued
b) Translation of balances denominated in foreign currency
b.1) Functional and presentation currency of the financial statements
The Company's functional currency is the Brazilian Real, which is the currency also utilized for the preparation and presentation of the parent company and consolidated financial statements. The financial statements of each subsidiary included in the consolidation, as well as those utilized as a basis to account for investments under the equity method, are prepared based on the functional currency of each entity. For subsidiaries located abroad which management has concluded have administrative, financial and operational independence, assets and liabilities are translated into Reais at the period-end exchange rate and the results are calculated at the average monthly exchange rates for the years.
b.2) Transactions denominated in foreign currency
In the parent company financial statements, subsidiaries are accounted for using the equity method, and their results are recognized in proportion to the Company's investment, as "equity in the results of subsidiaries". Adjustments to the investment account arising from foreign exchange variation are recognized in the Company’s equity, as carrying value adjustments. For consolidation purposes, the financial statements of these subsidiaries are included in the consolidated financial statements and adjustments arising from foreign exchange variation on assets and liabilities denominated in U.S. dollars, Argentinean Pesos, Pound Sterling and Euro are recognized in consolidated equity, as carrying value adjustments. Monetary assets and liabilities denominated in foreign currency are translated into the functional currency (Real) at the exchange rate in effect at the end of the reporting period. Gains and losses resulting from the remeasurement of these assets and liabilities, at the exchange rate in effect at the transaction date and at the end of the years, are recognized as finance income or costs in the profit and loss account.

(A free translation of the original in Portuguese)
GRENDENE S.A. Notes to the financial statements December 31, 2016 and 2015 (All amounts in thousands of reais)
18
4. Accounting policies--Continued
c) Financial instruments
Financial instruments are only recognized when the Company or its subsidiaries become parties to the contractual provisions of the instruments. Financial instruments are initially recognized at fair value, plus transaction costs directly attributable to their acquisition or issue, except for financial assets and liabilities classified as "at fair value through profit or loss", when these costs are recognized directly in the results.
Subsequent measurement
Financial instruments are subsequently measured, at each reporting date, in accordance with the rules established for each category of financial assets and liabilities.
c.1) Financial assets
Financial assets are classified in the categories below in accordance with the purpose for which they are acquired or issued:
a) Financial assets at fair value through profit or loss: an instrument is
classified as at fair value through profit or loss when it is held for trading, that is, designated as such an initial recognition. Financial assets are classified as held for trading if acquired for sale or repurchase in the short-term. Derivatives are also categorized as held for trading. At the end of each reporting period, the assets are measured at fair value. Interest, monetary restatements, foreign exchange variations and variations arising from fair value measurements are recognized in the results when incurred.
b) Investments held-to-maturity: non-derivative financial assets with fixed
or determinable payments and defined maturities for which the Company has the positive intent and ability to hold to maturity. After initial recognition they are measured at amortized cost using the effective interest rate method, less any impairment. Interest, monetary restatement and foreign exchange variation are recognized in profit or loss when incurred.
(A free translation of the original in Portuguese)
GRENDENE S.A. Notes to the financial statements December 31, 2016 and 2015 (All amounts in thousands of reais)
19
4. Accounting policies--Continued
c) Financial instruments--Continued
c.1) Financial assets--Continued
c) Loans and receivables: non-derivative financial assets with fixed or determinable payments that are not quoted in an active market. After initial recognition they are measured at amortized cost, using the effective interest rate method. Interests, monetary restatement, foreign exchange variation, less impairment, where applicable, are recognized immediately in profit or loss, as finance income or costs.
d) Available-for-sale financial assets: where applicable, are included in this
classification the financial assets that dot not qualify for categories c.1a, c.1b. and c.1c above. Subsequent to initial recognition, they are measured at fair value and their fluctuations, except any impairment, as well as foreign currency differences of these instruments are recognized directly in equity, net of tax effects. These tax effects are recognized against a deferred income tax and social contribution asset/liability. When an investment is derecognized, the gain or loss accumulated in equity is transferred to the results.
The main financial assets recognized by the Company and its subsidiaries are: cash and cash equivalents, financial investments and trade receivables.
c.2) Financial liabilities
Financial liabilities are classified in the categories below in accordance with the purpose for which they are contracted or issued:
a) Financial liabilities at fair value through profit or loss: these include
financial liabilities usually traded before maturity, liabilities designated at initial recognition at fair value through profit or loss and derivatives. At the end of each reporting period, they are measured at fair value. Interest, monetary restatement, foreign exchange variation and variations arising from fair value measurement, when applicable, are recognized immediately in profit or loss.

(A free translation of the original in Portuguese)
GRENDENE S.A. Notes to the financial statements December 31, 2016 and 2015 (All amounts in thousands of reais)
20
4. Accounting policies--Continued
c) Financial instruments--Continued
c.2) Financial liabilities--Continued
b) Financial liabilities measured at amortized cost: non-derivative financial liabilities that are not usually traded before maturity. After initial recognition they are measured at amortized cost, using the effective interest rate method. Interest, monetary restatement and foreign exchange variation, when applicable, are recognized immediately in profit or loss.
The main financial liabilities recognized by the Company and its subsidiaries are: borrowings, trade payables, commissions payable and derivatives.
c.3) Offsetting of financial instruments
Financial assets and liabilities are offset and the net amount reported in the balance sheet when there is a legal right to offset the recognized amounts and there is an intention to settle on a net basis, or realize the asset and settle the liability simultaneously.
c.4) Market value
The fair values of financial instruments actively traded in organized markets are determined based on quoted market prices at the end of the reporting period. In the absence of an active market, the fair value is determined by using valuation techniques. These techniques include the use of recent market transactions between independent parties, discounted cash flow analysis or other valuation methods. The financial instruments and their respective fair values are disclosed in Note 19.a.
c.5) Impairment of financial instruments
Financial assets that are not classified at fair value through profit or loss are tested annually for impairment. Financial assets are considered impaired when there is objective evidence of impairment as a result of one or more events that occurred after the initial recognition of the financial asset and that loss event (or events) has an impact on the estimated future cash flows of the financial asset.

(A free translation of the original in Portuguese)
GRENDENE S.A. Notes to the financial statements December 31, 2016 and 2015 (All amounts in thousands of reais)
21
4. Accounting policies--Continued
c) Financial instruments--Continued
c.6) Derivative financial instruments and hedging activities
The Company operates with derivative financial instruments, mainly hedging transactions. Derivative instruments are initially recognized at fair value on the date a derivative contract is entered into and are subsequently remeasured at their fair value.
Although the Company uses derivatives for hedging purposes protection, it does not adopt the hedge accounting practice.
The fair values of derivative instruments used for hedging purposes are disclosed in Note 19.b. The Company does not have speculative derivatives.
d) Cash and cash equivalents
Cash and cash equivalents include cash on hand and at banks and financial investments redeemable within 90 days from the investment date, and with immaterial risk of change in value. Financial investments included in cash equivalents are mostly classified as "financial assets at fair value through profit or loss" (Note 6).
e) Financial investments
The classification of financial investments depends on the purpose for which the investment was acquired and it is measured, according to the category, as described in Note 4.c.1. Where applicable, costs directly attributable to the acquisition of a financial asset are added to the amount originally recognized.
f) Trade receivables
Trade receivables are stated at realizable values, and trade receivables in the foreign market are remeasured at the exchange rates in effect at the reporting date.

(A free translation of the original in Portuguese)
GRENDENE S.A. Notes to the financial statements December 31, 2016 and 2015 (All amounts in thousands of reais)
22
4. Accounting policies--Continued
f) Trade receivables--Continued
Provisions have been made, in amounts considered sufficient by management, for estimated losses due to impairment of trade receivables and for the estimated total of prompt payment discounts. The criterion for constitution of the provision for impairment of trade receivables takes into consideration the analysis of credit risks of the customers who have receivables overdue for more than 180 days, not considering those that have court or out-of-court settlements or guarantees. The prompt payment discount is made the estimated amount of discounts to be granted on trade receivables for payment of trade notes on due dates, and is recorded in Sales deductions.
Information related to the breakdown of trade receivables into amounts not yet due and past due is included in Note 8.
g) Inventories
Inventories are stated at average acquisition or production cost, which does not exceed their net realizable values. Net realizable value is calculated as the sales price in the normal course of business, less costs to be incurred to realize the sale.
Provisions for slow-moving or obsolete inventories (in good condition, but no longer of use for the Company's business) are recorded taking into consideration the history of resale of these inventories, in which the Company recovers part of the cost, resulting in an average percentage of non-recovery which is applied to the balance of inventories classified as slow-moving or obsolete. The Company's management considers that the provision recorded is sufficient to cover losses arising from slow-moving or obsolete inventories.
h) Investments
In the parent company financial statements, investments in subsidiaries are accounted for using the equity method. Other investments are stated at cost and adjusted to market value, where applicable.

(A free translation of the original in Portuguese)
GRENDENE S.A. Notes to the financial statements December 31, 2016 and 2015 (All amounts in thousands of reais)
23
4. Accounting policies--Continued
h) Investments--Continued
Upon the acquisition of the investment, any differences between the investment cost and the portion of the investor in the net fair value of the identifiable assets and liabilities of the subsidiary must be recorded as goodwill.
i) Property, plant and equipment
Property, plant and equipment are stated at cost of acquisition or construction. Cost includes expenditure that is directly attributable to the acquisition of the items. The depreciation of assets is calculated using the straight-line method at the rates mentioned in Note 12 and takes into consideration the estimated useful lives of assets. The assets' residual values and useful lives are reviewed, and adjusted if appropriate, at the end of each reporting period. Property, plant and equipment are recognized net of the Social Integration Program (PIS), Social Contribution on Revenues (COFINS) and Value-added Tax on Sales and Services (ICMS) credits, which are recorded in taxes recoverable.
Subsequent costs are included in the asset's carrying amount or recognized as a separate asset, as appropriate, only when it is probable that future economic benefits associated with these costs will flow to the Group and they can be measured reliably. The carrying amount of the replaced items or parts is derecognized. All other repairs and maintenance are charged to the profit and loss account during the financial period in which they are incurred.
The carrying amount of property, plant and equipment items is reviewed whenever events or changes in circumstances indicate that the amount may not be recoverable. An impairment loss is recognized when the asset's carrying amount exceeds its recoverable amount. For the purposes of assessing impairment, assets are grouped in CGUs.
The Company did not identify indications of impairment of its property, plant and
equipment items on December 31, 2016 and 2015, in accordance with technical
pronouncement CPC 01 – R1 (IAS 36) – Impairment of Assets.
j) Intangible assets
Intangible assets refer to separately acquired intangible assets, which are initially recognized at acquisition cost and, subsequently, less accumulated amortization. The Company's intangible assets have finite useful lives. Amortization is calculated using the straight-line method at the rates mentioned in Note 13.

(A free translation of the original in Portuguese)
GRENDENE S.A. Notes to the financial statements December 31, 2016 and 2015 (All amounts in thousands of reais)
24
4. Accounting policies--Continued
j) Intangible assets--Continued
Goodwill represents the excess of the cost of an acquisition over the net fair value of assets and liabilities of the acquired entity. Goodwill on acquisitions of subsidiaries is recorded as "Intangible assets" in the consolidated financial statements.
The carrying amount of an intangible asset is reviewed for impairment whenever events or changes in circumstances indicate that the carrying amount may not be recoverable. For the purposes of assessing impairment, assets are grouped in CGUs. On December 31, 2015 the Company recognized, as a loss due to impairment, in other operating expenses, the full value of the goodwill on the subsidiary A3NP Indústria e Comércio de Móveis S.A.
k) Other assets and liabilities
Assets and liabilities are classified as current when it is probable that their realization or settlement will occur within the next twelve months. Otherwise, they are presented as non-current.
l) Taxation
l.1) Current income tax and social contribution tax
Current tax assets and liabilities for the year and prior years are measured at the expected amount recoverable from or payable to the tax authorities. The tax rates and tax laws used to calculate the amount are those enacted or substantively enacted at the end of the reporting period in the countries where the Company operates and generates taxable income.
l.2) Deferred income tax and social contribution tax
The book profit is adjusted for temporarily non-deductible expenses or temporarily non-taxable income in order to calculate current taxable income, thereby generating deferred tax assets or liabilities. Amounts relating to the impacts of deferred tax assets and liabilities are recognized and classified in non-current assets and/or liabilities.
Deferred tax assets relating to temporary differences are recognized to the extent that it is probable that future taxable profit will be available against which the temporary differences can be utilized.

(A free translation of the original in Portuguese)
GRENDENE S.A. Notes to the financial statements December 31, 2016 and 2015 (All amounts in thousands of reais)
25
4. Accounting policies--Continued
l) Taxation--Continued
l.2) Deferred income tax and social contribution tax--Continued
Deferred taxes are reviewed at the end of each reporting period and, if necessary, a provision for loss is recognized when it is no longer probable that sufficient taxable profits will be available to allow all or part of the deferred tax asset to be utilized.
Deferred taxes are assessed at the rate that is expected to be applicable in the business year in which the asset will be realized or the liability settled, based on the rates (and tax legislation) in effect on the reporting date. Deferred tax assets and liabilities are offset only when there is a legally enforceable right to offset the current tax asset against the current tax liability, and if they are related to taxes administered by the same tax authority with respect to the same taxable entity.
m) Government grants for investments
Tax incentives correspond to: (i) reduction of 75% in income tax levied on profits of the business in the states of Ceará and Bahia, calculated based on operating profit; and (ii) ICMS tax incentives related to operating activities located in such states (Note 17).
Government grants are recognized when there is reasonable assurance that the conditions established in the agreements were fulfilled. They are recognized as revenue in the profit and loss account over the year necessary to match the expense that the government grant intends to compensate and, subsequently, they are transferred to the revenue reserve, within "Tax incentives" in equity. The amounts from state incentives may have different applications, as provided for by Law 11,941 of May 27, 2009.
n) Share-based payments
The Company's directors and managers receive compensation in the form of a share-based payment (grant of share purchase options), in which employees render services in exchange for equity instruments ("equity-settled transactions").

(A free translation of the original in Portuguese)
GRENDENE S.A. Notes to the financial statements December 31, 2016 and 2015 (All amounts in thousands of reais)
26
4. Accounting policies--Continued
n) Share-based payments--Continued
The cost of equity-settled transactions with employees, and of options granted, is measured based on the fair value at the grant date. The Company uses pricing and valuation techniques to determine fair value. The cost of equity-settled transactions is recognized, together with a corresponding credit in equity, over the year in which the performance and/or service condition are fulfilled, ending on the date in which the employee is fully entitled to exercise the option (vesting date). The cumulative expense recognized for equity-settled transactions at each reporting date until the vesting date reflects the extent to which the vesting period has expired and the Company's best estimate of the number of equity securities to be acquired. The expense in the profit and loss account for the year is recognized in "personnel expenses" and represents the change in the cumulative expenses recognized at the beginning and end of that year, as presented in Note 21.
The effect of outstanding options on diluted earnings per share is disclosed in Note 16.g.
o) Segment information
The segments of the Company and its subsidiaries are as follows: (i) production and sale of synthetic footwear for domestic and foreign markets and (ii) sale, import and export of furniture and supplements made from plastic. Segment information is presented in Note 23.
p) Adjustment of assets and liabilities to present value
Current monetary assets and liabilities are adjusted to present value when the effect is considered material in relation to the financial statements taken as a whole. On December 31, 2016 and 2015, only trade receivables transactions were considered material and adjusted to their present values. There were no other current or non-current components that required adjustment to present value. The adjustment to present value is calculated considering the cash flows of the transactions and the implicit interest rates of the related assets. Therefore, interest embedded in revenues is discounted in order to recognize it in conformity with the accrual basis of accounting. This interest is subsequently reallocated to finance income, in the profit and loss account, using the effective interest rate method in relation to the contractual cash flows. The implicit interest rates applied were determined based on assumptions and are considered as accounting estimates.

(A free translation of the original in Portuguese)
GRENDENE S.A. Notes to the financial statements December 31, 2016 and 2015 (All amounts in thousands of reais)
27
4. Accounting policies--Continued
q) Accounting judgments, estimates and assumptions
The preparation of the financial statements of the Company and its subsidiaries requires management to make judgments and estimates and adopt assumptions that affect the reported amounts of revenues, expenses, assets and liabilities, as well as the disclosure of contingent liabilities at the reporting date. However, the uncertainty related to these assumptions and estimates could lead to results that would require a significant adjustment to the carrying amount of the respective asset or liability in future years. The areas involving a higher degree of judgment, or areas where assumptions and estimates are significant to the financial statements are disclosed in Note 5.
r) Borrowings
Borrowings are stated at contractual amounts, plus agreed-upon charges including interest and monetary restatement or foreign exchange variations. After initial recognition they are measured at amortized cost, using the effective interest rate method.
s) Provisions
Provisions are recognized when the Company has a present legal or constructive obligation as a result of past events, it is probable that an outflow of resources will be required to settle the obligation, and the amount can be reliably estimated. When a provision is expected to be fully or partially reimbursed, for example, in connection with an insurance contract, the reimbursement is recognized as a separate asset, but only when the receipt is virtually certain. The expense related to any provision is presented in the profit and loss account, net of any reimbursement.
t) Presentation of the statements of cash flows and value added
The statements of cash flows were prepared in accordance with the indirect method and are presented in accordance with technical pronouncement CPC 03 – R2 (IAS 7) – Statement of Cash Flows. Changes in financial investments are shown in investing activities. The statement of value added was prepared in accordance with technical pronouncement CPC 09 – Statement of Value Added.

(A free translation of the original in Portuguese)
GRENDENE S.A. Notes to the financial statements December 31, 2016 and 2015 (All amounts in thousands of reais)
28
4. Accounting policies--Continued
u) Treasury shares
The Company's own equity instruments that are repurchased (treasury shares) are recorded at cost, as a reduction of equity. No gain or loss is recognized in the profit and loss account on the purchase, sale, issue or cancellation of the Company's own equity instruments. Any difference between the carrying amount and the consideration received on sale is recognized in capital or revenue reserves.
5. Accounting estimates and assumptions
The main assumptions related to sources of uncertainty in future estimates and other important sources of uncertainty in estimates at the end of the reporting period, involving a significant risk of causing an adjustment to the carrying amounts of assets and liabilities within the next financial year, are presented below.
Impairment of non-financial assets: An impairment loss is recognized when the carrying amount of an asset or cash-generating unit exceeds its recoverable amount. The recoverable amount is the higher of an asset's fair value less costs to sell and its value in use. The calculation of fair value less costs to sell is based on available information on sales of similar assets or market prices, reduced of costs incurred to carry out the sale. The value-in-use calculation is based on the discounted cash flow model. Cash flows derive from estimates of results for the following five years and do not include restructuring activities to which the Company is not yet committed or significant future investments that will improve the asset base of the cash generating unit subject to test. The recoverable amount is influenced by the discount rate used under the discounted cash flow method, as well as by the expected future cash receipts and the growth rate used for extrapolation purposes.
Taxes: Tax regulations in Brazil are complex, which raises uncertainties as to their interpretation and to the amount and timing of future taxable profits. Accordingly, any differences between actual results and assumptions adopted, or future changes in these assumptions, could require future adjustments to the tax credits and expenses already recognized. The Company did not recognize a provision in this respect based on several factors, such as experience of past tax audits, diverging interpretations of tax regulations, and systematic assessments carried out jointly by the Company's management and its tax advisors.

(A free translation of the original in Portuguese)
GRENDENE S.A. Notes to the financial statements December 31, 2016 and 2015 (All amounts in thousands of reais)
29
5. Accounting estimates and assumptions--Continued
Fair value of financial instruments: When the fair value of financial assets and liabilities stated in the balance sheet cannot be obtained from active markets, it is determined using valuation techniques, including the discounted cash flow method. The data for these methods is based on those practiced in the market, whenever possible. However, when this is not possible, a certain level of judgment is required to establish the fair value. Judgment includes considerations on data utilized, such as liquidity risk, credit risk and volatility. Changes in assumptions concerning these factors could affect the reported fair value of the financial instruments.
Provisions for labor, tax and civil risks: The assessment of the likelihood of loss includes the evaluation of available evidence, the hierarchy of laws, available case law, recent court decisions and their importance in the legal system, as well as the opinion of outside legal advisors. Provisions are reviewed and adjusted to take into consideration changes in circumstances, such as applicable statute of limitation periods, conclusions arising from tax audits or additional exposures identified based on new issues or court decisions.
Other significant items subject to estimates include: the selection of useful lives of property, plant and equipment and intangible assets; estimated losses on doubtful receivables; punctuality discounts estimated; estimated losses for obsolete inventory; deferred income tax and social contribution tax; rates and periods used to determine the present value adjustment of certain assets and liabilities; fair value of share-based payment; and financial instrument sensitivity analyses.
6. Cash and cash equivalents
Parent company Consolidated
2016 2015 2016 2015
Cash and banks 3,433 1,981 6,485 6,777 Financial investments 4,751 4,132 14,178 14,508
8,184 6,113 20,663 21,285
Cash and banks are represented by non-interest-bearing bank deposits. Financial investments classified as cash equivalents refer to short-term investments redeemable no later than three months from the acquisition date.

(A free translation of the original in Portuguese)
GRENDENE S.A. Notes to the financial statements December 31, 2016 and 2015 (All amounts in thousands of reais)
30
7. Financial investments Parent company / Consolidated
2016 2015
Securities at fair value through profit or loss 483,659 390,004 Held-to-maturity investments 1,085,056 870,591
1,568,715 1,260,595 (-) Total current assets (1,288,070) (596,872)
Total non-current assets 280,645 663,723
The Company’s financial investments comprise the following components:
Parent company / Consolidated
Index Return 2016 2015
Indexed CDI 104.99% e 105.25% 1,048,347 809,430 Fixed-rate and indexed IPCA + 6.43% e 5.65% p.a. 336,860 290,320 Fixed-rate and indexed IGPM + 6.25% p.a. 62,688 55,030 Fixed-rate 14.24% p.a. 120,820 105,815
1,568,715 1,260,595
Financial investments comprise: Bank Certificates of Deposit (CDBs), Debentures, Real-denominated Bank Debt Notes (LFINs) and Government Debt Securities (NTNs), and are classified as "Securities at fair value through profit or loss", and "Held-to-maturity investments", according to the Company's investment strategy.
8. Trade receivables
Parent company Consolidated
2016 2015 2016 2015
Not yet due 768,592 825,713 768,691 853,508 Overdue for up to 30 days 10,108 21,440 11,394 18,963 Overdue from 31 to 60 days 2,119 3,595 3,193 3,475 Overdue from 61 to 90 days 1,299 3,350 1,661 4,085 Past due for more than 91 days 21,475 19,193 24,310 19,848
803,593 873,291 809,249 899,879 Estimated losses on doubtful receivables (6,896) (4,973) (7,934) (6,444) Punctuality discounts estimated (25,085) (24,355) (25,110) (24,373) Adjustment to Present Value (AVP) (15,252) (11,823) (15,252) (14,071)
756,360 832,140 760,953 854,991
On December 31, 2016 and 2015, the average collection periods for the domestic market are 92 and 96 days, respectively, and for the foreign market are 84 days.

(A free translation of the original in Portuguese)
GRENDENE S.A. Notes to the financial statements December 31, 2016 and 2015 (All amounts in thousands of reais)
31
8. Trade receivables--Continued
There are no liens, pledges and/or restrictions to the trade receivables amounts.
The constitutions of estimated losses for doubtful accounts on securities due by maturity were as follows: Parent company
2016 2015
Balance Provision Balance Provision
Not yet due 768,592 - - 828,320 825,713 - - Overdue for up to 30 days 10,108 - - 46,926 21,440 - - Overdue from 31 to 60 days 2,119 () (53) 3,843 3,595 () (2) Overdue from 61 to 90 days 1,299 () (106) 3,798 3,350 () (1) Past due for more than 91 days 21,475 () (6,737) 9,514 19,193 () (4,970)
803,593 (4,959) (6,896) 892,401 873,291 (4,959) (4,973)
Consolidated
2016 2015
Balance Provision Balance Provision
Not yet due 768,691 - - 828,320 853,508 - - Overdue for up to 30 days 11,394 - - 46,926 18,963 - - Overdue from 31 to 60 days 3,193 () (53) 3,843 3,475 () (2) Overdue from 61 to 90 days 1,661 () (106) 3,798 4,085 () (1) Past due for more than 91 days 24,310 () (7,775) 9,514 19,848 () (6,441)
809,249 (4,959) (7,934) 892,401 899,879 (4,959) (6,444)
The changes in the estimated losses on doubtful receivables were as follows:
Parent company Consolidated
2016 2015 2016 2015
Balance at the beginning of the year (4,973) (4,918) (6,444) (5,765) Additions (9,667) (7,343) (9,895) (10,375) Realizations 6,164 5,218 6,280 5,253 Reversals 1,580 2,070 1,700 4,313 Exchange variation - - 425 130
Balance at the end of the year (6,896) (4,973) (7,934) (6,444)

(A free translation of the original in Portuguese)
GRENDENE S.A. Notes to the financial statements December 31, 2016 and 2015 (All amounts in thousands of reais)
32
8. Trade receivables--Continued The changes in the punctuality discount estimated were as follows: Parent company Consolidated
2016 2015 2016 2015
Balance at the beginning of the year (24,355) (26,958) (24,373) (27,054) Additions (85,518) (86,706) (85,621) (86,868) Realizations 68,948 74,341 69,039 74,529 Reversals 15,840 14,968 15,845 15,020
Balance at the end of the year (25,085) (24,355) (25,110) (24,373)
9. Inventories
Parent company Consolidated
2016 2015 2016 2015
Footwear 46,208 48,794 68,681 80,591 Furniture - - 175 1,903 Inputs and components 41,005 33,748 41,179 33,942 Raw materials 63,584 68,498 63,670 68,577 Packaging materials 12,196 11,184 12,223 11,208 Intermediate and other materials 31,018 31,632 31,118 31,738 Goods for resale 1,258 670 1,324 670 Molds and tooling 18,758 - 18,758 - Advances to suppliers 8,508 16,358 8,508 16,358 Imports in transit 8,989 10,808 8,989 10,808 Inventories held by third parties 16,923 14,139 18,492 14,142 Estimated losses for obsolete inventory (11,977) (8,372) (12,471) (8,475)
236,470 227,459 260,646 261,462
The changes in the estimated losses for obsolete inventories were as follows:
Parent company Consolidated
2016 2015 2016 2015
Balance at the beginning of the year (8,372) (6,719) (8,475) (6,797) Additions (14,935) (9,138) (15,601) (9,782) Realizations 3,665 3,102 3,665 3,102 Reversals 7,665 4,383 7,936 5,015 Exchange variation - - 4 (13)
Balance at the end of the year (11,977) (8,372) (12,471) (8,475)
There are no liens, pledges and/or restrictions to the full utilization of the inventories.

(A free translation of the original in Portuguese)
GRENDENE S.A. Notes to the financial statements December 31, 2016 and 2015 (All amounts in thousands of reais)
33
10. Tax credits
Parent company Consolidated
2016 2015 2016 2015
Withholding Income Tax (IRRF) 20,737 - 20,940 240 Excise tax (IPI) recoverable 281 54 568 350 Value-added Tax on Sales and Services (ICMS) recoverable 3,235 64
2,972 5,317
5,077
Social Integration Program (PIS) recoverable 64 56 122 118 Social Contribution on Revenues (COFINS) recoverable 294
259 559 5
543
INSS recoverable 15 15 29 29 Taxes recoverable – Subsidiaries abroad - - 2,345 5,173
24,626 3,356 29,880 11,530 (-) Total current assets (24,093) (2,816) (29,347) (10,990)
Total non-current assets 533 540 533 540
a) IRRF
IRRF refers to withholding income tax on the redemption of financial investments. These credits are realizable through the offset against federal taxes and contributions.
b) ICMS and IPI recoverable
The balances were generated from sales transactions and can be offset against taxes of the same nature.
c) PIS and COFINS recoverable
Refer to PIS and COFINS balances to be offset against federal taxes and contributions.
d) National Institute of Social Security (INSS) recoverable
Corresponds to the INSS balance, to be offset with the tax.

(A free translation of the original in Portuguese)
GRENDENE S.A. Notes to the financial statements December 31, 2016 and 2015 (All amounts in thousands of reais)
34
11. Investments
a) Breakdown of investments
The Company's investments are as follows:
Parent company Consolidated
2016 2015 2016 2015
Subsidiaries 49,424 72,348 - - Unrealized profits in subsidiaries (4,273) (5,904) - - Other investments 412 412 412 412
45,563 66,856 412 412
b) Changes in investments
The changes in investments are as follows:
Parent company Consolidated
2016 2015 2016 2015
Balance at the beginning of the year 66,856 86,104 412 412 Addition 8,694 - - - Capital increase in subsidiary 47,417 26,575 - - Impairment loss - Goodwill - (8,862) - - Equity in the results of subsidiaries (72,844) (53,817) - -
Exchange differences on subsidiaries abroad
(11,479)
16,856
-
-
Write-off FX differences in subsidiaries – A3NP 1,504
-
-
-
Gain on increase in stockholding interest 5,415 - - -
Balance at the end of the year 45,563 66,856 412 412
c) Impairment loss – Goodwill
Due to the results of the subsidiary A3NP Indústria e Comércio de Móveis S.A. not reaching the point of break-even, and due to there being substantial doubt about that company’s capacity to generate future economic results able to support maintenance of the goodwill, the Company recognized a loss due to impairment, of R$8,862, the full value of the goodwill, in other operating expenses on December 31, 2015.

(A free translation of the original in Portuguese)
GRENDENE S.A. Notes to the financial statements December 31, 2016 and 2015 (All amounts in thousands of reais)
35
11. Investments--Continued
d) Summarized financial information of direct and indirect subsidiaries (consolidated)
Grendene Argentina S.A. (*)
MHL Calçados
Ltda.
Grendene USA,
Inc. (*) (**)
Grendene UK Limited (*) (**)
A3NP Indústria e Comércio de
Móveis S.A. (*) (**)
2016 2015 2016 2015 2016 2015 2016 2015 2016 2015
Current assets 9,890 49,677 13,404 12,889 31,268 42,873 8,549 11,495 2,791 6,075 Non-current assets 222 568 859 1,078 8,446 14,049 8,062 15,369 3,702 27,889
Total assets 10,112 50,245 14,263 13,967 39,714 56,922 16,611 26,864 6,493 33,964
Current liabilities 8,678 46,170 382 418 15,080 20,875 5,866 7,852 1,577 7,081 Non-current liabilities - - 180 180 1,018 - - - 4,935 26,767
Total liabilities 8,678 46,170 562 598 16,098 20,875 5,866 7,852 6,512 33,848
Equity of subsidiaries
1,434
4,075
13,701
13,369
23,616
36,047
10,745
19,012
(19)
116 Percentage of interest
95.00%
95.00%
99.998%
99.998%
100.00%
100.00%
100.00%
100.00%
100.00%
42.50%
Interest in equity (investment)
1,362
3,871
13,701
13,369
23,616
36,047
10,745
19,012
-
49
Grendene Argentina S.A. (*)
MHL Calçados
Ltda.
Grendene USA,
Inc. (*) (**)
Grendene UK Limited (*) (**)
A3NP Indústria e Comércio de
Móveis S.A. (*) (**)
2016 2015 2016 2015 2016 2015 2016 2015 2016 2015
Revenue 1,785 56,682 3,879 5,461 44,578 34,664 13,542 9,411 1,651 2,277 Costs and expenses (12,531) (74,909) (3,546) (5,490) (62,127) (47,187) (24,356) (22,188) (37,906) (21,409)
Profit (loss) of the subsidiaries for the year (10,746) (18,227) 333 (29) (17,549) (12,523) (10,814) (12,777) (36,255) (19,132)
Percentage of interest 95.00% 95.00% 99.998% 99.998% 100.00% 100.00% 100.00% 100.00% 100.00% 42.50% Equity in the results of subsidiaries (10,209) (17,316) 333 (29) (17,549) (12,523) (10,814) (12,777) (36,236) (8,131) Unrealized profits 11 158 - - 1,594 (2,855) 26 (344) - -
Total equity in results of subsidiaries (10,198) (17,158) 333 (29) (15,955) (15,378) (10,788) (13,121) (36,236) (8,131)
Losses in subsidiary - - - - - - - (19) - Net cash provided by (used in) operating activities 23,268 21,151 584 1,559 (11,407) (15,314) (8,549) (11,964) (6,649) (13,763) Net cash provided by (used in) investing activities
-
- (5) (33) (1,486) (454) (150) (231) (5,027) (11,551)
Net cash provided by (used in) financing activities (23,508) (21,050)
-
- 10,290 14,342 8,241
12,234 12,402 21,612
Increase (decrease) in cash and cash equivalents (240) 101 579 1,526 (2,603) (1,426) (368) 39 726 (3,702)
(*) Audited by other independent auditors. (**) Amount consolidated in the subsidiary Grendene USA Inc. and indirect subsidiary Grendene New York L.L.C.; Amount consolidated in the subsidiary Grendene UK Limited and indirect subsidiary Grendene Italy, S.R.L.; and Amount consolidated in the subsidiary A3NP Indústria e Comércio de Móveis S.A. and indirect subsidiary Z Plus EUR
Company S.R.L.

(A free translation of the original in Portuguese)
GRENDENE S.A. Notes to the financial statements December 31, 2016 and 2015 (All amounts in thousands of reais)
36
12. Property, plant and equipment
Parent company
2016
Land, buildings, facilities and
leasehold improvements
Machinery, equipment, tools
and parts and replacement sets
Furniture and
fittings
Data processing
equipment PPE in
progress Other Total
Cost of PPE At the beginning of the year 322,681 326,278 22,867 27,883 15,496 4,847 720,052 Purchases 263 26,190 1,211 6,263 22,985 991 57,903 Disposals (598) (11,097) (112) (991) (2,107) (146) (15,051) Transfers 12,248 1,781 530 (18) (14,541) - -
At the end of the year 334,594 343,152 24,496 33,137 21,833 5,692 762,904
Accumulated depreciation(*) 4%, 10% e 20% 10% e 20% 10% 20% - 5% e 10% -
At the beginning of the year (153,268) (168,427) (10,633) (18,151) - (2,206) (352,685) Depreciation (16,084) (22,503) (1,866) (4,022) - (571) (45,046)
Disposals 247 9,628 64 929 - 99 10,967 Transfers (2) (6) 8 - - - -
At the end of the year (169,107) (181,308) (12,427) (21,244) - (2,678) (386,764)
Net book value At 12/31/2015 169,413 157,851 12,234 9,732 15,496 2,641 367,367
At 12/31/2016 165,487 161,844 12,069 11,893 21,833 3,014 376,140
Parent company
2015
Land, buildings, facilities and
leasehold improvements
Machinery, equipment, tools
and parts and replacement sets
Furniture and
fittings
Data processing
equipment PPE in
progress Other Total
Cost of PPE At the beginning of the year 302,737 297,542 19,857 25,221 14,418 4,620 664,395 Purchases 950 34,437 1,419 3,295 25,146 127 65,374 Disposals (32) (7,766) (181) (772) (832) (134) (9,717) Transfers 19,026 2,065 1,772 139 (23,236) 234 -
At the end of the year 322,681 326,278 22,867 27,883 15,496 4,847 720,052
Accumulated depreciation(*) 4%, 10% e 20% 10% e 20% 10% 20% - 5% e 10% -
At the beginning of the year (137,834) (154,300) (9,088) (15,585) - (1,677) (318,484) Depreciation (15,495) (21,193) (1,682) (3,170) - (619) (42,159) Disposals 4 7,064 139 661 - 90 7,958 Transfers 57 2 (2) (57) - - -
At the end of the year (153,268) (168,427) (10,633) (18,151) - (2,206) (352,685)
Net book value At 12/31/2014 164,903 143,242 10,769 9,636 14,418 2,943 345,911
At 12/31/2015 169,413 157,851 12,234 9,732 15,496 2,641 367,367

(A free translation of the original in Portuguese)
GRENDENE S.A. Notes to the financial statements December 31, 2016 and 2015 (All amounts in thousands of reais)
37
12. Property, plant and equipment--Continued
Consolidated
2016
Land, buildings, facilities and
leasehold improvements
Machinery, equipment, tools
and parts and replacement sets
Furniture and
fittings
Data processing
equipment PPE in
progress Other Total
Cost of PPE At the beginning of the year 343,752 328,542 25,658 29,431 15,496 4,919 747,798 Specific reversal 4,813 - 1,008 97 - 11,045 16,963 Purchases 918 26,190 1,469 6,266 22,985 1,474 59,302 Disposals (14,387) (11,097) (498) (1,046) (2,107) (2,356) (31,491) Transfers 12,248 1,781 530 (18) (14,541) - - Foreign exchange variation (3,644) - (600) (252) - (27) (4,523) Provision for losses - - - - - (4,892) (4,892)
At the end of the year 343,700 345,416 27,567 34,478 21,833 10,163 783,157
Accumulated depreciation(*) 4%, 10% e 20% 10% e 20% 10% 20% - 5% e 10% -
At the beginning of the year (159,416) (170,108) (12,247) (19,410) - (2,279) (363,460) Specific reversal (64) - (196) (36) - (906) (1,202)
Depreciation (17,514) (22,730) (2,253) (4,138) - (1,479) (48,114) Disposals 4,354 9,628 191 948 - 171 15,292 Transfers (2) (6) 8 - - - - Foreign exchange variation 875 - 322 201 - - 1,398
At the end of the year (171,767) (183,216) (14,175) (22,435) - (4,493) (396,086)
Net book value At 12/31/2015 184,336 158,434 13,411 10,021 15,496 2,640 384,338
At 12/31/2016 171,933 162,200 13,392 12,043 21,833 5,670 387,071
Consolidated
2015
Land, buildings, facilities and
leasehold improvements
Machinery, equipment, tools
and parts and replacement sets
Furniture and fittings
Data processing
equipment PPE in
progress
Other Total
Cost of PPE At the beginning of the year 317,899 299,783 21,568 26,334 14,418 12,604 692,606 Purchases 1,084 34,460 1,866 3,389 25,146 127 66,072 Disposals (557) (7,766) (274) (825) (832) (8,069) (18,323) Transfers 19,026 2,065 1,772 139 (23,236) 234 - Foreign exchange variation 6,300 - 726 394 - 23 7,443
At the end of the year 343,752 328,542 25,658 29,431 15,496 4,919 747,798
Accumulated depreciation(*) 4%, 10% e 20% 10% e 20% 10% 20% - 5% e 10% -
At the beginning of the year (140,464) (155,757) (10,042) (16,437) - (1,727) (324,427) Depreciation (17,700) (21,417) (1,922) (3,292) - (619) (44,950) Disposals 19 7,064 156 680 - 90 8,009 Transfers 57 2 (2) (57) - - - Foreign exchange variation (1,328) - (437) (304) - (23) (2,092)
At the end of the year (159,416) (170,108) (12,247) (19,410) - (2,279) (363,460)
Net book value At 12/31/2014 177,435 144,026 11,526 9,897 14,418 10,877 368,179
At 12/31/2015 184,336 158,434 13,411 10,021 15,496 2,640 384,338
(*) The Company depreciates property, plant and equipment on the straight-line
method, based on the estimated useful lives of the assets.
Depreciation costs and expenses are recorded in the profit and loss account, net of PIS/COFINS credits, as follows:

(A free translation of the original in Portuguese)
GRENDENE S.A. Notes to the financial statements December 31, 2016 and 2015 (All amounts in thousands of reais)
38
12. Property, plant and equipment--Continued Parent company Consolidated
2016 3 2015 2016 3 2015
Cost of goods sold (38,790) (36,539) (39,010) (36,758) Selling expenses (1,443) (1,522) (2,926) (3,815) General and administrative expenses (3,651) (3,042) (5,002) (4,212)
(43,884) (41,103) (46,938) (44,785)
Certain property, plant and equipment items are pledged in guarantee of borrowings, as disclosed in Note 14.c.
13. Intangible assets
Parent Company
2016
Software Trademarks and patents Goodwill Technology
Development of software Total
Cost of intangible assets
At the beginning of the year 49,117 17,444 4,374 6,375 2,137 79,447 Purchases 1,191 1,879 - 1,617 2,210 6,897
Disposals (449) (7) - - - (456)
Transfers 2,960 - - - (2,960) -
At the end of the year 52,819 19,316 4,374 7,992 1,387 85,888
Accumulated amortization (*) 20% 10% 20% 20% - -
At the beginning of the year (31,957) (10,833) (3,779) (2,640) - (49,209) Amortization (6,361) (1,135) (415) (1,294) - (9,205)
Disposals - - - - - -
At the end of the year (38,318) (11,968) (4,194) (3,934) - (58,414)
Net book value
At 12/31/2015 17,160 6,611 595 3,735 2,137 30,238
At 12/31/2016 14,501 7,348 180 4,058 1,387 27,474
Parent company
2015
Software Trademarks and patents Goodwill Technology
Development of software Total
Cost of intangible assets
At the beginning of the year 47,488 15,348 4,374 4,660 462 72,332
Purchases 1,158 2,099 - 1,715 2,160 7,132
Disposals (14) (3) - - - (17)
Transfers 485 - - - (485) -
At the end of the year 49,117 17,444 4,374 6,375 2,137 79,447
Accumulated amortization (*) 20% 10% 20% 20% - -
At the beginning of the year (25,774) (9,843) (3,102) (1,823) - (40,542)
Amortization (6,191) (990) (677) (817) - (8,675)
Disposals 8 - - - - 8
At the end of the year (31,957) (10,833) (3,779) (2,640) - (49,209)
Net book value
At 12/31/2014 21,714 5,505 1,272 2,837 462 31,790
At 12/31/2015 17,160 6,611 595 3,735 2,137 30,238

(A free translation of the original in Portuguese)
GRENDENE S.A. Notes to the financial statements December 31, 2016 and 2015 (All amounts in thousands of reais)
39
13. Intangible assets--Continued Consolidated
2016
Software Trademarks and patents Goodwill Technology
Development of software
Goodwill
Other Total
Cost of intangible assets
At the beginning of the year 49,903 19,415 4,374 6,375 2,137 - - 82,204
Specific reversal 113 2,194 - - - 2,069 8,142 12,518
Purchases 1,191 2,397 - 1,617 2,210 - 4,751 12,166
Disposals (500) (18) - - - (2,069) (2,196) (4,783)
Transfers 2,960 - - - (2,960) - - -
Foreign exchange variation (151) (352) - - - - - (503)
Provision for losses - (2,058) - - - - (9,146) (11,204)
At the end of the year 53,516 21,578 4,374 7,992 1,387 - 1,551 90,398
Accumulated amortization (*) 20% 10% 20% 20% - - - -
At the beginning of the year (32,687) (10,846) (3,779) (2,640) - - - (49,952) Specific reversal (41) - - - - - (349) (390)
Amortization (6,402) (1,137) (415) (1,294) - - (516) (9,764)
Disposals 25 - - - - - - 25
Foreign exchange variation 125 - - - - - - 125
At the end of the year (38,980) (11,983) (4,194) (3,934) - - (865) (59,956)
Net book value At 12/31/2015 17,216 8,569 595 3,735 2,137 - - 32,252
At 12/31/2016 14,536 9,595 180 4,058 1,387 - 686 30,442
Consolidated
2015
Software Trademarks and patents Goodwill Technology
Development of software
Goodwill Other Total
Cost of intangible assets
At the beginning of the year 48,077 18,444 4,374 4,660 462 10,931 5,719 92,667
Purchases 1,179 2,099 - 1,715 2,160 - - 7,153
Disposals (84) (1,753) - - - (10,931) (5,719) (18,487)
Transfers 485 - - - (485) - - -
Foreign exchange variation 246 625 - - - - - 871
At the end of the year 49,903 19,415 4,374 6,375 2,137 - - 82,204
Accumulated amortization (*) 20% 10% 20% 20% - - - -
At the beginning of the year (26,261) (9,854) (3,102) (1,823) - - - (41,040)
Amortization (6,216) (992) (677) (817) - - - (8,702)
Disposals 16 - - - - - - 16
Foreign exchange variation (226) - - - - - - (226)
At the end of the year (32,687) (10,846) (3,779) (2,640) - - - (49,952)
Net book value
At 12/31/2014 21,816 8,590 1,272 2,837 462 10,931 5,719 51,627
At 12/31/2015 17,216 8,569 595 3,735 2,137 - - 32,252
(*) The Company amortizes its intangible assets based on the acquisition cost.

(A free translation of the original in Portuguese)
GRENDENE S.A. Notes to the financial statements December 31, 2016 and 2015 (All amounts in thousands of reais)
40
13. Intangible assets--Continued Amortization costs and expenses are recorded in the profit and loss account, net of PIS/COFINS credits, as follows:
Parent company Consolidated
2016 3 2015 2016 3 2015
Cost of goods sold (3,783) (3,120) (3,785) (3,122) Selling expenses (1,479) (1,610) (1,498) (1,632) General and administrative expenses (3,589) (3,651) (4,128) (3,941)
(8,851) (8,381) (9,411) (8,695)
On December 31, 2016 and 2015, the Company does not have internally generated intangible assets.
14. Borrowings
Parent company Consolidated
Index Interest rate
(p.a.)
2016
2015
2016
2015
In local currency Property, plant and equipment Fixed 4.31%
53,039
61,651 53,039 61.651
Proapi - Provin
Long-term Interest Rate
(TJLP) -
14,249
24,594 14,249 24.594
67,288 86,245 67,288 86.245 In foreign currency
Working capital Argentinean
pesos 27.75% e 26.88%
-
- 7,814 35.414
Working capital – ACE US Dollar + 3.87% e 2.24% 50,270 91,166 50,270 91.166
50,270 91,166 58,084 126.580
Total borrowings 122,683 117,558 177,411 117,558 125,372 177,411 212,825 (-) Total current liabilities (50,893) (62,920) (106,238) (62,920) (70,734) (106,238) (141,652)
Total non-current liabilities 71,790 54,638 71,173 54,638 54,638 71,173 71,173
a) Financing – Proapi and Provin
The Company enjoys tax incentives with respect to its activities in the State of Ceará, by means of financing obtained from the Industrial Development Fund of Ceará (FDI) through the financial agent accredited by the fund. Such financing is based on ICMS due (Provin) and on exported products (Proapi), computed on a monthly basis. The financing is settled within a period ranging from 36 to 60 months after the release of the funds. Management believes that the benefit of the reduction should be recorded at the time the financing is obtained, so as to reflect the accrual method of accounting more accurately, since the cost of ICMS and exports related to operations entitled to the incentive are recorded concomitantly with the benefits.

(A free translation of the original in Portuguese)
GRENDENE S.A. Notes to the financial statements December 31, 2016 and 2015 (All amounts in thousands of reais)
41
14. Borrowings--Continued
a) Financing – Proapi and Provin--Continued On December 31, 2016, portions of this financing that are not subject to tax incentives amounting to R$1,809 and R$12,440 (R$4,593 and R$20,001 in 2015) are recorded as current and non-current liabilities, respectively. Under the Proapi Program, the financing is granted based on 11% of the Free on Board (FOB) export value, is payable within 60 months and is subject to the long-term interest rate (TJLP). At maturity, the Company pays 10% of the financing debt balance and the remaining 90% is waived, representing a net incentive of 9.9% of the FOB value.
b) Payment schedule
The long-term portions of borrowings are due as follows:
Long-term portions
Maturity 2018 2019 2020 2021 Total
Bank financing 10,808 10,708 10,341 10,341 42,198
Proapi - - - 6,935 6,935
Provin 1,819 1,568 1,094 1,024 5,505
Total 12,627 12,276 11,435 18,300 54,638
c) Guarantees
Guarantees for borrowings are as follows: a) statutory lien on financed machinery and equipment; b) land and buildings; and c) personal sureties provided by the Company's stockholders. The existing guarantees are for the financed amounts.
15. Provisions for labor, tax, civil and environmental risks
a) Probable loss risk – Provided for
The Company is the defendant in certain labor and civil claims. The estimated loss was provisioned based on the opinion of the legal advisors, in an amount considered sufficient to cover probable losses that could arise in the event of unfavorable court decisions. The changes in the provision for labor and civil risks were as follows:

(A free translation of the original in Portuguese)
GRENDENE S.A. Notes to the financial statements December 31, 2016 and 2015 (All amounts in thousands of reais)
42
15. Provisions for labor, tax, civil and environmental risks--Continued
a) Probable loss risk – Provided for--Continued
Parent Company Consolidated
2016 2015 2016 2015
Labor Civil Labor Labor Civil Labor
Balance at the beginning of the year
1,897
-
1,950
2,883
-
2,159
Additions 2,376 7,327 1,004 2,812 7,327 1,932 Realizations (1,703) (7,327) (640) (1,718) (7,327) (640) Reversals (108) - (417) (517) - (417) Exchange variation - - - (265) - (151)
Balance at the end of the year 2,462 - 1,897 3,195 - 2,883 (-) Total current liabilities (1,932) - (1,769) (2,485) - (2,575)
Total non-current liabilities 530 - 128 710 - 308
b) Possible loss risk – Not provided for
The Company has labor, tax, civil and environmental contingencies involving risks classified by management as possible losses, based on the evaluation of the legal advisors, for which no provision was recognized. The analysis and the estimates are as follows:
Parent company Consolidated
2016 2015 2016 2015
Labor 6,383 5,948 7,499 7,057 Tax PIS and COFINS 672 672 672 672 INSS 383 383 383 383 Civil 9,157 11,362 9,157 11,362 Environmental 500 500 500 500
17,095 18,865 18,211 19,974
16. Equity
a) Capital
On December 31, 2016 and 2015, fully subscribed and paid-up capital comprises 300,720,000 common shares of R$4.09 each, which comprise voting shares of a sole class in relation to stockholder rights, observing the applicable legal conditions.

(A free translation of the original in Portuguese)
GRENDENE S.A. Notes to the financial statements December 31, 2016 and 2015 (All amounts in thousands of reais)
43
16. Equity--Continued
b) Capital reserves
This refers to the amount of the stock option or share subscription plan granted by the Company to its officers, as described in Note 21.
c) Treasury shares
In order to comply with the stock option or subscription plan (Note 21), the program for acquisition of 1,500,000 registered common shares was approved at the 63th Board of Directors Meeting held on February 25, 2016, without capital reduction. This amount of registered common shares corresponds to 1.82% of the outstanding shares.
Pursuant to CVM Instruction 567/15, the maximum term for the program is less than 18 months, as of the approval by the Board of Directors. The changes in treasury shares were as follows:
Parent company
Common shares R$
Balance at the beginning of the year 65,026 1,052
Repurchases 637,840 11,020 Exercise of share purchase options (Note 21) (632,566) (10,903)
Balance at the end of the year 70,300 1,169
In the year ended December 31, 2016, the average purchase cost of these shares was R$17.28 (R$15.31 in 2015), the lowest cost being R$16.04 (R$14.92 in 2015) and the highest cost R$17.60 (R$15.40 in 2015).
d) Revenue reserves
Legal reserve
This reserve is credited with 5% of the profit for the year, less the amount of tax incentives, and is limited to 20% of the company’s share capital. The balance is R$127,572 on December 31, 2016 (R$109,078 in 2015).

(A free translation of the original in Portuguese)
GRENDENE S.A. Notes to the financial statements December 31, 2016 and 2015 (All amounts in thousands of reais)
44
16. Equity--Continued
d) Revenue reserves--Continued
Reserve for acquisition of shares
The balance of R$15,695 on December 31, 2016 (R$16,118 in 2015), refers to the amount retained for redemption, repurchase or acquisition of shares in the company, which may include compliance with its obligations to deliver shares to participants in the company’s stock options plan. The reserve for acquisition of shares may be formed from up to 100% of the profit remaining after the legal and statutory deductions, and is limited to a maximum of 20% of the company’s share capital.
Tax incentives
This reserve is constituted for the tax benefits received by the company under governmental subsidies to encourage investment, as shown in Note 17. Parent company / Consolidated
2016
ICMS and Exports
Income tax
Tax incentives
Balance at the beginning of the year 720,225 425,153 1,145,378
Incentives generated by the operation 188,830 75,785 264,615
Balance at the end of the year 909,055 500,938 1,409,993
Parent company / Consolidated
2015
ICMS and Exports
Income tax Tax
incentives
Balance at the beginning of the year 532,537 351,522 884,059 Incentives generated by the operation 195,589 76,046 271,635 (*) Reversal of reserve reflecting subsidiary (7,901) (2,415) (10,316)
Balance at the end of the year 720,225 425,153 1,145,378
(*) The reserve reflecting a reserve in a subsidiary is in the group of items relating to tax incentives, but does not originate from tax incentives of the holding company. Constitution of this amount arises by the equity method from the tax incentive items specific to the subsidiary MHL. The tax amounts arising in the subsidiary MHL are reported and held in that company’s Stockholders’ equity.
e) Other comprehensive income
These adjustments refer to the effects of the conversion from the functional currency to the reporting currency of foreign investments accounted for under the equity method.
(A free translation of the original in Portuguese)
GRENDENE S.A. Notes to the financial statements December 31, 2016 and 2015 (All amounts in thousands of reais)
45
16. Equity--Continued
f) Dividends and interest on Equity (counted as part of total dividends)
In accordance with the Company's bylaws, the minimum mandatory dividend is calculated as 25% of the profit for the year, after deduction of the transfers to reserves required by law. Based on the profits for the years ended December 31, 2016 and 2015 and on the Company's capacity of generating operating cash, management submitted for approval, at the General Meeting of Stockholders, the distribution of dividends above the minimum mandatory, as follows:
2016 2015
Profit for the year 634,492 551,223
(-) Legal reserve (18,494) (13,979) (-) Tax incentive reserve (264,615) (271,635)
Minimum mandatory dividends calculation basis related o the profit for the year 351,383 265,609
Minimum mandatory dividend – 25% 87,846 66,402
(+)Reversal of reserve reflecting subsidiary - 10,316
Dividends calculation basis related to the profit for the year 351,383 275,925
Minimum mandatory dividend – 25% 87,846 66,402 Dividend proposed in addition to the minimum mandatory amount 263,537 209,523
Total of dividends proposed by management 351,383 275,925
Allocation of the proposed payments Interim dividends paid 172,789 165,031 Interest on Equity (counted as part of total dividends) 160,000 100,000 Reversal of reserve reflecting subsidiary - 10,316 Balance of dividends for the year 18,594 578
351,383 275,925
Of the amount proposed in the year ended December 31, 2015, R$165,031 was paid during 2015, and the remaining balance of R$10,894 and interest on Equity the amount of R$100,000 (R$85,000 net of withholding income tax) was settled on April 27, 2016.

(A free translation of the original in Portuguese)
GRENDENE S.A. Notes to the financial statements December 31, 2016 and 2015 (All amounts in thousands of reais)
46
16. Equity--Continued
f) Dividends and interest on Equity (counted as part of total dividends)--Continued In 2016, the Company's Board of Directors approved the payment of interim dividends amounting to R$172,789, distributed as follows: R$51,191 (representing R$0.1702 per share) on May 18, 2016, R$45,505 (representing R$0.1513 per share) on August 17, 2016 and R$76,093 (representing R$0.2530 per share) on November 16, 2016. And interest on Equity the amount of R$30,000 (R$25,500 net of withholding income tax) which were paid on May 18, 2016.
The Company calculated Interest on Equity using the Long-term Interest Rate (TJLP) in effect during the year. Management has proposed the amount of R$130,000 (R$110,500 net of withholding income tax). This is counted as part of the total of dividends. Interest on Equity is reported in Stockholders’ equity.
Additionally, on December 31, 2016, management proposed a complementary payment of dividends in the amount of R$18,594 (representing R$0.0618 per share), the result is a total dividend of R$351,383 (R$327,383, net of the income tax withheld at source on Interest on Equity), after the deductions required by law and the by-laws.
g) Earnings per share
Reconciliation of net income to the amounts used to calculate basic and diluted earnings per share (all amounts in thousands of reais, except earnings per share), are as follows: Parent company
2016 2015
Numerator
Profit for the year 634,492 551,223
Denominator Weighted average number of common shares 300,720,000 300,720,000 Weighted average number of common treasury shares (20,513) (187,351)
300,699,487 300,532,649
Basic earnings per common share 2.1101 1.8342
Weighted average number of outstanding common shares 300,699,487 300,532,649 Potential increase in common shares due to the stock option or subscription plan 609,745
604,061
301,309,232 301,136,710
Diluted earnings per common share 2.1058 1.8305

(A free translation of the original in Portuguese)
GRENDENE S.A. Notes to the financial statements December 31, 2016 and 2015 (All amounts in thousands of reais)
47
17. Government grants for investments
a) Incentives – Provin and Proapi
Provin – Program of Incentive to the Industrial Development Fund of Ceará (FDI), which consists of the deferral equivalent to 81% of the effectively paid ICMS, levied on the Company's production. Of the amount of each portion of the benefit, the equivalent to 1% will be paid at once, on the last day of the maturity month, after 60 months and will be dully restated, from the date of the disbursement up to the maturity date, by applying the Long-Term Interest Rate (TJLP).
Periods of expiration of this benefit
Industrial units Incentive % Expiration period % Expiration period
Sobral – CE PROVIN - ICMS 81% Up to Feb/2019 75% Mar/2019 to Apr/2025
Crato – CE PROVIN - ICMS 81% Up to Sep/2022 75% Oct/2022 to Apr/2025
Fortaleza – CE PROVIN - ICMS 81% Up to Apr/2025
Proapi – Program of Incentives for the Port and Industrial Activities of Ceará, consists of the financing for the manufacturing companies, mainly exporting companies of footwear and artifacts of fur and leather, except for "wet blue", headquartered in the state, through the use of funds arising from the returns from the FDI operations while not credited to the State treasury account (Note 14).
Period of expiration of this benefit
Industrial units Incentive Expiration period
Sobral – CE PROAPI - EXPORT Up to Mar/2017
For the year ended December 31, 2016 the Company recognized R$188,830 (R$195,589 in 2015), related to the tax incentive portions of such incentives, in net sales revenue, as disclosed in Note 22. These amounts were allocated to the Tax Incentives Reserve account in Profit reserves.
For the year ended December 31, 2016 the Company had amounts securities receivable recognized in Assets, for the Proapi incentives, totaling R$80,795 (R$89,231 in 2015).

(A free translation of the original in Portuguese)
GRENDENE S.A. Notes to the financial statements December 31, 2016 and 2015 (All amounts in thousands of reais)
48
17. Government grants for investments--Continued
b) Incentives – Procomex and Probahia
Procomex – Program of Incentive of Foreign Trade, with the purpose of stimulating exports of products manufactured in the State of Bahia and the financing of the tax on import of products for sale and manufacture promoted by industrial units headquartered in the state. Subsidiary MHL Calçados Ltda. has ICMS tax credit equivalent to 11% of the FOB value of the transactions of exports of footwear and its components. The incentive is valid up to December 2021. Probahia – Program for the Development of Bahia, with the purpose of promoting diversification, and stimulating transformation and industrial processes of the state.
Subsidiary MHL Calçados Ltda. has ICMS tax credit of 90% of the incurring tax on transactions of output and footwear and its components and deferral of the ICMS paid in relation to the differential of rate by the acquisition of property, plant and equipment and in the imports and internal operations with inputs, packages and components, for the moment in which the output of their products occurs. The incentive is valid up to November 2021. For the year ended December 31, 2016 the parent company recognized R$121 (R$176 in 2015), related to the tax incentive portions of such incentives, in net sales revenue, as disclosed in Note 22. These amounts were allocated to the Tax Incentives Reserve account in Profit reserves.
c) Income tax incentive
The Company and its subsidiary MHL Calçados Ltda. benefit from the incentive of decrease of 75% of the income tax calculated based on the operation profit, in the industrial units headquartered in the operation area of the Superintendence for the Development of the Northeast (SUDENE). For the year ended December 31, 2016, the company recorded the amount of R$75,785, in Income tax, in the Profit and loss account (R$76,046 in 2015) for the amount of this incentive, as shown in Note 18. These amounts were allocated to the Tax Incentives Reserve account in Profit reserves.

(A free translation of the original in Portuguese)
GRENDENE S.A. Notes to the financial statements December 31, 2016 and 2015 (All amounts in thousands of reais)
49
17. Government grants for investments--Continued
c) Income tax incentive--Continued
Periods of expiration of this benefit
Industrial units % of decrease in tax Expiration period
Sobral – CE 75% Up to Dec/2022 75% Up to Dec/2023
Fortaleza – CE 75% Up to Dec/2020
Crato – CE 75% Up to Dec/2016
Teixeira de Freitas – BA 75% Up to Dec/2017
18. Income tax and social contribution tax
a) Current income tax and social contribution tax
Current income tax and social contribution tax amounts recorded in the expense for the year, net of tax incentives, are as follows:
Parent company
2016 2015
Income tax
Social contribution
Total
Income tax
Social contribution
Total
Amount due (86,785) (33,671) (120,456) (108,784) (41,970) (150,754) Tax incentives 75,785 - 75,785 76,046 - 76,046
(11,000) (33,671) (44,671) (32,738) (41,970) (74,708)
Consolidated
2016 2015
Income tax
Social contribution
Total
Income tax
Social contribution
Total
Amount due (86,810) (33,688) (120,498) (108,731) (41,970) (150,701) Tax incentives 75,785 - 75,785 76,046 - 76,046
(11,025) (33,688) (44,713) (32,685) (41,970) (74,655)

(A free translation of the original in Portuguese)
GRENDENE S.A. Notes to the financial statements December 31, 2016 and 2015 (All amounts in thousands of reais)
50
18. Income tax and social contribution tax--Continued
b) Deferred income tax and social contribution tax
Deferred income tax and social contribution tax are comprised as follows:
Parent company Consolidated
2016 2015 2016 2015
Income tax Estimated losses on doubtful receivables 485 365 771 664 Punctuality discounts estimated 1,568 1,522 1,569 1,523 Adjustment to Present Value (AVP) 953 739 953 791 Estimated losses for obsolete inventory 749 523 749 543 Provision for labor risks 154 119 352 185 Tax losses in subsidiaries - - 135 140 Hedging transactions (162) 259 (162) 259 Interest on Equity (counted as part of total dividends 32,500 25,000 32,500 25,000 Other 267 369 (247) 146
36,514 28,896 36,620 29,251
Social contribution tax Estimated losses on doubtful receivables 698 525 698 527 Punctuality discounts estimated 2,258 2,192 2,260 428 2,194 Adjustment to Present Value (AVP) 1,373 1,064 1,373 1,064 Estimated losses for obsolete inventory 1,078 753 1,078 753 Provision for labor risks 221 171 240 189 Tax losses in subsidiaries - - 194 201 Hedging transactions (233) 373 (233) 373 Interest on Equity (counted as part of total dividends 11,700 9,000 11,700 9,000 Other 384 531 2 2
17,479 14,609 17,312 14,303
Non-current assets 53,993 43,505 53,932 43,554
c) Changes in deferred income tax and social contribution tax
Parent company Consolidated
2016 2015 2016 2015
Balance at the beginning of the year 43,505 7,852 43,554 13,530 Taxes recorded in the result for the year 10,488 35,653 10,556 30,887 Taxes recorded in equity - - (178) (863)
Balance at the end of the year 53,993 43.505 53,932 43,554

(A free translation of the original in Portuguese)
GRENDENE S.A. Notes to the financial statements December 31, 2016 and 2015 (All amounts in thousands of reais)
51
18. Income tax and social contribution tax--Continued
d) Reconciliation of tax expense to statutory rates
The income tax and social contribution calculated based on statutory rates can be reconciled to the amounts recorded as expenses as follows:
Party company
2016 2015 Income
tax Social
contribution Income
tax Social
contribution
Pretax profit 668,675 668,675 590,278 590.278
Income tax and social contribution tax (at nominal rates of 25% and 9% respectively) (167,169) (60,181) (147,570) (53.125)
Adjustments to show effective rate
Equity in the results of subsidiaries (21,489) (7,736) (8,480) (3.053)
Non-deductible costs and expenses (1,092) (393) (3,708) (1.335)
Adjustments to present value – AVP (643) - (155) -
Stock options plan (1,321) (476) (885) (319)
Depreciation: effect of recalculation - - (133) - Foreign exchange differences on foreign
subsidiaries 2,870 1,033 (4,214) (1.517)
Hedge transactions 1,261 - (1,351) -
Unrealized profit on inventories 306 - (570) - Special System for Refund of Tax Amounts to
Exporting Companies (Reintegra) 129 47 1,669 600
State tax incentives 47,208 16,995 48,897 17.603
Technological innovation incentive 7,817 2,369 7,419 2.671
PAT corporate tax incentive deductions 2,215 - 2,798 - Corporate tax incentive deductions
(Rouanet Law / Child and Adolescent Rights Fund – Funcriança/Audiovisual / Sports/ Fund for the Elderly / National Program to Support Oncology Care – Pronon/ National Program to Support Person with Disabilities– Pronas) 3,271 - 4,975 -
Provision for losses in subsidiary 6,995 2,518 (7,000) (2.520) Interest on Equity (counted as part of total
dividends 40,000 14,400 25,000 9.000
Other 475 623 202 -
Amount before deduction of corporate tax incentives (79,167) (30,801) (83,106) (31.995)
Tax incentive reductions of corporate income tax (calculated on operational profit) 75,785 - 76,046 -
Amount posted in profit and loss account (3,382) (30,801) (7,060) (31.995)
Total taxes posted in profit and loss account (34,183) (39,055)
Current taxes (44,671) (74,708)
Deferred taxes 10,488 35,653
Effective rate 5.1% 6.6%

(A free translation of the original in Portuguese)
GRENDENE S.A. Notes to the financial statements December 31, 2016 and 2015 (All amounts in thousands of reais)
52
18. Income tax and social contribution--Continued
d) Reconciliation of tax expense to statutory rates--Continued
Consolidated
2016 2015 Income
tax Social
contribution Income
tax Social
contribution
Pretax profit 668,112 668,112 583,079 583.079
Income tax and social contribution tax (at nominal rates of 25% and 9% respectively) (167,028) (60,130) (145,770) (52.477)
Adjustments to show effective rate
Non-deductible costs and expenses (1,093) (394) (3,708) (1.335)
Adjustments to present value – AVP (643) - (155) -
Stock options plan (1,321) (476) (885) (319)
Depreciation: effect of recalculation - - (133) - Foreign exchange differences on foreign
subsidiaries 2,870 1,033 (4,214) (1.517)
Hedge transactions 1,261 - (1,351) -
Unrealized profit on inventories 306 - (570) - Special System for Refund of Tax Amounts to
Exporting Companies (Reintegra) 129 47 1,669 600
State tax incentives 47,238 17,006 48,941 17.619
Technological innovation incentive 7,817 2,369 7,419 2.671
PAT corporate tax incentive deductions 2,216 - 2,798 - Corporate tax incentive deductions
(Rouanet Law / Child and Adolescent Rights Fund – Funcriança/Audiovisual / Sports/ Fund for the Elderly / National Program to Support Oncology Care – Pronon/ National Program to Support Person with Disabilities– Pronas) 3,271 - 4,975 -
Provision for losses in subsidiary 6,995 2,518 (7,000) (2.520) Interest on Equity (counted as part of total
dividends 40,000 14,400 25,000 9.000
Other / Provisions (21,281) (7,052) (14,581) (3.971)
Amount before deduction of corporate tax incentives (79,263) (30,679) (87,565) (32.249)
Tax incentive reductions of corporate income tax (calculated on operational profit) 75,785 - 76,046 -
Amount posted in profit and loss account (3,478) (30,679) (11,519) (32.249)
Total taxes posted in profit and loss account (34,157) (43,768)
Current taxes (44,713) (74,655)
Deferred taxes 10,556 30,887
Effective rate 5.1% 7.5%
19. Financial instruments and risk management
The Company has transactions with financial instruments, the risks of which are managed through financial position strategies and exposure limit systems. All transactions are fully recognized in the accounting records. The valuation of financial instruments, including derivatives, as well as the risk management, is presented below:

(A free translation of the original in Portuguese)
GRENDENE S.A. Notes to the financial statements December 31, 2016 and 2015 (All amounts in thousands of reais)
53
19. Financial instruments and risk management--Continued
a) Financial instruments
The main financial instruments on December 31, 2016 and 2015 were as follows:
Cash and cash equivalents – classified as loans and receivables and measured at fair value, which approximates the carrying amount.
Financial investments – financial investments classified as "held-to-maturity" are measured at amortized cost using the effective interest rate method, and those classified as "financial assets at fair value through profit or loss" are measured at fair value.
Trade receivables – classified as loans and receivables and arise directly from the Company's sales operations. They are carried at their original amounts, adjusted by foreign exchange and monetary variations, and the estimated losses on impaired receivables, and discounts for prompt payments and the adjustment to present value.
Trade payables and commissions payable – these are classified as liabilities measured at amortized cost and arise directly from the Company's commercial operations. They are carried at their original amounts, adjusted by foreign exchange and monetary variations, when applicable.
Borrowings – classified as financial liabilities measured at amortized cost using the effective interest rate method, and are carried at their contractual amounts. The fair values of borrowings approximate their carrying amounts at the balance sheet date.
The main financial instruments of the Company and its subsidiaries on December 31, 2016 and 2015 were as follows:

(A free translation of the original in Portuguese)
GRENDENE S.A. Notes to the financial statements December 31, 2016 and 2015 (All amounts in thousands of reais)
54
19. Financial instruments and risk management--Continued
a) Financial instruments--Continued
Parent company Consolidated
2016 2015 2016 2015
Financial assets
Cash and cash equivalents 8,184 6,113 20,663 21,285 Financial investments (*) 1,568,715 1,260,595 1,568,715 1,260,595 Trade receivables 756,360 832,140 760,953 854,991 Derivatives 2,586 - 2,586 -
Financial liabilities Borrowings 117,558 177,411 125,372 212,825 Trade payables 39,965 38,225 41,369 44,903 Commissions payable 39,087 37,470 39,831 37,616 Derivatives - 4,142 - 4,142
(*) The Company measures its financial instruments at fair value through profit or loss, as required by technical pronouncement CPC 40 – R1 (IFRS 7), “Financial Instruments: Disclosures”, and in accordance with the level 1 of the hierarchy.
Level 1 – negotiated prices (with no adjustments) in active markets for identical assets or liabilities.
The fair value of financial instruments is calculated as described in Note 4.c.4.
b) Derivative financial instruments
The Company and its subsidiaries have transactions involving the following derivative financial instruments:
b.1) Foreign exchange rate hedging transactions
The strategy when contracting these transactions is to hedge the sales revenue and financial assets of the Company and its subsidiaries that is subject to foreign exchange exposure. These instruments are used for the specific purpose of hedging, and the portfolio includes sale of U.S. dollar futures through financial instruments used for this purpose such as: sales at the São Paulo Futures, Commodities and Securities Exchange – BM&F and advances on future exports (ACE).
In transactions involving BM&F sales, the impact on the cash flow of the Company and its subsidiaries is assessed through the calculation of daily adjustments to the U.S. dollar exchange rate until the settlement of the contracts.

(A free translation of the original in Portuguese)
GRENDENE S.A. Notes to the financial statements December 31, 2016 and 2015 (All amounts in thousands of reais)
55
19. Financial instruments and risk management--Continued
b) Derivative financial instruments--Continued
b.1) Foreign exchange rate hedging transactions--Continued
To reduce the net effects of exposure of its business the managers may negotiate future contracts for sale of USD on the BM&F up to the maximum limit defined by the sum of the following items: (i) bank balances in foreign currency held outside Brazil; (ii) financial investments held outside Brazil; (iii) balances of accounts receivable (denominated in USD) of exchange transactions to be contracted; (iv) up to 25% of the forecasts of annual exports equivalent to approximately 90 days of forecast exports (normally corresponding to orders in the order book and negotiations for sales in progress), less: (i) balances of suppliers held in foreign currency; (ii) imports in progress; and (iii) ACCs (Advances against exchange contract). These risks are monitored daily and administered through internal controls that aim to demonstrate the limits of exposure and adapt them to the Company’s risk management policy. Other forms of foreign exchange hedges without the express authorization of the Company's officers are not permitted. Up to date, the Company has not authorized the use of foreign exchange hedges other than those disclosed in the previous paragraph.
Foreign exchange hedging transactions are usually made with the BM&F through specialized brokers, without the need to deposit margin. The guarantee amounted to R$51,362 on December 31, 2016 (R$64,982 in 2015) and usually comprises the Company's investments in government securities, considering the limits and exposures to foreign exchange risk, as defined in the policy for management of counterparty risk. The table below shows the positions on December 31, 2016 and 2015, with the notional and fair values, which was calculated as described in Notes 4.c.1 and 4.c.2.
Notional value – US$ Notional value – R$ Amount receivable
(payable)
2016 2015 2016 2015 2016 2015
Futures contracts
Sell commitment 73,500 54,000 240,947 216,128 2,586 (4,142)

(A free translation of the original in Portuguese)
GRENDENE S.A. Notes to the financial statements December 31, 2016 and 2015 (All amounts in thousands of reais)
56
19. Financial instruments and risk management--Continued b) Derivative financial instruments--Continued
b.1) Foreign exchange rate hedging transactions--Continued
It should be noted that these transactions are linked to sales and financial assets in foreign currency, which are also subject to foreign exchange rate changes, offsetting any gains or losses. The balance receivable on December 31, 2016 in the amount of R$2,586 is classified in securities receivable, the amount payable on December 31, 2015, in the amount of R$4,142, is classified in other payables.
c) Risk management
c.1) Risk factors that may affect the business of the Company and its
subsidiaries
The Company's main financial liabilities, except derivative financial instruments, comprise borrowings and other payables. The main purpose of these financial instruments is to raise funds for the Company's operations. The Company has other credits, accounts receivable, cash and cash equivalents and short-term investments that are obtained directly from its operations.
The Company is exposed to market risk (including interest rate risk, foreign exchange risk and commodity price risk), credit risk and liquidity risk. The financial instruments which involve risks include borrowings, deposits, available-for-sale investments and derivative financial instruments.
The risk management activities follow the Company's risk management policy, which is administered by its officers. The management of these risks is effected based on a control policy, which establishes monitoring techniques, measurement and ongoing accompanying of exposure. The Company does not have transactions with speculative derivative financial instruments or any other type of speculative transactions.
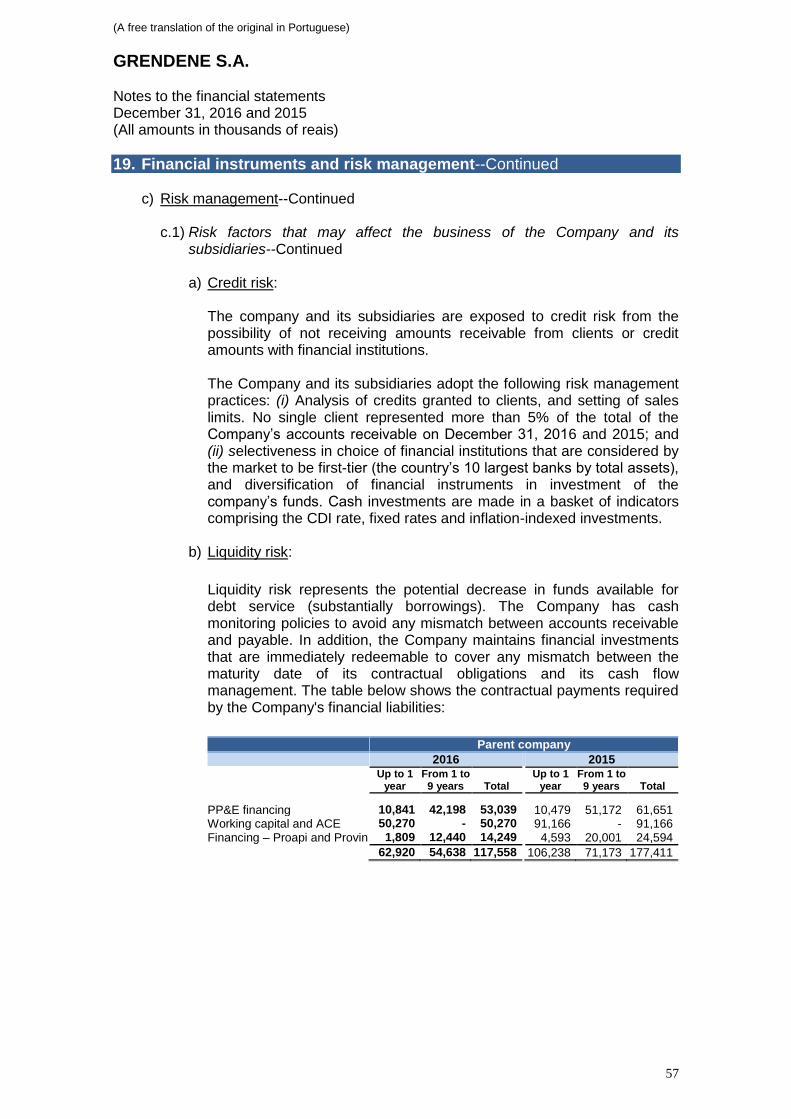
(A free translation of the original in Portuguese)
GRENDENE S.A. Notes to the financial statements December 31, 2016 and 2015 (All amounts in thousands of reais)
57
19. Financial instruments and risk management--Continued
c) Risk management--Continued
c.1) Risk factors that may affect the business of the Company and its subsidiaries--Continued
a) Credit risk:
The company and its subsidiaries are exposed to credit risk from the possibility of not receiving amounts receivable from clients or credit amounts with financial institutions. The Company and its subsidiaries adopt the following risk management practices: (i) Analysis of credits granted to clients, and setting of sales limits. No single client represented more than 5% of the total of the Company’s accounts receivable on December 31, 2016 and 2015; and (ii) selectiveness in choice of financial institutions that are considered by the market to be first-tier (the country’s 10 largest banks by total assets), and diversification of financial instruments in investment of the company’s funds. Cash investments are made in a basket of indicators comprising the CDI rate, fixed rates and inflation-indexed investments.
b) Liquidity risk:
Liquidity risk represents the potential decrease in funds available for debt service (substantially borrowings). The Company has cash monitoring policies to avoid any mismatch between accounts receivable and payable. In addition, the Company maintains financial investments that are immediately redeemable to cover any mismatch between the maturity date of its contractual obligations and its cash flow management. The table below shows the contractual payments required by the Company's financial liabilities:
Parent company
2016 2015 Up to 1
year From 1 to 9 years Total
Up to 1 year
From 1 to 9 years Total
PP&E financing 10,841 42,198 53,039 10,479 51,172 61,651 Working capital and ACE 50,270 - 50,270 91,166 - 91,166 Financing – Proapi and Provin 1,809 12,440 14,249 4,593 20,001 24,594
62,920 54,638 117,558 106,238 71,173 177,411

(A free translation of the original in Portuguese)
GRENDENE S.A. Notes to the financial statements December 31, 2016 and 2015 (All amounts in thousands of reais)
58
19. Financial instruments and risk management--Continued
c) Risk management--Continued
c.1) Risk factors that may affect the business of the Company and its subsidiaries--Continued
b) Liquidity risk:--Continued
Consolidated
2016 2015 Up to 1
year From 1 to 9 years Total
Up to 1 year
From 1 to 9 years Total
PP&E financing 10,841 42,198 53,039 10,479 51,172 61,651 Working capital and ACE 58,084 - 58,084 126,580 - 126,580 Financing – Proapi and Provin 1,809 12,440 14,249 4,593 20,001 24,594
70,734 54,638 125,372 141,652 71,173 212,825
Parent company
2016 2015 Projection including future
interest Projection including future
interest
Up to 1 year
From 1 to 9 years Total
Up to 1 year
From 1 to 9 years Total
PP&E financing 12,815 45,697 58,512 12,822 56,612 69,434 Working capital and ACE 50,865 - 50,865 91,999 - 91,999 Financing – Proapi and Provin 1,871 15,433 17,304 4,824 23,752 28,576
65,551 61,130 126,681 109,645 80,364 190,009
Parent company
2016 2015 Projection including future
interest Projection including future
interest
Up to 1 year
From 1 to 9 years Total
Up to 1 year
From 1 to 9 years Total
PP&E financing 12,815 45,697 58,512 12,822 56,612 69,434 Working capital and ACE 58,956 - 58,956 128,172 - 128,172 Financing – Proapi and Provin 1,871 15,433 17,304 4,824 23,752 28,576
73,642 61,130 134,772 145,818 80,364 226,182
c) Market risk:
Interest rate risk: This risk arises from the possibility that the Company may incur losses due to fluctuations in interest rates that lead to an increase in its finance costs related to borrowings, or a decrease in its earnings on financial investments. The Company continuously monitors the volatility of market interest rates.

(A free translation of the original in Portuguese)
GRENDENE S.A. Notes to the financial statements December 31, 2016 and 2015 (All amounts in thousands of reais)
59
19. Financial instruments and risk management--Continued
c) Risk management--Continued
c.1) Risk factors that may affect the business of the Company and its subsidiaries--Continued
c) Market risk:--Continued
In order to mitigate possible impacts from fluctuations in interest rates the Company and its subsidiaries adopt the policy of maintaining their funds invested in instruments linked to a basket of indicators such as CDI, fixed rates, or adjusted for inflation.
Foreign exchange rate risk: This risk arises from the possibility of fluctuations in foreign exchange rates, which may affect the finance cost (or income) and the liability (or asset) balance of contracts denominated in foreign currency. In addition to trade receivables originating from exports from Brazil, financial investments and foreign investments are utilized as a natural hedge against fluctuations in foreign exchange rates. For the balances of assets and liabilities subject to foreign exchange rate risk, the Company and its subsidiaries assess foreign exchange exposure and contract additional derivative financial instruments as a hedge, if necessary.
On December 31, 2016, the Company has advances on export contracts in the amount of US$15,427 thousand (US$23,315 thousand in 2015), which is consistent with the sales scheduled for the foreign market up to the maturity of the contracts. There were no other borrowings denominated in, or indexed to, foreign currencies.
Commodity price risk: This risk refers to the possibility of fluctuations in the price of raw materials and other inputs used in the production process. As the Company uses commodities as raw materials, its cost of sales can be affected by fluctuations in the international prices of these materials. In order to minimize this risk, the Company maintains ongoing monitoring of price fluctuations in the domestic and foreign markets and, if necessary, maintains strategic inventories to support its commercial activities.

(A free translation of the original in Portuguese)
GRENDENE S.A. Notes to the financial statements December 31, 2016 and 2015 (All amounts in thousands of reais)
60
19. Financial instruments and risk management--Continued
c) Risk management--Continued
c.2) Interest rate fluctuation sensitivity analysis
In order to verify the sensitivity of indices of financial investments and loans to which the Company was exposed on December 31, 2016, three different scenarios were defined and a sensitivity analysis of the fluctuation of the indices of these instruments was prepared. Based on the projection of the index of each contract for 2016 (probable scenario), decreases of 25% and 50% for financial investments and increases of 25% and 50% for loans were calculated. The scenarios do not consider the probable cash flow related to loan repayments and investment redemptions.
Earnings from financial investments as well as finance costs related to the Company's borrowings are affected by fluctuations in interest rates, such as TJLP, Amplified Consumer Price Index (IPCA), IGPM and CDI. The table below shows the outstanding positions on December 31, 2016, with the notional values and interest of each contracted instrument:
Reduction of finance
income
Increase in finance costs
Reference for
finance income
Interest on cash
investments
Reference financial liabilities
Cost of Proapi and Provin financings
CDI rate
IPCA index
TJLP rate
Probable scenario – Book value 13.63% 6.99% 128,297 7.50% 956
Possible scenario – 25% 10.22% 5.24% 103,967 9.38% 1,195
Remote scenario – 50% 6.82% 3.49% 79,456 11.25% 1,434
c.3) Sensitivity analysis of contracted derivative financial instruments
c.3.1) Foreign exchange rate hedge
The Company has projected the effect of the transactions designed for Exchange rate protection in three scenarios, considering the transactions would be settled, on the basic of the position becoming due on January 31, 2017, as follows:

(A free translation of the original in Portuguese)
GRENDENE S.A. Notes to the financial statements December 31, 2016 and 2015 (All amounts in thousands of reais)
61
19. Financial instruments and risk management--Continued
c) Risk management--Continued
c.3.1) Foreign exchange rate hedge--Continued Notional value
Short position in US$
FX rate – R$
Amount – R$
Impact – R$
Probable scenario – Book value 73,500 3.2782 240,947 2,586 Possible scenario – 25% 73,500 4.0977 301,181 (60,234) Remote scenario – 50% 73,500 4.9173 361,422 (120,475)
c.4) Capital management
Capital management mainly aims to ensure the Company's ability to continue as a going concern, maintaining a policy of low gearing ratio and thereby hedging its capital against changes in government economic policy, and maximizing stockholder value.
The Company manages the capital structure and adjusts it considering changes in the economic conditions of the country. In order to maintain or adjust the capital structure, the Company can adjust the policy for dividend payments to stockholders.
The Company's dividend policy may include tax incentives related to the Provin and Proapi programs in the dividend calculation basis, provided there is no impact on the Company's capital management objectives, policies or processes adopted. There is no impact during the years ended on December 31, 2016 and 2015.
Parent company Consolidated
2016 2015 2016 2015
Current and non-current borrowings 117,558 177,411 125,372 212,825 (-) Cash and cash equivalents (8,184) (6,113) (20,663) (21,285)
Net debt 109,374 171,298 104,709 191,540
Equity 2,921,998 2,616,489 2,922,070 2,616,760
Gearing ratio 3.7% 6.5% 3.6% 7.3%

(A free translation of the original in Portuguese)
GRENDENE S.A. Notes to the financial statements December 31, 2016 and 2015 (All amounts in thousands of reais)
62
20. Balances and transactions with related parties
During the years, the Company carried out the following transactions with related parties:
a) Amounts and transactions receivable and payable – Related parties
Parent Company Balances Transactions
Other
receivables Other
payables
Accounts receivable from sales
Trade payables
Sales of goods and
PPE
Purchases of goods and services
Recovery of expenses
Finance income
Finance costs
Direct subsidiaries
Grendene Argentina S.A.
At 12/31/2016 - - - - - - - 745 701
At 12/31/2015 - - 7,426 - 23,848 - - 96 1
MHL Calçados Ltda.
At 12/31/2016 - 3 62 - 865 8 - - -
At 12/31/2015 - - 16 4 1,675 98 - - -
Grendene USA, Inc.
At 12/31/2016 - 9,311 333 14,641 1,025 - 1,666 4,536
At 12/31/2015 - - 18,103 573 22,358 1,433 - 5,144 1,732
Grendene UK Limited.
At 12/31/2016 - - 395 - 953 - - 1,959 2,086
At 12/31/2015 - - 648 - 625 - - 2,600 2,623
A3NP Indústria e Comércio de Móveis S.A.
At 12/31/2016 5,349 19 - - - - - 2,508 (237)
At 12/31/2015 - 5,449 6 - - - 54 - 238
Indirect subsidiary
Grendene Italy SRL.
At 12/31/2016 - - 2,969 - 2,697 - - 367 896
At 12/31/2015 - - 4,178 - 3,337 - - 1,216 416
Parent Company / Consolidated Balances Transactions
Other receivables
Other payables
Accounts receivable from sales
Trade payables
Sales of goods and
PPE
Purchases of goods and services
Recovery of expenses
Finance income
Finance costs
Companies controlled by stockholders of Grendene S.A.
Vulcabrás|azaléia – CE, Calçados e Artigos Esportivos S.A.
At 12/31/2016 - - - - - 3 - - -
At 12/31/2015 - - - 46 10 490 - - -
Vulcabrás|azaléia – BA, Calçados e Artigos Esportivos S.A.
At 12/31/2015 - - - - 10 - - - - Vulcabrás|azaléia – RS, Calçados e Artigos Esportivos S.A.
At 12/31/2015 - - 3 - 25 - - - -
Vulcabrás|azaléia Argentina S.A.
At 12/31/2016 - - - - - 592 - - -
At 12/31/2015 - - 200 - 306 6,637 - - -
Vulcabrás Distribuidora de Artigos Esportivos Ltda.
At 12/31/2016 - - - - 5 - - - -
At 12/31/2015 - - 1 - 1 - - - -
Distribuidora de Calçados e Artigos Esportivos Cruzeiro do Sul Ltda.
At 12/31/2015 - - - - 5 - - - -
Calzados Azaleia Colômbia Ltda.
At 12/31/2015 - - - - 187 - - 9 12
Calzados Azaleia Peru S.A.
At 12/31/2015 - - - - 622 - - 21 16
Lagoa Clara Agrícola S.A.
At 12/31/2016 - - - - - 8 - - -
At 12/31/2015 - - - - - - 294 - -

(A free translation of the original in Portuguese)
GRENDENE S.A. Notes to the financial statements December 31, 2016 and 2015 (All amounts in thousands of reais)
63
20. Balances and transactions with related parties--Continued
b) Nature, terms and conditions of transactions
Related parties Nature of transactions Average
terms
Direct subsidiaries Grendene Argentina S.A. Sale of shoes 96 days
MHL Calçados Ltda.
Sale of inputs for the production of shoes Purchase of inputs for the production of shoes
45 days 68 days
Grendene USA, Inc.
Sale of shoes Purchases of services and referred to commissions
182 days 13 days
Grendene UK Limited. Sale of shoes 185 days
A3NP Indústria e Comércio de Móveis S.A. Recovered expenses 154 days
Indirect subsidiary Grendene Italy S.R.L. Sale of shoes 306 days
Companies controlled by stockholders of Grendene S.A.
Vulcabrás|azaleia – CE, Calçados e Artigos Esportivos S.A.
Sale of inputs for the production of shoes Purchases of services and referred to commissions Trademark use license
97 days 11 days 83 days
Vulcabrás|azaleia – BA, Calçados e Artigos Esportivos S.A. Sale of shoes 63 days
Vulcabrás|azaleia – RS, Calçados e Artigos Esportivos S.A. Sale of shoes 108 days
Vulcabrás Azaleia Argentina S.A.
Sale of inputs for the production of shoes Purchase of products and services with subsidiary Grendene Argentina
209 days 1 day
Vulcabrás Distribuidora de Artigos Esportivos Ltda. Sale of shoes 85 days
Distribuidora de Calçados e Artigos Esportivos Cruzeiro do Sul Ltda Sales of shoes 66 days
Calzados Azaleia Colômbia Ltda. Sale of shoes 19 days
Calzados Azaleia Peru S.A. Sale of shoes 18 days
Lagoa Clara Agrícola S.A. Recovered expenses Purchase of fixed assets
31 days 1 day
Alexandre G. Bartelle Participações S.A. and Verona Negócios e Participações S.A. are the controlling stockholders of Grendene S.A. There are no other transactions, except dividends paid, between the Company and its subsidiaries, in the years ended December 31, 2016 and 2015.
c) Key management compensation
Salaries and social charges for key management personnel are as follows:
Parent company
2016 2015
Board of Directors 1,056 984 Statutory Audit Board 401 356 Statutory Directors 3,915 3,576
5,372 4,916
The Company offers a stock option plan as variable compensation, as described in Note 21, having recognized as an expense the amount corresponding to the option premium on December 31, 2016 of R$5,283 (R$3,543 in 2015).

(A free translation of the original in Portuguese)
GRENDENE S.A. Notes to the financial statements December 31, 2016 and 2015 (All amounts in thousands of reais)
64
20. Balances and transactions with related parties--Continued
c) Key management compensation--Continued The Company did not pay its key management personnel compensation in the categories of: a) long-term benefits; b) employment contract termination benefits; and c) post-employment benefits.
d) Other related parties
The Company utilizes air travel advisory and agency services of companies owned by a related party. On December 31, 2016, the expenses incurred in connection with these services totaled R$533 (R$436 in 2015), representing approximately 0.03% of the Company's general expenses. There were no outstanding balances on December 31, 2016.
21. Stock option or subscription plan
At the Extraordinary General Meeting held on April 14, 2008, the Company's stockholders approved the "Stock Option or Share Subscription Plan", to be effective as from April 14, 2008, for the Company's directors and managers, except for directors nominated by the controlling stockholders. The plan is administered by the Company's Board of Directors, which may delegate this function, within the restrictions established by law to the committee created on February 12, 2015, by the 59th meeting of the Board of Directors. The share purchase options granted under the Stock Option Plan are limited to 5% of the Company's capital. The shares to be delivered as a result from the exercise of options will be issued through a resolution to increase capital, by the Board of Directors, within the Company's authorized capital, or using treasury shares, within legal limits. The Stock Option or Share Subscription Plan beneficiaries may exercise their options within 6 years from the grant date. The vesting period will be of up to 3 years, with releases of 33% after one year, 66% after two years and 100% after three years. On December 31, 2016 the company recognized an expense of R$5,283 (R$3,543 in 2015) in Personnel expenses, for stock options, based on the fair value of the transactions on the date of their being granted.

(A free translation of the original in Portuguese)
GRENDENE S.A. Notes to the financial statements December 31, 2016 and 2015 (All amounts in thousands of reais)
65
21. Stock option or subscription plan--Continued a) Summary of grants of share purchase options or subscriptions
The options granted and the related changes were as follows:
2016
Grant date
Option
exercise price
Vesting period as from grant
date
Maximum number of
shares
Opening balance
Granted
Exercised
Canceled
Anticipation of the Grace
period
Closing balance
2/24/2011 10.80 2/24/2012 580,544 5,956 - (5,956) - - - 2/24/2011 10.80 2/24/2013 1,161,088 5,956 - (5,956) - - - 2/24/2011 10.80 2/24/2014 1,741,632 53,114 - (45,065) - - 8,049 2/28/2013 9.55 2/28/2016 795,549 240,561 - (240,561) - - - 2/13/2014 9.84 2/13/2016 246,772 117,371 - (119,080) - 1,709 - 2/13/2014 9.84 2/13/2017 370,158 117,371 - - (2,758) (1,709) 112,904 2/12/2015 8.42 2/12/2016 215,518 210,298 - (215,948) - 5,650 - 2/12/2015 8.42 2/12/2017 431,036 210,298 - - (4,645) (2,825) 202,828 2/12/2015 8.42 2/12/2018 646,554 210,298 - - (4,645) (2,825) 202,828 2/25/2016 7.80 2/25/2017 297,282 - 297,282 - (2,922) - 294,360 2/25/2016 7.80 2/25/2018 594,564 - 297,282 - (2,922) - 294,360 2/25/2016 7.80 2/25/2019 891,846 - 297,282 - (2,922) - 294,360
1,171,223 891,846 (632,566) (20,814) - 1,409,689
2015
Grant date
Option
exercise price
Vesting period as from grant
date
Maximum number of
shares
Opening balance
Granted
Exercised
Canceled
Closing balance
2/24/2011 10.80 2/24/2012 580,544 5,956 - - - 5,956 2/24/2011 10.80 2/24/2013 1,161,088 5,956 - - - 5,956 2/24/2011 10.80 2/24/2014 1,741,632 357,020 - (303,906) - 53,114 3/01/2012 4.33 3/1/2013 108,949 - - - - - 3/01/2012 4.33 3/1/2014 217,898 4,654 - (4,654) - - 3/01/2012 4.33 3/1/2015 326,847 96,452 - (96,452) - - 2/28/2013 9.55 2/28/2014 265,183 26,414 - (26,414) - - 2/28/2013 9.55 2/28/2015 530,366 243,074 - (243,074) - - 2/28/2013 9.55 2/28/2016 795,549 243,074 - - (2,513) 240,561 2/13/2014 9.84 2/13/2015 123,386 118,570 - (118,570) - - 2/13/2014 9.84 2/13/2016 246,772 118,570 - - (1,199) 117,371 2/13/2014 9.84 2/13/2017 370,158 118,570 - - (1,199) 117,371 2/12/2015 8.42 2/12/2016 215,518 - 215,518 - (5,220) 210,298 2/12/2015 8.42 2/12/2017 431,036 - 215,518 - (5,220) 210,298 2/12/2015 8.42 2/12/2018 646,554 - 215,518 - (5,220) 210,298
1,338,310 646,554 (793,070) (20,571) 1,171,223
The fair value of options is calculated at the grant date of the plans, and is not subsequently remeasured since the settlement of the plan is made through equity instruments, as described in technical pronouncement CPC10 – R1 (IFRS 2) – Share-based Payment. Therefore, the Company is subject to variation of the share price in the market when the option is exercised by the beneficiaries of the plans. In 2016, the Company acquired, for the fulfillment of the plans for exercise of options of share purchase, 637,840 shares, at an average cost of R$17.28, totaling R$11,020. In 2016, 632,566 shares were exercised at an average cost of R$10.14, totaling R$6,416.

(A free translation of the original in Portuguese)
GRENDENE S.A. Notes to the financial statements December 31, 2016 and 2015 (All amounts in thousands of reais)
66
21. Stock option or subscription plan--Continued a) Summary of grants of share purchase options or subscriptions--Continued
In 2016, the Company recognized the difference between the average exercise price of the options and the average cost the shares acquired for the fulfillment of these exercises, in the amount of R$423, directly in equity, since the settlement of options plans occurs through equity instruments, as described in technical pronouncement CPC 10 – R1 (IFRS 2) – Share-based payment.
b) Changes of the operations with stock option
Changes involving issuance, exercise and cancellation of share purchase options in the year were as follows:
Plan Changes
Grace period – from grant
Number of shares
Movement in shares
Premium Expense of exercise or cancellation
Fourth
Balance at the beginning of the year - 65,026 - - - (-) Exercise of share purchase option 2/24/2012 - (5,956) 0.63 (4) (-) Exercise of share purchase option 2/24/2013 - (5,956) 1.24 (7) (-) Exercise of share purchase option 2/24/2014 - (35,945) 1.74 (63) (-) Exercise of share purchase option 2/24/2014 (9,120) 1.74 (16) Balance at the end of the year - 8,049 - - -
Sixth
Balance at the beginning of the year - 240,561 - - - (-) Exercise of share purchase option 2/28/2016 - (236,962) 8.19 (1,941) (-) Exercise of share purchase option 2/28/2016 (3,599) 8.19 (29) Balance at the end of the year - - - - -
Seventh
Balance at the beginning of the year - 234,742 - - - (-) Exercise of share purchase option 2/13/2016 - (115,662) 5.98 (692) (-) Canceled 2/13/2017 - (2,758) 6.07 (12) (-) Exercise of share purchase option 2/13/2016 (1,709) 5.98 (10) (-) Exercise of share purchase option 2/13/2017 (1,709) 6.07 (9) Balance at the end of the year - 112,904 - - -
Eighth
Balance at the beginning of the year - 630,894 - - - (-) Exercise of share purchase option 2/12/2016 - (207,473) 5.82 (1,207) (-) Canceled 2/12/2017 - (4,645) 6.10 (17) (-) Canceled 2/12/2018 - (4,645) 6.29 (11) (-) Exercise of share purchase option 2/12/2016 (2,825) 5.82 (16) (-) Exercise of share purchase option 2/12/2017 (2,825) 6.10 (14) (-) Exercise of share purchase option 2/12/2018 (2,825) 6.29 (9) Balance at the end of the year - 405,656 - - -
Nine
Balance at the beginning of the year - - - - - Share purchase options issued 891,846 - - - (-) Canceled 2/25/2017 - (2,922) 7.59 (4) (-) Canceled 2/25/2018 (2,922) 7.76 (2) (-) Canceled 2/25/2019 - (2,922) 7.83 (1) Balance at the end of the year - 883,080 - - -
Movement in Stockholders’ equity (4,064)

(A free translation of the original in Portuguese)
GRENDENE S.A. Notes to the financial statements December 31, 2016 and 2015 (All amounts in thousands of reais)
67
21. Stock option or subscription plan--Continued
c) Economic assumptions adopted for recognition of employee remuneration expenses
The Company recognizes expenses for the variable remuneration of employees based on the fair value of the options granted, which was estimated using the Black-Scholes option pricing model. The Company utilized the following economic assumptions to determine this weighted average fair value: 4
th Plan 5
th Plan 6
th Plan 7
th Plan 8
th Plan 9° Plan
Grant date 2/24/2011 3/1/2012 2/28/2013 2/13/2014 2/12/2015 2/25/2016 Total purchase options granted 1,741,632 326,847 795,549 370,158 646,554 891,846 Exercise price 10.80 4.33 9.55 9.84 8.42 8.88 Estimated volatility 27.60% 14.07% 25.51% 26.35% 26.51% 29.89% Expected dividends 4% 7% 5% 6% 5% 6% Weighted average risk-free interest rate 12.50% 9.50% 7.25% 11.25% 12.75% 14.25% Maximum maturity 6 years 6 years 6 years 6 years 6 years 6 years Average maturity 2.5 years 2.5 years 2.5 years 2.5 years 2.5 years 2.5 years Option premium 1.20 4.21 8.38 5.96 6.07 7.73
Volatility was determined based on the average historical fluctuation of the share price over the 18 months prior to the grant date.
The expected dividends were based on the average dividend payment per share in relation to the market value of the share over the last 12 months.
The Company utilizes as the risk-free interest rate the average projected Special System for Settlement and Custody (SELIC) rate published by the Central Bank of Brazil (BACEN).
The fair value of options is calculated at the grant date and recorded as an expense, on a straight-line basis, during the vesting period.
The Company is not committed to repurchase shares that were purchased by the beneficiaries.

(A free translation of the original in Portuguese)
GRENDENE S.A. Notes to the financial statements December 31, 2016 and 2015 (All amounts in thousands of reais)
68
22. Net sales and services revenue
Net sales and services revenue is comprised as follows:
Parent company Consolidated
2016 2015 2016 2015
Gross sales and services revenue 2,447,200 2,587,097 2,483,038 2,631,850 Domestic market 1,934,408 1,956,127 1,936,016 1,958,911 Adjustment to Present Value (AVP) (65,643) (59,077) (65,643) (59,077) Foreign market 527,601 622,812 560,149 664,314 Adjustment to Present Value (AVP) (2,485) (1,325) (803) (858) Tax incentives – Proapi/Procomex 52,802 61,885 52,802 61,885 Special System for Refund of Tax Amounts to Exporting Companies (Reintegra) 517 6,675 517 6,675
Sales returns (48,978) (41,998) (50,867) (43,722) Financial discounts (89,445) (90,206) (91,194) (92,658) Taxes on sales and services (398,707) (403,555) (399,749) (406,689) ICMS tax incentives – Provin/ Development Promotion Program of the State of Bahia (Probahia) 136,028 133,704 136,149 133,880 INSS (28,377) (19,824) (28,413) (19,865) State Fiscal Balance Fund (FEEF) (3,844) - (3,849) -
2,013,877 2,165,218 2,045,115 2,202,796
Taxes on sales
Sales revenues are subject to certain taxes and contributions, at the following basic rates:
Rates
Value-added tax on sales and services (ICMS) 7.00% a 19.00% Social Contribution on Revenues (COFINS) 7.60% Social Integration Program (PIS) 1.65% National Institute of Social Security (INSS) 1.50%
On September 1, 2016, Ceará State Decree 32,013 of August 16, 2016 came into force, instituting the Ceará State Fiscal Balance Fund (FEEF), to be in effect for 2 years. This fund will comprise deposits paid by companies that benefit under tax breaks in ICMS tax granted by the State of Ceará in the past or in the future. In counterpart, the tax incentives will be extended for twice the length of time for which this contribution continues to be given. Companies holding these grants have to deposit, in the FEEF, 10% of the amount of the benefit used in each ICMS tax period. There is an exception: if in any month the amount of ICMS tax due has increased by 10% year-on-year, the taxpayer is exempt from making the FEEF deposit.

(A free translation of the original in Portuguese)
GRENDENE S.A. Notes to the financial statements December 31, 2016 and 2015 (All amounts in thousands of reais)
69
23. Segment reporting
The Company and its subsidiaries operate in the footwear and furniture segments, as described in Note 4.o. In the footwear segment, although the Company's products are intended for different consumers and social classes, they are not controlled by management as independent segments, and the Company's results are accompanied, monitored and evaluated on an integrated basis. Sales in the domestic and foreign markets and non-current assets were as follows:
Parent company Consolidated
2016 2015 2015 2016 2015
Gross sales
Non-current assets
Gross sales
Non-current assets
Gross sales
Gross sales
Footwear Domestic market 1,868,765 13,701 1,897,050 13,369 1,870,200 1,899,226 Foreign market 578,435 31,450 690,047 53,026 612,504 730,761
Furniture Domestic market - - - 49 173 608 Foreign market - - - - 161 1,255
2,447,200 45,151 2,587,097 66,444 2,483,038 2,631,850
The Company’s non-current assets refer to investments in its subsidiaries: MHL Calçados Ltda. (headquartered in Brazil), Grendene Argentina S.A. (headquartered in Argentina), Grendene USA, Inc. (headquartered in the United States), Grendene UK, Limited. (headquartered in the United Kingdom) and A3NP Indústria e Comércio de Móveis S.A. (headquartered in Brazil).
The summary of the financial information of these subsidiaries is disclosed in Note 11.
The information on gross foreign sales revenue by geographic area was prepared considering the country where the revenue originated, that is, on the basis of sales realized by the parent company in Brazil and through direct and indirect subsidiaries abroad (Grendene USA, Inc., Grendene Argentina S.A., Grendene Italy S.R.L., Grendene UK, Limited. and Z Plus EUR Company S.R.L., in the United States, Argentina, United Kingdom and Italy, respectively), as follows:
Consolidated
2016 2015
Gross sales to foreign market from: Brazil 558,829 638,462 USA 40,757 34,663 Argentina 121 48,314 Italy 9,372 8,268 United Kingdom 3,586 2,309
612,665 732,016

(A free translation of the original in Portuguese)
GRENDENE S.A. Notes to the financial statements December 31, 2016 and 2015 (All amounts in thousands of reais)
70
23. Segment reporting--Continued
No customer individually represented more than 5% of sales in the domestic or foreign market.
Non-current assets abroad represent approximately 4% of the Company's non-current assets.
24. Costs and expenses by function and nature
The Company presents the profit and loss account by function. As required by technical pronouncement CPC 26 – R1 (IAS 1) – Presentation of Financial Statements. The classification by function and the breakdown of operating costs and expenses by nature are as follows: a) Costs and expenses by function
Parent company Consolidated
2016 2015 2016 2015
Cost of goods sold (1,041,003) (1,129,952) (1,048,588) (1,134,913) Selling expenses (442,938) (471,336) (490,574) (523,709) General and administrative expenses (83,796) (80,839) (97,514) (101,695)
(1,567,737) (1,682,127) (1,636,676) (1,760,317)

(A free translation of the original in Portuguese)
GRENDENE S.A. Notes to the financial statements December 31, 2016 and 2015 (All amounts in thousands of reais)
71
24. Costs and expenses by function and nature--Continued
b) Costs and expenses by nature
Parent company Consolidated
2016 2015 2016 2015
Cost of goods sold Raw materials (473,436) (516,990) (475,668) (518,075) Personnel expenses (417,871) (449,596) (421,021) (452,303) Depreciation and amortization (42,573) (39,659) (42,795) (39,880) Other costs (107,123) (123,707) (109,104) (124,655)
(1,041,003) (1,129,952) (1,048,588) (1,134,913)
Selling expenses Commissions (101,504) (101,218) (103,620) (103,001) Freight (94,312) (95,477) (96,569) (97,799) Copyrights (49,175) (52,912) (49,175) (52,947) Management for development of trademarks (3) (387) (3) (387) Advertising and publicity (114,271) (137,319) (122,819) (148,858) Personnel expenses (31,262) (29,749) (40,270) (39,322) Depreciation and amortization (2,922) (3,132) (4,424) (5,447) Outsourced services (10,134) (10,252) (12,683) (20,408) Travel and accommodation (4,880) (4,238) (5,148) (4,703) Other expenses (34,475) (36,652) (55,863) (50,837)
(442,938) (471,336) (490,574) (523,709)
General and administrative expenses Personnel expenses (57,805) (54,701) (66,141) (63,071) Depreciation and amortization (7,240) (6,693) (9,130) (8,153) Outsourced services (10,222) (11,313) (12,947) (16,951) Travel and accommodation (1,117) (1,097) (1,158) (1,597) Other expenses (7,412) (7,035) (8,138) (11,923)
(83,796) (80,839) (97,514) (101,695)
(1,567,737) (1,682,127) (1,636,676) (1,760,317)

(A free translation of the original in Portuguese)
GRENDENE S.A. Notes to the financial statements December 31, 2016 and 2015 (All amounts in thousands of reais)
72
25. Other operational revenues and expenses
Parent company Consolidated
2016 2015 2016 2015
Other operational revenues
Write-off of investments in subsidiary 6,920 - 6,920 - Provision for losses in subsidiary 28,000 - 28,000 - Revenue from Sales of PP&E, scrap and other items 1,397 1,391 1,483 1,407 Recovery of expenses 2,518 2,403 2,734 2,721 Social security credits - 1,614 - 1,614 Indemnity for rescission of contract - - 3,821 - Other operational revenues 1,487 922 1,496 932
40,322 6,330 44,454 6,674
Other operational expenses
Cost os Sales and write-off of PP&E, scrap and other items (6,995) (2,806) (19,454) (2,808)
Fees for court proceeding and tax advice (426) (771) (426) (771) Provision for labor risks (565) 53 (578) (875) Losses on non-realization of assets (3,605) (1,653) (20,021) (1,653) Impairment loss – Goodwill - (8,862) - (8,862) Canceled credits - - (1,414) (3,948) Indemnities to third parties (9,043) - (9,043) - Other operational expenses (1,713) (1,414) (2,363) (1,504)
(22,347) (15,453) (53,299) (20,421)
17,975 (9,123) (8,845) (13,747)
26. Finance result
Parent company Consolidated
2016 2015 2016 2015
Finance income
Interest received from customers 2,162 2,842 2,163 2,853 Gains on foreign exchange hedge – BM&F 49,091 66,314 49,091 66,314 Income from financial investments 206,449 167,014 207,734 168,235 Foreign exchange gains 67,798 112,234 69,700 118,822 Adjustment to Present Value (AVP) 64,699 59,576 64,702 60,975 Other finance income 4,458 4,020 3,308 4,140
394,657 412,000 396,698 421,339 Finance costs
Losses on foreign exchange hedge – BM&F (11,563) (123,600) (11,563) (123,600) Financing expenses (13,155) (9,412) (18,340) (20,450) Foreign exchange losses (78,471) (72,169) (82,390) (80,346) Cofins and PIS tax on financial revenues (10,887) (4,965) (10,967) (4,993) Other finance costs (3,158) (3,727) (4,920) (9,603)
(117,234) (213,873) (128,180) (238,992)
277,423 198,127 268,518 182,347

(A free translation of the original in Portuguese)
GRENDENE S.A. Notes to the financial statements December 31, 2016 and 2015 (All amounts in thousands of reais)
73
27. Insurance
The Company's management, based on the advice of its insurance consultants, contracts insurance policies from the main insurance companies in Brazil in amounts considered sufficient to cover possible losses. Taking into account the nature of the activities and the risks involved in the operations. The main types of insurance are as follows:
Type Coverage Coverage amount
Balance sheet Property, plant and equipment and inventories are insured against fire, windstorm, flood and electrical damages,
R$614,380
Loss of profits Profit plus fixed expenses, R$58,800
Civil liability Industrial operations, employer, products and moral damages, R$2,630
Aviation Hull, civil liability, US$3,700
Vehicles Material damages and third-party civil liability (CL), 100% of Fipe valuation plus
R$200 third party property damages and
R$1,000 third party persona injury
Transportation Export and import, U$2,500 per shipment and/or consolidation


