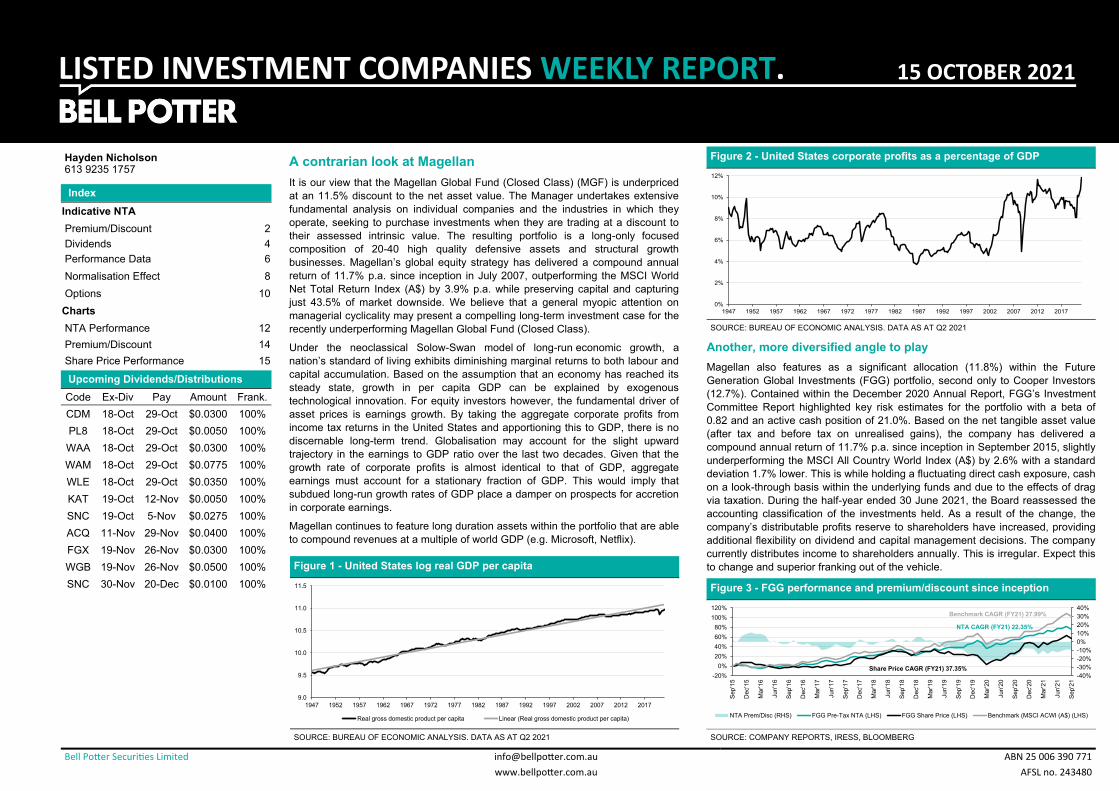
LISTED INVESTMENT COMPANIES WEEKLY REPORT. 15 OCTOBER 2021 Indicative NTA Premium/Discount 2 Dividends 4 Performance Data 6 Normalisation Effect 8 Options 10 Charts NTA Performance 12 Premium/Discount 14 Share Price Performance 15 Hayden Nicholson 613 9235 1757 Bell Poer Securies Limited [email protected]www.bellpoer.com.au ABN 25 006 390 771 AFSL no. 243480 Upcoming Dividends/Distributions Index Code Ex-Div Pay Amount Frank. CDM 18-Oct 29-Oct $0.0300 100% PL8 18-Oct 29-Oct $0.0050 100% WAA 18-Oct 29-Oct $0.0300 100% WAM 18-Oct 29-Oct $0.0775 100% WLE 18-Oct 29-Oct $0.0350 100% KAT 19-Oct 12-Nov $0.0050 100% SNC 19-Oct 5-Nov $0.0275 100% ACQ 11-Nov 29-Nov $0.0400 100% FGX 19-Nov 26-Nov $0.0300 100% WGB 19-Nov 26-Nov $0.0500 100% SNC 30-Nov 20-Dec $0.0100 100% Figure 2 - United States corporate profits as a percentage of GDP SOURCE: BUREAU OF ECONOMIC ANALYSIS. DATA AS AT Q2 2021 Another, more diversified angle to play Magellan also features as a significant allocation (11.8%) within the Future Generation Global Investments (FGG) portfolio, second only to Cooper Investors (12.7%). Contained within the December 2020 Annual Report, FGG’s Investment Committee Report highlighted key risk estimates for the portfolio with a beta of 0.82 and an active cash position of 21.0%. Based on the net tangible asset value (after tax and before tax on unrealised gains), the company has delivered a compound annual return of 11.7% p.a. since inception in September 2015, slightly underperforming the MSCI All Country World Index (A$) by 2.6% with a standard deviation 1.7% lower. This is while holding a fluctuating direct cash exposure, cash on a look-through basis within the underlying funds and due to the effects of drag via taxation. During the half-year ended 30 June 2021, the Board reassessed the accounting classification of the investments held. As a result of the change, the company’s distributable profits reserve to shareholders have increased, providing additional flexibility on dividend and capital management decisions. The company currently distributes income to shareholders annually. This is irregular. Expect this to change and superior franking out of the vehicle. A contrarian look at Magellan It is our view that the Magellan Global Fund (Closed Class) (MGF) is underpriced at an 11.5% discount to the net asset value. The Manager undertakes extensive fundamental analysis on individual companies and the industries in which they operate, seeking to purchase investments when they are trading at a discount to their assessed intrinsic value. The resulting portfolio is a long-only focused composition of 20-40 high quality defensive assets and structural growth businesses. Magellan’s global equity strategy has delivered a compound annual return of 11.7% p.a. since inception in July 2007, outperforming the MSCI World Net Total Return Index (A$) by 3.9% p.a. while preserving capital and capturing just 43.5% of market downside. We believe that a general myopic attention on managerial cyclicality may present a compelling long-term investment case for the recently underperforming Magellan Global Fund (Closed Class). Under the neoclassical Solow-Swan model of long-run economic growth, a nation’s standard of living exhibits diminishing marginal returns to both labour and capital accumulation. Based on the assumption that an economy has reached its steady state, growth in per capita GDP can be explained by exogenous technological innovation. For equity investors however, the fundamental driver of asset prices is earnings growth. By taking the aggregate corporate profits from income tax returns in the United States and apportioning this to GDP, there is no discernable long-term trend. Globalisation may account for the slight upward trajectory in the earnings to GDP ratio over the last two decades. Given that the growth rate of corporate profits is almost identical to that of GDP, aggregate earnings must account for a stationary fraction of GDP. This would imply that subdued long-run growth rates of GDP place a damper on prospects for accretion in corporate earnings. Magellan continues to feature long duration assets within the portfolio that are able to compound revenues at a multiple of world GDP (e.g. Microsoft, Netflix). Figure 1 - United States log real GDP per capita SOURCE: BUREAU OF ECONOMIC ANALYSIS. DATA AS AT Q2 2021 Figure 3 - FGG performance and premium/discount since inception SOURCE: COMPANY REPORTS, IRESS, BLOOMBERG 0% 2% 4% 6% 8% 10% 12% 1947 1952 1957 1962 1967 1972 1977 1982 1987 1992 1997 2002 2007 2012 2017 9.0 9.5 10.0 10.5 11.0 11.5 1947 1952 1957 1962 1967 1972 1977 1982 1987 1992 1997 2002 2007 2012 2017 Real gross domestic product per capita Linear (Real gross domestic product per capita) -40% -30% -20% -10% 0% 10% 20% 30% 40% -20% 0% 20% 40% 60% 80% 100% 120% Sep'15 Dec'15 Mar'16 Jun'16 Sep'16 Dec'16 Mar'17 Jun'17 Sep'17 Dec'17 Mar'18 Jun'18 Sep'18 Dec'18 Mar'19 Jun'19 Sep'19 Dec'19 Mar'20 Jun'20 Sep'20 Dec'20 Mar'21 Jun'21 Sep'21 NTA Prem/Disc (RHS) FGG Pre-Tax NTA (LHS) FGG Share Price (LHS) Benchmark (MSCI ACWI (A$) (LHS) Benchmark CAGR (FY21) 27.99% NTA CAGR (FY21) 22.35% Share Price CAGR (FY21) 37.35%
Transcript
LISTED INVESTMENT COMPANIES WEEKLY REPORT. 15 OCTOBER 2021
“The Indicative Pre-Tax NTA has been adjusted for dividends. Dividends are removed from the NTA once the security goes ex-date and until the receipt of the new cum-dividend NTA. #The Indicative NTA is the actual reported monthly pre-tax NTA as we have been unable to calculate the
Indicative NTA within a reasonable level of accuracy. *The Indicative NTA is the actual reported weekly pre-tax NTA as we have been unable to calculate the Indicative NTA within a reasonable level of accuracy. ^The Indicative NTA is the actual reported daily pre-tax NTA as we have been
unable to calculate the Indicative NTA within a reasonable level of accuracy. +Prem/Disc does not adjust for the dilution of unexercised options.
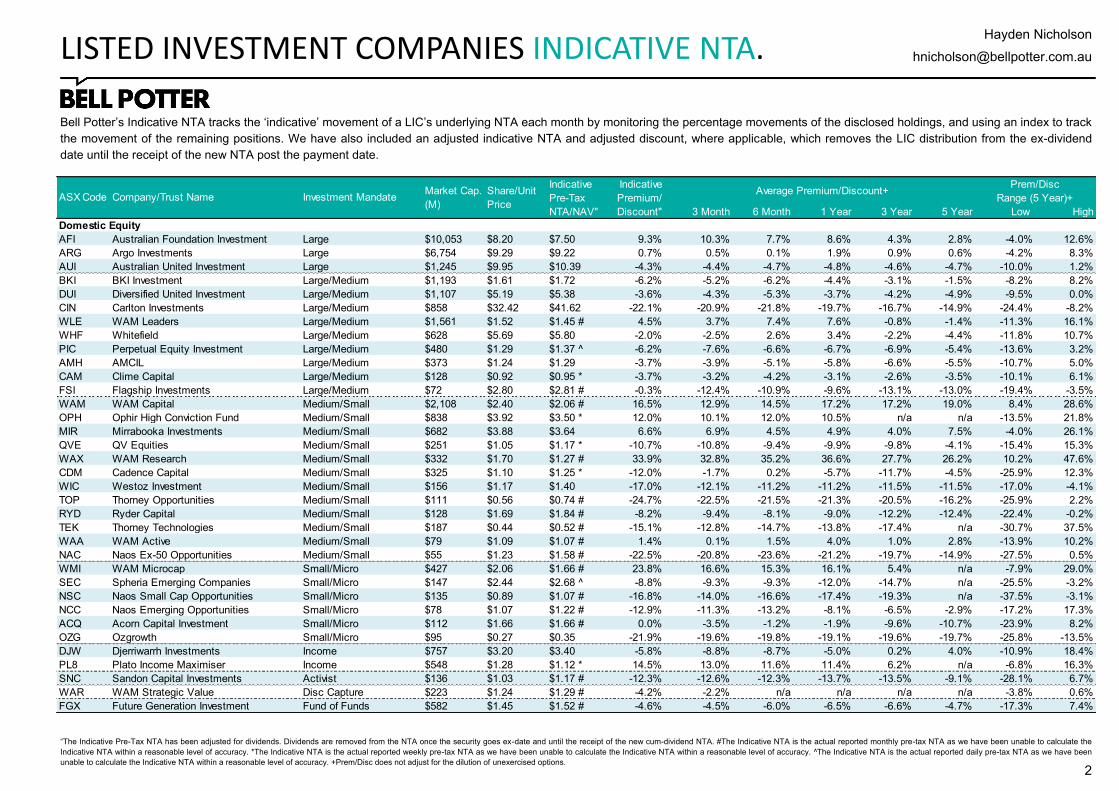
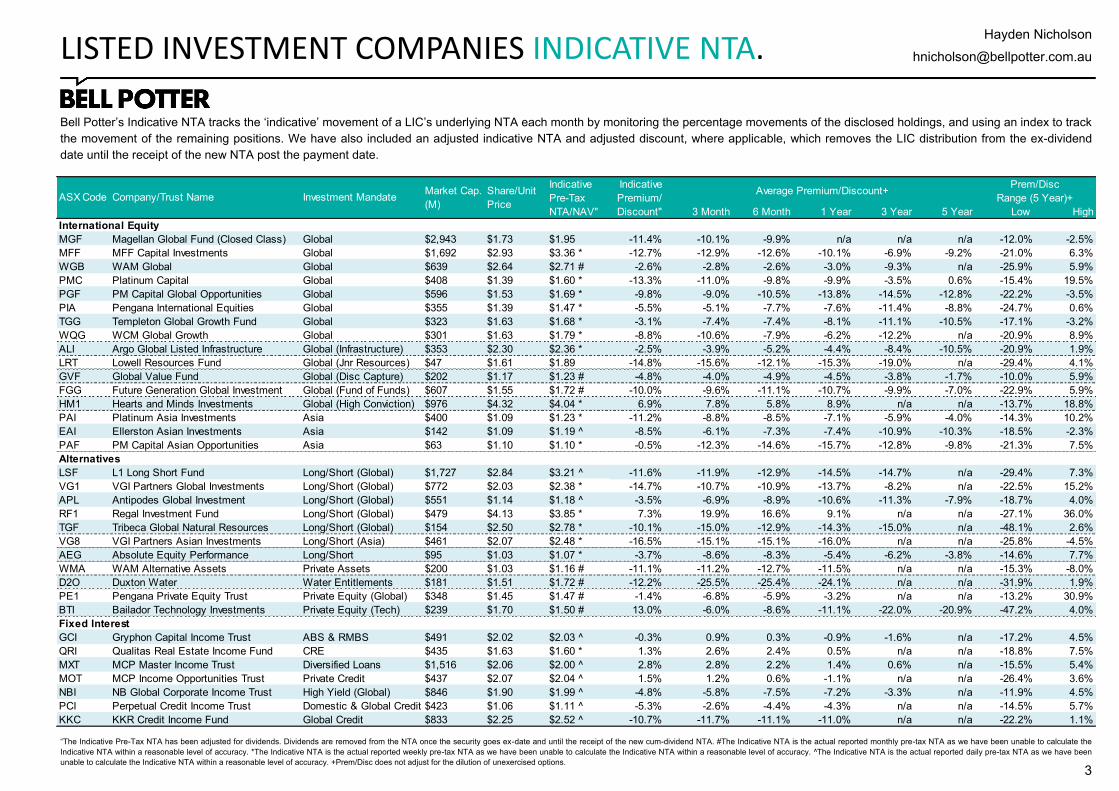
Bell Potter’s Indicative NTA tracks the ‘indicative’ movement of a LIC’s underlying NTA each month by monitoring the percentage movements of the disclosed holdings, and using an index to track
the movement of the remaining positions. We have also included an adjusted indicative NTA and adjusted discount, where applicable, which removes the LIC distribution from the ex-dividend
date until the receipt of the new NTA post the payment date.
3 Month 6 Month 1 Year 3 Year 5 Year Low High
Domestic Equity
AFI Australian Foundation Investment Large $10,053 $8.20 $7.50 9.3% 10.3% 7.7% 8.6% 4.3% 2.8% -4.0% 12.6%
Bell Potter’s Indicative NTA tracks the ‘indicative’ movement of a LIC’s underlying NTA each month by monitoring the percentage movements of the disclosed holdings, and using an index to track
the movement of the remaining positions. We have also included an adjusted indicative NTA and adjusted discount, where applicable, which removes the LIC distribution from the ex-dividend
date until the receipt of the new NTA post the payment date.
LISTED INVESTMENT COMPANIES INDICATIVE NTA.
“The Indicative Pre-Tax NTA has been adjusted for dividends. Dividends are removed from the NTA once the security goes ex-date and until the receipt of the new cum-dividend NTA. #The Indicative NTA is the actual reported monthly pre-tax NTA as we have been unable to calculate the
Indicative NTA within a reasonable level of accuracy. *The Indicative NTA is the actual reported weekly pre-tax NTA as we have been unable to calculate the Indicative NTA within a reasonable level of accuracy. ^The Indicative NTA is the actual reported daily pre-tax NTA as we have been
unable to calculate the Indicative NTA within a reasonable level of accuracy. +Prem/Disc does not adjust for the dilution of unexercised options.
3 Month 6 Month 1 Year 3 Year 5 Year Low High
International Equity
MGF Magellan Global Fund (Closed Class) Global $2,943 $1.73 $1.95 -11.4% -10.1% -9.9% n/a n/a n/a -12.0% -2.5%
MFF MFF Capital Investments Global $1,692 $2.93 $3.36 * -12.7% -12.9% -12.6% -10.1% -6.9% -9.2% -21.0% 6.3%
WGB WAM Global Global $639 $2.64 $2.71 # -2.6% -2.8% -2.6% -3.0% -9.3% n/a -25.9% 5.9%
PMC Platinum Capital Global $408 $1.39 $1.60 * -13.3% -11.0% -9.8% -9.9% -3.5% 0.6% -15.4% 19.5%
PGF PM Capital Global Opportunities Global $596 $1.53 $1.69 * -9.8% -9.0% -10.5% -13.8% -14.5% -12.8% -22.2% -3.5%
PIA Pengana International Equities Global $355 $1.39 $1.47 * -5.5% -5.1% -7.7% -7.6% -11.4% -8.8% -24.7% 0.6%
TGG Templeton Global Growth Fund Global $323 $1.63 $1.68 * -3.1% -7.4% -7.4% -8.1% -11.1% -10.5% -17.1% -3.2%
WQG WCM Global Growth Global $301 $1.63 $1.79 * -8.8% -10.6% -7.9% -6.2% -12.2% n/a -20.9% 8.9%
ALI Argo Global Listed Infrastructure Global (Infrastructure) $353 $2.30 $2.36 * -2.5% -3.9% -5.2% -4.4% -8.4% -10.5% -20.9% 1.9%
LRT Lowell Resources Fund Global (Jnr Resources) $47 $1.61 $1.89 -14.8% -15.6% -12.1% -15.3% -19.0% n/a -29.4% 4.1%
GVF Global Value Fund Global (Disc Capture) $202 $1.17 $1.23 # -4.8% -4.0% -4.9% -4.5% -3.8% -1.7% -10.0% 5.9%
FGG Future Generation Global Investment Global (Fund of Funds) $607 $1.55 $1.72 # -10.0% -9.6% -11.1% -10.7% -9.9% -7.0% -22.9% 5.9%
HM1 Hearts and Minds Investments Global (High Conviction) $976 $4.32 $4.04 * 6.9% 7.8% 5.8% 8.9% n/a n/a -13.7% 18.8%
PAI Platinum Asia Investments Asia $400 $1.09 $1.23 * -11.2% -8.8% -8.5% -7.1% -5.9% -4.0% -14.3% 10.2%
EAI Ellerston Asian Investments Asia $142 $1.09 $1.19 ^ -8.5% -6.1% -7.3% -7.4% -10.9% -10.3% -18.5% -2.3%
PAF PM Capital Asian Opportunities Asia $63 $1.10 $1.10 * -0.5% -12.3% -14.6% -15.7% -12.8% -9.8% -21.3% 7.5%
Alternatives
LSF L1 Long Short Fund Long/Short (Global) $1,727 $2.84 $3.21 ^ -11.6% -11.9% -12.9% -14.5% -14.7% n/a -29.4% 7.3%
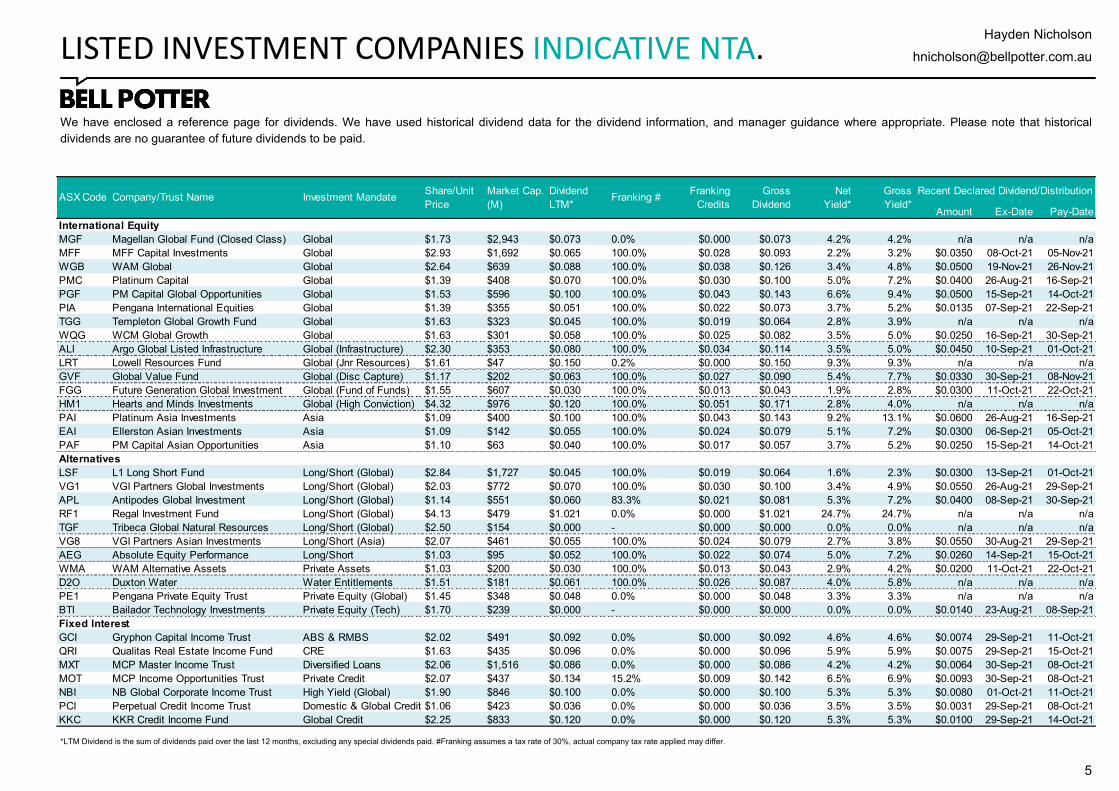
We have enclosed a reference page for dividends. We have used historical dividend data for the dividend information, and manager guidance where appropriate. Please note that historical
dividends are no guarantee of future dividends to be paid.
LISTED INVESTMENT COMPANIES INDICATIVE NTA.
*LTM Dividend is the sum of dividends paid over the last 12 months, excluding any special dividends paid. #Franking assumes a tax rate of 30%, actual company tax rate applied may differ.
Amount Ex-Date Pay-Date
Domestic Equity
AFI Australian Foundation Investment Large $8.20 $10,053 $0.240 100.0% $0.103 $0.343 2.9% 4.2% n/a n/a n/a
We have enclosed a reference page for dividends. We have used historical dividend data for the dividend information, and manager guidance where appropriate. Please note that historical
dividends are no guarantee of future dividends to be paid.
LISTED INVESTMENT COMPANIES INDICATIVE NTA.
*LTM Dividend is the sum of dividends paid over the last 12 months, excluding any special dividends paid. #Franking assumes a tax rate of 30%, actual company tax rate applied may differ.
Amount Ex-Date Pay-Date
International Equity
MGF Magellan Global Fund (Closed Class) Global $1.73 $2,943 $0.073 0.0% $0.000 $0.073 4.2% 4.2% n/a n/a n/a
MFF MFF Capital Investments Global $2.93 $1,692 $0.065 100.0% $0.028 $0.093 2.2% 3.2% $0.0350 08-Oct-21 05-Nov-21
WGB WAM Global Global $2.64 $639 $0.088 100.0% $0.038 $0.126 3.4% 4.8% $0.0500 19-Nov-21 26-Nov-21
PMC Platinum Capital Global $1.39 $408 $0.070 100.0% $0.030 $0.100 5.0% 7.2% $0.0400 26-Aug-21 16-Sep-21
PGF PM Capital Global Opportunities Global $1.53 $596 $0.100 100.0% $0.043 $0.143 6.6% 9.4% $0.0500 15-Sep-21 14-Oct-21
PIA Pengana International Equities Global $1.39 $355 $0.051 100.0% $0.022 $0.073 3.7% 5.2% $0.0135 07-Sep-21 22-Sep-21
TGG Templeton Global Growth Fund Global $1.63 $323 $0.045 100.0% $0.019 $0.064 2.8% 3.9% n/a n/a n/a
WQG WCM Global Growth Global $1.63 $301 $0.058 100.0% $0.025 $0.082 3.5% 5.0% $0.0250 16-Sep-21 30-Sep-21
ALI Argo Global Listed Infrastructure Global (Infrastructure) $2.30 $353 $0.080 100.0% $0.034 $0.114 3.5% 5.0% $0.0450 10-Sep-21 01-Oct-21
LRT Lowell Resources Fund Global (Jnr Resources) $1.61 $47 $0.150 0.2% $0.000 $0.150 9.3% 9.3% n/a n/a n/a
GVF Global Value Fund Global (Disc Capture) $1.17 $202 $0.063 100.0% $0.027 $0.090 5.4% 7.7% $0.0330 30-Sep-21 08-Nov-21
FGG Future Generation Global Investment Global (Fund of Funds) $1.55 $607 $0.030 100.0% $0.013 $0.043 1.9% 2.8% $0.0300 11-Oct-21 22-Oct-21
HM1 Hearts and Minds Investments Global (High Conviction) $4.32 $976 $0.120 100.0% $0.051 $0.171 2.8% 4.0% n/a n/a n/a
PAI Platinum Asia Investments Asia $1.09 $400 $0.100 100.0% $0.043 $0.143 9.2% 13.1% $0.0600 26-Aug-21 16-Sep-21
EAI Ellerston Asian Investments Asia $1.09 $142 $0.055 100.0% $0.024 $0.079 5.1% 7.2% $0.0300 06-Sep-21 05-Oct-21
PAF PM Capital Asian Opportunities Asia $1.10 $63 $0.040 100.0% $0.017 $0.057 3.7% 5.2% $0.0250 15-Sep-21 14-Oct-21
Alternatives
LSF L1 Long Short Fund Long/Short (Global) $2.84 $1,727 $0.045 100.0% $0.019 $0.064 1.6% 2.3% $0.0300 13-Sep-21 01-Oct-21
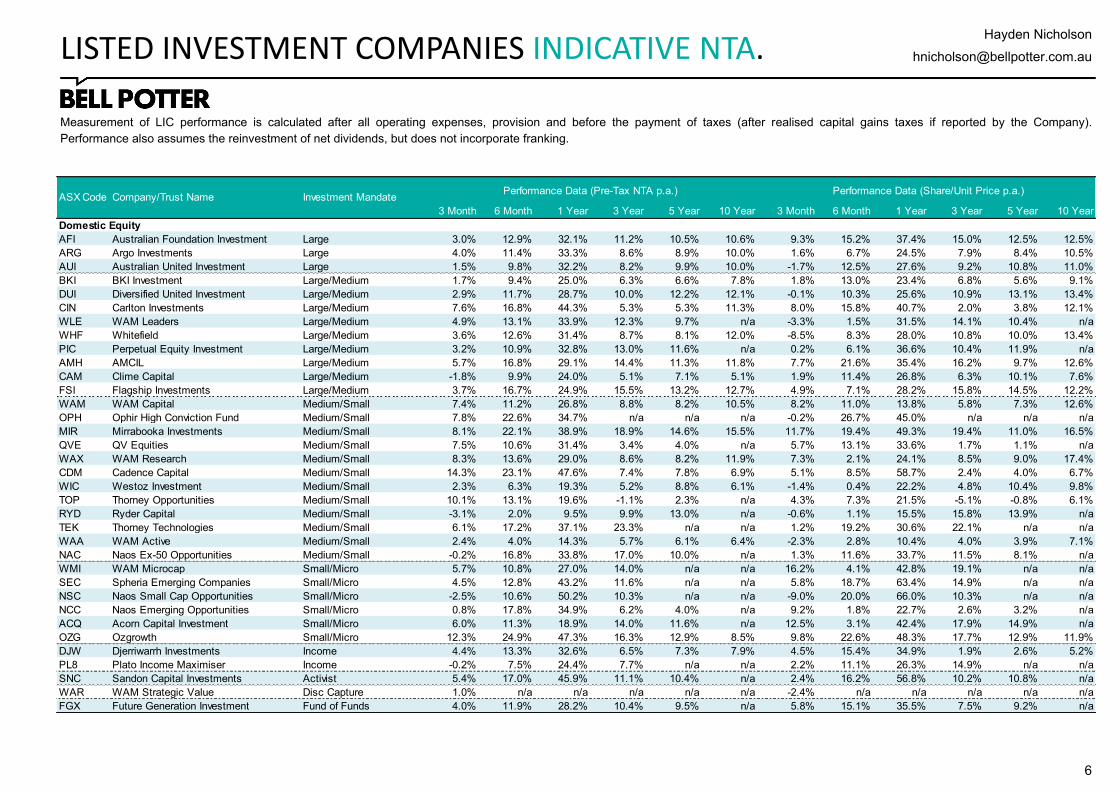
Measurement of LIC performance is calculated after all operating expenses, provision and before the payment of taxes (after realised capital gains taxes if reported by the Company).
Performance also assumes the reinvestment of net dividends, but does not incorporate franking.
LISTED INVESTMENT COMPANIES INDICATIVE NTA.
3 Month 6 Month 1 Year 3 Year 5 Year 10 Year 3 Month 6 Month 1 Year 3 Year 5 Year 10 Year
Domestic Equity
AFI Australian Foundation Investment Large 3.0% 12.9% 32.1% 11.2% 10.5% 10.6% 9.3% 15.2% 37.4% 15.0% 12.5% 12.5%
Measurement of LIC performance is calculated after all operating expenses, provision and before the payment of taxes (after realised capital gains taxes if reported by the Company).
Performance also assumes the reinvestment of net dividends, but does not incorporate franking.
3 Month 6 Month 1 Year 3 Year 5 Year 10 Year 3 Month 6 Month 1 Year 3 Year 5 Year 10 Year
International Equity
MGF Magellan Global Fund (Closed Class) Global 0.5% 8.8% n/a n/a n/a n/a -2.2% 9.6% n/a n/a n/a n/a
MFF MFF Capital Investments Global 2.7% 12.1% 21.8% 9.1% 15.7% 18.9% 2.8% 11.6% 17.8% 7.3% 15.8% 19.9%
WGB WAM Global Global 1.5% 6.2% 18.4% 9.8% n/a n/a 1.5% 7.2% 36.8% 10.6% n/a n/a
PMC Platinum Capital Global -1.0% 0.0% 21.6% 4.1% 7.3% 9.2% -4.7% -5.3% 16.9% -4.1% 4.1% 8.9%
PGF PM Capital Global Opportunities Global 0.2% 7.4% 49.0% 10.9% 14.8% n/a -3.1% 18.5% 60.2% 9.6% 16.3% n/a
PIA Pengana International Equities Global 1.9% 8.3% 18.9% 11.8% 5.4% 10.6% 8.6% 21.9% 27.1% 12.5% 5.8% 12.7%
TGG Templeton Global Growth Fund Global 1.0% 5.0% 23.3% 6.5% 9.0% 11.1% 0.6% 8.5% 38.6% 8.0% 11.0% 13.1%
WQG WCM Global Growth Global 2.3% 14.0% 21.8% 13.6% n/a n/a 2.4% 8.9% 28.6% 17.2% n/a n/a
ALI Argo Global Listed Infrastructure Global (Infrastructure) 2.3% 7.4% 12.0% 5.4% 6.4% n/a 8.5% 15.4% 17.3% 10.0% 8.7% n/a
LRT Lowell Resources Fund Global (Jnr Resources) 17.2% 22.8% 45.0% 44.6% n/a n/a -3.3% 19.9% 32.9% 43.3% n/a n/a
GVF Global Value Fund Global (Disc Capture) 4.8% 11.9% 25.0% 10.0% 8.8% n/a 7.8% 9.2% 24.5% 9.0% 8.5% n/a
FGG Future Generation Global Investment Global (Fund of Funds) -0.7% 4.5% 13.1% 9.1% 11.4% n/a 2.9% 5.7% 22.8% 5.8% 9.7% n/a
HM1 Hearts and Minds Investments Global (High Conviction) -3.8% 7.1% 9.0% n/a n/a n/a 1.4% 2.0% 24.2% n/a n/a n/a
PAI Platinum Asia Investments Asia -5.1% -4.0% 7.6% 9.6% 9.7% n/a -6.4% -9.3% 6.4% 2.7% 8.4% n/a
EAI Ellerston Asian Investments Asia -8.2% -4.4% 1.3% 5.8% 5.7% n/a -5.8% -2.6% 7.9% 5.3% 6.9% n/a
PAF PM Capital Asian Opportunities Asia 1.1% 3.3% 25.3% 1.7% 5.2% n/a 16.9% 20.1% 45.8% 0.9% 6.8% n/a
Alternatives
LSF L1 Long Short Fund Long/Short (Global) 11.1% 20.9% 76.4% 23.4% n/a n/a 8.3% 25.6% 93.0% 18.8% n/a n/a
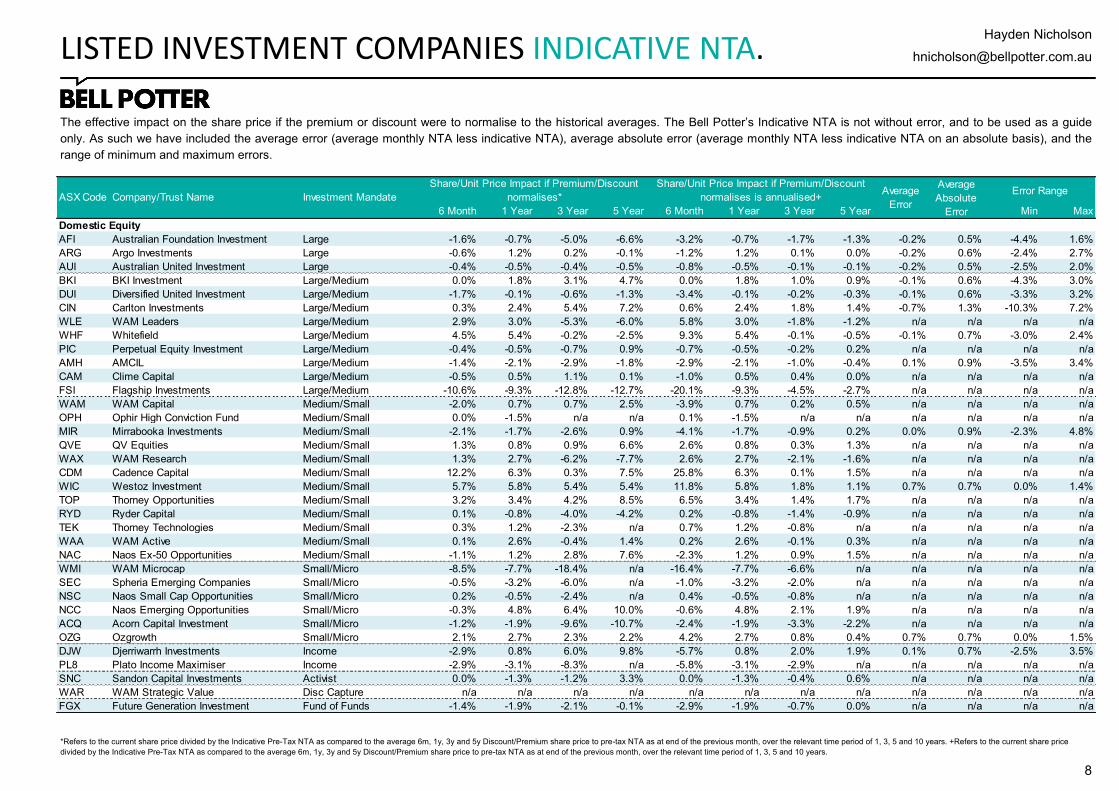
The effective impact on the share price if the premium or discount were to normalise to the historical averages. The Bell Potter’s Indicative NTA is not without error, and to be used as a guide
only. As such we have included the average error (average monthly NTA less indicative NTA), average absolute error (average monthly NTA less indicative NTA on an absolute basis), and the
range of minimum and maximum errors.
LISTED INVESTMENT COMPANIES INDICATIVE NTA.
*Refers to the current share price divided by the Indicative Pre-Tax NTA as compared to the average 6m, 1y, 3y and 5y Discount/Premium share price to pre-tax NTA as at end of the previous month, over the relevant time period of 1, 3, 5 and 10 years. +Refers to the current share price
divided by the Indicative Pre-Tax NTA as compared to the average 6m, 1y, 3y and 5y Discount/Premium share price to pre-tax NTA as at end of the previous month, over the relevant time period of 1, 3, 5 and 10 years.
6 Month 1 Year 3 Year 5 Year 6 Month 1 Year 3 Year 5 Year Min Max
Domestic Equity
AFI Australian Foundation Investment Large -1.6% -0.7% -5.0% -6.6% -3.2% -0.7% -1.7% -1.3% -0.2% 0.5% -4.4% 1.6%
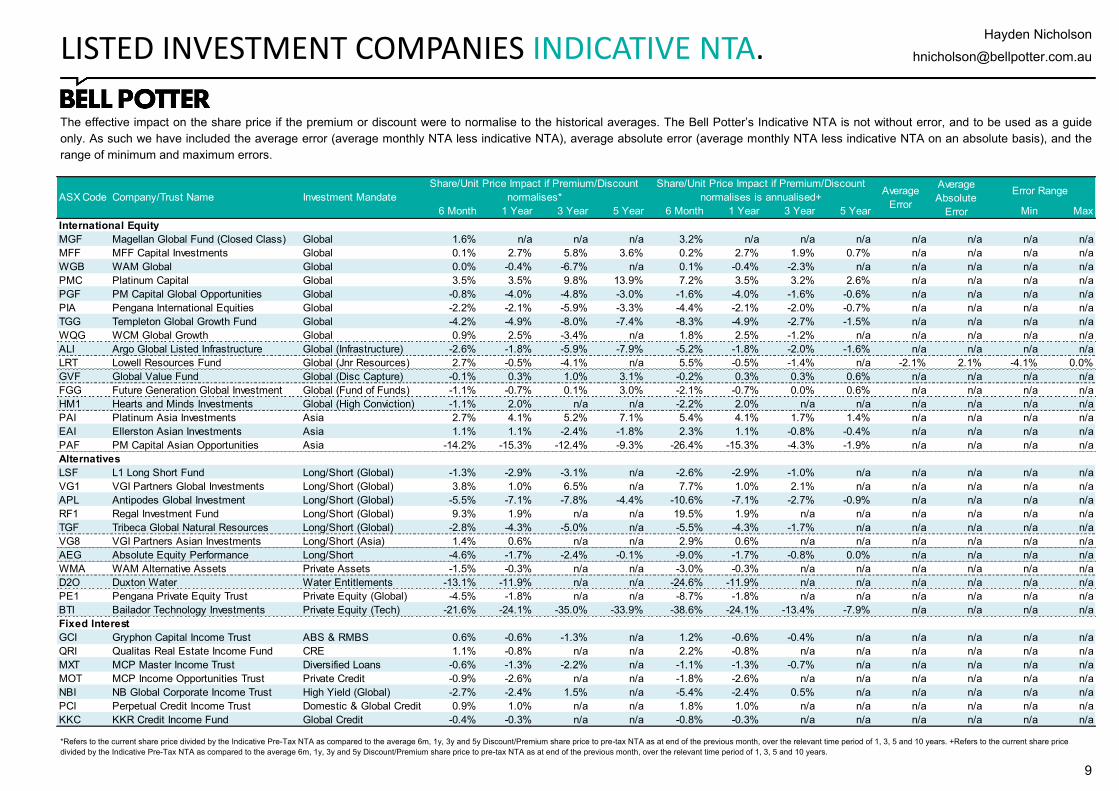
The effective impact on the share price if the premium or discount were to normalise to the historical averages. The Bell Potter’s Indicative NTA is not without error, and to be used as a guide
only. As such we have included the average error (average monthly NTA less indicative NTA), average absolute error (average monthly NTA less indicative NTA on an absolute basis), and the
range of minimum and maximum errors.
*Refers to the current share price divided by the Indicative Pre-Tax NTA as compared to the average 6m, 1y, 3y and 5y Discount/Premium share price to pre-tax NTA as at end of the previous month, over the relevant time period of 1, 3, 5 and 10 years. +Refers to the current share price
divided by the Indicative Pre-Tax NTA as compared to the average 6m, 1y, 3y and 5y Discount/Premium share price to pre-tax NTA as at end of the previous month, over the relevant time period of 1, 3, 5 and 10 years.
6 Month 1 Year 3 Year 5 Year 6 Month 1 Year 3 Year 5 Year Min Max
International Equity
MGF Magellan Global Fund (Closed Class) Global 1.6% n/a n/a n/a 3.2% n/a n/a n/a n/a n/a n/a n/a
MFF MFF Capital Investments Global 0.1% 2.7% 5.8% 3.6% 0.2% 2.7% 1.9% 0.7% n/a n/a n/a n/a
WGB WAM Global Global 0.0% -0.4% -6.7% n/a 0.1% -0.4% -2.3% n/a n/a n/a n/a n/a
PMC Platinum Capital Global 3.5% 3.5% 9.8% 13.9% 7.2% 3.5% 3.2% 2.6% n/a n/a n/a n/a
PGF PM Capital Global Opportunities Global -0.8% -4.0% -4.8% -3.0% -1.6% -4.0% -1.6% -0.6% n/a n/a n/a n/a
PIA Pengana International Equities Global -2.2% -2.1% -5.9% -3.3% -4.4% -2.1% -2.0% -0.7% n/a n/a n/a n/a
TGG Templeton Global Growth Fund Global -4.2% -4.9% -8.0% -7.4% -8.3% -4.9% -2.7% -1.5% n/a n/a n/a n/a
WQG WCM Global Growth Global 0.9% 2.5% -3.4% n/a 1.8% 2.5% -1.2% n/a n/a n/a n/a n/a
ALI Argo Global Listed Infrastructure Global (Infrastructure) -2.6% -1.8% -5.9% -7.9% -5.2% -1.8% -2.0% -1.6% n/a n/a n/a n/a
LRT Lowell Resources Fund Global (Jnr Resources) 2.7% -0.5% -4.1% n/a 5.5% -0.5% -1.4% n/a -2.1% 2.1% -4.1% 0.0%
GVF Global Value Fund Global (Disc Capture) -0.1% 0.3% 1.0% 3.1% -0.2% 0.3% 0.3% 0.6% n/a n/a n/a n/a
FGG Future Generation Global Investment Global (Fund of Funds) -1.1% -0.7% 0.1% 3.0% -2.1% -0.7% 0.0% 0.6% n/a n/a n/a n/a
HM1 Hearts and Minds Investments Global (High Conviction) -1.1% 2.0% n/a n/a -2.2% 2.0% n/a n/a n/a n/a n/a n/a
PAI Platinum Asia Investments Asia 2.7% 4.1% 5.2% 7.1% 5.4% 4.1% 1.7% 1.4% n/a n/a n/a n/a
EAI Ellerston Asian Investments Asia 1.1% 1.1% -2.4% -1.8% 2.3% 1.1% -0.8% -0.4% n/a n/a n/a n/a
PAF PM Capital Asian Opportunities Asia -14.2% -15.3% -12.4% -9.3% -26.4% -15.3% -4.3% -1.9% n/a n/a n/a n/a
Alternatives
LSF L1 Long Short Fund Long/Short (Global) -1.3% -2.9% -3.1% n/a -2.6% -2.9% -1.0% n/a n/a n/a n/a n/a
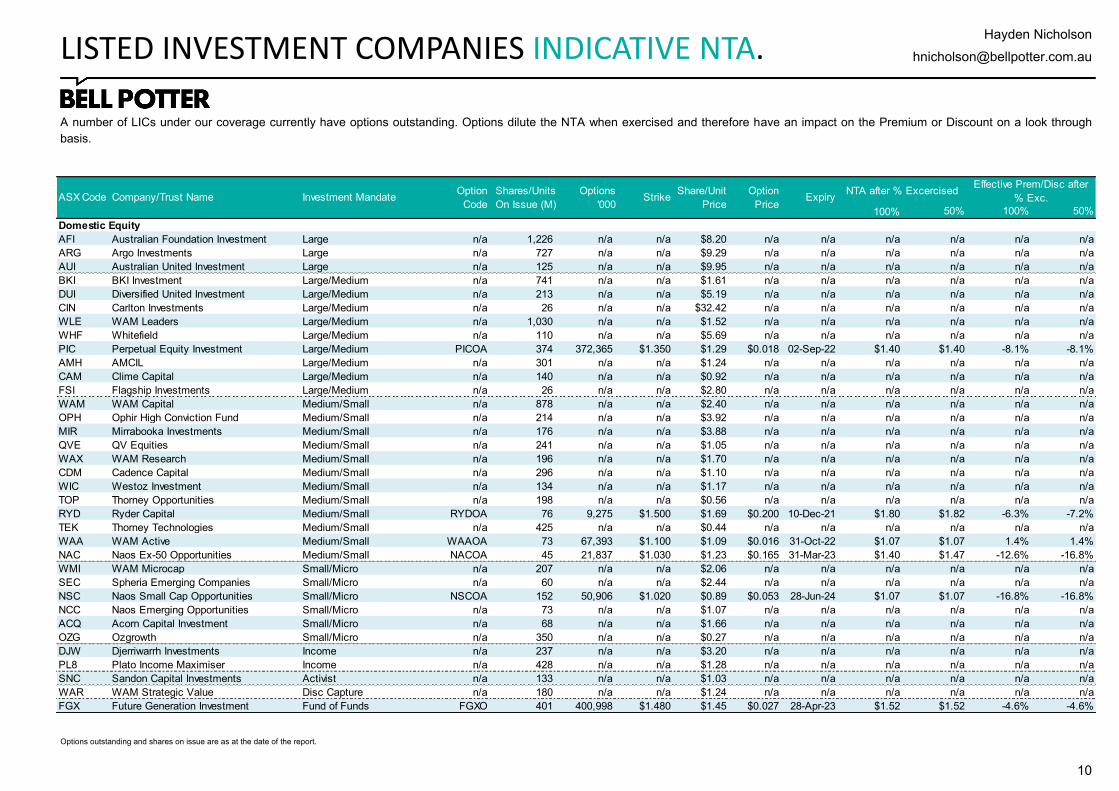
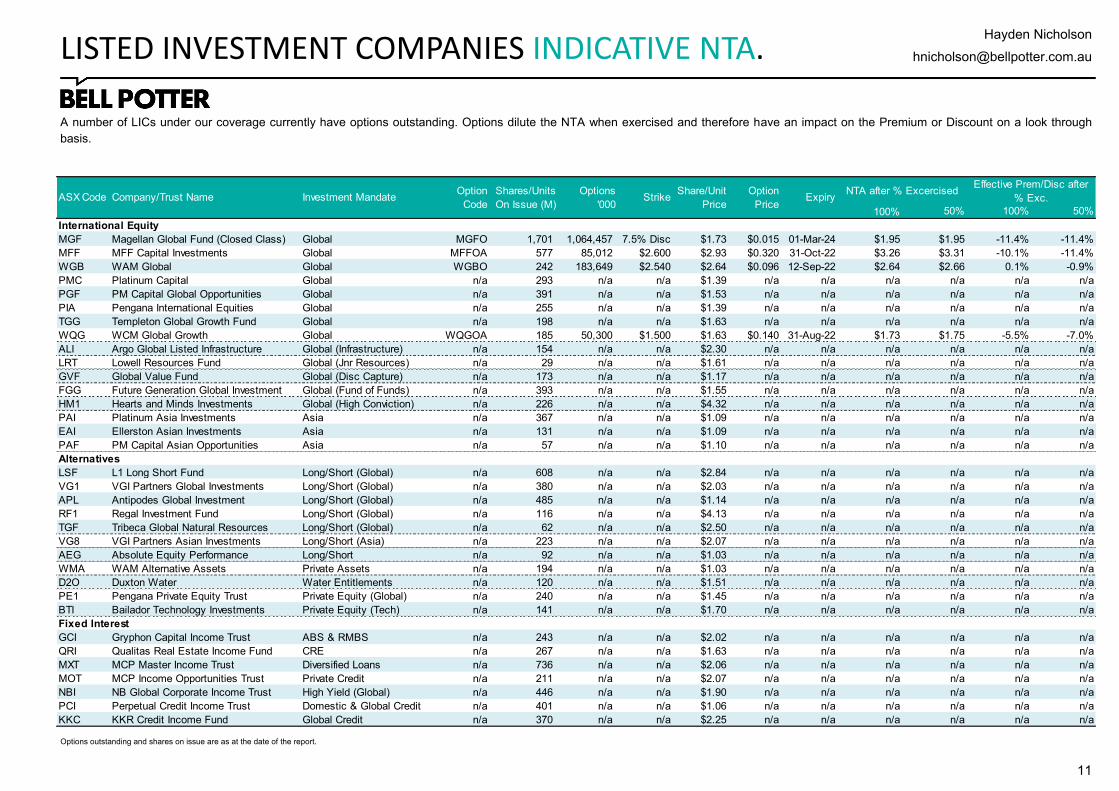
A number of LICs under our coverage currently have options outstanding. Options dilute the NTA when exercised and therefore have an impact on the Premium or Discount on a look through
basis.
LISTED INVESTMENT COMPANIES INDICATIVE NTA.
Options outstanding and shares on issue are as at the date of the report.
100% 50% 100% 50%
Domestic Equity
AFI Australian Foundation Investment Large n/a 1,226 n/a n/a $8.20 n/a n/a n/a n/a n/a n/a
A number of LICs under our coverage currently have options outstanding. Options dilute the NTA when exercised and therefore have an impact on the Premium or Discount on a look through
basis.
LISTED INVESTMENT COMPANIES INDICATIVE NTA.
Options outstanding and shares on issue are as at the date of the report.
100% 50% 100% 50%
International Equity
MGF Magellan Global Fund (Closed Class) Global MGFO 1,701 1,064,457 7.5% Disc $1.73 $0.015 01-Mar-24 $1.95 $1.95 -11.4% -11.4%
MFF MFF Capital Investments Global MFFOA 577 85,012 $2.600 $2.93 $0.320 31-Oct-22 $3.26 $3.31 -10.1% -11.4%
WGB WAM Global Global WGBO 242 183,649 $2.540 $2.64 $0.096 12-Sep-22 $2.64 $2.66 0.1% -0.9%
PMC Platinum Capital Global n/a 293 n/a n/a $1.39 n/a n/a n/a n/a n/a n/a
PGF PM Capital Global Opportunities Global n/a 391 n/a n/a $1.53 n/a n/a n/a n/a n/a n/a
PIA Pengana International Equities Global n/a 255 n/a n/a $1.39 n/a n/a n/a n/a n/a n/a
TGG Templeton Global Growth Fund Global n/a 198 n/a n/a $1.63 n/a n/a n/a n/a n/a n/a
WQG WCM Global Growth Global WQGOA 185 50,300 $1.500 $1.63 $0.140 31-Aug-22 $1.73 $1.75 -5.5% -7.0%
ALI Argo Global Listed Infrastructure Global (Infrastructure) n/a 154 n/a n/a $2.30 n/a n/a n/a n/a n/a n/a
LRT Lowell Resources Fund Global (Jnr Resources) n/a 29 n/a n/a $1.61 n/a n/a n/a n/a n/a n/a
GVF Global Value Fund Global (Disc Capture) n/a 173 n/a n/a $1.17 n/a n/a n/a n/a n/a n/a
FGG Future Generation Global Investment Global (Fund of Funds) n/a 393 n/a n/a $1.55 n/a n/a n/a n/a n/a n/a
HM1 Hearts and Minds Investments Global (High Conviction) n/a 226 n/a n/a $4.32 n/a n/a n/a n/a n/a n/a
PAI Platinum Asia Investments Asia n/a 367 n/a n/a $1.09 n/a n/a n/a n/a n/a n/a
EAI Ellerston Asian Investments Asia n/a 131 n/a n/a $1.09 n/a n/a n/a n/a n/a n/a
PAF PM Capital Asian Opportunities Asia n/a 57 n/a n/a $1.10 n/a n/a n/a n/a n/a n/a
Alternatives
LSF L1 Long Short Fund Long/Short (Global) n/a 608 n/a n/a $2.84 n/a n/a n/a n/a n/a n/a
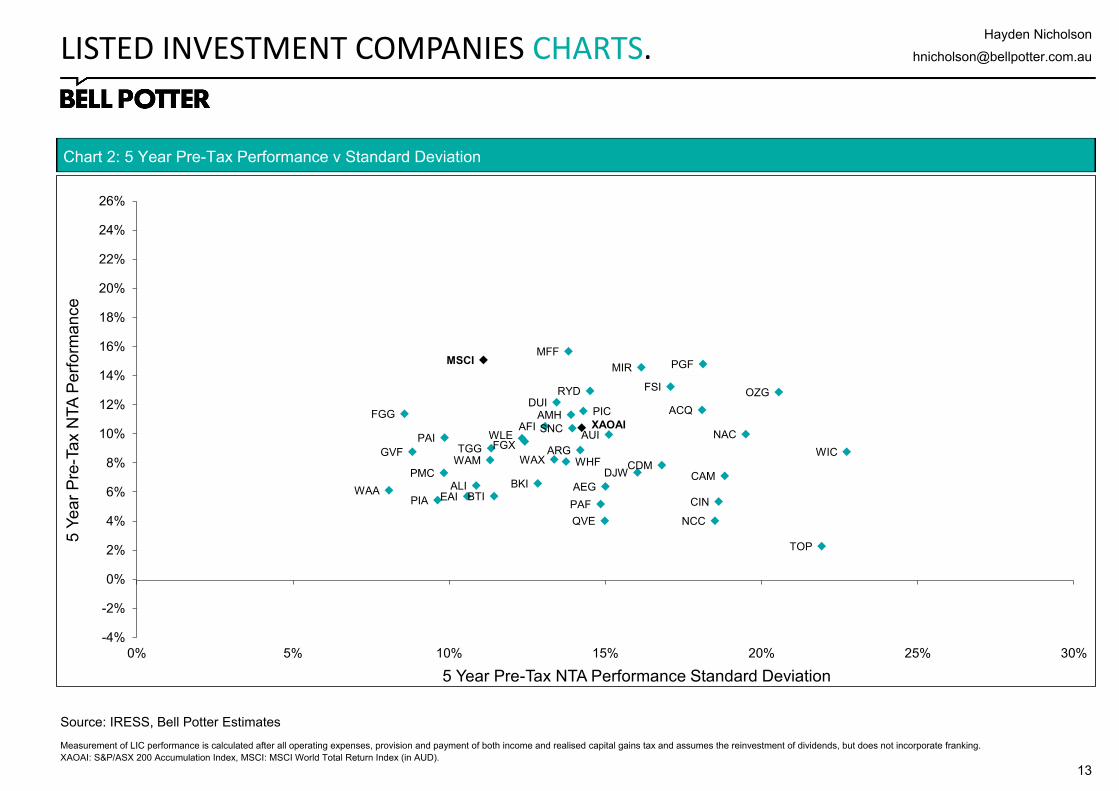
Measurement of LIC performance is calculated after all operating expenses, provision and payment of both income and realised capital gains tax and assumes the reinvestment of dividends, but does not incorporate franking.
XAOAI: S&P/ASX 200 Accumulation Index, MSCI: MSCI World Total Return Index (in AUD).
Chart 1: 3 Year Pre-Tax Performance v Standard Deviation
Chart 2: 5 Year Pre-Tax Performance v Standard Deviation
Measurement of LIC performance is calculated after all operating expenses, provision and payment of both income and realised capital gains tax and assumes the reinvestment of dividends, but does not incorporate franking.
XAOAI: S&P/ASX 200 Accumulation Index, MSCI: MSCI World Total Return Index (in AUD).
The following may affect your legal rights. Important Disclaimer:
This document is a private communication to clients and is not intended for public circulation or for the use of any third party, without the prior approval of Bell Potter Securities Limited. In the USA and the UK this research is only for institutional investors. It is not for release, publication or distribution in whole or in part to any persons in the two specified countries. In Hong Kong, this research is being distributed by Bell Potter Securities (HK) Limited which is licensed and regulated by the Securities and Futures Commission, Hong Kong. In the United States, this research is issued and distributed by Bell Potter Securities (US) LLC which is a registered broker-dealer and member of FINRA. Any person receiving this report from Bell Potter Securities (US) LLC and wishing to transact in any security described herein should do so with Bell Potter Securities (US) LLC.
This is general investment advice only and does not constitute personal advice to any person. Because this document has been prepared without consideration of any specific client’s financial situation, particular needs and investment objectives (‘relevant personal circumstances’), a Bell Potter Securities Limited investment adviser (or the financial services licensee, or the representative of such licensee, who has provided you with this report by arrangement with Bell Potter Securities Limited) should be made aware of your relevant personal circumstances and consulted before any investment decision is made on the basis of this document.
While this document is based on information from sources which are considered reliable, Bell Potter Securities Limited has not verified independently the information contained in the document and Bell Potter Securities Limited and its directors, employees and consultants do not represent, warrant or guarantee, expressly or impliedly, that the information contained in this document is complete or accurate. Nor does Bell Potter Securities Limited accept any responsibility for updating any advice, views opinions, or recommendations contained in this document or for correcting any error or omission which may become apparent after the document has been issued.
Except insofar as liability under any statute cannot be excluded. Bell Potter Securities Limited and its directors, employees and consultants do not accept any liability (whether arising in contract, in tort or negligence or otherwise) for any error or omission in this document or for any resulting loss or damage (whether direct, indirect, consequential or otherwise) suffered by the recipient of this document or any other person.
Research Policies:
For Bell Potter’s Research Coverage Decision Making Process and Research Independence Policy, please refer to our company website:
Bell Potter Securities Limited, its employees, consultants and its associates within the meaning of Chapter 7 of the Corporations Law may receive commissions, underwriting and management fees from transactions involving securities referred to in this document (which its representatives may directly share) and may from time to time hold interests in the securities referred to in this document.
Additional disclosure:
Bell Potter Securities Limited acted as a Co-Manager or Lead Manager to the following capital raisings and/or IPOs: FGG, FGX, GCI, HM1, LSF, MOT, MXT, NBI, PCI, PE1, RF1, TOP, TEK, WAR, WGB, WQG. Bell Potter Securities Limited received fees for these services.
ANALYST CERTIFICATION
Each research analyst primarily responsible for the content of this research report, in whole or in part, certifies that with respect to each security or issuer that the analyst covered in this report: (1) all of the views expressed accurately reflect his or her personal views about those securities or issuers and were prepared in an independent manner and (2) no part of his or her compensation was, is, or will be, directly or indirectly, related to the specific recommendations or views expressed by that research analyst in the research report.