Estudios Públicos, 43 (invierno, 1991, “Nuevos modelos de crecimiento: Una revisión de la literatura y algunos elementos para una estrategia de desarrollo). STUDY NEW GROWTH MODELS LITERATURE REVIEW AND ELEMENTS FOR A DEVELOPMENT STRATEGY * Rodrigo Vergara RODRIGO VERGARA. Commercial Engineer, Catholic University of Chile; Ph.D. in Economics, Harvard University. Professor at the Economics Institute of the Catholic Universi- ty of Chile. Economist at the Central Bank of Chile. The author is grateful for valuable comments by Cecilia Feliú, Luis Oscar Herrera, Esteban Jadresic and Francisco Rosende, as well as efficient research assistance by Andrés Wainer. Any remaining error or omission is the sole responsibility of the author. Since the second half of the 1980s new models of economic growth have began to appear in the literature. Due to the importance of this topic as well as a dissatisfaction with respect to the neoclassical model that had been predominant until then, these other models have quickly gained great popularity in academic circles. Unlike the neoclassical model (where steady-state growth is exogenous), long- term growth is generated by variables and processes that are deter- mined within the model itself. As a result they receive the generic name of “endogenous growth models”. This article has two basic objectives. First and foremost, to provide a review of the literature on the new growth models, their differences from neoclassical models, their empirical implications and the evi- dence found so far. Secondly, to see how the evidence could be applied to the Chilean case and what policy lessons can be drawn. Traslated by Tim Ennis
Transcript
Estudios Públicos, 43 (invierno, 1991, “Nuevos modelos de crecimiento: Una revisión de laliteratura y algunos elementos para una estrategia de desarrollo).
STUDY
NEW GROWTH MODELSLITERATURE REVIEW AND ELEMENTS
FOR A DEVELOPMENT STRATEGY*
Rodrigo Vergara
RODRIGO VERGARA. Commercial Engineer, Catholic University of Chile; Ph.D. inEconomics, Harvard University. Professor at the Economics Institute of the Catholic Universi-ty of Chile. Economist at the Central Bank of Chile.
The author is grateful for valuable comments by Cecilia Feliú, Luis Oscar Herrera,Esteban Jadresic and Francisco Rosende, as well as efficient research assistance by AndrésWainer. Any remaining error or omission is the sole responsibility of the author.
Since the second half of the 1980s new models of economic growthhave began to appear in the literature. Due to the importance of thistopic as well as a dissatisfaction with respect to the neoclassicalmodel that had been predominant until then, these other models havequickly gained great popularity in academic circles. Unlike theneoclassical model (where steady-state growth is exogenous), long-term growth is generated by variables and processes that are deter-mined within the model itself. As a result they receive the genericname of “endogenous growth models”.This article has two basic objectives. First and foremost, to provide areview of the literature on the new growth models, their differencesfrom neoclassical models, their empirical implications and the evi-dence found so far. Secondly, to see how the evidence could beapplied to the Chilean case and what policy lessons can be drawn.
Traslated by Tim Ennis
2 ESTUDIOS PÚBLICOS
1. Introduction
he average per-capita growth rate of the Chilean economy overthe last 30 years has been quite low in comparative terms. There have beenshort periods of great boom (for example 1978-81 and 1985-89) and otherperiods of severe recession; however on average, ever since there havebeen reliable figures, Chile has not stood out as a country that has enjoyeda significant and sustained growth process. On the contrary, in a studycarried out by Robert Summers and Alan Heston1, where comparable dataare displayed for 114 countries over the period 1960-1985, Chile is in 85thplace in terms of average per-capita growth, with the meager rate of 0.7%2.The highest per-capita growth during this period was Singapore with anaverage of 7.4% per year, while Chad is in bottom place with a -2.8%annual average. The annual average rate for the 114 countries is 2.0% (seeTable Nº 1). Clearly, if we include the last four years (1986-1989), Chilewould improve its relative position; however, even so, it would still be acountry of mediocre average performance over the last three decades3.
This poor performance has caused Chile to lose its relative positionamong the highest per-capita income countries. Whereas in 1960 it was in25th place, today it is 39th, with a 1985 per-capita income of US$ 3,486 inPPP (Purchasing Power Parity) terms.
The traditional or neoclassical4 theory of growth has little to offerregarding the growth process in different countries: why certain countriesthat started out from similar levels have grown apart over time? Why theeconomic miracle of certain countries? Why some countries that once wererich now are not?5, etc. According to the neoclassical model, differences inlong-run per-capita growth are explained solely by differences in the pro-cess of technological advance in the different countries. Those with greatertechnological progress will grow faster than those progressing more slowly.
1 See Robert Summers and Alan Heston (1988).2 The figures may differ from those in the National Accounts because those of Sum-
mers and Heston are adjusted in line with purchasing power parity in each country so as tomake them comparable.
3 Including the period 1986-1989 (according to figures published in the NationalAccounts of Chile) average per-capita growth in Chile for the period 1960-1989 amounts to1.35%. This is still significantly less than both the mean and median of the other 113 coun-tries.
4 See Solow (1956).5 Argentina is the most cited case in this category. Díaz Alejandro (1970) puts Argen-
tina among the richest countries at the turn of the century, with a per-capita income similar toHolland, Germany and Belgium, and above Austria, Italy, Switzerland, Sweden, Norway andSpain, whereas by 1985 it was way behind this group.
T
RODRIGO VERGARA 3
Certainly, differences in technology may explain inequalities in growthrates; however, in practice this explanation ends up being a tautology. Inother words, one sees certain countries with higher growth rates thanothers, and to validate neoclassical theory one assumes that this is becausethey have progressed faster technologically. Moreover, in neoclassicaltheory there is no room for policies that encourage saving or investment toaffect long-term growth rates. Higher saving will affect the level of outputonly, but not the steady-state rate of output growth6. It is clear that byaffecting the level of output, also one affects the rate of growth during thetransition to steady state, but not in the latter situation.
For this and other reasons discussed below, empirical studies invarious countries have come up against serious difficulties when they havetried to put forward the neoclassical theory as an explanation of long-rungrowth processes.
As from the second half of the 1980s, new growth models began toappear in the literature7. In these models one of the traditional assumptionsof the neoclassical approach, constant returns to scale, is replaced by anassumption of increasing returns. These models, of great popularity in re-cent years in a academic circles, go under the generic name of “endogenousgrowth models”, as growth is generated by processes and variables that aredetermined within the model itself, unlike the neoclassical model wherethere is an exogenous technology parameter that determines the steady-state growth rate.
The implication of these models is that many factors which underthe neoclassical model only affect the level of income, now have an effecton its growth rate. The interesting thing is that a series of aspects whicheconomic-policy specialists have always identified as determinants of thegrowth rate, now come to have a theoretical foundation (for example therate of saving, taxes, foreign trade distortions, etc.).
Undoubtedly, for a developing country like Chile, the topic ofgrowth is fundamental. The more we understand about it, the better prepa-red we will be to promote practices that encourage growth and avoid otherswhich impede it.
This article has two basic objectives. First and foremost, to providea review of the literature on the new growth models, their differences fromneoclassical models, their empirical implications and the evidence found so
6 Steady state is defined as a state of rest in the economy where a series of variablesgrow at the same rate. In practical terms, it relates to the state of the economy in the long run.
7 See, among others, Romer (1986, 1987a, 1987b, 1989a, 1990a), Lucas (1988),Barro (1990), Rebelo (1991) and Easterly (1989).
4 ESTUDIOS PÚBLICOS
TABLE Nº 1
Country 1960-1985 1985Average per-capita GDP GDP per
growth (%) capita (US$)
1 Singapore 7.4 9,8342 Hong Kong 6.6 9,0933 South Korea 6.0 3,0564 Japan 5.8 9,4475 Malta 5.7 5,3196 Taiwan 5.7 3,5817 Gabon 5.4 3,1038 Botswana 5.1 1,7629 Lesotho 4.6 77110 Cyprus 4.6 5,31011 Malaysia 4.5 3,41512 Greece 4.4 4,46413 Barbados 4.4 5,21214 Thailand 4.1 l,90015 Swaziland 4.0 1,18716 Spain 3.9 6,43717 Portugal 3.8 3,72918 Indonesia 3.7 1,25519 Norway 3.7 12,62320 Brazil 3.5 3,16421 Tunisia 3.5 2,05022 Egypt 3.5 1,18823 Congo 3.5 1,33824 Syria 3.4 2,90025 Panama 3.4 2,91226 Italy 3.3 7,42527 Austria 3.3 8,92928 Finland 3.3 9,23229 Surinam 3.3 3,52230 Morrocco 3.2 1,22131 Belgium 3.2 9,71732 France 3.2 9,91833 Israel 3.2 6,27034 Cameroon 3.1 1,09535 Iran 3.0 3,92236 Ecuador 2.9 2,38737 Pakistan 2.9 1,15338 Germany 2.9 10,70839 Irleland 2.9 5,20540 Turkey 2.8 2,53341 Paraguay 2.8 1,99642 Canada 2.8 12,19643 Denmark 2.7 10,88444 Iceland 2.7 9,037
(continue)
RODRIGO VERGARA 5
45 Holland 2.6 9,09246 Colombia 2.6 2,59947 Sweden 2.6 9,90448 Jordan 2.5 2,11349 Mexico 2.5 3,98550 Mauritius 2.5 1,86951 Dominican Rep. 2.4 1,75352 Burma 2.4 55753 United Kingdom 2.2 8,66554 Luxembourg 2.2 10,54055 Australia 2.1 8,85056 Tanzania 2.1 35557 United States 2.1 12,53258 Algeria 2.0 2,14259 SaudiArabia 2.0 5,97160 Malawi 2.0 38761 Fiji l.9 2,89362 Costa Rica l.9 2,65063 Sri Lanka l.8 1,53964 Sierra Leone l.8 44365 Philppines l.8 1,36166 Switzerland 1.8 10,64067 Zimbabwe 1.7 94868 Niger 1.7 42969 South Africa 1 6 3,88570 Bangladesh 1.5 64771 New Zealand 1.4 8,00072 India 1 4 75073 Trinidad and Tobago 1.4 6,88474 Rwanda 1.3 34175 Papua New Guinea 1.2 1,37476 Mauritania l.l 55077 Kenya l.0 59878 Guatemala l.0 1,60879 Nicaragua 0.9 1,98980 Ivory Coast 0.9 92081 Bolivia 0.8 1,08982 Peru 0.8 2,11483 Honduras 0.8 91184 Gambia 0.8 52685 Chile 0.7 3,48686 Togo 0.7 48987 Jamaica 0.6 1,72588 El Salvador 0.5 1,198
Country 1960-1985 1985Average per-capita GDP GDP per
far. Secondly, to see how the evidence could be applied to the Chilean caseand what policy lessons can be drawn.
Macroeconomic theory can be divided broadly into two areas:theories about business cycles and theories of growth8. Generally, in day-to-day discussion there is much more interest in the current conjuncture, oraspects more related to the business cycle. This concern has some justifica-tion, because we are always confronted by what is going on at the moment;but it is also true that if the ultimate goal is the development of the country,we should not neglect elements that relate to long-term growth. That isprecisely what this article addresses. Apart from anything else, understan-
8 However, it should be noted that proponents of real business cycle theories arguethat both are part of the same process, and so must be modeled in the same way (see Kydlandand Prescott (1982) and Long and Plosser (1983)).
RODRIGO VERGARA 7
ding the growth process probably has a much higher social value thanunderstanding the mechanics of business cycles. For if such understandingleads into policies implemented being which raise the growth rate by a fewtenths of a percent, the accumulated effect after a few years will be consi-derable9.
Understanding the growth process also helps to take better short-term decisions. Indeed, better understanding of the variables that have thebiggest effect on the long-run growth rate will avoid short-term measureswhich negatively affect it10.
This paper is organized as follows: in Section 2 we briefly describethe neoclassical growth model, its empirical implications and why, in thelight of the evidence, it has not been successful. The new growth modelsare described in Section 3, with special emphasis being placed on how theydiffer from the neoclassical model. In addition, the main empirical studieson this issue are discussed. Section 4 applies the conclusions of the twoprevious sections to the case of Chile, and finally Section 5 offers conclu-sions.
2. The neoclassical growth model11
In the neoclassical growth model (or Solow model), the per-capitagrowth rate in steady state is determined solely by exogenous technologicalchange. Countries with higher rates of growth are those which experiencegreater technological progress. The rate of capital accumulation has noeffect on the long-term growth rate: i.e. countries with higher saving/in-vestment rates will have higher levels of income, but not higher steady-state growth rates. Clearly, in getting to this result, such countries willgrow more in the transition to steady state, but not once steady state hasbeen achieved. The same happens with another type of variables which in
9 Lucas (1987) makes an explicit calculation in this respect. It is not surprising thatthe change in welfare resulting from higher growth is substantially greater than that producedby a smaller variability in the business cycle. It has to be stressed, however, that this calcula-tion assumes both processes are separable. Below it is argued that one of the ways of promo-ting long-term growth is by avoiding sharp economic fluctuations in the short run (i.e. avoi-ding instability). If this was so, smoother cycles would be beneficial not only becauseindividuals prefer less fluctuation, given that their are risk averse, but also because smoothercycles mean a higher average growth rate in the long run.
10 The literature on time inconsistency is illustrative here. This concludes that whenthe government tries to obtain short-term advantages, the equilibrium of the economy is sub-optimal, as agents realize what the government is doing and incorporate this into their ownbehavior (see Kydland and Prescott (1978), Barro and Gordon (1983)).
11 See Romer (1987b) for a brief review of pre-Solow growth literature.
8 ESTUDIOS PÚBLICOS
day-to-day discussion are assumed to affect countries’ growth rates: factorssuch as domestic distortions —taxes, tariffs, the composition of investment,etc. In the neoclassical model none of these is relevant for explaining thelong-run growth rate.
Given that in this model the rate of capital accumulation is thevariable that endogenously reflects any change in the model’s parameters,and given that the rate of capital accumulation does not affect the steady-state growth rate, the neoclassical model has endogenous components whi-ch explain countries’ growth rates in the long run.
2.1. The Solow growth model
The Solow (1956) model assumes a production function that hascapital and labor as inputs, together with as a parameter indicating the stateof technology. The function is degree-one homogeneous. Both the savingrate (s) and the rate of population growth (n) are exogenous. Under theseassumptions it can be shown that the steady-state growth rate is equal to therate of population growth. Hence, the rate of growth of per-capita income iszero. If one includes technical change in the model12, then the per-capitagrowth rate becomes the rate of technology growth.
Let us assume a production function with constant returns to scaleof the form:
Yt = F (Kt, AtLt) (1)
where: Yt = Output in t
Lt = Employment in tKt = Capital stock in tAt = A0
gLt, represents the state of technology in t. This grows at arate of gL.
It is easy to show that in this context the growth rate of per-capitaoutput in steady state is equal to gL.
Therefore, policies that affect the rate of saving will not affect thelong-run growth rate. They will only affect the level of income, and hence
12 This should be Harrod-neutral. This means that it affects labor, i. e. effective unitsof labor grow at a rate of n (the rate of population growth) plus the rate of technologicalchange (gL).
RODRIGO VERGARA 9
the rate of growth in the transition to steady state. This implication of themodel puts economists in a position that is hard to defend. Indeed, it isdifficult to match this up with what can be seen in different countriesthroughout the world (see Section 2.3 for greater detail on this and otherpoints where the neoclassical theory seems inadequate in the light of theevidence).
One of the earliest criticisms of the Solow model related to theexogeneity of saving rates. A more sophisticated version of the modelendogenizes the saving rate, for which purpose one starts from the inter-temporal utility maximization of a representative agent, on the basis ofwhich agents make their saving/consumption decisions. This paradigm isknown as the Ramsey (1928), Cass (1965) and Koopmans (1965) model.
However, the conclusions of the model under this new assumptionare the same as with an exogenous saving rate: the rate of growth of per-capita output, in steady state, is equal to the rate of technological progress.Capital accumulation does not cause faster or slower growth in the longrun. It is clear that what leads to this conclusion is the form of the produc-tion function and not whether the saving rate is exogenous or endogenous.Indeed, with constant returns to scale and the rate of population growthexogenous, capital accumulation cannot be a source of growth in the longrun. If the stock of capital begins to grow more rapidly than the population,the law of decreasing returns kicks in, and growth starts to slow down.
2.2 Implications of the neoclassical model
As was mentioned in the previous subsection, the neoclassical mo-del implies that all per-capita growth in the long run is due to productivityor technology growth. The saving rate only affects the level of income, butnot its rate of growth.
A second implication of the neoclassical model is that countries tendto converge over time. That is, poor countries during the transition periodwill tend to grow faster than rich countries, so per-capita incomes becomemore equal. As the capital-labor ratio (K/L) is smaller in lower incomecountries, marginal productivity of capital is greater, so these countriesinvest more and, during the transition to steady state, they grow faster. It isimportant to emphasize this point: only during the transition to steady statedo they grow faster. In the long run, if the rate of technical progress is thesame, they grow at the same rate.
Another implication of the model is that, in open economies, capitalwill flow from rich countries to poor ones, because of the differential
10 ESTUDIOS PÚBLICOS
returns to capital in the two types of country. Poor countries have lesscapital, so the return is higher, and this will encourage capital inflows.
Apart from that, in this model there is no relation between popula-tion growth and the long-run per-capita growth rate. Countries with higherrates of population growth simply accumulate more capital, so the K/Lratio equalizes in the long run.
In the end, as Kaldor argues: “the interpretative value of this theoryis extremely small” (Kaldor, 1961, quoted in Romer, 1987b, p.61). Allgrowth is explained by supposed technological progress, the meaning ofwhich is not clear. What is technological change? How is it explained?Why does it differ between countries in the long run? As Romer argues:
The problem with this theory is that it is nothing more than a des-cription of the data. It says that the rate of growth is higher in somecountries in certain periods because exogenous technological chan-ge is greater. This description of the data does not leave space forthe theory to say anything about the process of growth in countries.(Romer, 1987b, p. 71).
2.3 Empirical problems
Table Nº 2 shows growth rates for different regions of the worldbetween 1965 and 1980 and between 1980 and 1988. Certain situationsimmediately stand out. To start with, the lowest growth rates do not corres-pond to the richest countries, as neoclassical theory would predict. Indeed,the countries with the highest growth rates in the period 1965-1980 are thehigh-income group of countries that are not members of the OECD. Othergroups of countries have quite similar growth rates in this period, exceptfor OECD members which have slightly lower rates. In the period 1980-1988 this same group of countries, which in the previous period had thehighest growth, now appear with the lowest rates, followed by low-incomecountries excluding China and India. OECD countries have comparativelyhigh growth in this second period. In brief, one sees no tendency for coun-tries to converge. Instead, growth rates seem not to be related at all tocountries’ income levels.
Table Nº 3 shows per-capita GNP growth rates for the period 1965-8813. The group of countries with least growth is comprised of low-income
13 Remember that growth theories relate to per-capita growth and not to the totalgrowth of the economy.
RODRIGO VERGARA 11
TABLE Nº 3: AVERAGE GROWTH OF GNP PER CAPITA BY GROUPS OF COUNTRIES
Group 1965-1988
Low-income countries 3.1China and India 4.0Others 1.5Middle-income countries 2.3Low Middle-income 2.6High Middle-income 2.3high-income countries 2.3OECD members 2.3Others 3.1Regional AggregatesEsat Asia 5 2Europe, Middle East and North Africa 2.4Latin America and Caribbean 1.9South Asia 1.8Sub-Saharan Africa 0.2
Source: World Development Report 1990, World Bank.
TABLE Nº 2: AVERAGE GDP GROWTH BY GROUPS OF COUNTRIES
Group 1965-1980 1980-1988
Low-income countries 5.4 6.4China and India 5.3 8.7Others 5.5 2.0Middle-income countries 6.1 2.9Low Middle-income 6.5 2.6High Middle-income 5.6 3.3high-income countries 3.7 2.8OECD members 3.6 2.9Others 8.0 -1.3Regional AggregatesEsat Asia 7.2 8.5Europe, Middle East and North Africa 6.1 n.a.Latin America and Caribbean 6.0 1.5South Asia 3.7 5.1Sub-Saharan Africa 4.8 0.8
Source: World Development Report 1990, World Bank.n.a. = Not available.
12 ESTUDIOS PÚBLICOS
countries apart from China and India. For their part, high-income non-OECD countries have the second highest growth rate over this period. Inthe geographical regional groupings it can be seen that Sub-Saharan Afri-can countries, among the poorest countries in the world, are also those withthe lowest rates of growth. Here again, one does not seem to discern anyclear correlation between levels of income and the rates of growth.
Finally, in Figure Nº 1 this conclusion is corroborated. Here per-capita GDP growth rates between 1960 and 1985 are shown together with1960 per-capita income levels, for the 114 countries shown in Table Nº 1.If the highest income countries were growing faster, then the series ofpoints representing the different countries should trace out a downwardsloping curve; however, the points do not seem to plot any clear relation atall.
Insert>>>
Figure Nº 1
GDP per capita in 1960
Average per-capita growth rate, 1960-1985.
In synthesis, the evidence shows us that the Solow model’s predic-tion of convergence between countries does not seem to be confirmed.Econometric studies corroborate this conclusion. Romer (1986) carries outdifferent empirical tests for individual industrial countries, as well as forgroups of countries over time, and concludes that there is no evidence ofconvergence. Baumol (1986), on the other hand, takes 16 industrializedcountries (ex-post) for the period 1870-1979, using Maddison’s figures,and shows that there is convergence. In response to Baumol, De Long(1988) argues that the Baumol study clearly has a problem of selectionbias, because if one considers countries that ex-post are those of highestincome, is highly likely that ex-ante they were more dispersed. The correctprocedure is to take the highest income countries ex-ante (i.e. in 1870) andsee whether they have converged over time. Accordingly, De Long takesseven countries from the Baumol sample (Argentina, Chile, East Germany,Ireland, New Zealand, Portugal and Spain) and discards one Japan14. He
14 According to this index, Chile in 1870 was in 2ist place among the highest-incomecountries of the world , with a per-capita income similar to that of Finland and Norway.
RODRIGO VERGARA 13
does not find evidence of convergence. Baumol (1988), in a reply writtentogether with Wolf, concedes the point and offers a mea culpa. Finally,Barro and Sala-i-Martin (1990) undertake a study of different countries anddifferent North American states. They find convergence after controllingfor other variables that might affect long-term growth. Having said that,their evidence is only consistent if diminishing returns to capital act extre-mely slowly (using production function parameters thought to be unaccep-table). This evidence, the authors argue, would be consistent with two typesof models: (1) a neoclassical model with a broad definition of capital (in-cluding human capital) and, as just mentioned, a very limited role fordiminishing returns to capital; and (2) endogenous growth models, withconstant returns to capital and gradual diffusion of technology amongcountries.
Table Nº 4 shows annual GDP growth rates per man-hour amongthe leading countries in different periods. As can be appreciated, the evi-dence suggests a significant rise in the rate of growth. The only way toexplain this within the neoclassical model is to argue that there has been anacceleration in the rate of technological change. Although this is possible,as was mentioned in the previous sub-section, the argument leaves thesensation of simply being a tautology: higher growth is explained throughhigher growth.
TABLE Nº 4: AVERAGE PRODUCTIVITY GROWTH IN LEADING COUNTRIES
Leading country Period Annual average rate of GDPgrowth per man-hour
Holland 1700-1785 -0.07United Kingdom 1785-1820 0.5United Kingdom 1820-1890 1.4United States 1890-1970 2.3
Source: Maddison (1982)
Another empirical problem that neoclassical growth theory faces isthe positive relation that seems to exists between the growth rate and trade.Data in Maddison (1982) for 16 industrialized countries shows a clearpositive relation between the two variables for different periods. Distortio-ns that might inhibit trade only cause a fall in the level of income in theneoclassical model, but do not affect the growth rate. This is inconsistentwith the evidence cited above.
14 ESTUDIOS PÚBLICOS
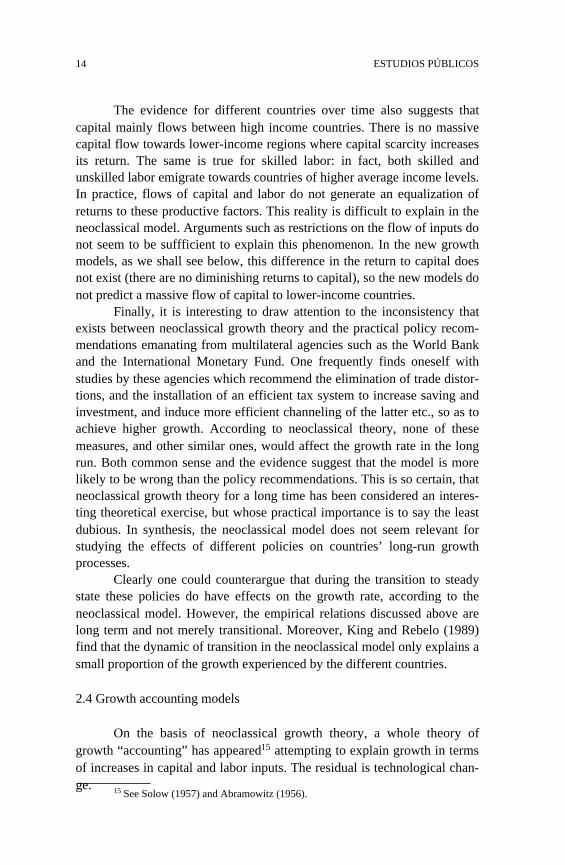
The evidence for different countries over time also suggests thatcapital mainly flows between high income countries. There is no massivecapital flow towards lower-income regions where capital scarcity increasesits return. The same is true for skilled labor: in fact, both skilled andunskilled labor emigrate towards countries of higher average income levels.In practice, flows of capital and labor do not generate an equalization ofreturns to these productive factors. This reality is difficult to explain in theneoclassical model. Arguments such as restrictions on the flow of inputs donot seem to be suffficient to explain this phenomenon. In the new growthmodels, as we shall see below, this difference in the return to capital doesnot exist (there are no diminishing returns to capital), so the new models donot predict a massive flow of capital to lower-income countries.
Finally, it is interesting to draw attention to the inconsistency thatexists between neoclassical growth theory and the practical policy recom-mendations emanating from multilateral agencies such as the World Bankand the International Monetary Fund. One frequently finds oneself withstudies by these agencies which recommend the elimination of trade distor-tions, and the installation of an efficient tax system to increase saving andinvestment, and induce more efficient channeling of the latter etc., so as toachieve higher growth. According to neoclassical theory, none of thesemeasures, and other similar ones, would affect the growth rate in the longrun. Both common sense and the evidence suggest that the model is morelikely to be wrong than the policy recommendations. This is so certain, thatneoclassical growth theory for a long time has been considered an interes-ting theoretical exercise, but whose practical importance is to say the leastdubious. In synthesis, the neoclassical model does not seem relevant forstudying the effects of different policies on countries’ long-run growthprocesses.
Clearly one could counterargue that during the transition to steadystate these policies do have effects on the growth rate, according to theneoclassical model. However, the empirical relations discussed above arelong term and not merely transitional. Moreover, King and Rebelo (1989)find that the dynamic of transition in the neoclassical model only explains asmall proportion of the growth experienced by the different countries.
2.4 Growth accounting models
On the basis of neoclassical growth theory, a whole theory ofgrowth “accounting” has appeared15 attempting to explain growth in termsof increases in capital and labor inputs. The residual is technological chan-ge. 15 See Solow (1957) and Abramowitz (1956).
RODRIGO VERGARA 15
Assuming a production function that is homogeneous in degree one(constant returns to scale), with competitive markets, it can be shown that:
gy = αgk + (1 - α)gL (2)
where:
gy = growth of rate of outputgk = rate of growth of capital stockgL = is rate of growth of employmentα = share of capital in total income(1-α) = share of labor in total income
If a technology parameter of the form A(t) is included in the pro-duction function, equation (2) would also contain a term representing therate of technical change. This would be the fraction of growth not explai-ned by increases in capital and labor inputs.
The problem is that, empirically, this residual turns out to be veryhigh. On average it accounts for nearly half of the growth of countries;even when other factors such as human capital are included, the residualcontinues to be important. Thus, not even as an accounting approach isneoclassical growth theory successful. Of course a defender of neoclassicaltheory might argue that the entire residual is indeed technological change.However, the magnitude of the figures and the big differences betweencountries, make this argument difficult to sustain.
Furthermore, Boskin and Lau (1990), estimate a production functionfor five countries (United States, United Kingdom, France, West Germanyand Japan) to test whether the three basic assumptions used to measureproductivity in this type of exercise —constant returns to scale, neutraltechnological progress and utility maximization— are observed in practice.They found that the three assumptions are rejected by the data.
3. New growth models
It is curious that with the neoclassical model being unsatisfactorynot only theoretically but also empirically, a new line of growth theory hastaken so long to appear.16
New growth models do away with a series of assumptions made inneoclassical theory. First and foremost, the assumption of constant returns
16 Especially considering that there are certain writings by Adam Smith and otherclassical authors which put emphasis on increasing returns to scale (see Romer, 1987b).
16 ESTUDIOS PÚBLICOS
to scale is discarded and replaced by an assumption of increasing returns.In addition, the assumptions of technological change and exogenous humancapital are discarded. These models are called “endogenous growth mo-dels” to draw attention to the fact that long-term growth does not dependon exogenous factors alone.
However, when increasing returns to scale are introduced, thesemodels are confronted by a serious theoretical challenge. Under increasingreturns to scale, competitive equilibrium does not exist, because the totalamount produced is not enough to pay the factors of production. In the lightof this, endogenous growth models have recourse to one of two alternativeassumptions: (1) external economies to the firm, and (2) the absence ofcompetition. Under the first assumption there are increasing returns at theaggregate level, but constant returns at the level of the firm. This ensuresthe existence of competitive equilibrium, although this equilibrium is notoptimal17. The first increasing-returns-to-scale models mainly used this as-sumption (see Romer 1986, Lucas 1988, Barro 1990, King and Robson1989, Stokey 1990). We shall discuss these models in further detail below.Under the second assumption, the absence of perfect competition is accep-ted, i.e., different types of monopoly and monopolistic practices are assu-med: specifically that technology is produced and or transmitted in non-perfectly competitive markets (there are patents, copyrights, etc., whichprevent a new technology being used freely by everyone). It is preciselythis market power that gives the incentives needed for individuals andindustries to develop new technologies (see Romer 1990a and 1990b; Gros-sman and Helpman 1989a and 1989b).
Perhaps the most important feature of these models is that they givespace for policies affecting saving and investment to affect countries’ long-term growth rates. This is a fundamental difference from the neoclassicalmodel18.
In the remainder of this section, the main characteristics of the Ro-mer (1986) model, which gave rise to this whole line of research, willfirstly be set out, to see how these models function technically. In the
17 We are referring to the concept of “externalities”. In other words the firm does notrealize that some of its actions will have positive effects at the aggregate level. For example, adiscovery by one firm in particular will spread throughout the market. The concept of “lear-ning by doing” (Arrow, 1962) has been an important source of inspiration in this literature.According to this, technological discoveries have a social benefit effect that is not perceivedby the person making the discovery, as other firms and activities can freely use them.
18 King and Rebelo (1990), in an endogenous growth model, show that the effects ofpolicies are quantitatively much more important than in the neoclassical model, as they affectnot only the transition but also the long run.
RODRIGO VERGARA 17
second place, a brief review of the theoretical literature will be made,divided according to the emphasis of the different models. Finally, theempirical evidence found in various studies will be analyzed.
3.1 Romer (1986): Externalities and growth
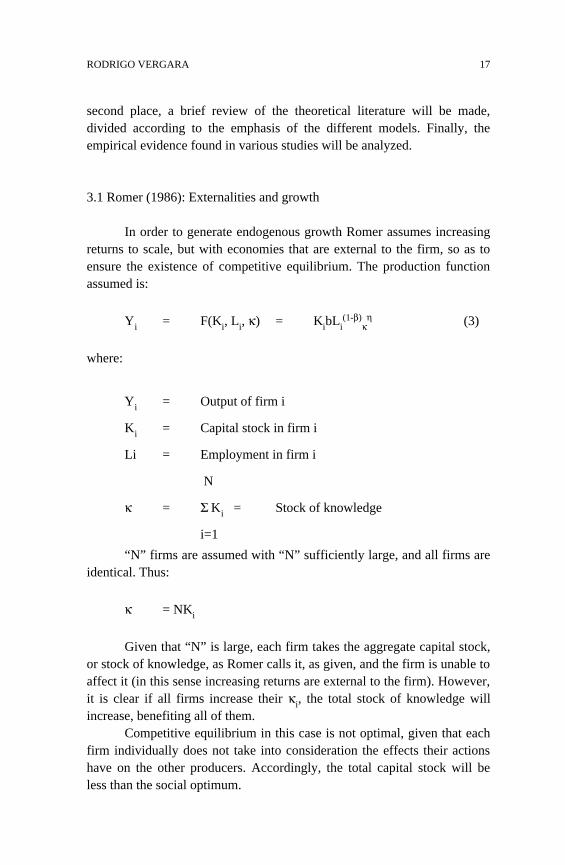
In order to generate endogenous growth Romer assumes increasingreturns to scale, but with economies that are external to the firm, so as toensure the existence of competitive equilibrium. The production functionassumed is:
Yi = F(Ki, Li, κ) = KibLi(1-β)
κη (3)
where:
Yi = Output of firm i
Ki = Capital stock in firm i
Li = Employment in firm i
N
κ = Σ Ki = Stock of knowledge
i=1
“N” firms are assumed with “N” sufficiently large, and all firms areidentical. Thus:
κ = NKi
Given that “N” is large, each firm takes the aggregate capital stock,or stock of knowledge, as Romer calls it, as given, and the firm is unable toaffect it (in this sense increasing returns are external to the firm). However,it is clear if all firms increase their κi, the total stock of knowledge willincrease, benefiting all of them.
Competitive equilibrium in this case is not optimal, given that eachfirm individually does not take into consideration the effects their actionshave on the other producers. Accordingly, the total capital stock will beless than the social optimum.
18 ESTUDIOS PÚBLICOS
As there are increasing returns to scale in the production function,capital accumulation can generate endogenous growth19. The decreasingreturns to capital which slow down long-term growth in the Solow modelare not present here. A higher saving rate, the result of a lower inter-temporal discount rate, for example, will translate into a higher steady-stategrowth rate. Various policies affecting the saving rate will, therefore, havean influence on the long-run growth rate.
In synthesis, Romer puts forward an endogenous growth modelwhere output per person can grow without limit. The rate of investmentdoes not decline over time as capital accumulates, because the marginalproductivity of this factor is not decreasing. This means that poor countriesdo not necessarily invest more than rich countries, and so there is noconvergence.
3.2. Brief literature review
To obtain endogenous growth, one way or another, the economymust have increasing returns to scale (or more specifically, constant returnsto factors that can be accumulated). Different alternatives have been usedto satisfy this requirement, depending on what different authors have wan-ted to stress as the main determinants of growth. Some of these, which wediscuss below, are:
a) Externalities resulting from research and development (R&D),b) human capital, and c) specialization. These alternatives are not mutuallyexclusive nor do they exclude others; i.e. a given model may generateendogenous growth with more than one of the assumptions mentioned. Infact most of the models in this new literaturedo include more than one ofthese elements. The division that has been chosen here is for methodologi-cal purposes only.
19 To be more rigorous we should say that increasing returns is not a sufficientcondition for there to be positive endogenous growth in the long run (note that in this modelthere is no technological growth, so according to the neoclassical model the steady stategrowth rate ought to be equal to zero). One requires at least, constant returns to factors thatcan be accumulated (in this case capital). In other words we need β + η ≥ 1. If β + η = 1growth will be constant in the long run, whereas if β + η > 1, growth will be explosive (seeSala-i-Martin, 1989, for a technical discussion on this point). Note also that increasing returnsis not a necessary condition to generate endogenous growth, because if the production func-tion included a single factor of production that could be accumulated, that would be enough tohave constant returns.
RODRIGO VERGARA 19
a) Externalities
The Romer (1986) model, described above, was the first in this lineof research.
In another article the same author constructs a model where themain source of growth, as in Solow, is technological progress (Romer1990a). However, unlike Solow this comes from maximization decisionsby economic agents; i.e. it is not exogenous. The good “technology” or“knowledge” is “non-rival” and partially “non-excludable”20. It is onlypartially non-excludable because the person developing the technology canpatent it and produce intermediate goods with it, in which he will act as amonopoly. Hence, there are incentives to develop technology. It is nottotally excludable because this technology will help to produce new tech-nology, which ex-ante is non-appropriable. Romer assumes that the pro-duction function for new technology is linear with respect to the alreadyexisting technology stock, and depends also on the stock of human capital.Increasing returns in the human-capital-producing sector produces endoge-nous technology growth which translates into a growth rate for the eco-nomy that is also endogenous. Finally, as the benefits of technology are notfully appropriable, less will be produced than the socially optimal amount,so any policy tending to reduce the difference between the private andsocial return to technology production (e.g. a research subsidy) will raisethe economy’s growth rate.
Grossman and Helpman (1989a and 1989b), in models which em-phasize the effects of international trade on growth and welfare, also inclu-de a positive externality in research and development. In general, policiestending to shift resources from the R&D-producing sector towards anyother sector will retard growth.
b) Human capital
Lucas (1988) presents two models in which he stresses the accumu-lation of human capital as a fundamental determinant of long-run growth.In the first of these, two factors of production are assumed, physical capitaland human capital. As both factors can be accumulated, and as constantreturns are assumed in the production function, the model can generate
20 The terms “non- rival” and “non-excludable” come from the public finance litera-ture. A pure public good is non-rival (several individuals can use it at the same time) and non-excludable (nobody can be excluded from using the good). A typical example is nationaldefense. A private good is rival and excludable.
20 ESTUDIOS PÚBLICOS
endogenous growth. An additional requirement, however, is that the humancapital production function should not be decreasing in the stock of humancapital. Lucas assumes a human capital production function which dependsonly on its stock, and which is linear (i.e. it has constant returns to scale).Thus, the marginal productivity of human capital does not fall as its stockincreases, for which reason there are incentives to continue accumulating it.Thus it is the human-capital-producing sector that drives the economy andgenerates perpetual growth. Although, under the above assumptions, it isnot necessary to assume externalities to generate endogenous growth, Lu-cas incorporates them by assuming that an individual’s productivity impro-ves when he or she works with other individuals of “high” average quality(in terms of human capital)21. This model, like Romer (1986), does notpredict convergence and gives rise to a positive relation between savingand growth.
In his second model, Lucas (1988) focuses on the concept of “lear-ning by doing” to generate the same results as before.
As has already been mentioned, the article by Romer (1990a) ontechnological change also places emphasis on human capital as a funda-mental determinant of long-term growth. Indeed, this factor is used intensi-vely in the production of technology. However, unlike Lucas (1988), whatdrives growth is not the human-capital-producing sector but the sector pro-ducing technology. Thus, if it were impossible to act directly through poli-cies in the technology-producing sector, the second best alternative wouldbe to promote the development of human capital.
Becker, Murphy and Tamura (1990) relate human capital to fertilityand growth. A human-capital production function with non-decreasing re-turns to this factor is the basis for a perpetual growth process and alsoimplies that the profitability of investing in human capital rises along withits stock. Thus, the higher of the stock of human capital, the higher theinvestment in human capital and the lower the investment in children. Forthe same reason, societies with high educational levels tend to have lowerfertility rates and higher rates of growth than those with lower levels ofeducation22. In this model two stable steady states are produced. One invol-ving under-development with a low stock of human capital, high fertilityand low growth, and another involving development with a high humancapital stock, low fertility and high growth. The elements that determine aneconomy’s starting point (which these authors call history) will be impor-
21 This assumption helps him to obtain certain desired results relating to migration.22 In other words, greater economic development reduces the quantity but increases
the quality of children.
RODRIGO VERGARA 21
tant determinants of which steady state a given country achieves. Variousshocks can shake an economy off one steady state and move it on to acourse leading to the other. Hence, what these authors call “luck” can alsobe important. Likewise, policies that encourage the development of humancapital over a prolonged period can lift an economy from a state of under-development.
In Stokey (1990) investment in human capital has a positive exter-nality in the productivity of future generations’ human capital, and thisboosts growth. Romer (1989b) emphasizes the stock of human capital (ra-ther than its rate of growth) as a determinant of economic growth.
c) Specialization
Another group of models highlights specialization as a source ofgrowth23.
The idea that specialization leads to increasing returns to scale hasbeen formalized by Ethier (1982) and widely used in international trademodels. According to this, the production function is an increasing functionof the number of intermediate inputs used in production. Thus the higherthe number of intermediate inputs, the greater the specialization in theirproduction, and therefore the greater the final output. However, there is alimit to specialization given by the fixed costs that have to be incurred toproduce a new intermediate good. This avoids a solution where there are aninfinite number of firms, each producing an infinitessimal amount.
Romer (1987a) uses a model of this type, where increasing speciali-zation produces permanent growth. Greater accumulation of capital transla-tes into a larger number of intermediate inputs (i.e. in greater specializationin production) and hence into higher growth rates. For the same reason,policies to encourage saving promote long-term growth.
Grossman and Helpman (1989a and 1989b) use the same type ofmodel for the case of international trade. Commercial openness gives acce-ss to a larger number of intermediate goods and technology, and this pro-motes growth. In Romer (1990a) access to the rest of the world’s markets(i.e. to a larger market) promotes greater research and so translates intohigher growth. Here, however, the size of the market is related to the stockof human capital more than to the number of consumers.
23 The idea of specialization as a source of growth originates with Adam Smith, whoargued that the division of labor stimulated economic growth.
22 ESTUDIOS PÚBLICOS
3.3. Empirical evidence
The new growth models gained enormous popularity because theysolved several of the problems of the neoclassical model. Specially, theygave a theoretical basis to different elements which in day-to-day discourseare assumed to affect growth.
However, as there are several models, there is a need for one ormore criteria to discriminate between them. Clearly one criterion, perhapsthe most important, relates to empirical evidence, which will tell us whe-ther a factor that is assumed to affect growth finds support in the data ornot. If it does not, then it is likely to be quickly rejected24. The need toverify many of the assumptions and results of the new growth models hasgenerated a boom in the empirical literature on this issue. The main empiri-cal studies on the determinants of long-term growth are reviewed below.
Perhaps the most important study on this issue is Barro (1989) whi-ch uses the Summers and Heston growth figures, as well as other seriesfrom different sources for 98 countries (for the vast majority of which heobtains series for all the relevant data). The period used is 1960-1985.Clearly having a series for a longer period would enable more robust con-clusions be obtained, but unfortunately such series do not exist for a bigenough sample of countries.
As a proxy for a initial human capital Barro uses attendance rates atprimary and secondary school in 1960 (United Nations figures). In theregressions each of these variables shows a positive and significant correla-tion with growth, and the results do not change when other proxies are usedfor human capital. Furthermore, when human capital is controlled for, thereis evidence of convergence, i.e. the initial level of income shows a negativecorrelation with the growth rate.
The Barro regressions also show that government consumption isnegatively correlated with long-run growth, whereas public-sector invest-ment and growth are not correlated25. The results for public-sector con-sumption can be interpreted, according to the author, as indicative of thedistorting effects of taxes and government spending programs.
The data also show that political stability26 is positively correlatedwith growth, which could be pointing to the benefits of having property
24 The failure to find evidence, however, may also be due to a lack of adequateinformation.
25 Government consumption expenditure excludes defense and education that theauthor considers them more related to investment. Both variables —consumption and publicsector investment— are measured in relation to GDP.
26 Barro uses different proxies to measure political stability, such as the number ofdeaths due to political causes and the number of revolutions or coups d’état per unit of time.
RODRIGO VERGARA 23
rights firmly established. One also sees a negative correlation betweengrowth and distortions in capital goods prices.
Finally, despite the fit of the regressions being highly satisfactory,there are two regions of the world —Latin America and Sub-Saharan Afri-ca— where the growth performance is significantly poorer than can beexplained by the variables mentioned. This would mean that there are othervariables that have not been considered which have been important factorsin the meager performance of these regions.
De Long and Summers (1991) find a positive association betweenlong-term growth and investment in machinery and equipment. Indeed,controlling for initial GDP and for growth of the labor force, they find thatone additional percentage point of investment in machinery and equipment(as a percentage of GDP) translates into an addition to the average annualgrowth rate of one third of a percentage point. The sample used includesdata for 25 countries with per-capita GDPs over 25% of the USA’s in1960, for the period 1960-1985. A similar result —although slightly lesssignificant— is obtained when 61 countries for which there is data areincluded.
Romer (1989b), using data from 112 countries over the period 1960-1985, finds that the proxy he uses for human capital —literacy— is notsignificant in a growth regression. However, it does appear as significant inthe investment regression, whereby human capital would be affectinggrowth by promoting greater investment in physical capital.
Barro and Sala-i-Martin (1990) find evidence of convergence in astudy of 98 countries over the period 1960-85, but only after controlling forhuman capital and government consumption spending as a percentage ofGDP. However, the convergence is very slow and very difficult to reconci-le with credible parameters for a constant-returns-to-scale production func-tion. The results are more consistent with endogenous growth models dis-playing constant returns to scale. The results are more consistent withendogenous growth models that display constant returns to capital (capitalwhich also includes human capital) and with a gradual diffusion of techno-logy among countries.
Fischer (1991) finds that countries that administer short-run ma-croeconomic variables better (for example, inflation and the fiscal deficit)tend to have a higher long-term growth rate. Part of this is explainedbecause better macroeconomic management increases investment. Howe-ver this type of variable seems also to exert an independent influence ongrowth.
24 ESTUDIOS PÚBLICOS
Easterly and Wetzel (1989) find that long-term growth is positivelycorrelated with investment, its efficiency, and the economy’s degree ofopenness to international trade, whereas it correlates negatively with thelevel of distortions in the economy.
Murphy, Shleifer and Vishny (1990) argue that growth depends notonly on the stock of human capital, but also on the distribution of talentsamong the different occupations. In particular, if the economic system allo-ws those with business talent to devote themselves to “doing business”, thiswill be highly beneficial for economic growth. In contrast, when the systeminduces talented people to become rent-seekers, growth will be harmedbecause these individuals will become rich by causing income to be redis-tributed towards them, instead of creating wealth. To verify this hypothesisempirically, the authors use the same Barro (1989) regression, but add, thepercentages of students entering university to study law and engineering, asexplanatory variables. The percentage starting law degrees would be aproxy for talents dedicated to rent-seeking, while the percentage of thosestudying engineering would proxy for those dedicated to productive activi-ties or technological innovation27. The empirical results confirm theauthor’s assumption: the percentage of engineers does seem to affectgrowth positively, while that of lawyers does so negatively.
Finally, it should be noted that there are also authors who havecome out in defense of the Solow model. For example Romer and Weil(1990) carry out a series of estimations from which they conclude thatwhen human capital is included in the Solow model, the model providesresults that are consistent with the empirical evidence.
4. Some implications for a development strategy: Chilean case
The new growth models stress aspects such as human capital, open-ness to international trade, the absence of distortions, political and socialstability, the size of the government, research and development in technolo-gy, patents, efficiency of investment, etc., as factors determining economicgrowth. A better level in these variables will not only translate into greateroutput, but also into higher long-term growth. In these models, distortionsnot only produce the well known Harberger triangle, representing the wel-fare loss in static terms, but also have a negative effect in dynamic terms,which translates into lower growth.
27 It is clear that the choice of these proxies is quite arbitrary and therefore highlycontroversial.
RODRIGO VERGARA 25
Over the last 30 years Chile has had a meager economic performan-ce in growth terms; however, when the variables that appear as importantfor long-term growth are evaluated, future prospects are more encouraging.
Perhaps the variable most emphasized in both the theoretical andempirical literature is human capital. If variables such as schooling or theilliteracy rate are used to measure human capital, Chile seems to be arelatively privileged country. For example, in the Barro study (1989) in1960 Chile is among the top 20 countries in terms of primary schooling andin the top 40 counties as regards secondary schooling28.
Moreover, the literacy rate according to the World Bank —98%—is probably the highest in Latin America and similar to that of developedcountries29. Although it is encouraging to think that this country has a goodreserve of human capital which would be beneficial for achieving highgrowth rates in the future, it is also true that Chile has been in that positionfor a long time (remember that the data used by Barro are for 1960), yet ithas not had a high average rate of growth. This suggests that to explain ourpoor performance we should seek other alternatives. Despite this, oneshould not ignore this variable which appears highly correlated with long-run growth in all studies on this issue. Spending on the quantity and qualityof education should be seen as a highly profitable investment.
Government spending is a variable which, in various studies, isnegatively correlated with growth. Probably this reflects the distortingeffect of taxes, so there is a need to be careful not to promote a dispropor-tionate growth in the size of the state. According to Barro’s data, ourcountry is in 39th place out of a total of 98 in terms of public spending as apercentage of GDP30.
The fact that investment in machinery and equipment appears asmore productive than investment in infrastructure (De Long and Summers,1991), gives rises to explicit policy recommendations on this question.Indeed, as these authors argue, if this result is to be believed, then taxes andsubsidies encouraging such investment will promote growth. The possiblecosts of these policies will be minimal compared with their supposed bene-fits. In any case, even if there are no explicit incentives, at least all types ofdisincentive for this type of investment should be avoided. A proportion of
28 Barro uses schooling in the year 1960 to measure the human capital stock, becausehe is interested in having a proxy for the initial stock of this variable.
29 In this World Bank study on quality of life, Chile is in 24th place (World Bank1990), a result that is heavily influenced by the high rates of literacy and life expectancy inour country.
30 Excluding education and defense.
26 ESTUDIOS PÚBLICOS
Chile’s investment in machinery and equipment is imported, so any obsta-cle in this sense would be harmful. It is worth nothing that in the De Longand Summers study, Chile is 60th out of 61 countries as regards this type ofinvestment as a percentage of GDP.
International trade is another of the variables that appears stronglycorrelated with growth. This result is probably influenced by the spectacu-lar performance of East Asian countries which have used developmentstrategies oriented towards international trade. For much of the last 30years Chile followed a policy of import substitution, with all kinds ofinternational trade barriers. This may partly explain the low growth ratewhich has been referred to. Prospects on this issue today are clearly better,as the strategy being applied is one of openness to the outside world.
Price distortions have appeared in several studies as negatively co-rrelated with growth. Chile does not have a very distinguished record inthis regard —in the Barro (1989) study, Chile features as the country withthe second greatest relative price distortion; however, once again the pros-pects are promising in this respect, for it is clear that such distortions havebeen substantially reduced in our country in recent years.
On the question of political stability, Chile also does not do wellaccording to indicators used in various studies. However, as in the previouscases, the future looks more promising. Finally, there are two issues thatare worrying for their effect on our country’s growth, and they add a noteof caution to the general optimism about future prospects in which thissection has been presented.
The first point relates to the stability of policies and the macroeco-nomic environment in general. Chile has not been characterized in the last30 years as a country with a stable economic climate, and this has doubtlessharmed investment and growth. Various studies have corroborated the rela-tion between stability and investment. Solimano (1990) shows that thevariability of the real exchange rate (which would be a proxy for instabili-ty) has negatively affected investment in Chile. Likewise, Larraín and Ver-gara (1991), advance evidence that macroeconomic stability (again measu-red as the variability of the real exchange rate) is one of variables thatexplains the high rates of investment in East Asian countries. Table Nº 5 isa good example of this point. It can be seen that volatility in the realexchange rate in the period 1975-1988 is much greater in Latin Americancountries that in East Asian ones31. Moreover, of Latin American nations
31 Having said that, it should be stressed that the period in question is quite specialfor Latin America. Indeed, it is difficult to find another period in the history of the regionwhere there has been such instability. It would have been ideal to have a longer series for realexchange rate volatility; however, no reliable and comparable information is available on this.
RODRIGO VERGARA 27
included in this table Chile has the worst instability index after Argentina.If one accepts that instability affects investment, and if one believes inendogenous growth models, then the conclusion is that this type of instabi-lity produces negative effects on long-term growth. In any developmentstrategy, therefore, a fundamental task should be to produce and foment aclimate of macroeconomic stability.
It should be stressed, however, that a climate of consensus as regardthe optimal economic strategy to follow, such as has emerged in Chile inrecent times on the advisability of maintaining a market economy, certainlyhelps in the issue of macroeconomic stability.
TABLE Nº 5: VARIABILITY OF THE REAL EXCHANGE RATE, 1975-1988
* Defined as the average of the coefficients of variation between 1975 and 1988.The coefficient of variation for each year is calculated considering the period between (t-2)and t, where t is the corresponding year.Source: Larraín and Vergara (1991).
The second point relates to income distribution. Table Nº 6 showsfigures for income distribution for 46 countries32. The indicator used is thequotient between the percentage of income received by the richest quintileof the population and the percentage earned by the poorest quintile. The
32 The World Bank presents data for 42 countries. For the other four countries(Taiwan, Singapore, Chile and Kenya) the source is Larraín and Vergara (1991), based onspecific information for each country.
28 ESTUDIOS PÚBLICOS
TABLE Nº 6: INCOME DISTRIBUTION
(1) (2) (2)/(1) Country % of Income % of Income
received by 20% received by 20% Incomelowest income highest income distribution
1 Taiwan 8.8 37.2 4.22 Japan 8.7 37.5 4.33 Holland 8 3 36.2 4.44 Belgium 7 9 36.0 4.65 Germany 7.9 39.5 5 06 Ireland 7 2 39.4 5.57 Sweden 7 4 41.7 5.68 United Kingdom 7.0 39.7 5.79 Switzerland 6 6 38.0 5.810 Spain 6 9 40.0 5.811 Finland 6.3 37.6 6.012 Norway 6 0 38.2 6.413 Israel 6 0 39.9 6.714 Bangladesh 6.6 45.3 6.915 India 7 0 49.4 7.116 Italy 6 2 43.9 7.l17 Denmark 5.4 38.6 7.118 Indonesia 6 6 49.4 7.5l9 United States 5 3 39.9 7.520 Canada 5.3 40.0 7.521 Singapore 6 5 49.2 7.622 France 5 5 42.2 7.723 South Korea 5 7 45 3 7.924 Egypt 5 8 48 0 8.325 Sri Lanka 5.8 49.8 8.626 El Salvador 5 5 47.3 8.627 Hong Kong 5 4 47.0 8.728 Australia 5.4 47.1 8.729 New Zealand 5 l 44.7 8.830 Thailand 5 6 49.8 8.931 Portugal 5.2 49.1 9.432 Philippines 5.2 52.5 10.133 Argentina 4 4 50.3 11.434 Trinidad and Tobago 4 2 50.0 11.935 Chile 4.2 60.4 14.436 Mauritius 4 0 60.5 15.137 Malaysia 3 5 56.1 16.038 Turkey 3.5 56.5 16.139 Costa Rica 3 3 54.8 16.640 Zambia 3 4 61.1 18.041 Venezuela 3.0 54.0 18.042 Mexico 2 9 57.7 19.943 Ivory Coast 24 61.4 25.644 Panama 2.0 61.8 30.945 Peru I 9 61.0 32.146 Brazil 2 0 66.6 33.3
Source: (1) World Development Report 1989. World Bank. (2) Larraín and Vergara (1991).
RODRIGO VERGARA 29
bigger this quotient, the more unequally income is distributed. Chile is oneof the countries in the world with the worst income distribution (35th out of46), although here Chile compares favorably with other Latin Americancountries.
If one agrees with Barro (1989) that well defined property rights areimportant for achieving high growth rates, than a bad distribution of inco-me is worrying. Indeed, social pressures for greater equality can translateinto expropriations and transfers affecting property rights. Moreover, a baddistribution of income can also be negative in terms of instability. Whengovernments come under pressure from social demands, they tend to actprecipitously to satisfy these demands, and this gives rise to what is knownas the “populist cycle”33. If this is repeated with some frequency it causesinstability, and growth is harmed. Improving the distribution of incometherefore ought to be an important priority in any long-term strategy.However, here one has to be extremely cautious, for attempts to producedrastic changes in the income distribution over short periods leads to thepopulist cycle, which in the long run is damaging not only for growth, butalso for the income distribution itself.
5. Conclusions
For a developing country like Chile, the study of the determinantsof long-term growth is of the utmost importance. Although it is understan-dable that attention often gets focused on immediate and short-term issues,one should never forget that if the goal is to achieve a state of development,the only way of achieving this is by growing.
The neoclassical growth model does not offer an adequate analyticalframework for the growth process. The fact that exogenous technologicalchange is the only variable determining long-run growth in this model, isincompatible with the empirical evidence.
New growth models, or endogenous growth models, provide a hig-hly promising theoretical framework for studying the determinants ofgrowth. In these models, unlike the neoclassical model, a higher rate ofsaving will not only translate into a higher level of income, but also into ahigher growth rate.
One of the greatest merits of this new line of research is that growththeory appears as quite closely linked to the literature on development.
33 See Sachs (1989).
30 ESTUDIOS PÚBLICOS
Previously a absurd situation existed where the two topics had little ornothing in common. Economic growth theory was an interesting theory butof dubious practical application; development studies bore little relation tothis at all, and in addition lacked a sound theoretical base. New growthmodels have managed to bring the two fields significantly closer together.
Aspects such as human capital, international trade, distortions, theefficiency of investment and technological innovation are among othersfactors that endogenous growth models identify as important determinantsof long-term growth. In these models, convergence does not have to occur;i.e. it is likely that rich countries will continue to be rich, while poorcountries remain where they are at the present time.
Finally, despite its poor growth performance in the past, Chile isfacing a promising future. However, instability in macroeconomic policiesand the unequal income distribution in our country may prove to be twosources of frustration for these expectations.
REFERENCES
Abramovitz, M., 1956, “Resource and Output Trends in the United States Since 1870”, Re-view of Economic and Statistics, 39, August.
Arrow, K.J., 1962, “The Economic Implication of Learning by Doing”, Review of EconomicStudies 29, June.
World Bank, 1989, Human Development Report 1989.––––––– 1990, Human Development Report 1990.Baumol, W.J., 1986, “Productivity Growth, Convergence, and Welfare”, American Economic
Review 76, December.––––––– and E.N.Wolf, 1988, “Productivity Growth, Convergence, and Welfare: Reply”,
American Economic Review 78, December.Barro R., 1990, “Government Spending in a Simple Model of Endogenous Growth”, Journal
of Political Economy, October.–––––––1989, “Economic Growth in a Cross Section of Countries”, NBER Working Paper
Nº 9310, September.––––––– and R. Gordon, 1983, “Rules, Discretion, and Reputation in a Model of Monetary
Pohcy”, Journal of Monetary Economics 12, July.––––––– and X. Sala-i-Martin, 1990, “Economic Growth and Convergence Across the United
States”, NBER Working Paper Nº 3,419, August.Becker, C. Murphy K., and R.Tamura, 1990, “Human Capital, Fatility, and Economic
Growth”, Journal of Political Economy 98, October.Boskin, M.J., and L.J. Lau, 1990, “Post War Economic Growth in the Group of Five Countries
A New Analysis”, NBER Working Paper Nº 3,521, November.Cass, D.,1965, “Optimum Growth in a Aggregative Model of Capital Accumulation”, Review
of Economic Studies 32.
RODRIGO VERGARA 31
De Long, J.B., 1988, “Productivity Growth, Convergence, and Welfare: Comment”, AmericanEconomic Review 78, December.
––––––– and L Summers, 1991, “Equipment Investment and Economic Growth”, QuarterlyJournal of Economics 106, May.
Díaz, Alejandro, C., 1970, Essays on the Econornic History of the Argentine Republic. YaleUniversity Press.
Easterly, W., 1989, “Policy Distortions, Size of Government, and Growth”, NBER WorkingPaper Nº 3,214.
––––––– and D. Wetzel, 1989, “Policy Determinants of Growth: Survey of Theory and Evi-dence”, PPR Working Papers, World Bank, December.
Ethier, W.J., 1982, “National and International Returns to Scale in the Modern Theory ofIntcrnational Trade”, American Economic Review 72.
Fischer, S., 1991 Crowth, Macroeconomics and Development. NBER Working PaperNº 3,702, May.
Grossman G. M, and E. Helpman, 1989a, “Comparative Advantage and Long-Run Growth”,NBER Working Paper Nº 2,809, January.
––––––– 1989b, “Growth and Welfare in a Small Open Economy”, NBER Working PaperNº 2,970, July.
Kaldor, N., 1961, “Capital Accumulation and Economic Growth”, in F.A. Lutz andD.C.Hague eds., The Theory of Capital. New York, St. Martin’s Press.
King, M., and M. Robson, 1989, “Endogenous Growth and the Role of History”, NBERWorking Paper Nº 3,151, October.
King, R.C., and S. Rebelo, 1989, “Transitional Dynamics and Economic Growth in theNeoclassical Model”, NBER Working Paper Nº 3,185, November.
–––––––1990, “Public Policy and Economic Growth: Developing Neoclassical Implications”,Journal of Political Economy, October.
Koopmans, T.J., 1965, “On the Concept of Optimal Economic Growth”, in The EconometricApproach to Developing Planning, North Holland, Amsterdam.
Kydland, F. E., and E. Prescott, 1982, “Time to Build and Aggregate Fluctuations”, Econome-trica 50, November.
––––––– 1977, “Rules Rather Than Discretion: The Inconsistency of Optimal Plans”, Journalof Political Economy 85, June.
Larraín, F., and R. Vergara, 1991, “Investment and Macroeconomic Adjustment: the Case ofEast Asia”, unpublished manuscript, January.
Long, J. B., and C.J. Plosser,1983, “Real Business Cycles” Journal of Political Economy 91,February.
Lucas, R., 1987, Models of Business Cycle. Oxford, U.K., Basil Blackwell Ltd.––––––– 1988, “On the Mechanics of Economic Development”, Journal of Monetary Econo-
mics 22, July.Maddison, A., 1982, Phases of Capitalist Development. Oxford, Oxford University Press.Mankiw, C., Romer, D. and Weil, D., 1990 “A Contribution to the Empirics of Economic
Crowth” NBER Working Paper Nº 3,541, December.Murphy, K., Shleifer, A., and R. Vishny, 1990, “The Allocation of Talent: Implications for
Growth”, NBER Working Paper Nº 3,530, December.Ramsey, F. P., 1928, “A Mathematical Theory of Saving”, Economic Journal 38.Rebelo, S., 1991, “Long Run Policy Analysis and Long Run Growth”, Journal of Political
Economy, .forthcoming.
32 ESTUDIOS PÚBLICOS
Romer, P., 1986, “Increasing Returns and Long Run Growth”, Journal of Political Economy,94.
––––––– 1987a, “Growth Based on Increasing Returns Due to Specialization”, AmericanEconomic Review 77, May.
––––––– 1987b, “Growth, Capital Accumulation, and the Theory of Economics Dynamics”,unpublished manuscript, December.
––––––– 1989a, “Capital Accumulation in the Theory of Long Run Crowth”, in R. Barro ed.,Modern Business Cycle Theory. Harvard University Press.
––––––– 1989b, “Human Capital and Growth: Theory and Evidence” NBER Working PaperNº 3,173, November.
––––––– 1990a, “Endogenous Technological Change”, Journal of Political Economy, Octo-ber.
––––––– 1990b, “Are Non-Convexities Important for Understanding Growth?” NBER Wor-king Paper Nº 3,271, February.
Sachs, J., 1989, “Social Conflict and Populist Policies in Latin America”, NBER WorkingPaper Nº 2,897.
Solimano, A., 1990, “How Private Investment Reacts to Changing Macroeconomic Conditio-ns: the Chilean Expenence in the 80s”, PPR Working Paper Nº 212, World Bank.
Solow, R., 1956, “A Contribution to the Theory of Economic Growth”, Quarterly Journal ofEconomics 70, February.
––––––– 1957, “Technical Change and the Aggregate Production Function”, Review of Eco-nomics and Statistics 39, August.
Stokey, N. L., 1990, “Human Capital, Product Quality, and Growth”, NBER Working PaperNº 3,413, August.
Summers, R. and A. Heston, 1988, “A New Set of International Comparisons of Real Productand Price Levels Estimates for 130 Countries”, The Review of Income and Wealth34, March.