55
| Date post: | 09-Aug-2019 |
| Category: |
Documents |
| Upload: | truongdieu |
| View: | 213 times |
| Download: | 0 times |


TABLE OF CONTENTS\
LIST OF TABLES .................................................................................................................. II LIST OF FIGURES ................................................................................................................ II ACRONYMS........................................................................................................................ III I. INTRODUCTION.................................................................................................................1 II. THEORETICAL FRAMEWORK............................................................................................3
A. The Concept ........................................................................................................................ 3 B. Valuation Methods .............................................................................................................. 5
III. RELATED STUDIES .......................................................................................................15 A. Marine Transportation Valuation Studies ........................................................................ 15
1. Douglas-Westwood Limited. 2005. World Marine Markets. Douglas-Westwood Limited, Canterbury. ............................................................................................................... 15
2. Mandale, Maurice et al. 1998. Estimating the Economic Value of Coastal and Ocean Resources: The Case of Nova Scotia. Oceans Institute of Canada and Atlantic Coastal Zone Information, Canada.......................................................................................... 16
3. The Allen Consulting Group. 2004. The Economic Contribution of Australia’s Marine Industries .................................................................................................................... 18
4. Mandale, Maurice.2000. The Economic Value of Marine-Related Resources in New Brunswick. New Brunswick of Fisheries and Aquaculture and Department of Fisheries and Oceans, New Brunswick. .................................................................................. 20
5. Canmac Economics, School for Resource and Environmental Studies, Enterprise Management Consultants and the Secretariat of the Atlantic Coastal Zone Information Steering Committee. 2002. The Value of the Ocean Sector to the Economy of Prince Edward Island, prepared for the Government of Prince Edward Island and the Government of Canada, 114p. ......................................................................... 21
6. Kildow, Judith and Colgan, Charles. 2005. California’s Ocean Economy, Report to the Resources Agency, State of California. National Economics Program, California. .......... 22
7. United Nations. 2003. Review of Maritime Transport, 2003: Report by the UNCTAD Secretariat. United Nations, New York and Geneva............................................................... 23
B. Coastal Tourism ................................................................................................................ 23 1. Douglas-Westwood Limited. 2005. World Marine Markets. Douglas-Westwood
Limited, Canterbury. ............................................................................................................... 23 2. Mandale, Maurice et al. 1998. Estimating the Economic Value of Coastal and Ocean
Resources: The Case of Nova Scotia. Oceans Institute of Canada and Atlantic Coastal Zone Information, Canada.......................................................................................... 24
3. The Allen Consulting Group. 2004. The Economic Contribution of Australia’s Marine Industries .................................................................................................................... 25
4. Mandale, Maurice.2000. The Economic Value of Marine-Related Resources in New Brunswick. New Brunswick of Fisheries and Aquaculture and Department of Fisheries and Oceans, New Brunswick. .................................................................................. 25
5. King, Philip. Economic Analysis of Beach Spending and the Recreational Benefits of Beaches in the City of San Clemente....................................................................................... 25
6. Kildow, Judith and Colgan, Charles. 2005. California’s Ocean Economy, Report to the Resources Agency, State of California. National Economics Program, California. .......... 26
LITERATURE REVIEW ON MARINE TRANSPORTATION AND COASTAL TOURISM I
7. Samonte-Tan, G. PB., E. Tabara and C. Caballes. 2004. Coastal and Marine Biodiversity Resource Economic Valuation: Bohol Marine Triangle. The Coastal Conservation and Education Foundation, Inc. and Bohol Marine Triangle Project, Cebu City, 109 p. .................................................................................................................... 27
IV. PHILIPPINE MARITIME INDUSTRY..................................................................................29 A. Maritime Transportation Sector ........................................................................................ 29
1. Domestic Shipping.................................................................................................................. 29 2. Overseas Shipping................................................................................................................... 34
B. Port Sector ......................................................................................................................... 36 V. PHILIPPINE COASTAL TOURISM....................................................................................43
A. Status of Coastal Tourism in the Philippines and their Impacts ....................................... 43 B. Legal Framework .............................................................................................................. 44
REFERENCES....................................................................................................................48
LIST OF TABLES
Table 1. Resource Uses, Functions and Types of Value ............................................... 5 Table 3. Valuation Methods........................................................................................... 6 Table 3. Ports Key Data, 1994..................................................................................... 18 Table 4. Input-Output Multipliers, 1996-1997 ............................................................ 19 Table 5. Different Types of Tourist Spending in Nova Scotia .................................... 24 Table 6. Tourism Key Data, 1994................................................................................ 24 Table 7. Dive Shop Rates and Gross Revenues........................................................... 27 Table 8. Number of Tourists........................................................................................ 28 Table 9. Annual Net Revenues from Tourism Businesses .......................................... 28 Table 10. Annual Net Benefits from Tourism ............................................................... 28 Table 11. Shipping Industry Stakeholders..................................................................... 30 Table 12. Domestic Shipping Sector Policies................................................................ 32 Table 13. Overseas Shipping Sector Policies ................................................................ 35 Table 14. Port Facilities and Services............................................................................ 36 Table 15. Legal Authorities on Philippine Port System ................................................ 37 Table 16. Port Sector Policies........................................................................................ 40 Table 17. Indicators of Port Efficiency.......................................................................... 41 Table 18. Coastal Tourism Economic Impacts.............................................................. 43 Table 19. Coastal Tourism Issues, Applicable Policies and Responsible Agencies...... 44
LIST OF FIGURES
Figure 1. Total Economic Valuation Framework ........................................................... 3 Figure 2. Philippine Port System .................................................................................. 39
II THE PHILIPPINE ENVIRONMENTAL GOVERNANCE 2 PROJECT

ACRONYMS ABS - Australian Bureau of Statistics AO - Administrative Order BCDA - Bases Conversion Development Authority BMT - Bohol Marine Triangle CENRO - Community Environment and Natural Resources Office CHED - Commission on Higher Education CRM - Coastal Resources Management CSRS - Cargo Service Rating System DENR - Department of Environment and Natural Resources ECA - Environmentally Clinical Area EIS - Environmental Impact Statement EMB - Environmental Management Bureau FTE - Full-Time Equivalent GATS - General Agreement on Trade in Services GDP - Gross Domestic Product GRT - Gross Registered Tonnage HCPT - Harbor Center Port Terminal IACS - International Association of Classification Societies IEE - Initial Environmental Examination LGU - Local Government Unit MICT - Manila International Container Terminal MOA - Memorandum of Agreement MTC - Maritime Training Council NEDC - National Ecotourism Development Council NRT - Net Registered Tonnage NTC - National Telecommunications Commission PAWB - Protected Area Wildlife Bureau PD - Presidential Decree PFDA - Philippine Fisheries Development Authority PPA - Philippine Ports Authority PTA - Philippine Tourism Authority RA - Republic Act REC- - Regional Ecotourism Committee RORO - Roll-On Roll-Off SIC - Standard Industrial Classification TESDA - Technical Education and Skills Development Authority TEV - Total Economic Valuation UNCTAD - United Nations Conference on Trade and Development UNIDO - United Nations Industrial Development Organization WTO - World Tourism Organization
LITERATURE REVIEW ON MARINE TRANSPORTATION AND COASTAL TOURISM III

IV THE PHILIPPINE ENVIRONMENTAL GOVERNANCE 2 PROJECT
LITERATURE REVIEW ON MARINE TRANSPORTATION AND COASTAL TOURISM
I. INTRODUCTION Increasing governance in Coastal Resource Management (CRM) entails a comprehensive understanding of all the economic activities supported by coastal resources and services. It requires calculation of benefits and costs derived from a particular resource use such that policy changes are directed towards maximized sustainable use of the said resource. Resource valuation, then, provides a framework by which to evaluate economic impacts of coastal resource uses. It is a guide for decision-makers to arrive at the most optimal use of coastal resources. It attempts to quantify not only financial revenues from resources uses but also positive externalities and foregone costs from the present resource uses. In relation with this, the first section of this paper offers a glimpse of resource valuation which can be contextualized in studying coastal resources and their services. It outlines valuation techniques used, their advantages and disadvantages as well as the areas in which they are most applicable. The second part of this paper provides a review of related coastal valuation studies conducted for maritime transportation, port and coastal tourism. It seeks to present an overview of the valuation techniques which have been used and available valuation figures/data that can be used as reference for future studies. It should be noted that this paper is primarily concerned with the latter coastal resource uses. Douglas-Westwood (2005) in the study “World Marine Markets” lists maritime activities involving the following sectors: 1) Shipping and transport. This sector is categorized into: deep-sea transport (shipping
on long sea routes); and short-sea shipping (between national or local ports); 2) Marine leisure and tourism. This includes activities like sailing and boating, water
sports, recreational diving, sea angling and cruise holidays; 3) Marine equipment. These are the capital items of the civil and naval shipbuilding
sector such as the propulsion systems and machinery; 4) Offshore oil and gas. This is comprised of floating and sub-sea production, and
investments in offshore pipelines and onshore LNG plants; 5) Fish/seafood processing. 6) Fishing; 7) Shipbuilding; 8) Naval shipbuilding; 9) Ports. These are important for fishing industry, shipping cargoes and, tourism and
recreation; 10) Marine aquaculture; 11) Yacht and boatbuilding. This is a component of the leisure boating sector, including
marina operations and other operational expenditure, chandlery, motor sales etc;
LITERATURE REVIEW ON MARINE TRANSPORTATION AND COASTAL TOURISM 1

12) Cruise industry; 13) Research and Development (R & D); 14) Marine services. Activities of the sector are ship operations, broking and insurance,
and specialist publications; 15) Security and control. This is basically referring to maritime security which include,
among others, modifying ships and collecting security inspection fees; 16) Education and training. These are conducted for seafarer training, offshore worker
training and higher education for marine courses; 17) Underwater technology. This encompasses manufacturing of high technology
equipment related with hydrographic survey, oceanographic research and all other water operations. Examples of these are underwater vehicles (ROVs, AUVs), oceanographic instrumentation and deployment systems, sonars and survey systems and underwater navigation systems;
18) Underwater vehicle operations; 19) Media which is instrumental in dissemination of the industry’s market and technical
information; 20) Arts and culture. This is for increasing public awareness on marine industries and
forms part of leisure and tourism sector; and 21) Coastal engineering. The last part of the paper briefly introduces local maritime transport, port and coastal tourism activities. It describes the economic characteristics of each sector, its present status, institutional/organizational structure, existing issues and challenges and policies being implemented.
2 THE PHILIPPINE ENVIRONMENTAL GOVERNANCE 2 PROJECT

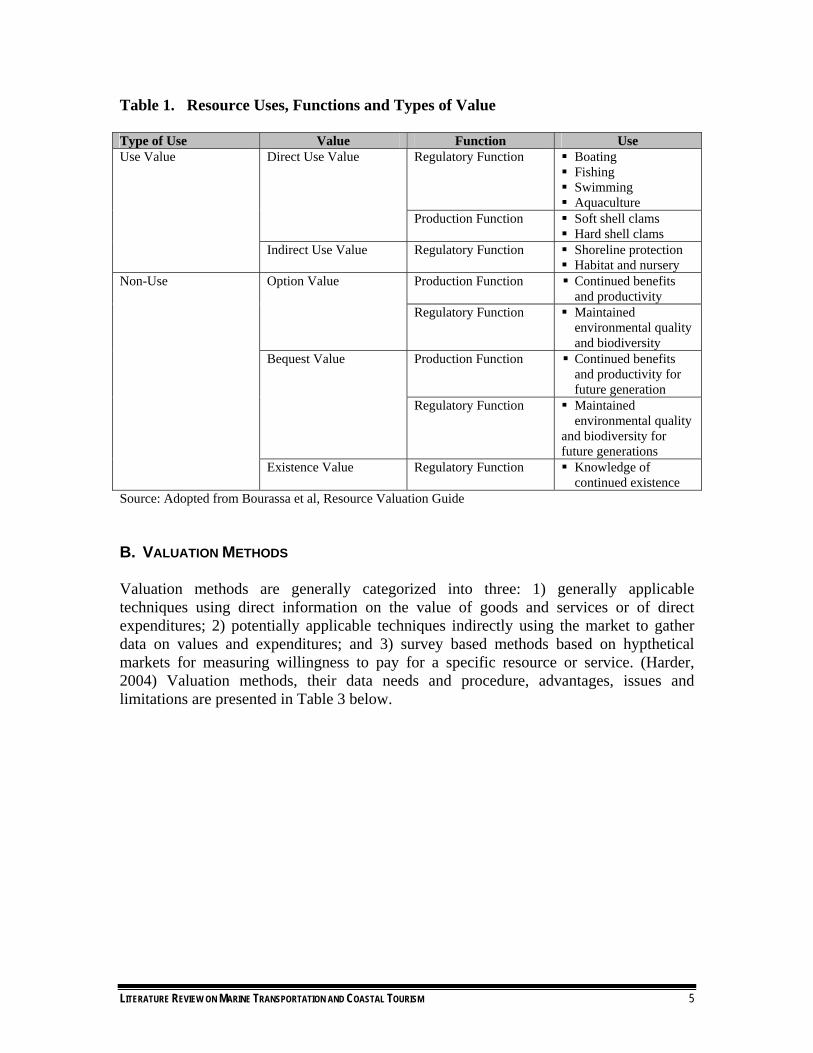
II. THEORETICAL FRAMEWORK A. THE CONCEPT Resource valuation is defined as “the process of assigning a measurable value, usually monetary, to a particular resource, product or activity.”1 It is an essential policy-making instrument that is based on the Total Economic Valuation (TEV) Approach, a significant decision-making tool that calculates the total value of a resource, other than its use values. (Francisco, 2003). Thus, TEV considers a resource’s use and non-use values. Use values can either be direct or indirect. Direct use values refer to consumptive values of goods and services which can either be extractive and non-extractive. Industrial processes, agricultural, recreation and tourism benefits are some uses belonging to this category. On the other hand, indirect use values mostly involve ecological services provided by natural resource ecosystems. In the case of the coastal sector, these functional gains are in the form of natural habitats, biological/ecosystem support, physical protection, physical location and life support. (Bourassa et al) On the other hand, non-use values are economic benefits gained from the resource even without direct physical consumption. These can be existence, option or bequest value. Existence value is the value of the resource to person knowing that the resource exists (is preserved) and can be used now and in the future. The value of protecting and/or conserving the resource for an option to use in the future is called option value. Bequest value is the value of a natural resource to a person desiring to bequest future generation with the opportunity to benefit from it. Figure 1 below shows the over-all framework.
Total Economic Value
Use Value Non-Use Value
Direct-Use Indirect-Use Option Value BequestExistence/
Preservation Value
Future direct and indirect
use
Value of leaving use and non-use
values to offspring
Value of leaving use and non-use
values to offspring
Functional benefits enjoyed
indirectly
Outputs/services that can be consumed
directly
Figure 1. Total Economic Valuation Framework Source: White and Trinidad. 2003. The Values of Philippine Coastal Resources: Why Protection and
Management are Critical
1 White, A. and Trinidad, A. 1998. The Values of Philippine Coastal Resources: Why Protection and Management are Critical. Coastal Resource Management Project, Cebu City.
LITERATURE REVIEW ON MARINE TRANSPORTATION AND COASTAL TOURISM 3

Essentially, TEV targets to measure the economic impacts and/or contribution of a resource, the effects of resource uses and in the end, develop strategies that will enhance economic values and reduce degradation of the said resource. The valuation, in general, entails the following key activities: 1) Identification of valuation objectives. This is determining the reasons for the conduct
of the resource valuation. This is relevant in the succeeding decision-making processes that will be undertaken based on the results of the valuation. A coastal city may opt to conduct a valuation study to measure economic contributions of its resources—fish, coral reefs, shore—and negative impacts of present resource uses for the purpose of identifying management activities;
2) Identification of all uses and ecosystem functions. This is an essential step to capture the total value of the resource. List the major uses and functions supported by the resource. A direct and/or indirect relationship of existing economic activities and, uses and functions must be established to set direction for policy-making. In more details, however, actual and potential uses should be identified for a comprehensive assessment of the value of the resource being studied;
3) Data collection. Assuming that the parameters to be used in the valuation have already been selected, data collection is the next step to be taken. For a successful data collection, it is necessary that the valuation method and corresponding necessary variables have been clearly identified and matched. In this way, establishing interrelatedness and/or cause-effect relationships of factors involved becomes easier;
4) Identification of direct and/or indirect linkages between uses and functions. This is evaluating positive and negative impacts of resource uses on the functions supported by the resource. For example, fishing activities should be assessed in reference to the coastal habitat condition. Tourism activities, for one, affect water quality along the beach. Actual and potential uses, again, should be considered;
5) Categorization of uses and determinants of value. This is classifying uses according to value. This is a prerequisite to identifying valuation technique to be used. A sample table (Table 1) for a coastal valuation study is provided below.
6) Identify appropriate valuation techniques by uses. Given the uses of the resource, an appropriate valuation method should be determined vis-à-vis the valuation objectives. These valuation techniques will be discussed in the later section.
7) Compute for Total Economic Value. After identifying the values of a resource with the selected valuation techniques, given the uses and functions supported by the resource, the TEV is, then, computed; and
8) Identify options for achieving program objectives. Valuation results have to be examined in relation to the program objectives. Various options have to be identified for choosing of the best preferred strategy. (Bourassa et al).
4 THE PHILIPPINE ENVIRONMENTAL GOVERNANCE 2 PROJECT
LITERATURE REVIEW ON MARINE TRANSPORTATION AND COASTAL TOURISM 5
Table 1. Resource Uses, Functions and Types of Value Type of Use Value Function Use
Regulatory Function Boating Fishing Swimming Aquaculture
Direct Use Value
Production Function Soft shell clams Hard shell clams
Use Value
Indirect Use Value Regulatory Function Shoreline protection Habitat and nursery
Production Function Continued benefits and productivity
Option Value
Regulatory Function Maintained environmental quality and biodiversity
Production Function Continued benefits and productivity for future generation
Bequest Value
Regulatory Function Maintained environmental quality
and biodiversity for future generations
Non-Use
Existence Value Regulatory Function Knowledge of continued existence
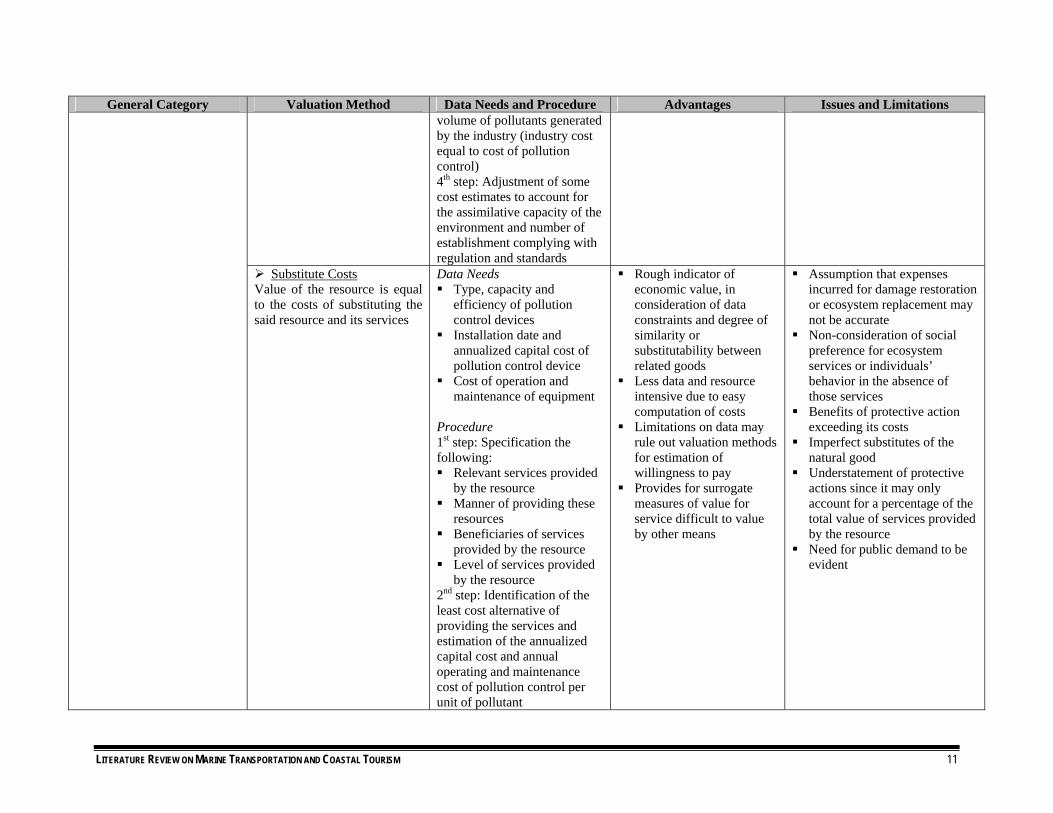
Source: Adopted from Bourassa et al, Resource Valuation Guide B. VALUATION METHODS Valuation methods are generally categorized into three: 1) generally applicable techniques using direct information on the value of goods and services or of direct expenditures; 2) potentially applicable techniques indirectly using the market to gather data on values and expenditures; and 3) survey based methods based on hypthetical markets for measuring willingness to pay for a specific resource or service. (Harder, 2004) Valuation methods, their data needs and procedure, advantages, issues and limitations are presented in Table 3 below.

Table 3. Valuation Methods
General Category Valuation Method Data Needs and Procedure Advantages Issues and Limitations Production Function Method
Also known as net factor income or derived value method
Used in measuring economic value of ecosystem products or services contributing to the production of commercially marketed goods, along with other production inputs
Economic benefit on resource improvements computed through changes in observable market data, i.e, change in consumer surplus brought about by a change in the quality or price of the final good to consumers and production surplus affected by changes in productivity or production costs
Data Needs Data on how changes in the
quantity or quality of the resource affect production cost of final good and, supply and demand for other factors of production
Procedure 1st step: Specification of a
production function 2nd step: Estimation on the
effects of cost changes to changes in quality
3rd step: Estimation of the economic benefits of a policy
Less data required and availability of relevant data
Less expensive Clear-cut methodology
Limited only to resources used as inputs in the production of marketed goods
Understatement of the true societal value of the resource by the inferred value of the ecosystem due to non-relatedness of some ecosystem services to the production of marketed goods
Lack of information on scientific relationships between options to improve quality or quantity of the resource and actual outcomes of those options
Complexity of the method and difficulty in application in cases where changes in natural resource affect the market price of the final good or other prices of production inputs
1) Market Prices or Revealed Willingness to Pay
Uses market price in valuing tradable goods or services
Change in Productivity/Effects on Productivity Method
Used in estimating physical changes in production or output (off site and on site) caused by resource and environmental degradation
Uses market prices or adjusted market prices in cases where there are
Data Needs Market prices or adjusted
market prices Procedure 1st step: Determination of
the damage function, relating the cause and effect of the impact
2nd step: Measurement of the physical change or loss
Less data required and availability of relevant data
Less expensive Clear-cut methodology
Effects on flora and fauna valued only in terms of its contribution to human production and income
Exclusion of other affected species not having commercial value
Does not consider general equilibrium effects or feedback on price
6 THE PHILIPPINE ENVIRONMENTAL GOVERNANCE 2 PROJECT

General Category Valuation Method Data Needs and Procedure Advantages Issues and Limitations distortions
Commonly applied to fisheries and tourism
Compares actual yield over time with sustainable yield or yield which could have been realized without the damaging activity
Estimates productivity effects using the following scenarios: with the project and without the project; with and without the damaging activity; and comparison of actual yield over time with the efficient and sustainable yield that would have been realized in the absence of project or damaging activity
of service (by volume or area) as a result of the impact
3rd step: Application of the corresponding market value per unit of service per area
Hedonic Pricing Method Applicable to computing
values for ecosystem or environmental services directly affecting market prices; based on the premise that the price of a marketed good signals its characteristics or attributes
Typically used in determining housing prices as a function of local environmental attributes
Estimates economic benefits or costs associated with environmental quality and environmental amenities
Data Needs Cross-section and/or time-
series on selling prices and locations of residential properties
Property characteristics affecting selling prices
Neighborhood characteristics affecting selling prices
Accessibility characteristics effecting prices
Environmental characteristics
Procedure 1st step: Data collection on
residential property sales in the region for a specific
Allows estimation of values based on actual choices
Property markets as good indicators of value
Reliability of property records
Availability of property sales data and characteristics
Flexibility of the method
Limited scope of environmental benefits as it relates to housing prices only
Only captures people’s willingness to pay for perceived difference in attributes and their direct consequences
Assumes people having the opportunity to select a combination of preferred features with their level of income; external market also affected by external factors like taxes, interest rates etc.
Complexity in the implementation and interpretation of the model requiring high degree of
LITERATURE REVIEW ON MARINE TRANSPORTATION AND COASTAL TOURISM 7

General Category Valuation Method Data Needs and Procedure Advantages Issues and Limitations time period
2nd step: Statistical estimation (regression analysis) of a function relating property values to its characteristics and environmental characteristics of interest
statistical expertise Results heavily dependent on
model specification Requires large amounts of data Expensive and time consuming
Travel Cost Method Used in valuing recreational
goods and services Calculates economic
benefits or costs associated with changes in access costs for a recreational site, elimination of an existing recreational site, addition of a new recreational site and changes in environmental quality of a recreational site
Based on the premise that time and travel cost spent by the people represent access price to the site
Data Needs Number of visits from each
origin zone Demographic information
about people per zone Round-trip mileage per
zone Travel costs per mile Opportunity costs of travel
time Location of the visitor’s
home Number of times of site
visits in the past year/season
Duration of the trip Amount of time spent at the
site Travel expenses Income or other
information on the value of their time
Other socio-economic characteristics of the visitor
Other locations visited during the same trip and amount of time spent at each
Purpose of visit to the site Environmental quality
perceptions
Similar to conventional empirical techniques used in estimating economic values based on market prices
Based on actual behavior Less expensive Capacity to collect large
sample through on-site surveys
Easy to interpret results
Assumes that people perceive and react to changes in travel costs the same way they react to changes in admission price
Has the tendency to overestimate, particularly for multipurpose site visits
Various methods in measuring opportunity cost of travel time
Values affected by availability of substitute sites
Inability to capture true value of respondents living near to the site with low travel costs but high value for the site under study
Has the tendency towards sample bias due to on-site interviews
Difficulty in measuring recreational quality and relating this to environmental quality
Lack of information on gains and losses from anticipated changes in resource conditions
Not well suited for sites near major population centers where visitations may come from origin zones clustered together
Limited scope due to user
8 THE PHILIPPINE ENVIRONMENTAL GOVERNANCE 2 PROJECT

General Category Valuation Method Data Needs and Procedure Advantages Issues and Limitations Quality of the recreational
experience at the site and other similar sites
Substitute sites which the person can visit
Procedure 1st step: Estimation of the
relationship between the number of visits and travel costs as well as other related factors using regression analysis
2ns step: Estimation of the change in value of site with quality changes
participation requirement; cannot be used in the following areas: assigning values to on-site environmental features and functions found invaluable by users; valuing off-site values supported by the site; and measuring non-use values
Results based on choice of functional form used, estimation method and variables included in the model
2) Imputed Willingness to Pay
Valuation of ecosystem services using amount of money people are willing to spend to avoid loss or replacement of the said ecosystem services
Assumes that the value of ecosystem services is equal to the amount people are willing to spend to avoid loss or replacement of the said ecosystem service
Damage Cost Avoided (Avertive/Preventive Expenditure)
Value of the ecosystem service is equal to the amount of damages avoided due to protection of the resource and amount of money people spend to avoid damage of the said resource
Data Needs Type, capacity and
efficiency of pollution control devices
Installation date and annualized capital cost of pollution control device
Cost of operation and maintenance of equipment
Procedure 1st step: Specification of the following: Relevant services provided
by the resource Manner of providing these
resources Beneficiaries of services
provided by the resource Level of services provided
by the resource 2nd step: Calculation of potential physical damage to
Rough indicator of economic value, in consideration of data constraints and degree of similarity or substitutability between related goods
Less data and resource intensive due to easy computation of costs
Limitations on data may rule out valuation methods for estimation of willingness to pay
Provides for surrogate measures of value for service difficult to value by other means
Assumption that expenses incurred for damage restoration or ecosystem replacement may not be accurate
Non-consideration of social preference for ecosystem services or individuals’ behavior in the absence of those services
Benefits of protective action exceeding its costs
Imperfect substitutes of the natural good
Understatement of protective actions since it may only account for a percentage of the total value of services provided by the resource
Need for public demand to be evident
LITERATURE REVIEW ON MARINE TRANSPORTATION AND COASTAL TOURISM 9

General Category Valuation Method Data Needs and Procedure Advantages Issues and Limitations property over a chosen period of time 3rd step: Estimation of either the value of potential property damage or the amount that people spend to avoid such damage
Replacement or Restoration
Value of the resource is equivalent replacement costs of the ecosystem and its services
Commonly used in valuing ecosystem services of coastal protection
Data Needs Type, capacity and
efficiency of pollution control devices
Installation date and annualized capital cost of pollution control device
Cost of operation and maintenance of equipment
Procedure 1st step: Specification of the following: Relevant services provided
by the resource Manner of providing these
resources Beneficiaries of services
provided by the resource Level of services provided
by the resource 2nd step: Identification of the least cost alternative of providing the services and estimation of the annualized capital cost and annual operating and maintenance cost of pollution control per unit of pollutant 3rd step: Extrapolation of the entire industry cost by multiplying unit cost to total
Rough indicator of economic value, in consideration of data constraints and degree of similarity or substitutability between related goods
Less data and resource intensive due to easy computation of costs
Limitations on data may rule out valuation methods for estimation of willingness to pay
Provides for surrogate measures of value for service difficult to value by other means
Assumption that expenses incurred for damage restoration or ecosystem replacement may not be accurate
Non-consideration of social preference for ecosystem services or individuals’ behavior in the absence of those services
Benefits of protective action exceeding its costs
Imperfect substitutes of the natural good
Understatement of protective actions since it may only account for a percentage of the total value of services provided by the resource
Need for public demand to be evident
10 THE PHILIPPINE ENVIRONMENTAL GOVERNANCE 2 PROJECT
General Category Valuation Method Data Needs and Procedure Advantages Issues and Limitations volume of pollutants generated by the industry (industry cost equal to cost of pollution control) 4th step: Adjustment of some cost estimates to account for the assimilative capacity of the environment and number of establishment complying with regulation and standards
Substitute Costs Value of the resource is equal to the costs of substituting the said resource and its services
Data Needs Type, capacity and
efficiency of pollution control devices
Installation date and annualized capital cost of pollution control device
Cost of operation and maintenance of equipment
Procedure 1st step: Specification the following: Relevant services provided
by the resource Manner of providing these
resources Beneficiaries of services
provided by the resource Level of services provided
by the resource 2nd step: Identification of the least cost alternative of providing the services and estimation of the annualized capital cost and annual operating and maintenance cost of pollution control per unit of pollutant
Rough indicator of economic value, in consideration of data constraints and degree of similarity or substitutability between related goods
Less data and resource intensive due to easy computation of costs
Limitations on data may rule out valuation methods for estimation of willingness to pay
Provides for surrogate measures of value for service difficult to value by other means
Assumption that expenses incurred for damage restoration or ecosystem replacement may not be accurate
Non-consideration of social preference for ecosystem services or individuals’ behavior in the absence of those services
Benefits of protective action exceeding its costs
Imperfect substitutes of the natural good
Understatement of protective actions since it may only account for a percentage of the total value of services provided by the resource
Need for public demand to be evident
LITERATURE REVIEW ON MARINE TRANSPORTATION AND COASTAL TOURISM 11

General Category Valuation Method Data Needs and Procedure Advantages Issues and Limitations 3rd step: Extrapolation of the entire industry cost by multiplying unit cost to total volume of pollutants generated by the industry (industry cost equal to cost of pollution control) 4th step: Adjustment of some cost estimates to account for the assimilative capacity of the environment and number of establishment complying with regulation and standards
3) Expressed Willingness to Pay
Uses amount of money people are willing to pay for the resource and its services
Contingent Valuation Method
Used the amount people are willing to pay for particular environmental services or the amount they are willing to receive in giving-up such environmental services under a hypothetical scenario
Data Needs Extent of affected
population or market for the specific environmental services
Changes in environmental services related with an event, program, investment or policy choice involved in the study
Realistic mechanism for payment and manner of collection
Budget constraints of respondents
Availability of comparable services from other sources, when the good is to be provided and whether the losses or gains are temporary or permanent
Validation questions and pre-testing of questionnaire
Procedure 1st step: Definition of the
Flexibility in economic value estimation but most applicable in measuring goods and services easily identified and understood by users and consumed in discrete units
Most widely accepted method for estimating TEV
Easy analysis and description of results
Widely used and studied method
Insufficient reference for people in stating their value compared to choices made in real markets, especially if they are unfamiliar with goods and services being valued
Tendency towards response bias
Unintended associations of respondents among environmental goods
Underestimation of willingness to pay results and overestimation of willingness to accept payments
Tendency towards embedding effect, willingness to pay for one part of an environmental asset and the whole asset
Tendency towards ordering problem as WTP often dependent on the order of things in the list
Bias in responses Tendency towards bias in
responses for a targeted
12 THE PHILIPPINE ENVIRONMENTAL GOVERNANCE 2 PROJECT

ITERATURE REVIEW ON MARINE TRANSPORTATION AND COASTAL TOURISM 13
General Category Valuation Method Data Needs and Procedure Issues and Limitations Advantages problem
2nd step: Preliminary decision on the survey
3rd step: Design survey tools
4th step: Testing of valuation approaches and payment mechanisms
5th step: Conduct actual survey
6th step: Compilation, analysis and reporting of results
particular outcome Tendency towards information
bias Tendency towards non-
response bias Difficulty in externally
validating non-use value estimates
Expensive and time-consuming Skepticism on CV results
Contingent Choice Method Respondents asked to
choose between group of environmental services or characteristics at varying levels of prices and attributes
Useful for policymaking since it considers different options
Procedure 1st step: Definition of the
valuation problem; include services being values and relevant population
2nd step: Finalization of survey design
3rd step: Conduct of actual survey
4th step: Compilation, analysis and reporting of survey results
Applicable to valuing outcomes of an action
Easier to understand since it involves trade-offs rather than monetary values
Ease in response More applicable in
generating relative rather than absolute values
Minimizes biases inherent in open-ended contingent valuation studies
Difficulty of respondents in evaluating unrealistic tradeoffs
Prone to bias when involving complicated choices
Large number of choice sets required with greater number of attributes or levels of attributes
Loss of interest of respondents when given numerous choices
Method revealing attitude preferences instead of behavior intentions
Providing limited number of option require making choices not revealing true preference
Requires more sophisticated statistical techniques in WTP estimation
Translating responses into monetary terms leading to greater uncertainty in actual value placed on the good or service of interest
Untested validity and reliability for valuing non-market
L

THE PHILIPPINE ENVIRONMENTAL GOVERNANCE 2 PROJECT
General Category Valuation Method Data Needs and Procedure Advantages Issues and Limitations commodities
Benefits Transfer Estimation of benefits from
one context and adaptation of these benefit estimates in another context
Procedure 1st step: Review literature
on existing studies related with the valuation being conducted
2nd step: Determination of the transferability of data
3rd step: Evaluation of the quality of studies being transferred
4th step: Adjustment of existing values based on site-specific characteristics
Less expensive Benefits more amenable to
quick valuation Serves as assessment
technique in conducting original valuation
Easy and prompt application for computing gross estimates of recreational values
May not be accurate Lack of availability of good
studies for specific policies or issues
Difficulty in tracking down appropriate unpublished studies
Inadequate information in existing studies
Difficulty in ensuring the accuracy of existing studies
Unfit for extrapolation beyond the range of characteristics of the initial study
Accuracy dependent on the reliability of initial value estimate
Unit value estimates becoming passé
Last resort since many studies have shown large non-monetary value differences
Source: Adopted from UNEP et al. 2004. Economic Valuation of the Impacts of Land-Based Pollution in the South China Sea
14

III. RELATED STUDIES A. MARINE TRANSPORTATION VALUATION STUDIES
1. Douglas-Westwood Limited. 2005. World Marine Markets. Douglas-Westwood Limited, Canterbury.
The study aims to compute for a world market value for each marine sector and its regional segmentation. It classifies the marine sector into shipping, marine tourism, offshore oil and gas, seafood processing, marine equipment, fishing, shipbuilding, naval shipbuilding, ports, marine aquaculture, yacht and boatbuilding, cruise, research and development, marine services, marine renewable energy security and control, ocean survey, education and training, underwater technology and underwater vehicles operations. Shipping Sector. The study defines the shipping sector as the UNCTAD estimate of percentage of total seaborne trade comprising the total cost of shipping. The UNCTAD estimate is, then, segmented by the nationality of ‘beneficial owner’ of world tonnage. These are then compared with actual figures known. Forecasts are in reference to projections of total seaboard world trade in ton-miles. Projections of ClarkSea shipping rates index are computed using own view of over-all shipping rates. Major findings of the study on the shipping sector are the following: There are 90,000 ships registered in 150 nations, 50,000 merchant ships trading
internationally and more than a million seafarers of almost every nationality. European and Southeast Asian shipping companies dominate the sector;
Shipping industry is primarily dependent on the tonnage of seaborne trade (import and export), volume and geographic distribution as a function of a country’s GDP;
Marine transport constitutes 90% of world trade. A 9.1% of growth in world trade is estimated by OECD;
Volume of trade affects availability of vessels and vessel charter rates; Shipping rates in 2004 averaged $28,000, significantly higher than the previous ten-
year average of $13,800; Trade growth in the container sector is projected at 10.5% in 2005 and down to 9.7%
in 2006. On the other hand, supply of container vessel fleet is expected to increase by 9.8% in 2005, 12.6% in 2006 and 8.8% in 2007.
In the European market, 14,000 companies were registered in 2001.A total added value of €14.4bn was computed and 155,000 persons being employed;
UNCTAD estimates operation of merchant ships amounting to US$380bn (€292bn) in freight rates within the global economy. This is equal to 5% of the total world trade; and
Total world shipping revenue is estimates at 243bn. Values of the world shipping sector are estimated at €M 287,748 in 2005 and €M 325,826 in 2010. European
LITERATURE REVIEW ON MARINE TRANSPORTATION AND COASTAL TOURISM 15
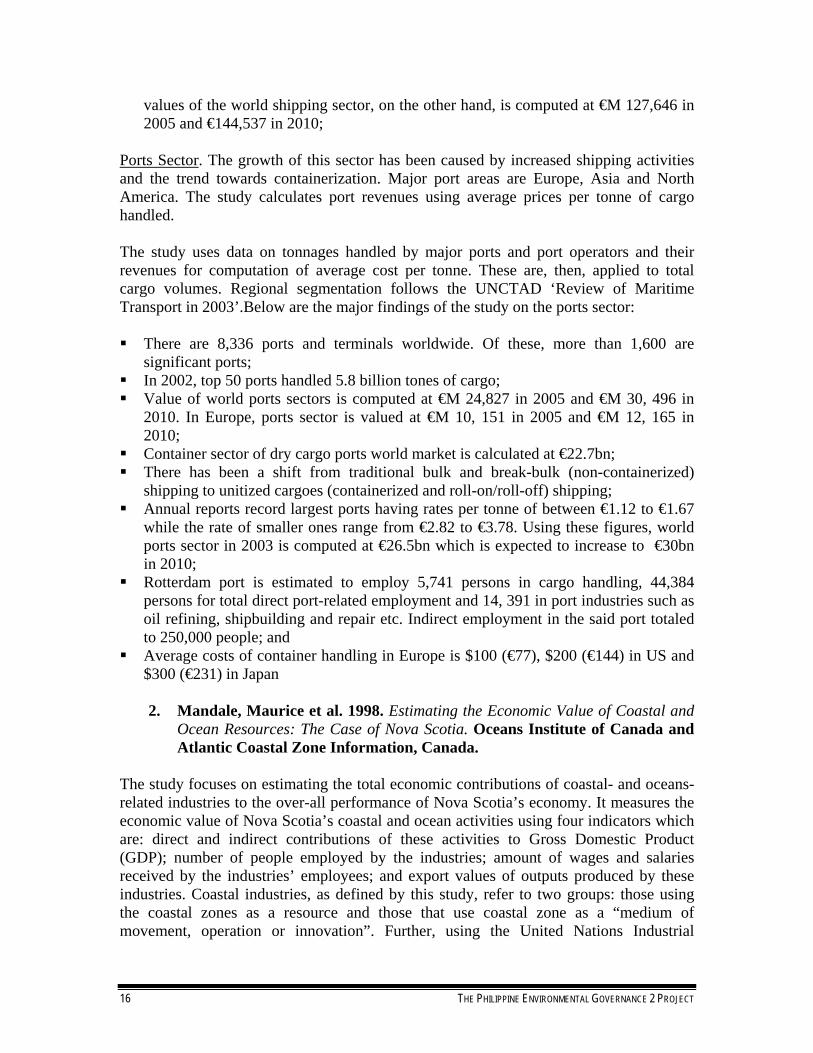
values of the world shipping sector, on the other hand, is computed at €M 127,646 in 2005 and €144,537 in 2010;
Ports Sector. The growth of this sector has been caused by increased shipping activities and the trend towards containerization. Major port areas are Europe, Asia and North America. The study calculates port revenues using average prices per tonne of cargo handled. The study uses data on tonnages handled by major ports and port operators and their revenues for computation of average cost per tonne. These are, then, applied to total cargo volumes. Regional segmentation follows the UNCTAD ‘Review of Maritime Transport in 2003’.Below are the major findings of the study on the ports sector: There are 8,336 ports and terminals worldwide. Of these, more than 1,600 are
significant ports; In 2002, top 50 ports handled 5.8 billion tones of cargo; Value of world ports sectors is computed at €M 24,827 in 2005 and €M 30, 496 in
2010. In Europe, ports sector is valued at €M 10, 151 in 2005 and €M 12, 165 in 2010;
Container sector of dry cargo ports world market is calculated at €22.7bn; There has been a shift from traditional bulk and break-bulk (non-containerized)
shipping to unitized cargoes (containerized and roll-on/roll-off) shipping; Annual reports record largest ports having rates per tonne of between €1.12 to €1.67
while the rate of smaller ones range from €2.82 to €3.78. Using these figures, world ports sector in 2003 is computed at €26.5bn which is expected to increase to €30bn in 2010;
Rotterdam port is estimated to employ 5,741 persons in cargo handling, 44,384 persons for total direct port-related employment and 14, 391 in port industries such as oil refining, shipbuilding and repair etc. Indirect employment in the said port totaled to 250,000 people; and
Average costs of container handling in Europe is $100 (€77), $200 (€144) in US and $300 (€231) in Japan
2. Mandale, Maurice et al. 1998. Estimating the Economic Value of Coastal and
Ocean Resources: The Case of Nova Scotia. Oceans Institute of Canada and Atlantic Coastal Zone Information, Canada.
The study focuses on estimating the total economic contributions of coastal- and oceans-related industries to the over-all performance of Nova Scotia’s economy. It measures the economic value of Nova Scotia’s coastal and ocean activities using four indicators which are: direct and indirect contributions of these activities to Gross Domestic Product (GDP); number of people employed by the industries; amount of wages and salaries received by the industries’ employees; and export values of outputs produced by these industries. Coastal industries, as defined by this study, refer to two groups: those using the coastal zones as a resource and those that use coastal zone as a “medium of movement, operation or innovation”. Further, using the United Nations Industrial
16 THE PHILIPPINE ENVIRONMENTAL GOVERNANCE 2 PROJECT

Development Organization (UNIDO), the study classifies the latter into: 1) marine system design and construction, including ship design, and offshore and coastal engineering; 2) marine operations and shipping, including transportation systems; and 3) marine-related equipment, including manufacturing, engineering and consulting in marine electronics and instrumentation, telecoms, navigation systems, ocean research and exploration, environmental monitoring and, training and education. Industries selected are categorized as private (primary fishing, fish processing, aquaculture, shipbuilding and repair, boatbuilding and repair, oil and gas, tourism and recreation, ports and, ocean technologies and services) or public (Department of National Defense, Department of Fisheries and Oceans, Environment Canada, Nova Scotia Department of Fisheries and Aquaculture, Nova Scotia Department of the Environment and Canada Nova Scotia Offshore Petroleum Board). Data gathered include: value of output or (for public sector agencies) spending; direct employment (full-time equivalent or person-years); direct payroll; and markets for output (split between Nova Scotia, other provinces of Canada and exports to the rest of the world). Net direct and total (direct + indirect + induced) impacts are computed using Nova Scotia Input-Output tables for the private and public ocean-related industries. Indirect effects result from buying of inputs by an industry for operation support. On the other hand, induced impacts are brought about by re-spending of revenues earned throughout the economy. Major findings in the estimation of economic values of coastal-related activities of Nova Scotia are the following: GDP Impacts. Direct GDP impact of the coastal sector amounts to $1.5 billion or
9.6% of the total GDP while total GDP impact (direct + indirect + induced) is calculated at $2.8 billion or 17.5% of the total GDP. In monetary terms, direct impact of coastal activities account for 10 cents of every $1 income generated by total economy. Total impact, on the other hand, account for 17.5 cents for every $1 earned by the total economy ;
Household Income Impacts. Direct household impact total to $1.3 billion or 12.3% of the total household income. Total impact, however, is doubled to $2.6 billion or 24.8% of the total household income;
Employment Impacts. Direct employment impact is a generation of 34,800 jobs or 9.4% of total employment. Total impact is increased to 93,500 jobs or 25% of total employment; and
Export Impacts. Revenues from coastal-related exports amount to $2.7 billion and contribute $2.3 billion to household income.
The table showing these figures is in Excel files. Ports Sector. In Nova Scotia, this is handled both by the private and public sector. Physical plants are mostly operated by governments while actual operations of these ports are managed by private or quasi-private institutions. These are important in Canada’s overseas trade. Below is the table using ports key data in 1994 for Nova Scotia.
LITERATURE REVIEW ON MARINE TRANSPORTATION AND COASTAL TOURISM 17

Table 3. Ports Key Data, 1994 Value of output Direct employment Direct payroll Markets (NS:RoC:RoW)
$300 million 2,520
$87.4 million 20:70:10
Computations of total economic impacts of ports are shown in the Excel files with elimination of double counting achieved through the Input-Output Model used by the study. Other related tables are also in the Excel files.
3. The Allen Consulting Group. 2004. The Economic Contribution of Australia’s Marine Industries
The purpose of the study is to measure economic contribution of marine-based industries to Australia’s economy. The study, in particular, covers six marine-based industries which are marine tourism, offshore oil and gas, fisheries and seafood, shipping, shipbuilding and port-based industries. It uses the concept of “value-added” in estimating the economic value of a specific activity. Value added is defined as the financial net income before deduction of profit and wages. To put it differently, it measures the net impact of an industry by deducting production costs from the total income. It should be noted, though, that this includes payments to labor (wages) and, capital and entrepreneurship (profits). Advantages of using this concept are: 1) it is not prone to double counting; 2) it ensures relevant comparison across industries; and 3) it simplifies analysis of regional impacts. Economic contribution parameters used in this study are assessment of economic activity, employment, taxation revenue and export revenue. The study refers direct economic contributions as the direct value added, employment and export estimates. On the other hand, indirect economic contributions are computed using value added and employment multipliers provided by Australian Bureau of Statistics (ABS). These multipliers are taken from the 1996-1997 Input-Output tables. The indirect value added estimates is the necessary value added from other industries in the economy to enable the marine industries to produce a targeted value added amount. This is the same for indirect employment estimate which is the required added value of manpower from other industries in the economy to produce a specific value added amount. Input-Output Multipliers used in the study for marine-based industries are given in the table below.
18 THE PHILIPPINE ENVIRONMENTAL GOVERNANCE 2 PROJECT

Table 4. Input-Output Multipliers, 1996-1997
Industry Output Employment Marine Tourism Offshore Oil and Gas Fisheries and Seafood Shipping Ship and Boat Building Port-Based Industries
2.50 0.88 2.27 2.92 2.84 1.10
2.37 7.38 2.19 2.78 6.65 2.51
Shipping. This covers water transport categorized into international sea transport, coastal water transport and inland water transport of which value added and employment associated with water inland transportation are disregarded. Adjustments are made to eliminate double counting since water transportation is also a major component of marine tourism. Major findings for the shipping sector in 2003 include: The value added of sector contributes to: 1) 2% of marine industry direct value-added
($0.5 billion); 2) 3.3% of indirect value-added (41.5 billion) and 3) 3% of turn-over ($1.7 billion). A decline of an average annual rate of -3.7% is noted for the said industry between 1995-1996 and 2002-2003, For 1995-1996 and 1996-1997, however, the industry’s growth is reported to be 7.5% ;
The sector employs less than 5% of the total employed manpower in the marine industries, resulting in the industry to be the least employment generator. It contributes 3.3% of direct employment for marine industries (8,390 persons) and 3.4% of indirect employment (23,310 persons) with an average annual growth rate of 4.9%.
In Excel files are tables showing data used in the study. Port-Based Industries. The study characterizes this sector as comprising stevedoring, water transport terminals, port operators and other services to water transport. Since this is an essential industry for shipping activities, this has higher added value and direct employment benefits than the shipping industry. In fact, this is the third largest marine industry during the study period 2002-2003. Major findings for the port-based industries are as follows: Marine tourism contributes: 6.4% value added ($1.7 billion); 4.1% indirect value
added ($1.9 billion); and 4.0% turn-over ($2.8 billion) with an average annual growth rate of 6%; and
With an average annual growth rate of 2%, port-based industries are recorded to contribute 4.6% of marine industry direct employment (11,540 persons) and 4.2% of marine industry indirect employment (28,930 persons).
LITERATURE REVIEW ON MARINE TRANSPORTATION AND COASTAL TOURISM 19

In Excel files are tables showing port-based data for 1995-1996 to 2002-2003.
4. Mandale, Maurice.2000. The Economic Value of Marine-Related Resources in New Brunswick. New Brunswick of Fisheries and Aquaculture and Department of Fisheries and Oceans, New Brunswick.
This study is similar with the assessment conducted in measuring economic importance of the marine sector in Nova Scotia which aims to provide support to policy formulation on economic development and marine management. Specifically, this is an estimation of the economic contributions of the marine sector to the over-all economy of New Brunswick in term of its total direct and indirect contribution to Gross Domestic Product (GDP), total number of people employed by the industry and total amount of salaries and wages people earned from the said industry. The study divided the marine sector into two industries: private industries composed of traditional fishing, aquaculture, fish processing, shipbuilding and boatbuilding, marine technology manufacturing, ferry services, marine-related ecotourism, marine construction, ports and, research and other services; and government departments including New Brunswick Department of Fisheries and Aquaculture, New Brunswick Department of the Environment, Department of Fisheries and Oceans and Environment Canada. Total Net Economic Impact of the marine industry is computed using average of three years _ 1995, 1996 and 1997. This study uses an Input-Output model in estimating economic values for different marine industries in New Brunswick. Data collected for the study are economic outputs (sales), employment and payroll (household income). The study has led to the following major findings: The marine sector directly contributes 4.3% ($610 million) to the total GDP of New
Brunswick. Total impact (direct + indirect + induced) of the sector scales its contribution up to 7.2% (more than $1 billion) of the total GDP;
4.1% (almost $370 million) of the direct household income and 9.2% of total household income are attributed to the marine sector; and
Direct employment impact of the marine sector comprises 4.8% of all jobs (almost 15,000) while total (direct + indirect + induced) employment impact of the sector comprises 8.5% (more than 26,550 jobs) of all jobs generated in New Brunswick.
The table showing the abovementioned figures is in the Excel files. Ferry Services. For ferry transportation, this marine industry records an average output of $33.5 million, 424 employed people and aggregate income of $9.8 million. See Excel files for table with these data. Ports. Ports in New Brunswick are reported to have received an average of 23.4 million tones, generated almost 2,700 jobs and given aggregate income of $77.3 million to its employees for the period covered 1995 to 1997. See Excel files for table with these data. Related tables are in the Excel files.
20 THE PHILIPPINE ENVIRONMENTAL GOVERNANCE 2 PROJECT

5. Canmac Economics, School for Resource and Environmental Studies,
Enterprise Management Consultants and the Secretariat of the Atlantic Coastal Zone Information Steering Committee. 2002. The Value of the Ocean Sector to the Economy of Prince Edward Island, prepared for the Government of Prince Edward Island and the Government of Canada, 114p.
The study primarily targets to measure the impact of the marine sector to the economy of Prince Edward Island by estimating its direct and indirect contribution to Gross Domestic product (GDP), number of people employed by the sector and amount of wages and salaries earned by workforce within the said sector using Input-Output Analysis. Data on economic output (sales), employment and payroll (household income) are based on average of the period covering 1997, 1998 and 1999. Similar with the studies discussed earlier, the sector is classified into those depending on the ocean as a resource and those that consider it as a medium of operation or movement. Ocean is used as encompassing estuarine, inshore, nearshore and offshore waters. Further, the study categorized the sector into private (traditional fishing, aquaculture, fish processing, shipbuilding and boatbuilding, marine technology manufacturing, marine transportation, marine construction services, ports and harbors, ocean related research and other services and, ocean-related tourism) and government (PEI Department of Fisheries, Aquaculture and Environment, Tourism PEI, Department of Fisheries and Oceans, Environment Canada and Parks Canada). Conclusions of the study include the following: The marine sector directly contributes 10% ($247 million) to the total GDP of Prince
Edward. This increases to 17.1% (more than $421 million) as the total GDP impact; 11.1% (almost $169 million) of direct household income is attributable to the sector.
Its total household income impact, however, is increased to 19.8% ($302.4 million) when all effects (direct + indirect + induced) are considered; and
The sector has 11.2% (6,701 full-time equivalent (FTE)) total direct employment impact and 19.5% (11,722 FTE) total employment impact.
Summary of total economic impacts of the marine industry is in the Excel files. Marine Transportation. This specific marine industry contributes $65 million output with 130 employees hired on a full-time equivalent basis which receive $5 million aggregate income. See Excel files for the table. Ports. The ports receive 835,705 tonnes cargo with approximately 200 people employed who earn aggregate income of more than $6 million. See Excel files for the table. Tourism. In particular, this sector receives average annual expenditures of more than $96 million with 1,600 people employed on a full-time equivalent basis whose aggregate annual income amount to $40.3 million. See Excel files for the table.
LITERATURE REVIEW ON MARINE TRANSPORTATION AND COASTAL TOURISM 21

Related tables are in Excel files.
6. Kildow, Judith and Colgan, Charles. 2005. California’s Ocean Economy, Report to the Resources Agency, State of California. National Economics Program, California.
This study measures the contribution of the economy coastal and ocean economy to California’s total economy across time and regions including the nations, state and counties. Economic contributions are calculated in terms of output (Gross Domestic Product or its related measures), employment and wages. It distinguishes the coastal economy from the ocean economy by defining the former as “all economic activities in the coastal region, and is thus the sum of employment, wages and output in the region”. The latter, on the other hand, is referred as “all economic activity deriving all or part of its inputs from the ocean or Great Lakes. The method used in this study is based on the ES-202 employment data collected monthly by each state’s Department of Labor and reported to the US Department of Labor. These data are at the establishment level which are ocean-related based on Standard Industrial Classification (SIC) codes and for specific industries, by the location of a given establishment in a zip code adjacent to the shore. The study covers six ocean sectors defined with their major activities: construction, including marine construction; living resources, including fish harvesting, aquaculture and seafood processing; minerals, including limestone, sand and gravel, oil and gas exploration, and, oil and gas production; ship and boat building, including boat building and ship building; tourism and recreation, including amusement and recreation services not classified elsewhere, zoos and aquaria, boat dealers, eating and drinking places , hotels and motels, marinas, recreation vehicle parks and campgrounds and sporting goods; and transportation, including deep sea freight transportation, marine passenger transportation, marine transportation services, search and navigation equipment and warehousing Marine Transportation. California, considered as the single gateway services to the U.S., has high significance to the economy of U.S. In 2000, value of traded in Los Angesles, Long Beach and Oakland Customs Districts is recoreded at $392 billion. Waterborne commerce, specifically, accounts for 40% of the total national trade in the same year. Related tables are in the Excel files.
22 THE PHILIPPINE ENVIRONMENTAL GOVERNANCE 2 PROJECT
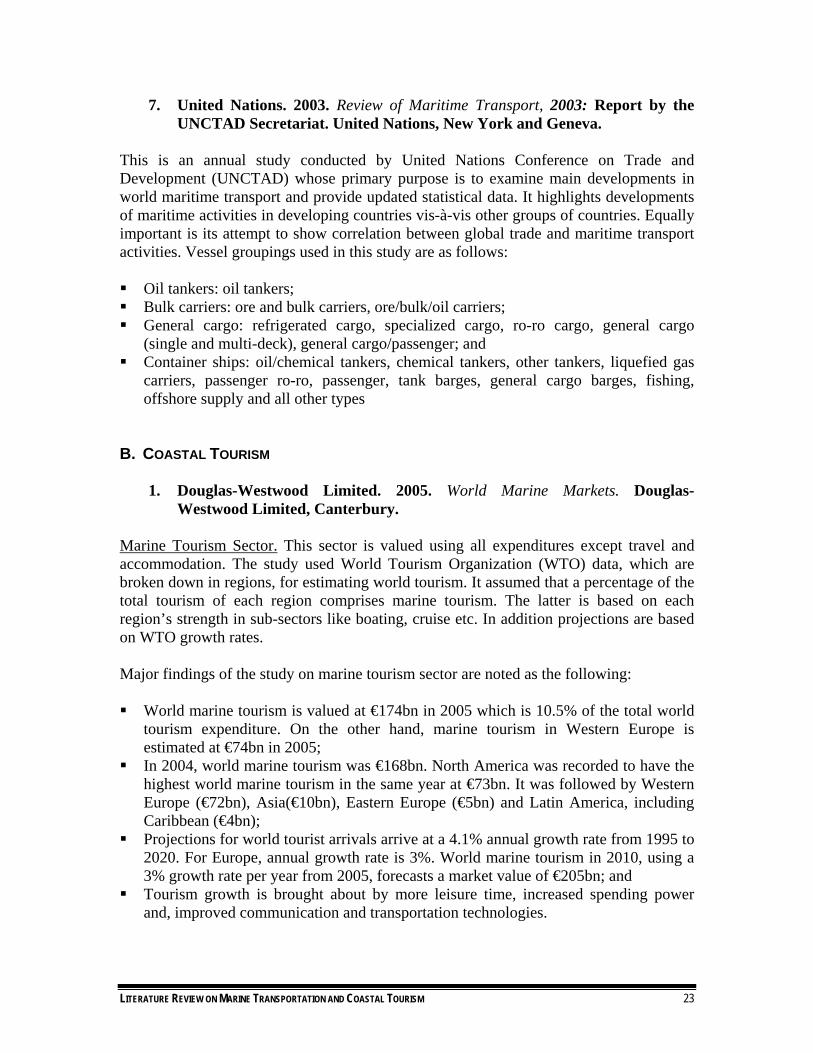
7. United Nations. 2003. Review of Maritime Transport, 2003: Report by the UNCTAD Secretariat. United Nations, New York and Geneva.
This is an annual study conducted by United Nations Conference on Trade and Development (UNCTAD) whose primary purpose is to examine main developments in world maritime transport and provide updated statistical data. It highlights developments of maritime activities in developing countries vis-à-vis other groups of countries. Equally important is its attempt to show correlation between global trade and maritime transport activities. Vessel groupings used in this study are as follows: Oil tankers: oil tankers; Bulk carriers: ore and bulk carriers, ore/bulk/oil carriers; General cargo: refrigerated cargo, specialized cargo, ro-ro cargo, general cargo
(single and multi-deck), general cargo/passenger; and Container ships: oil/chemical tankers, chemical tankers, other tankers, liquefied gas
carriers, passenger ro-ro, passenger, tank barges, general cargo barges, fishing, offshore supply and all other types
B. COASTAL TOURISM
1. Douglas-Westwood Limited. 2005. World Marine Markets. Douglas-Westwood Limited, Canterbury.
Marine Tourism Sector. This sector is valued using all expenditures except travel and accommodation. The study used World Tourism Organization (WTO) data, which are broken down in regions, for estimating world tourism. It assumed that a percentage of the total tourism of each region comprises marine tourism. The latter is based on each region’s strength in sub-sectors like boating, cruise etc. In addition projections are based on WTO growth rates. Major findings of the study on marine tourism sector are noted as the following: World marine tourism is valued at €174bn in 2005 which is 10.5% of the total world
tourism expenditure. On the other hand, marine tourism in Western Europe is estimated at €74bn in 2005;
In 2004, world marine tourism was €168bn. North America was recorded to have the highest world marine tourism in the same year at €73bn. It was followed by Western Europe (€72bn), Asia(€10bn), Eastern Europe (€5bn) and Latin America, including Caribbean (€4bn);
Projections for world tourist arrivals arrive at a 4.1% annual growth rate from 1995 to 2020. For Europe, annual growth rate is 3%. World marine tourism in 2010, using a 3% growth rate per year from 2005, forecasts a market value of €205bn; and
Tourism growth is brought about by more leisure time, increased spending power and, improved communication and transportation technologies.
LITERATURE REVIEW ON MARINE TRANSPORTATION AND COASTAL TOURISM 23

Cruise Industry. The study limits valuation of the industry to revenues of cruise vessel operators. Being a sub-area of marine tourism, cruise industry shows high growth potential. Major findings on the said industry are the following: North America ranks first in revenue-generation in the industry. This is followed by
Western Europe and South East Asia, though in general, data are not available; World market is €12bn. Total economic value is twice this figure; The US cruise industry was approximated to value at $7bn in 1997 annually and
$12.9bn but the total economic benefit was computed at $25.4bn with 294,000 jobs generated. An average of $240,000 is generated by a 2,000 passenger ship with 950 crew members in on-shore sending per US port call. Average port-of-call passenger spending is $112 per visit; and
2. Mandale, Maurice et al. 1998. Estimating the Economic Value of Coastal and
Ocean Resources: The Case of Nova Scotia. Oceans Institute of Canada and Atlantic Coastal Zone Information, Canada.
Tourism Sector. The study assumes that 35% of the total tourism in Nova Scotia comprises marine-related ones. This figure is taken from 1992 Exit Survey which suggests that 35% of the total tourism in Nova Scotia is nature-related activities. Due to unavailability of other figures, this data is used as the basis for the computations. Table 5 shows spending on nature and non-nature related tourism activities. Table 5. Different Types of Tourist Spending in Nova Scotia
Types of Spending Nature Tourist
Parties ($) Non-Nature Tourist
Parties ($) Accommodation Restaurants Entertainment Taxi and car rental Shopping Gas and auto repair Groceries and liquor Total (inc. others)
238.59 221.15 60.39 56.25
144.02 102.16 66.77
825.20
128.27 122.81 27.46 27.32 77.48 48.88 28.03
468.53 Below is a table presenting key tourism data for 1994. Table 6. Tourism Key Data, 1994
Value of output (tourism receipts) Direct employment (FTEs) Direct payroll Markets (NS:RoC:RoW)
$308 million 3,369
$86 million 46:37:17
Note: Market proportions are 1996 values due to unavailability of 1994 values; NS-Nova Scotia; RoC-Rest of the Country; RoW-Rest of the World
24 THE PHILIPPINE ENVIRONMENTAL GOVERNANCE 2 PROJECT
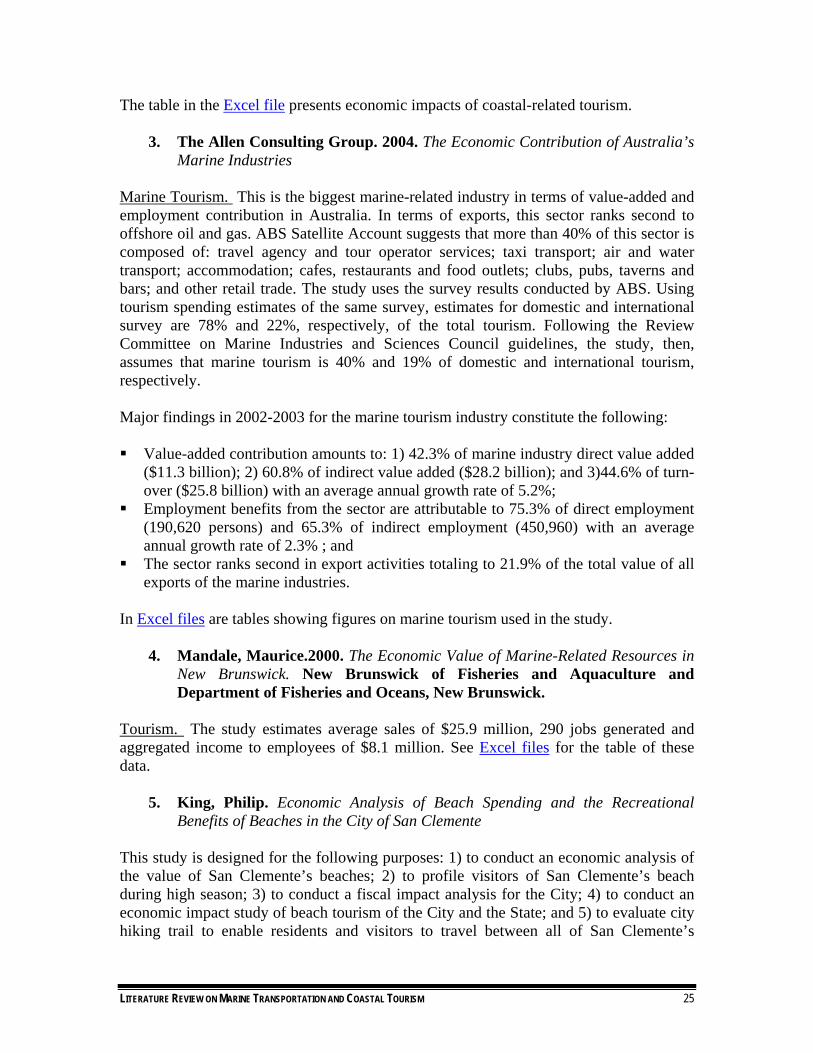
The table in the Excel file presents economic impacts of coastal-related tourism.
3. The Allen Consulting Group. 2004. The Economic Contribution of Australia’s Marine Industries
Marine Tourism. This is the biggest marine-related industry in terms of value-added and employment contribution in Australia. In terms of exports, this sector ranks second to offshore oil and gas. ABS Satellite Account suggests that more than 40% of this sector is composed of: travel agency and tour operator services; taxi transport; air and water transport; accommodation; cafes, restaurants and food outlets; clubs, pubs, taverns and bars; and other retail trade. The study uses the survey results conducted by ABS. Using tourism spending estimates of the same survey, estimates for domestic and international survey are 78% and 22%, respectively, of the total tourism. Following the Review Committee on Marine Industries and Sciences Council guidelines, the study, then, assumes that marine tourism is 40% and 19% of domestic and international tourism, respectively. Major findings in 2002-2003 for the marine tourism industry constitute the following: Value-added contribution amounts to: 1) 42.3% of marine industry direct value added
($11.3 billion); 2) 60.8% of indirect value added ($28.2 billion); and 3)44.6% of turn-over ($25.8 billion) with an average annual growth rate of 5.2%;
Employment benefits from the sector are attributable to 75.3% of direct employment (190,620 persons) and 65.3% of indirect employment (450,960) with an average annual growth rate of 2.3% ; and
The sector ranks second in export activities totaling to 21.9% of the total value of all exports of the marine industries.
In Excel files are tables showing figures on marine tourism used in the study.
4. Mandale, Maurice.2000. The Economic Value of Marine-Related Resources in New Brunswick. New Brunswick of Fisheries and Aquaculture and Department of Fisheries and Oceans, New Brunswick.
Tourism. The study estimates average sales of $25.9 million, 290 jobs generated and aggregated income to employees of $8.1 million. See Excel files for the table of these data.
5. King, Philip. Economic Analysis of Beach Spending and the Recreational Benefits of Beaches in the City of San Clemente
This study is designed for the following purposes: 1) to conduct an economic analysis of the value of San Clemente’s beaches; 2) to profile visitors of San Clemente’s beach during high season; 3) to conduct a fiscal impact analysis for the City; 4) to conduct an economic impact study of beach tourism of the City and the State; and 5) to evaluate city hiking trail to enable residents and visitors to travel between all of San Clemente’s
LITERATURE REVIEW ON MARINE TRANSPORTATION AND COASTAL TOURISM 25

beaches without traveling on or near the railroad tracks. It makes use of the travel cost method in valuating economic values of beaches in he said City. Major findings of the study are listed below as: $77.16 is the amount spent by a typical visitor per person per day on each beach trip.
71% of this amount (or $54.70) is spent in San Clemente. Visitors who spend overnight spend more than day-trippers;
The City earns $1.65 million from beach-related spending which include parking fees, permits and fines, transient occupancy taxes, concessions and the City’s hare of sales taxes from beach spending. On the other hand, the City’s expenditures are estimated to be $1.55 million for beach services and maintenance, police and public safety. Net revenues total to $92,776 from beaches or 5 cents per visitor per day;
Tax revenue from overnight visitors is $5.73 per visitor while day trippers, tax revenue is $1.16;
Beach activity contributes $116 per person per day in economic activity or $132 million per year for the State of California;
San Clemente’s beaches earn $4.16 per beach visitor in direct State taxes and $10.32 in direct Federal taxes
Value of one beach day is estimated to be $30.58 per person per day during high season. In total, the economic value of San Clemente’s beaches is more than $37 million per year; and
A significant amount of revenues from the beaches of the City does not accrue to the City itself but flows to the State and Federal income account
Related tables are in the Excel files.
6. Kildow, Judith and Colgan, Charles. 2005. California’s Ocean Economy, Report to the Resources Agency, State of California. National Economics Program, California.
Coastal Tourism and Recreation. The study defines coastal tourism and recreation as encompassing hotel and restaurant industry, marinas, coastal water sports industry, recreational boating harbors, recreational fishing facilities and stores, beaches and retail businesses. The coastal tourism and recreation sector also constitutes ecotourism and recreational activities such as recreational boating, swimming, recreational fishing, surfing, kayaking, diving and snorkeling. The study, in particular, computes market and non-market values of the said sector. Coastal Recreation. Estimation of coastal recreation in California is calculated using data on number of people and activity levels in ocean recreation gathered in a national survey conducted in 2004 with the state data on use of key coastal resources. Recreational activities specifically covered in this study are beach activities, recreational fishing, recreational boating and other marine recreation. Table showing measure of participation in marine recreational activities is in the Excel files.
26 THE PHILIPPINE ENVIRONMENTAL GOVERNANCE 2 PROJECT

Beach Activities. Valuation of beach activities is measured using market expenditures and non-market consumer surplus values. Fiscal impact of beaches in California is recorded to be $14 billion as direct revenues in 1998. A study in California beaches estimates that a person spends $23.19 for beach related items and expenditures in a trip in 2000. Still, another study (by King) approximates that excluding gas and automobiles costs, average beach related expenditure amount to $29.66. Non-market valuation, on the other hand, is conducted using travel cost and contingent valuation methods. Using an estimate of $15 value of a beach day with annual beach attendance of 150 million, California’s non-market value is accounted as totaling to $2.25 billion. Related tables on consumer surplus value of beach visits are in the Excel files. Values for other recreational activities are in the Excel files. Travel and Tourism. This sector is the third largest employer in California. In 2001, the sector receives 287 million domestic travelers and approximately 9 million international travelers. It accounts, specifically, for an 11.1% share of domestic travel market. Expenditures for the sector in the same period amount to $75.4 billion or 6% of the California’s total GSP. Over-all, the sector generates $4.8 billion in tax revenues for the same period. Related tables are in the Excel files.
7. Samonte-Tan, G. PB., E. Tabara and C. Caballes. 2004. Coastal and Marine Biodiversity Resource Economic Valuation: Bohol Marine Triangle. The Coastal Conservation and Education Foundation, Inc. and Bohol Marine Triangle Project, Cebu City, 109 p.
The study covers tourism activities in the Bohol Marine Triangle (BMT) which include SCUBA diving, whale and dolphin watching, swimming, snorkeling, beach combing, boating and sun bathing. These activities are significant sources of income of the communities in Baclayon, Dauis and Panglao with respect to tourist spending, sales, income, tax revenues and employment. Tables 7 and 8 show dive shop rates and gross revenue, and number of tourists visiting the areas, respectively. Table 7. Dive Shop Rates and Gross Revenues
Municipality Rate per Diver Divers per Dive
Shop/Year Gross Revenue per Dive Shop ($/Year)
Dauis $50 - $56a 390 – 420 $21,000 - $21,800 Panglao $23 - $55a 420 – 1,980 $10,500 - $45,540
Source: Samonte-Tan et al, 2004 aRate is good for 2 dives bIncludes divers going to Pamilacan Island
LITERATURE REVIEW ON MARINE TRANSPORTATION AND COASTAL TOURISM 27

Table 8. Number of Tourists Monthly Tourists
Municipality Peak Monthsb Lean MonthscBMT Tourists
Year 2003 Baclayona 495 128 3,738 Dauis 1,875 906 16,686 Panglao 3,136 1,454 27,540 Total 5,506 2,488 47,964
Source: Samonte-Tan et al, 2004 Sources of tourism revenues in the BMT are indirect or private sector revenues from tourism-related businesses such as hotels, dive-operations, whales/dolphin tours and restaurants. Average annual tourism net revenues range from P198,750 (boat operators) to P1.4 million (hotel operators). Tourism revenues are highest in Panglao due to extensive coral reefs within the municipality. No diver’s fee is collected from divers visiting the BMT, thus, potential; revenues from diving are measured in biodiversity of coral reefs and based on diver’s willingness to pay and number of divers. These are shown in Tables 9 and 10. Table 9. Annual Net Revenues from Tourism Businesses
Average Annual Net Revenue Per Tourism Entrepreneur (PhP)
Ecosystem Baclayona Dauis Panglao BMT Coral Reef Dive Shop
942,480
1,142,753
1,042,617
Marine Waters Boat Operators
198,750
198,750
Beach Hotel Restaurants
1,620,000 1,500,000
1,326,000 1,200,000
1,473,000 1,350,000
Source: Samonte-Tan et al, 2004 aBased on monthly net revenues of surveyed respondents bPamilacan Island
Table 10. Annual Net Benefits from Tourism Average Annual Net Revenue Per Tourism Enterpreneur
(PhP) Ecosystem Baclayona Dauis Panglao BMT
Coral Reef Dive Shop
1,884,960
22,855,067
24,740,027
Marine Waters Boat Operators
795,000
795,000
Beach Hotel Restaurants
8,100,000 3,000,000
37,128,000 6,000,000
45,228,000 9,000,000
Total 795,000 12,984,960 65,983,067 79,763,027 Source: Samonte-Tan et al, 2004
28 THE PHILIPPINE ENVIRONMENTAL GOVERNANCE 2 PROJECT
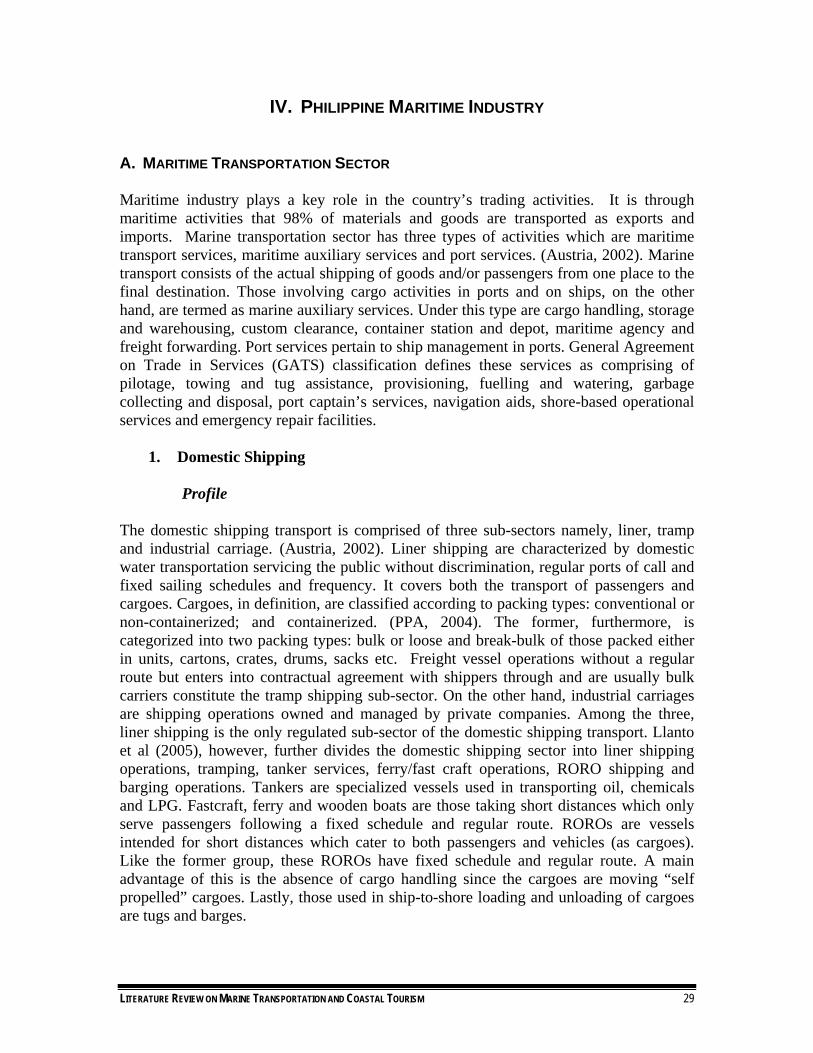
IV. PHILIPPINE MARITIME INDUSTRY A. MARITIME TRANSPORTATION SECTOR Maritime industry plays a key role in the country’s trading activities. It is through maritime activities that 98% of materials and goods are transported as exports and imports. Marine transportation sector has three types of activities which are maritime transport services, maritime auxiliary services and port services. (Austria, 2002). Marine transport consists of the actual shipping of goods and/or passengers from one place to the final destination. Those involving cargo activities in ports and on ships, on the other hand, are termed as marine auxiliary services. Under this type are cargo handling, storage and warehousing, custom clearance, container station and depot, maritime agency and freight forwarding. Port services pertain to ship management in ports. General Agreement on Trade in Services (GATS) classification defines these services as comprising of pilotage, towing and tug assistance, provisioning, fuelling and watering, garbage collecting and disposal, port captain’s services, navigation aids, shore-based operational services and emergency repair facilities.
1. Domestic Shipping
Profile The domestic shipping transport is comprised of three sub-sectors namely, liner, tramp and industrial carriage. (Austria, 2002). Liner shipping are characterized by domestic water transportation servicing the public without discrimination, regular ports of call and fixed sailing schedules and frequency. It covers both the transport of passengers and cargoes. Cargoes, in definition, are classified according to packing types: conventional or non-containerized; and containerized. (PPA, 2004). The former, furthermore, is categorized into two packing types: bulk or loose and break-bulk of those packed either in units, cartons, crates, drums, sacks etc. Freight vessel operations without a regular route but enters into contractual agreement with shippers through and are usually bulk carriers constitute the tramp shipping sub-sector. On the other hand, industrial carriages are shipping operations owned and managed by private companies. Among the three, liner shipping is the only regulated sub-sector of the domestic shipping transport. Llanto et al (2005), however, further divides the domestic shipping sector into liner shipping operations, tramping, tanker services, ferry/fast craft operations, RORO shipping and barging operations. Tankers are specialized vessels used in transporting oil, chemicals and LPG. Fastcraft, ferry and wooden boats are those taking short distances which only serve passengers following a fixed schedule and regular route. ROROs are vessels intended for short distances which cater to both passengers and vehicles (as cargoes). Like the former group, these ROROs have fixed schedule and regular route. A main advantage of this is the absence of cargo handling since the cargoes are moving “self propelled” cargoes. Lastly, those used in ship-to-shore loading and unloading of cargoes are tugs and barges.
LITERATURE REVIEW ON MARINE TRANSPORTATION AND COASTAL TOURISM 29

Liner shipping routes, in particular, are categorized into primary, secondary, tertiary and developmental routes. (Austrial, 2002). Classification criteria used are ports being served, population and economic development in the area and cargo/passenger throughput attendant to the linkages fostered. Primary routes are those in charge of the domestic volume which are nationally significant in nature. They usually include major ports of the country. Those responsible for domestic volume with regional significance and linked to ports with lesser throughputs than major ports are under the secondary routes while tertiary routes include feeder routes carrying consolidated cargoes. The latter are transported to primary and secondary routes. Developmental route, on the other hand, encompasses shipping routes without existing shipping operators but are potentially operational, especially in agriculture, tourism or mining. Types of services offered by domestic fleets are classified into passenger ferry, passenger-cargo, general cargo, container, liquid cargo/lighterage, barging, tanker, towing/salvage, pleasure and pilotage. (MARINA, 2003). Inventory of the fleets highlights the general cargo ranking highest among the other groups. This is can be attributed to the high scale of domestic trade using break-bulk mode of transportation. Shares of container vessels and tankers, on the other hand, have been observed to be increasing. Passenger cargo vessels, also, have taken a relatively high percentage of the market. Domestic shipping enterprises have also increased as more companies are seeking for accreditation. Moreover, vessel acquisitions have also gone up as more vessels have been approved by MARINA. (See Excel files for figures). In the national economy, the marine transportation sector plays a significant role in its contribution to the country’s Gross Domestic Product (GDP). In fact, the sector accounts for half of the GDP throughout the 1990s. The increasing passenger traffic and volume of domestic cargo have resulted in the sustained growth of the sector. Trade activities requiring transport of commodities for exports and imports have made the sector more valuable as transit cargos have continued to increase. (See Excel files).
Institutional and Regulatory Framework The table below presents all stakeholders that make-up the shipping industry. Table 11. Shipping Industry Stakeholders
Institutions/Stakeholders Description/Function Maritime Industry Authority Oversees the development, regulation and promotion of
the shipping industry Flag state administrator of International Maritime
Organization (IMO) in the Philippines Certifies Filipino seafarers
Philippine Coast Guard (with PPA and MARINA)
Implements safety shipping-related marine pollution rules and standards
Maintains and operates aids to navigation Enforces maritime laws and regulations
Department of Environment and Natural Resources
Regulates all kinds of environmental pollution, including marine (oil spillage, garbage dunping etc.)
30 THE PHILIPPINE ENVIRONMENTAL GOVERNANCE 2 PROJECT

Institutions/Stakeholders Description/Function Commission on Higher Education (CHED), Maritime Training Council (MTC), TESDA and other private and public maritime schools
Regulates schools offering maritime education and training of various types of seamen
National Telecommunications Commission (NTC)
Regulates all form of telecommunication, including grant of radio frequencies for vessels whether ship-to-ship, ship to shore or ship to INMARSTAT and GMDSS
Professional RegulatoryCommission Licensure (marine engineering/marine transport) Ship Classification Applies ship inspection rules for vessels 500GRT and
above in accordance with International Association of Classification Societies (IACS)
Shipping Companies Domestic and foreign shipping companies calling at Philippine ports
Main organization: PISA Member Organizations of PISA: Liners – DSA; Trampers
– UTAP; Ferry Operators – VAFCSO; tankers – Philippine Tanker Operators; Ocean-going - FSA
Pilotage Service Companies Offers pilot services at major ports Association: United Harbor Pilot Association of the
Philippines Shippers Private cargo owners
Port users (exporter/importers, domestic manufacturers, traders)
Organizations: DMAP, PHILEXPORT, Federation of Mindanao Shippers, PCCI, FPI
Seafarers Ship officers and crew Organization: Association of Maritime Officers and
Seafarers Union of the Philippines (AMOSUP) Forwarding companies Provides cargo consolidation and freight forwarding
services Trucking companies Inland trucking service providers
Organization: CTAP Forwarding companies, customs brokers and 4th Party Logistic providers
Provides services to shippers including tracking, documentation and customs clearance
Consumers/passengers General public Source: Llanto et al, 2005
Fees and Charges Fees and charges levied by MARINA are in the Excel file2
Policies List of major policies in the sector is provided in Table 12.
LITERATURE REVIEW ON MARINE TRANSPORTATION AND COASTAL TOURISM 31

Table 12. Domestic Shipping Sector Policies
Policy Issuance Major Provisions RA 9295 or An Act Promoting the Development of Philippine Domestic Shipping, Shipbuilding, and Ship Repair and Ship Breaking, Ordaining Reforms in Government Policies Towards Shipping in the Philippines, and for other purposes
Deregulation of the shipping industry Improvement and upgrading of existing domestic merchant
fleet and Filipino crew Provision of investment incentives through: VAT exemption
on importation of vessels, spare parts, materials for the construction and repair of ships, life-saving, safety, fire-fighting, cargo handling, communication, navigation equipment etc.; restrictions on vessel importation to promote local ship building; net loss carry over; and accelerated depreciation
MARINA as the authority to impose,, fix, collect and receive charges/fees collected
Establishment of MARINA Trust Fund comprising of all fees collected from licensing, supervision, regulation, inspection, approval and accreditation of domestic ship operators and other related fees
MARINA MC No. 71
No monopolized routes adopted as a policy Entry of new additional operators in established routes/links allowed,
if: cost-effective, competitive or superior service provided; and improved quality of service and/or innovative/technologically advanced shipping service introduced
No limit on vessel replacement capacities Flexibility for cargo liner operation for altering frequencies, ports of
call and swap/substitute vessels MARINA MC No. 80, Executive Order No. 185 and MARINA MC No. 106
Minimum of 2 operators in any route Entry made easier in routes serviced for 5 years Newly-acquired vessels granted flexibility of entry into any route,
subject to certain conditions Entry into developmental routes encouraged by way of rates
incentives Liberalized vessel routing, amendment of frequencies/schedule,
vessel swapping/substitution MARINA MC No. 161
Enhancement of some provisions of MC No. 106 in relation to ruinous competition, protection on investments, financial capability evaluation and market survey
MARINA MC No. 46 Abolition of ad valorem rates/adoption of 3/10% valuation surcharge to cover insurance premiums
Reclassification/upgrading of Basic Commodities Class (agricultural products) to Class C Basic
Deregulation of 2nd Class Passage Rates MARINA MC No. 57
Deregulation of Reefer, Transit & Livestock rates Abolition of 3/10% valuation surcharge Adoption of Fork Tariff System, initially set at +5%/-5%
MARINA MC No. 67
Institution of Automatic Fuel Adjustment Mechanism Widening of Fork Tariff range to 10%/-15%
EO No. 213 and MARINA MC No. 117
Deregulation of all commodities Class A, B and C except for non-containerized Basic commodities
Exempting DOT-accredited vessels from allocating 50% of their passenger capacities to 3rd class accommodations; deregulation of passage rates for DOT-accredited vessels serving tourist destinations
MARINA MC No. 153
Further deliberalization through removal of DOSCCCONS in the process of rate determination
Domestic shipping Service Monitoring System (DOSSMONS)
This is a M & E database system of all contents and information recorded in operators Annual Reports.
32 THE PHILIPPINE ENVIRONMENTAL GOVERNANCE 2 PROJECT
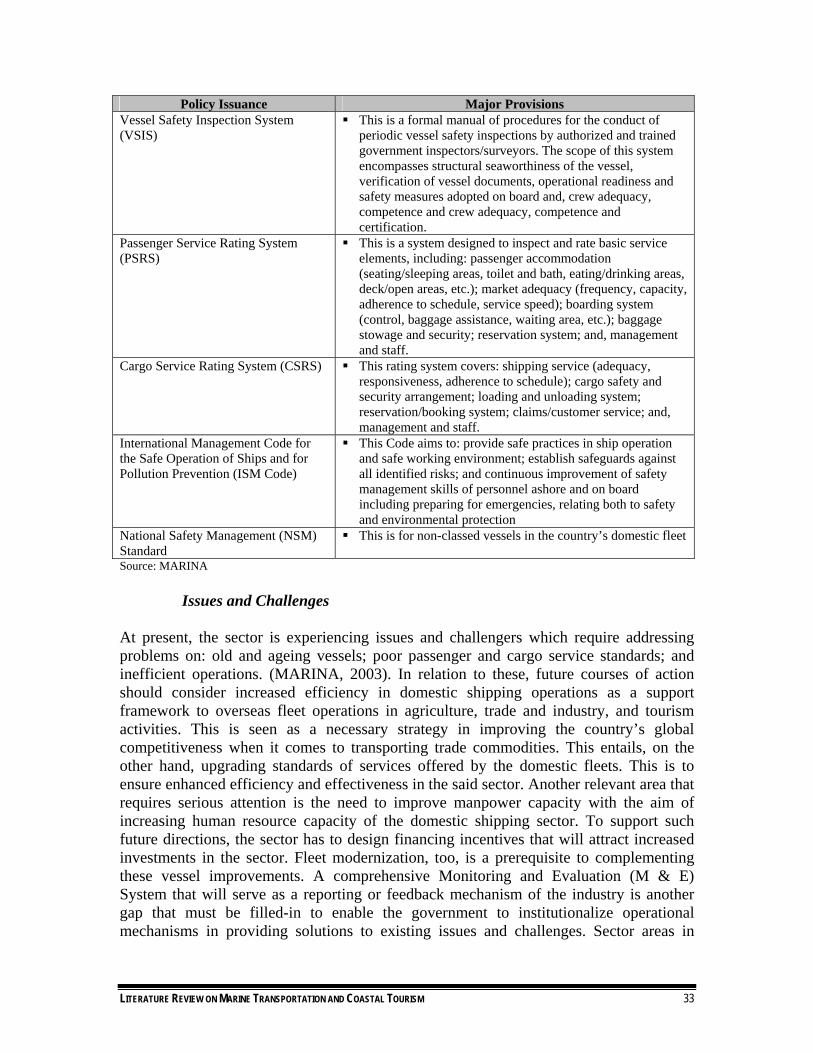
Policy Issuance Major Provisions Vessel Safety Inspection System (VSIS)
This is a formal manual of procedures for the conduct of periodic vessel safety inspections by authorized and trained government inspectors/surveyors. The scope of this system encompasses structural seaworthiness of the vessel, verification of vessel documents, operational readiness and safety measures adopted on board and, crew adequacy, competence and crew adequacy, competence and certification.
Passenger Service Rating System (PSRS)
This is a system designed to inspect and rate basic service elements, including: passenger accommodation (seating/sleeping areas, toilet and bath, eating/drinking areas, deck/open areas, etc.); market adequacy (frequency, capacity, adherence to schedule, service speed); boarding system (control, baggage assistance, waiting area, etc.); baggage stowage and security; reservation system; and, management and staff.
Cargo Service Rating System (CSRS)
This rating system covers: shipping service (adequacy, responsiveness, adherence to schedule); cargo safety and security arrangement; loading and unloading system; reservation/booking system; claims/customer service; and, management and staff.
International Management Code for the Safe Operation of Ships and for Pollution Prevention (ISM Code)
This Code aims to: provide safe practices in ship operation and safe working environment; establish safeguards against all identified risks; and continuous improvement of safety management skills of personnel ashore and on board including preparing for emergencies, relating both to safety and environmental protection
National Safety Management (NSM) Standard
This is for non-classed vessels in the country’s domestic fleet
Source: MARINA
Issues and Challenges At present, the sector is experiencing issues and challengers which require addressing problems on: old and ageing vessels; poor passenger and cargo service standards; and inefficient operations. (MARINA, 2003). In relation to these, future courses of action should consider increased efficiency in domestic shipping operations as a support framework to overseas fleet operations in agriculture, trade and industry, and tourism activities. This is seen as a necessary strategy in improving the country’s global competitiveness when it comes to transporting trade commodities. This entails, on the other hand, upgrading standards of services offered by the domestic fleets. This is to ensure enhanced efficiency and effectiveness in the said sector. Another relevant area that requires serious attention is the need to improve manpower capacity with the aim of increasing human resource capacity of the domestic shipping sector. To support such future directions, the sector has to design financing incentives that will attract increased investments in the sector. Fleet modernization, too, is a prerequisite to complementing these vessel improvements. A comprehensive Monitoring and Evaluation (M & E) System that will serve as a reporting or feedback mechanism of the industry is another gap that must be filled-in to enable the government to institutionalize operational mechanisms in providing solutions to existing issues and challenges. Sector areas in
LITERATURE REVIEW ON MARINE TRANSPORTATION AND COASTAL TOURISM 33

which the government plays a critical role are vessel safety, passenger service standards, cargo service standards and regulated operational conditions and requirements. In addition to the above, basic issues requiring immediate solutions include the following: 1) scale of deregulation to be adopted by the sector; 2) cap deregulation on Return on Investments (ROI) on public utilities; 3) proposed liberalization of cabotage for increased efficiency in transporting country’s exports and imports; 4) need to increase local shipbuilding capacity in response to growing tonnage demand; 5) planned deregulation of port operations to provide necessary port infrastructures and services; and 6) shift of focus to tertiary, developmental and ferry routes as a strategy in serving the majority.
2. Overseas Shipping
Profile For the period 2002-2004, bulk carriers have ranked highest in terms of market share in the overseas shipping sector with an average annual share of 48%. General cargo, on the other hand, is second among all the other vessel types comprising the overseas fleet of the country. Types of service offered by overseas shipping sector include bulk carrier, general cargo, car carrier, livestock carrier, container, reefer, multi-purpose, tanker, Ro-Ro, LPG carrier, log carrier, passenger, dry cargo and vehicle carrier. Revenues of the sector come from MARINA collection on application fees, penalties, BIR collection on the 4.5% withholding tax on charter hires for bareboat chartered vessels and remittances from seafarers of RP flag vessels. In particular, in 2004, MARINA earned P7.82 million from application fee and penalty charges. On the other hand, amount collected from the 4.5% withholding tax totaled to P106.19 million. Remittances of Filipino seafarers also contribute significantly to the country’s economy with a recorded amount of P1,519.86 million in 2004. An important development in the sector is the establishment of regional shipping lines in the Zamboanga - Sandakan (Malaysia), General Santos City – Bitung (Indonesia) and Davao – Muara (Brunei) shipping routes. Eight hub centers identified in the Mindanao Region are Bongao, Cagayan de Oro City, otabato City, Davao City, General Santos City, Iligan City, Puerto Princesa and Zamboanga City.
Policies List of major policies in the sector is provided in Table 13.
34 THE PHILIPPINE ENVIRONMENTAL GOVERNANCE 2 PROJECT
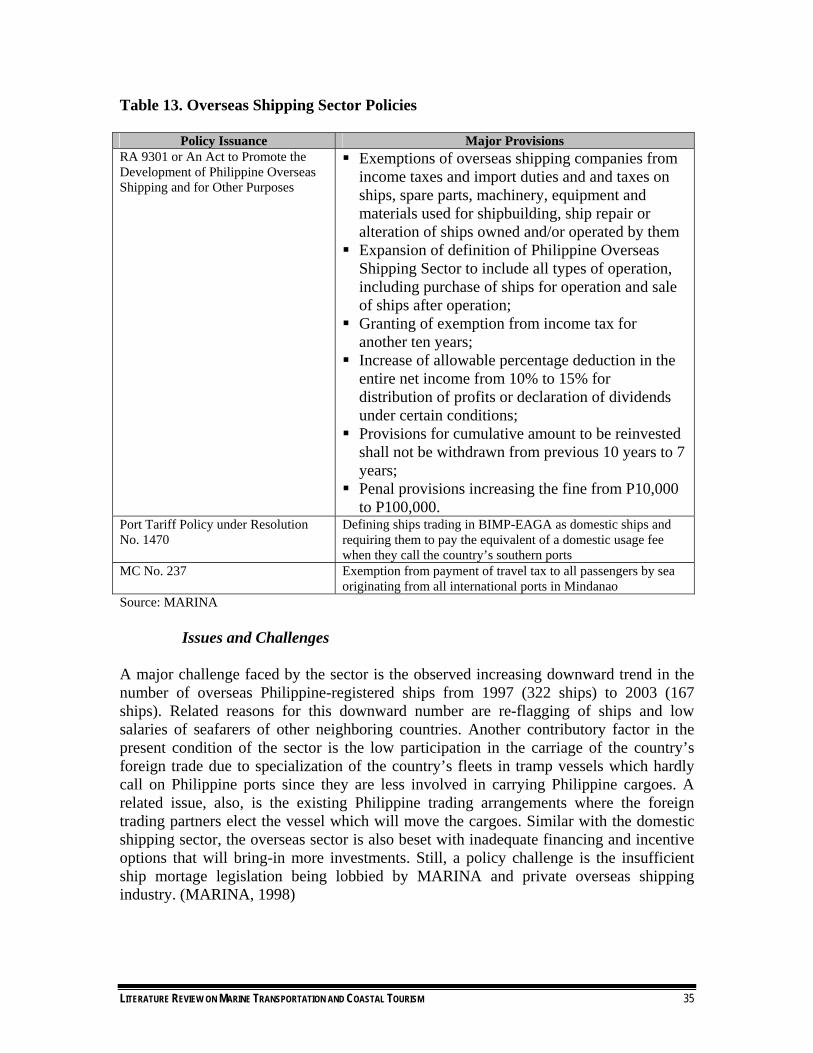
Table 13. Overseas Shipping Sector Policies
Policy Issuance Major Provisions RA 9301 or An Act to Promote the Development of Philippine Overseas Shipping and for Other Purposes
Exemptions of overseas shipping companies from income taxes and import duties and and taxes on ships, spare parts, machinery, equipment and materials used for shipbuilding, ship repair or alteration of ships owned and/or operated by them
Expansion of definition of Philippine Overseas Shipping Sector to include all types of operation, including purchase of ships for operation and sale of ships after operation;
Granting of exemption from income tax for another ten years;
Increase of allowable percentage deduction in the entire net income from 10% to 15% for distribution of profits or declaration of dividends under certain conditions;
Provisions for cumulative amount to be reinvested shall not be withdrawn from previous 10 years to 7 years;
Penal provisions increasing the fine from P10,000 to P100,000.
Port Tariff Policy under Resolution No. 1470
Defining ships trading in BIMP-EAGA as domestic ships and requiring them to pay the equivalent of a domestic usage fee when they call the country’s southern ports
MC No. 237
Exemption from payment of travel tax to all passengers by sea originating from all international ports in Mindanao
Source: MARINA
Issues and Challenges A major challenge faced by the sector is the observed increasing downward trend in the number of overseas Philippine-registered ships from 1997 (322 ships) to 2003 (167 ships). Related reasons for this downward number are re-flagging of ships and low salaries of seafarers of other neighboring countries. Another contributory factor in the present condition of the sector is the low participation in the carriage of the country’s foreign trade due to specialization of the country’s fleets in tramp vessels which hardly call on Philippine ports since they are less involved in carrying Philippine cargoes. A related issue, also, is the existing Philippine trading arrangements where the foreign trading partners elect the vessel which will move the cargoes. Similar with the domestic shipping sector, the overseas sector is also beset with inadequate financing and incentive options that will bring-in more investments. Still, a policy challenge is the insufficient ship mortage legislation being lobbied by MARINA and private overseas shipping industry. (MARINA, 1998)
LITERATURE REVIEW ON MARINE TRANSPORTATION AND COASTAL TOURISM 35

B. PORT SECTOR
Profile National Statistic Coordination Board (NSCB) defines port as “place where ships may anchor or tie-up for the purpose of shelter, repair, loading or discharge of cargo, or for other such activities connected with water-borne commerce, and including all the land and water areas and structures, equipment and facilities related to these functions.”2 United Nations (2001) characterize ports as a “collection of physical resources, including facilities and land, and services designed to provide an interchange between water and land transport systems.”3 Seaport activities can, thus, be classified into: infrastructure; port services using infrastructure; and coordination of port activities such as sorting, manufacturing and distribution. Berths, docks and adjacent lands for ships and cargoes constitute a port infrastructure. Also necessary to support such infrastructure are maritime access (channels, locks and aids to navigation) and land access (connections to roads, rail network and inland waterways). Main facilities and services provided by ports for cargoes are listed below. Table 14. Port Facilities and Services
Cargoes Passengers Ships 1) Ship arrival/departure: navigation
aids, approach channel, pilotage from outside the port, lock (if any), protected water, port pilotage, towage, berthing/unberthing
2) Quayside: opening/closing of hatches, breaking-out/stowage, cargo handling onboard ship
3) Cargo/container transfer to/from quay: superstructure such as fixed and mobile equipment (cranes, van cariers, transtainers)
4) Cargo arrival/departure: cargo handling on quay, transport to/from storage, storage superstructure (sheds, fuel tanks, office buildings etc.), delivery/receiving, road and rail shipment facilities and other land transport access infrastructure
5) Services such as warehousing, security, weighting, lighterage and rent of equipment
Similar with facilities and services provided for cargoes
Services such as radar surveillance and traffic management, water, telephone, stores and fuel, police and security, repairs, fire fighting, waste disposal and medical services
Source: United Nations, 2001
2 Ports Inventory Technical Notes, http://www.nscb.gov.ph/technotes/port_tech.asp 3 United Nations. 2001. The Economic Regulation of Transport Infrastructure Facilities and Services: Principles and Issues. United Nations, New York.
36 THE PHILIPPINE ENVIRONMENTAL GOVERNANCE 2 PROJECT

Economic performance indicators for ports can be measured using these parameters: physical performance; factor productivity; and economic and financial factors. (United Nations, 2001). Physical performance can be defined using ship turnaround times, cargo-handling time, berth occupancy rates and cargo dwell times, depending on ship and cargo types. Factor productivity, on the other hand, can be computed using tons of cargo handled per worker or gang-hour, or per crane hour, or per berth meter. Total income of operating surplus per GRT/NRT or operating surplus per ton handled are the most common indicators used for determining economic and financial impacts of port activities. The Philippine port system is comprised of four categories, namely: 1) Philippine Ports Authority (PPA) system made up of public and private ports; 2) ports under the jurisdiction of independent port authorities (IPAs); 3) devolved public ports to LGUs, including fishing ports and wharves; and 4) Road Roll-On Roll-Off Terminal System (RRTS). (Llanto, 2005). The PPA port system is the biggest port network system in the country. It classifies its ports into base ports, terminal ports and other government ports. There are 115 PPA-owned ports and more than 500 private (commercial and non-commercial/industrial) ports under PPA’s direct supervision. Private ports are usually intended for industrial purposes while there are also a number for commercial uses. At present, there are 30 private commercial ports. These PPA ports are financially independent from the government. Port revenues of these category come from: concession fees from the lease of South Harbor and Manila International Container Terminal (MICT); port charges such as wharfage, berthing and pilotage; and share of cargo handling revenues from private cargo-handling operators and from port charges of privately-operated ports. To mention, 50% of its net income is given to the national government as dividends. In addition, these ports handle domestic and foreign cargo (containerized and bulk) and passengers. In some instances, RORO operations are allowed in PPA ports. Institutional and regulatory framework for PPA Ports is shown in the table below. Table 15. Legal Authorities on Philippine Port System
Port System Port Authority and Legal
Framework Regulation PPA Port System LOLO and RORO operations; containerized and non-containerized cargoes
PPA as the main authority in the national port system per Presidential Decree No. 505 as amended by PD 857
PPA as a government-owned and controlled corporation (GOCC), an attached agency to DOTC
Characterized by self-revenue generation, financial independence from the government and declares dividends to governments
Public Ports - Development, ownership,
maintenance and regulation of its ports
- Setting and collection of port charges such as wharfage dues, berthing/usage fees and terminal handling costs
- Approval of increases in cargo handling rates and receipt pf 10% and 20% from cargo handling revenues on domestic and foreign cargo, respectively
- Awarding of contracts to private terminal operators and cargo
LITERATURE REVIEW ON MARINE TRANSPORTATION AND COASTAL TOURISM 37
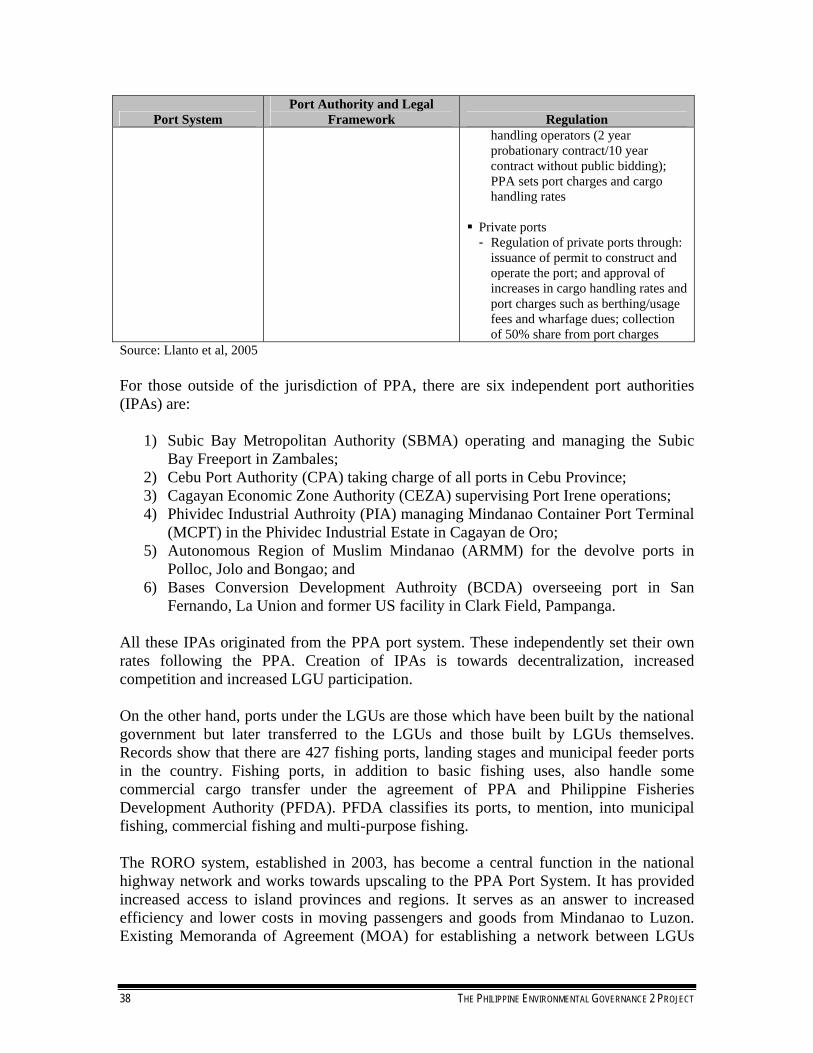
Port Authority and Legal Port System Framework Regulation
handling operators (2 year probationary contract/10 year contract without public bidding); PPA sets port charges and cargo handling rates
Private ports - Regulation of private ports through:
issuance of permit to construct and operate the port; and approval of increases in cargo handling rates and port charges such as berthing/usage fees and wharfage dues; collection of 50% share from port charges
Source: Llanto et al, 2005 For those outside of the jurisdiction of PPA, there are six independent port authorities (IPAs) are:
1) Subic Bay Metropolitan Authority (SBMA) operating and managing the Subic Bay Freeport in Zambales;
2) Cebu Port Authority (CPA) taking charge of all ports in Cebu Province; 3) Cagayan Economic Zone Authority (CEZA) supervising Port Irene operations; 4) Phividec Industrial Authroity (PIA) managing Mindanao Container Port Terminal
(MCPT) in the Phividec Industrial Estate in Cagayan de Oro; 5) Autonomous Region of Muslim Mindanao (ARMM) for the devolve ports in
Polloc, Jolo and Bongao; and 6) Bases Conversion Development Authroity (BCDA) overseeing port in San
Fernando, La Union and former US facility in Clark Field, Pampanga. All these IPAs originated from the PPA port system. These independently set their own rates following the PPA. Creation of IPAs is towards decentralization, increased competition and increased LGU participation. On the other hand, ports under the LGUs are those which have been built by the national government but later transferred to the LGUs and those built by LGUs themselves. Records show that there are 427 fishing ports, landing stages and municipal feeder ports in the country. Fishing ports, in addition to basic fishing uses, also handle some commercial cargo transfer under the agreement of PPA and Philippine Fisheries Development Authority (PFDA). PFDA classifies its ports, to mention, into municipal fishing, commercial fishing and multi-purpose fishing. The RORO system, established in 2003, has become a central function in the national highway network and works towards upscaling to the PPA Port System. It has provided increased access to island provinces and regions. It serves as an answer to increased efficiency and lower costs in moving passengers and goods from Mindanao to Luzon. Existing Memoranda of Agreement (MOA) for establishing a network between LGUs
38 THE PHILIPPINE ENVIRONMENTAL GOVERNANCE 2 PROJECT

and private investors are: Cebu (Cordova) – Getafe (Bohol); Guadalupe (Southern Leyte) – Ubay (Bohol); Loay (Bohol) – Mambajao (Camiguin); Camiguin – Misamis Oriental; and Jasan (Misamis Oriental) – Loay (Bohol). It is interesting to note that NSCB has other port classification types which are: 1) commercial private ports owned and operated by private companies for their own purposes; 2) commercial public ports owned and operated by the government for the general public and accommodate vessels of more than 30 tonnage; 3) fishing ports owned and operated by government or private companies as central collection and distribution center for fish; and 4) feeder ports owned and operated by the government as linkages among neighboring small islands and nearby urban centers for small passenger and fishing boats.
Institutional and Regulatory Framework The diagram below illustrates the present institutional and regulatory framework discussed above.
Philippine Port System
PPA
CPA, SBMA, CEZA, PHIDEC,
ARMM
Public Ports
IPA DOTC RRTS
Private Ports Municipal
Ports/Fishing Wharves
Private RORO
Terminals
LGURORO
Terminals
Philippine Port System
PPA
CPA, SBMA, CEZA, PHIDEC,
ARMM
Public Ports
IPA DOTC RRTS
Private Ports Municipal
Ports/Fishing Wharves
Private RORO
Terminals
LGURORO
Terminals
Figure 2. Philippine Port System
Fees and Charges For the facilities and services provided by ports, prices are generally categorized into: port dues or amount of money paid for the use of the port facilities as a whole; and port tariffs charged either to ship owners or cargo owners. (United Nations, 2001). Specifically, these two can further classified into: 1) Port dues. These are charges on cargo and ships. Cargo dues are based on the volume
or weight of the cargo while ship dues are computed in reference with gross registered tonnage (GRT), net registered tonnage (NRT) or length of ship.
2) Port Tariffs - Berth Occupancy. Tonnage or ship and quay length are often used as bases for
additional charges. This is usually charged on a time basis, such as per day.
LITERATURE REVIEW ON MARINE TRANSPORTATION AND COASTAL TOURISM 39
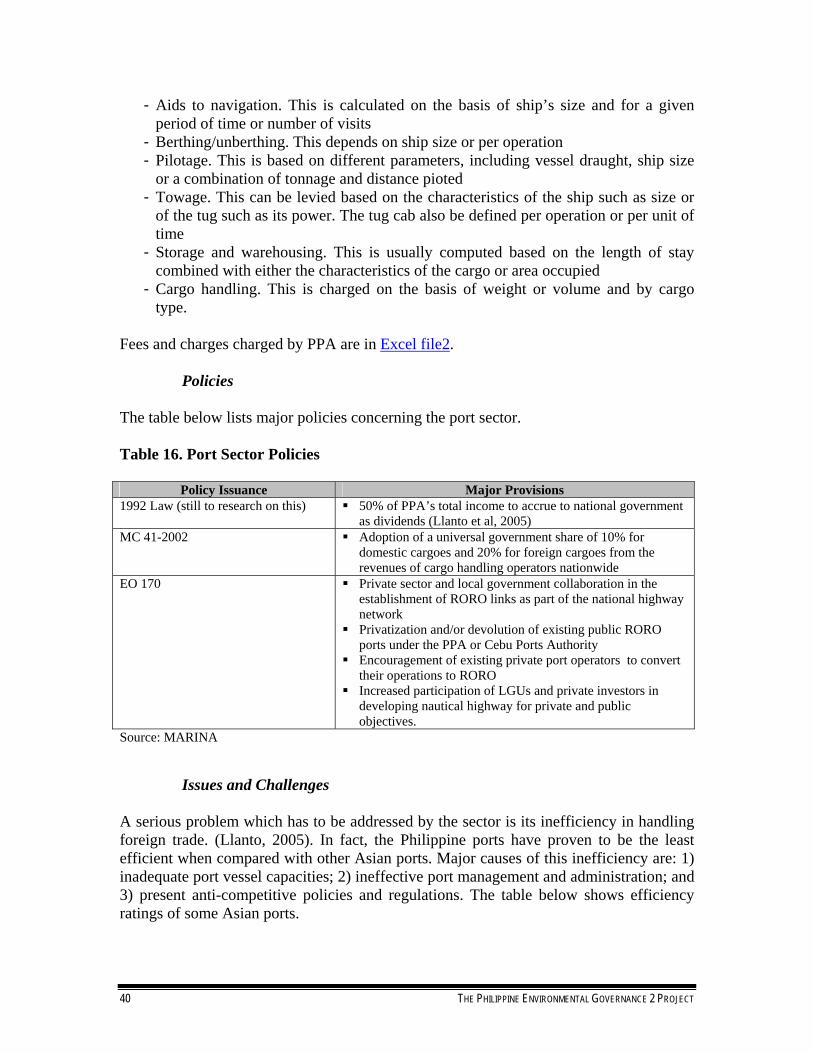
- Aids to navigation. This is calculated on the basis of ship’s size and for a given period of time or number of visits
- Berthing/unberthing. This depends on ship size or per operation - Pilotage. This is based on different parameters, including vessel draught, ship size
or a combination of tonnage and distance pioted - Towage. This can be levied based on the characteristics of the ship such as size or
of the tug such as its power. The tug cab also be defined per operation or per unit of time
- Storage and warehousing. This is usually computed based on the length of stay combined with either the characteristics of the cargo or area occupied
- Cargo handling. This is charged on the basis of weight or volume and by cargo type.
Fees and charges charged by PPA are in Excel file2.
Policies The table below lists major policies concerning the port sector. Table 16. Port Sector Policies
Policy Issuance Major Provisions 1992 Law (still to research on this) 50% of PPA’s total income to accrue to national government
as dividends (Llanto et al, 2005) MC 41-2002 Adoption of a universal government share of 10% for
domestic cargoes and 20% for foreign cargoes from the revenues of cargo handling operators nationwide
EO 170 Private sector and local government collaboration in the establishment of RORO links as part of the national highway network
Privatization and/or devolution of existing public RORO ports under the PPA or Cebu Ports Authority
Encouragement of existing private port operators to convert their operations to RORO
Increased participation of LGUs and private investors in developing nautical highway for private and public objectives.
Source: MARINA
Issues and Challenges A serious problem which has to be addressed by the sector is its inefficiency in handling foreign trade. (Llanto, 2005). In fact, the Philippine ports have proven to be the least efficient when compared with other Asian ports. Major causes of this inefficiency are: 1) inadequate port vessel capacities; 2) ineffective port management and administration; and 3) present anti-competitive policies and regulations. The table below shows efficiency ratings of some Asian ports.
40 THE PHILIPPINE ENVIRONMENTAL GOVERNANCE 2 PROJECT

Table 17. Indicators of Port Efficiency
Country Port Efficiency Index
(1 – 7) Median Clearance time
(Days) Hong Kong 6.38 na Malaysia 4.95 7 Philippines 2.79 7 Singapore 6.76 2 Taiwan 5.18 na
The highly centralized port ownership and administration in relation to the functions performed by PPA also poses a challenge to the sector. (Llanto et al, 2005). PPA acts as a developer, operator, owner and regulator of ports. In the same way, it regulates private ports, awards contracts for cargo handling services to the private sector in ports owned by it and regulates entry of the private sector through the issuance of permits to construct and operate ports. As a result of conflicting interests, there has been limited competition in the industry. For one, PPA works against full competition in the foreign containerized market which has the potential of affecting income from Manila International Container Terminal (MICT) and South Harbor. In the same manner, the strategy of letting Harbor Center Port Terminal (HCPT) handle foreign break-bulk cargoes reduced the income sources of South Harbor. This, then, affects the amount of dividends that PPA should remit to the national government. A more evident result, however, is the downward trend of financial resources that may be used for port development and maintenance activities. Llanto et al (2005) concludes that financial sustainability of the sector is also a critical concern at present. JICA (2003) cites that existing port charges such as tariffs for domestic berthing and cargo handling have been set very low to support the sector’s operations and management. This brings about financial dependence of LGU-operated ports. Another present challenge in port operations is the preference for multiple cargo handling than the RORO shipping. (Llanto et al, 2005). 18% of the total revenues, in 2001, was contributed by multiple cargo handling activities. Revenues which may be gained from these by private investors undermine RORO’s benefits in decreased breakage and deterioration of cargoes, increased security of cargoes and reduction in pilferage. Israel and Roque (2000) underscore the challenges faced by regional fishing ports. A major finding of the study is the underutilization of existing regional fishing ports derived by comparing projected usage and actual usage of the port samples. (See Excel files). Factors contributing to this underutilization are limited post-harvest facilities and declining fish catch landed on regional fishing ports. More than this, however, is the inadequacy of municipal fishing ports and facilities in the country. In 1997, national ratio of municipal ports to coastal municipalities accounted to 50% only. Another pressing issue in fishing ports is the need to improve environmental management practices. Construction of wastewater treatments plants have to be a priority in order to address such problem.
LITERATURE REVIEW ON MARINE TRANSPORTATION AND COASTAL TOURISM 41

Given the above discussions, it is clear that there is a need to comprehensively review the regulatory framework of the port industry. (Llanto et al, 2005). The review should result in distinction of PPA’s regulatory functions from its development and operation assignments. Related with this is the urgent solution to the lack of transparent guidelines in granting or extending cargo handling contracts. In addition, PPA should consider leasing port facilities to port operators rather that collecting a percentage of revenues. A review of the tariff setting procedures is also seen as a must as a preparatory step towards rate deregulation. For fishing ports, PFDA has to list options by which to maximize usage of these ports. Israel and Roque (2000) suggests that ports also be used as integrated fisheries-agriculture processing centers. Leasing these ports to private companies is also a noteworthy consideration in increasing usage of these ports. Post-harvest facilities have also to be constructed to increase economic activities in these ports. Thus, agricultural and fishery production of a municipality is a key factor influencing port usage.
42 THE PHILIPPINE ENVIRONMENTAL GOVERNANCE 2 PROJECT
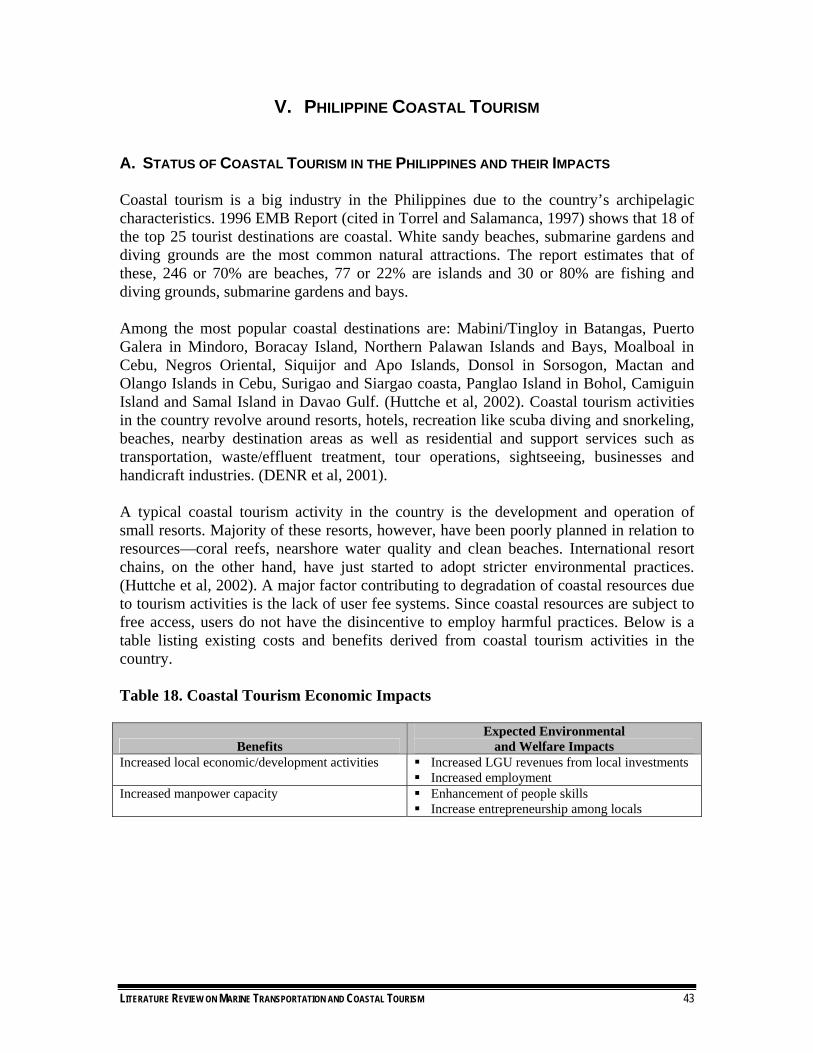
V. PHILIPPINE COASTAL TOURISM A. STATUS OF COASTAL TOURISM IN THE PHILIPPINES AND THEIR IMPACTS Coastal tourism is a big industry in the Philippines due to the country’s archipelagic characteristics. 1996 EMB Report (cited in Torrel and Salamanca, 1997) shows that 18 of the top 25 tourist destinations are coastal. White sandy beaches, submarine gardens and diving grounds are the most common natural attractions. The report estimates that of these, 246 or 70% are beaches, 77 or 22% are islands and 30 or 80% are fishing and diving grounds, submarine gardens and bays. Among the most popular coastal destinations are: Mabini/Tingloy in Batangas, Puerto Galera in Mindoro, Boracay Island, Northern Palawan Islands and Bays, Moalboal in Cebu, Negros Oriental, Siquijor and Apo Islands, Donsol in Sorsogon, Mactan and Olango Islands in Cebu, Surigao and Siargao coasta, Panglao Island in Bohol, Camiguin Island and Samal Island in Davao Gulf. (Huttche et al, 2002). Coastal tourism activities in the country revolve around resorts, hotels, recreation like scuba diving and snorkeling, beaches, nearby destination areas as well as residential and support services such as transportation, waste/effluent treatment, tour operations, sightseeing, businesses and handicraft industries. (DENR et al, 2001). A typical coastal tourism activity in the country is the development and operation of small resorts. Majority of these resorts, however, have been poorly planned in relation to resources—coral reefs, nearshore water quality and clean beaches. International resort chains, on the other hand, have just started to adopt stricter environmental practices. (Huttche et al, 2002). A major factor contributing to degradation of coastal resources due to tourism activities is the lack of user fee systems. Since coastal resources are subject to free access, users do not have the disincentive to employ harmful practices. Below is a table listing existing costs and benefits derived from coastal tourism activities in the country. Table 18. Coastal Tourism Economic Impacts
Benefits Expected Environmental
and Welfare Impacts Increased local economic/development activities Increased LGU revenues from local investments
Increased employment Increased manpower capacity Enhancement of people skills
Increase entrepreneurship among locals
LITERATURE REVIEW ON MARINE TRANSPORTATION AND COASTAL TOURISM 43

Costs Expected Environmental
and Welfare Impacts Increased solid waste generation Degraded water quality and habitats
Public health risk Aesthetic losses Increased SWM costs
Increased sewage disposal Degraded water quality Species toxicity Habitat loss Public health risk Recreational losses Aesthetic losses Increased costs for wastewater management
Increased area development Water pollution Limited use of coastal areas for traditional
activities Increased recreation activities such as sightseeing, reef walks and souvenir collection
Resource depletion
Employment of local residents and increased immigrant employees
Decreased labor force on non-tourism activities Increased population
Source: Adopted from Wells, 1997 and DENR et al, 2001 B. LEGAL FRAMEWORK Philippine Tourism Authority (PTA) is the lead agency mandated to coordinate all tourism project plans as provided by Presidential Decrees (PDs) 189 and 564 while DENR oversees the implementation of the Environmental Impact Statement (EIS) System and issuance of Administrative Orders (AOs) LGUs, on the other hand, formulate and implement ordinances addressing specific tourism issues within their jurisdiction. Table 19 identifies coastal tourism issues, applicable policies and responsible agencies. Table 19. Coastal Tourism Issues, Applicable Policies and Responsible Agencies
Coastal Tourism Related Aspect Legislation and Responsibilities Responsible Agency
Environmental Impact Statement (IES) System
DENR Administrative Order No. 96-37, providing: EIA done by the project proponent – the
tourism developer – within the EIS System Initially, conduct of Initial Environmental
Examination (IEE) For larger projects or projects with potential
significant environmental impacts within an Environmentally Critical Area (ECA), conduct of a more detailed Environmental Impact Statement (EIS)
Issuance of Environmental Compliance Certificate (ECC) by the DENR after evaluation and approval of IEE, EIS or
Environmental Management Bureau (EMB) of DENR of Protected Areas and Wildlife Bureau (PAWB) if a protected area is concerned
44 THE PHILIPPINE ENVIRONMENTAL GOVERNANCE 2 PROJECT
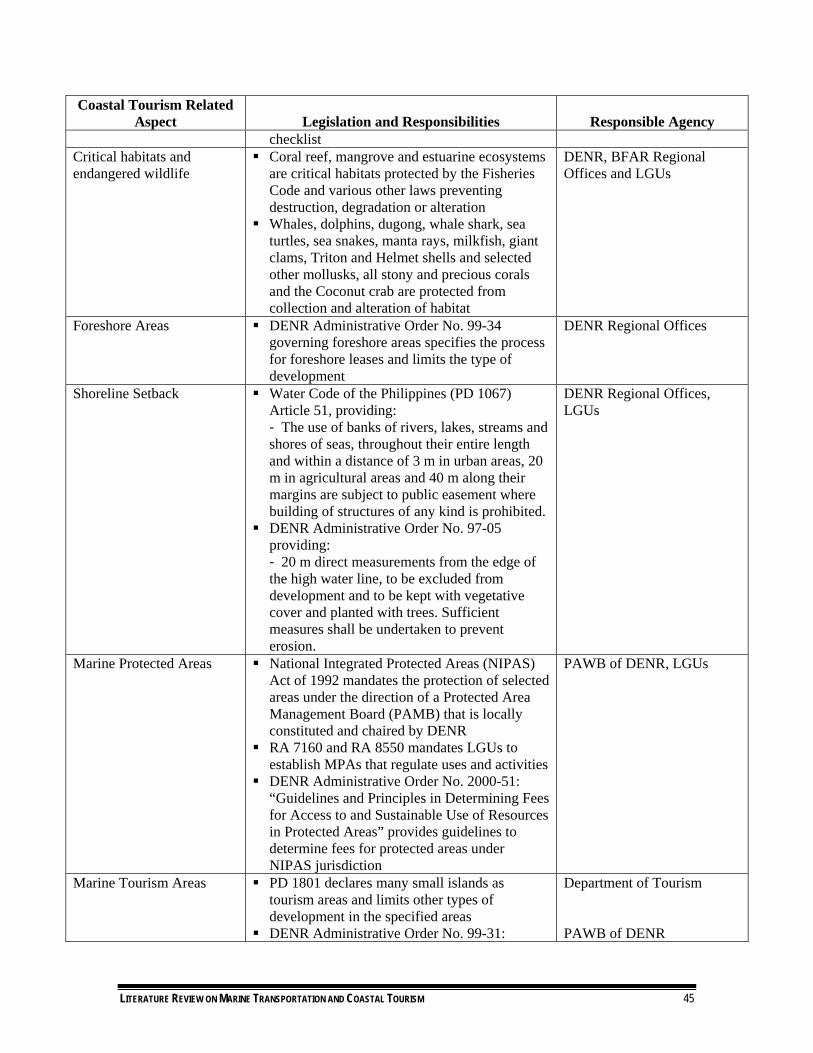
Coastal Tourism Related Aspect Legislation and Responsibilities Responsible Agency
checklist Critical habitats and endangered wildlife
Coral reef, mangrove and estuarine ecosystems are critical habitats protected by the Fisheries Code and various other laws preventing destruction, degradation or alteration
Whales, dolphins, dugong, whale shark, sea turtles, sea snakes, manta rays, milkfish, giant clams, Triton and Helmet shells and selected other mollusks, all stony and precious corals and the Coconut crab are protected from collection and alteration of habitat
DENR, BFAR Regional Offices and LGUs
Foreshore Areas DENR Administrative Order No. 99-34 governing foreshore areas specifies the process for foreshore leases and limits the type of development
DENR Regional Offices
Shoreline Setback Water Code of the Philippines (PD 1067) Article 51, providing: - The use of banks of rivers, lakes, streams and shores of seas, throughout their entire length and within a distance of 3 m in urban areas, 20 m in agricultural areas and 40 m along their margins are subject to public easement where building of structures of any kind is prohibited.
DENR Administrative Order No. 97-05 providing: - 20 m direct measurements from the edge of the high water line, to be excluded from development and to be kept with vegetative cover and planted with trees. Sufficient measures shall be undertaken to prevent erosion.
DENR Regional Offices, LGUs
Marine Protected Areas National Integrated Protected Areas (NIPAS) Act of 1992 mandates the protection of selected areas under the direction of a Protected Area Management Board (PAMB) that is locally constituted and chaired by DENR
RA 7160 and RA 8550 mandates LGUs to establish MPAs that regulate uses and activities
DENR Administrative Order No. 2000-51: “Guidelines and Principles in Determining Fees for Access to and Sustainable Use of Resources in Protected Areas” provides guidelines to determine fees for protected areas under NIPAS jurisdiction
PAWB of DENR, LGUs
Marine Tourism Areas PD 1801 declares many small islands as tourism areas and limits other types of development in the specified areas
DENR Administrative Order No. 99-31:
Department of Tourism PAWB of DENR
LITERATURE REVIEW ON MARINE TRANSPORTATION AND COASTAL TOURISM 45

Coastal Tourism Related Aspect Legislation and Responsibilities Responsible Agency
“Ecological Destination Development Guidelines for Turtle Islands, Tawi-Tawi” details the types of development and activities allowed within the Turtle Islands Heritage Protected Area
Ecotourism Presidential Executive Order No. 111/1999: Establishes an inter-agency National Ecotourism Development Council (NEDC) as policy-making body for ecotourism
National ecotourism strategy, program, guidelines, etc.
Inter-agency Regional Ecotourism Committees (RECs) approve and monitor ecotourism projects in the region
DENR Administrative Order 2001-04: Defines ecological destinations and sets guidelines on the establishment, development and management of ecological destinations and environmental rest area parks
DOT and DENR DENR Regional Offices, LGUs
Small Island Development DENR Administrative Order No. 2000-83 concerning small island development
Refers to islands with an area of less than 50,000 has
Islands less than 500 has are strict conservation areas, no renewal of leases allowed
Islands of 500 to 5,000 has are under restricted use. For tourism: No construction and/or operation of casinos, high rise hotels (3 storeys and up), golf courses/driving range
Islands of 5,000 to 50,000 has are open to sustainable development within the prescribed carrying capacity and subject to EIA
ECC needed for development Sets out lease/rental fees for islands
DENR Application to CENRO
Source: Huttche et al, 2002 It is important to note that most of the coastal tourism related-valuation studies conducted have focused on valuing coral reefs as tourist attractions. Reef activities include scuba diving and underwater photography. Popular diving resorts with exceptional quality coral reefs are Mabini, Batangas, northern Palawan; Central Visayas areas of Mactan Island, Cebu; Panglao, Bohol; Negros Oriental; and selected areas of Mindanao Island. (White and Trinidad, 1998). Another major area of study in coastal tourism is the valuation of marine sanctuaries as tourist destinations. Attached is an Excel file showing tourism valuation results for corals and marine sanctuaries. Thus, there is a need for a comprehensive study on coastal tourism to include all coastal tourism activities and
46 THE PHILIPPINE ENVIRONMENTAL GOVERNANCE 2 PROJECT

corresponding services such as those mentioned earlier with the end in view of identifying all economic costs and benefits.
LITERATURE REVIEW ON MARINE TRANSPORTATION AND COASTAL TOURISM 47

REFERENCES Austria, Myrna. 2002. Philippine Domestic Shipping Industry: State of Competition and Market
Structure, PASCN Discussion Paper No. 2002-04. Philippine Institute for Development Studies, Makati City. http://pascn.pids.gov.ph/DiscList/d02/s02-04.pdf
Bourassa, Y. et al. Resource Valuation Guide. New Brunswick Department of Environment,
http://www.atl.ec.gc.ca/community/acap/pdf/resourceguidebook_e.pdf (accessed 5 September 2005).
Canmac Economics, School for Resource and Environmental Studies, Enterprise
Management Consultants and the Secretariat of the Atlantic Coastal Zone Information Steering Committee. 2002. The Value of the Ocean Sector to the Economy of Prince Edward Island, prepared for the Government of Prince Edward Island and the Government of Canada, 114p, http://www.gov.pe.ca/photos/original/fae_oceans_e. pdf (accessed 12 September 2005)
Department of Environment and Natural Resources, Bureau of Fisheries and Aquatic
Resources and Department of Interior and Local Government. 2001.Philippine Coastal Management Guidebook Series No. 7: Managing Impacts of Development in the Coastal Zone. Coastal Resource Management Project. Cebu City.
Francisco, Herminia. 2003. Economic Analysis of Allocating Forests and Forest Lands (Total
Economic Valuation Approach). Philippine Environmental Governance Project, Pasig City.
Harder, Dieldre. 2004. Economic Valuation of the Impacts of Land-Based Pollution in the
South China Sea used in the Third Meeting of the Regional Task Force on Economic Valuation for the UNEP/GEF Project: “Reversing Environmental Degradation Trends in the South China Sea and Gulf of Thailand”, April 18-21, 2005. United Nations Environment Programme, UNEP/GEF South China Sea Project and Global Environment Facility, http://www.unepscs.org/Documents/RTF-E-3/4-RTF-E-3-Valuation%20of%20LBP%20Impact-jp.pdf (accessed 12 September 2005)
Huttche, Carsten et al. 2002. Sustainable Coastal Tourism Handbook for the Philippines.
Coastal Resource Management Project, Cebu City, http://www.oneocean.org/ download/20020628/coastal_tourism_handbook.pdf (accessed 6 October 2005)
Israel, Danilo and Roque, Ruchel Marie Grace. 2000. Analysis of Fishing Ports in the
Philippines. PIDS Discussion Paper Series, No. 2000-04, January. Kildow, Judith and Colgan, Charles. 2005. California’s Ocean Economy, Report to the
Resources Agency, State of California. National Economics Program, California. , http://noep.csumb.edu/Download/CalStudy.pdf (accessed 16 September 2005)
48 THE PHILIPPINE ENVIRONMENTAL GOVERNANCE 2 PROJECT

King, Philip. Economic Analysis of Beach Spending and the Recreational Benefits of Beaches in the City of San Clemente, http://userwww.sfsu.edu/~pgking/ sanclemente%20final%20report.pdf (accessed 12 September 2005)
Llanto, Gilberto. 2005. A Competition Policy and Efficient regulatory Framework for the Port
Sector: Getting It Unberthed. Policy Nottes, 2005-01, February. Llanto, Gilbert et al. 2005. Competition Policy and Regulation in Ports and Shipping. PIDS
Discussion Paper Series, No. 2005-02, February. Mandale, Maurice et al. 1998. Estimating the Economic Value of Coastal and Ocean Resources:
The Case of Nova Scotia. Oceans Institute of Canada and Atlantic Coastal Zone Information Steering Committee, Canada.
Maritime Industry Authority. 2003. The Domestic Shipping Industry of the Philippines: A
Situation Report, http://www.marina.gov.ph/report/ (accessed 29 September 2005) Maritime Industry Authority. 1998. The Domestic Shipping Industry of the Philippines: A
Situation Report, http://www.marina.gov.ph/report/ (accessed 29 September 2005) Maritime Industry Authority. 2004. The Overseas Shipping Industry of the Philippines: A
Situation Report, http://www.marina.gov.ph/report/ (accessed 29 September 2005) Maritime Industry Authority. 2004. MARINA Annual Report, http://www.marina.
gov.ph/report/ (accessed 29 September 2005) Maritime Industry Authority, Domestic Shipping Sector, http://www.marina.gov.ph/report/
(accessed 29 September 2005) National Statistics Coordination Board. Technical Notes on Ports Inventory, http://www.nscb.
gov.ph/technotes/port_tech.asp (accessed 4 October 2005) The Allen Consulting Group. 2004. The Economic Contribution of Australia’s Marine
Industries, http://www.oceans.gov.au/pdf/Economic%20reoprt.pdf (accessed 12 September 2005)
Torell, M. and A.M. Salamanca, Editors. 1997. Institutional Issues and Perspectives in the
Management of Fisheries and Coastal Resources in Southeast Asia. ICLARM Technical Report 60, 212 pages.
United Nations. 2001. The Economic Regulation of Transport Infrastructure Facilities and
Services: Principles and Issues. United Nations, New York, http://www.unescap.org/ tctd/pubs/files/econregfulltext.pdf (accessed 22 September 2005)
Wells, Michael. 1997. Economic Perspectives on Nature Tourism, Conservation and
Development. Environment Department Paper, No. 55 White, A. and Trinidad, A. 1998. The Values of Philippine Coastal Resources: Why
Protection and Management are Critical. Coastal Resource Management Project, Cebu City.
LITERATURE REVIEW ON MARINE TRANSPORTATION AND COASTAL TOURISM 49


