40
Lithology, Structure, Geomorphology Multi and Hyperspectral Remote Sensing for Geology
| Date post: | 16-Dec-2015 |
| Category: |
Documents |
| Upload: | lisandro-banford |
| View: | 230 times |
| Download: | 1 times |
Lithology, Structure, Geomorphology
Multi and Hyperspectral Remote Sensing for
Geology
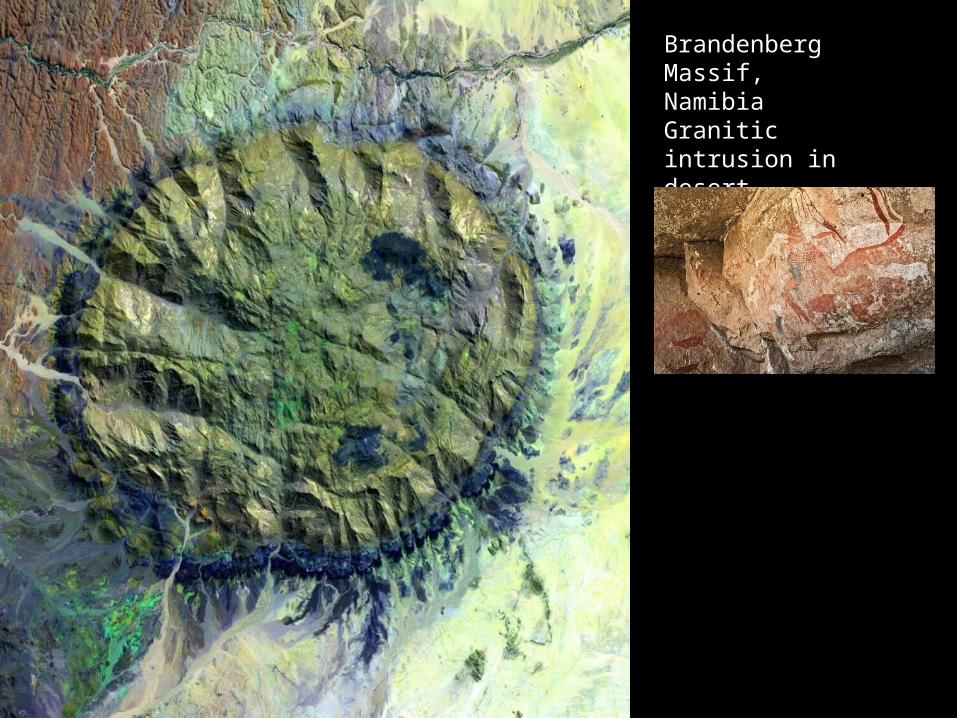
Brandenberg Massif, NamibiaGranitic intrusion in desert
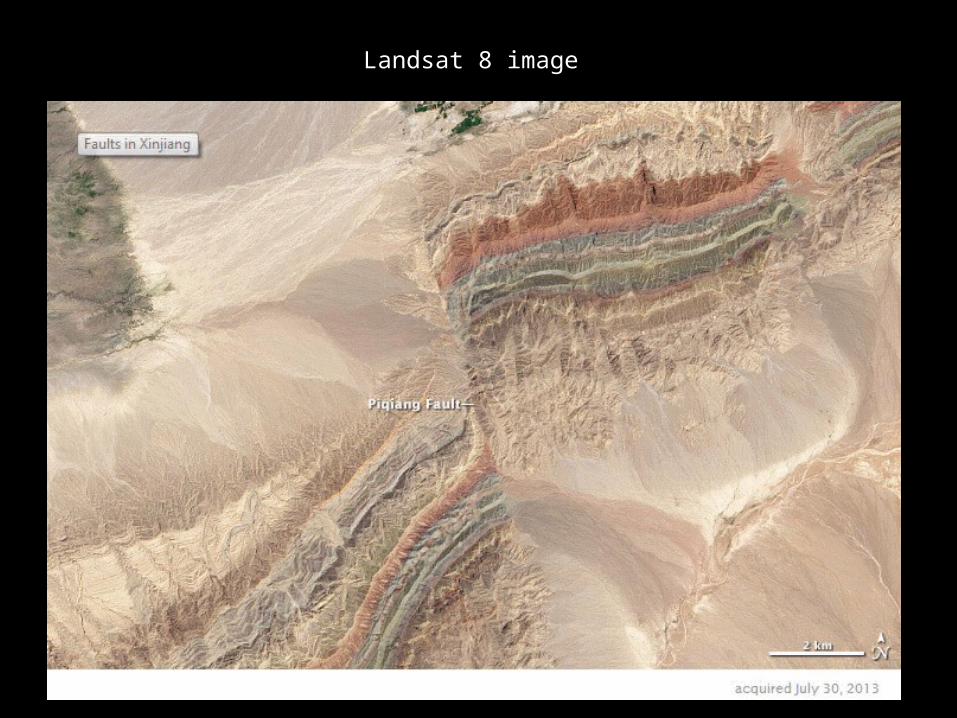
Landsat 8 image
The strength of multi and hyperspectral data for geology lies in its spectral resolutionMinerals have distinct reflectance signatures
with spectrally narrow featuresLithologic mapping depends largely on
discrimination of mineralsBroad-scale structural mapping can also
benefit from satellite RSMineral and petroleum exploration is more
efficient with imagery
Geologic Applications -- Overview
Hyperspectral data are particularly powerful for untangling mineral spectraCan “see” subtle reflectance featuresCan “unmix” within-pixel mixtures of different
minerals Hyperspectral data require careful
processing to allow comparison of satellite data to ground dataAtmospheric correctionCalibration to ground test sites
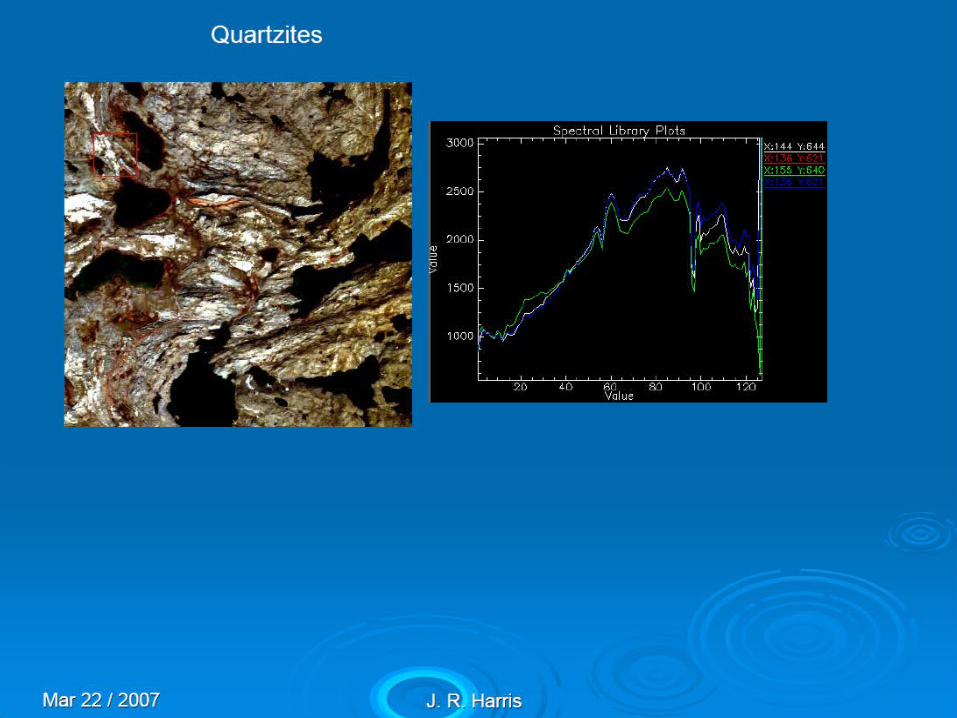
Common hyperspectral technique is called “spectral matching” for identifying materials
Spectral analysis of minerals
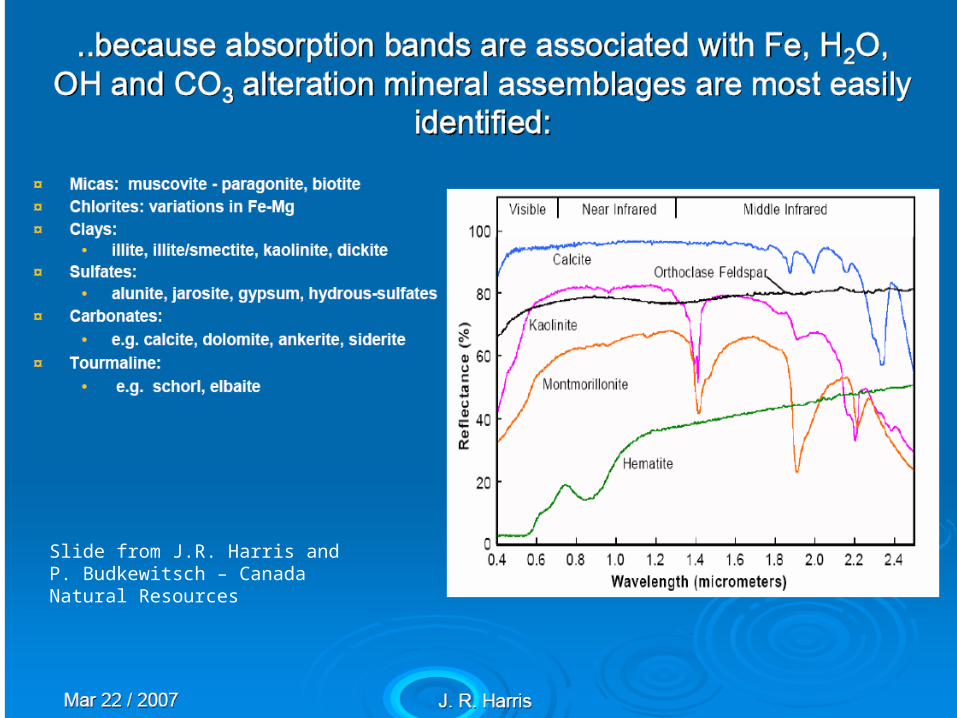
Slide from J.R. Harris and P. Budkewitsch – Canada Natural Resources

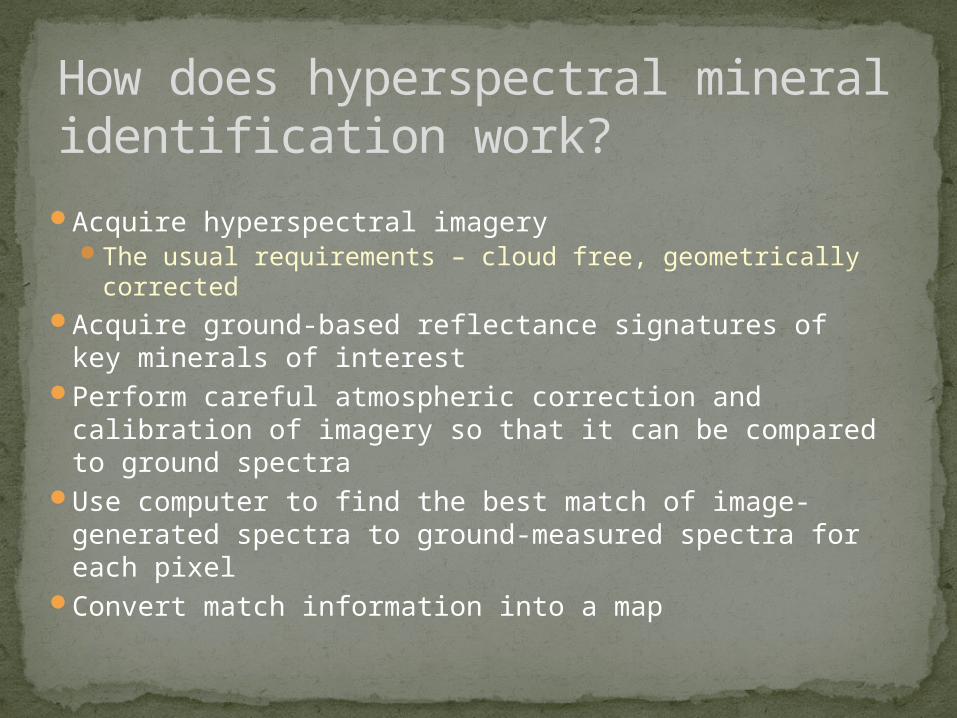
Acquire hyperspectral imageryThe usual requirements – cloud free, geometrically
correctedAcquire ground-based reflectance signatures of key
minerals of interestPerform careful atmospheric correction and calibration
of imagery so that it can be compared to ground spectraUse computer to find the best match of image-
generated spectra to ground-measured spectra for each pixel
Convert match information into a map
How does hyperspectral mineral identification work?
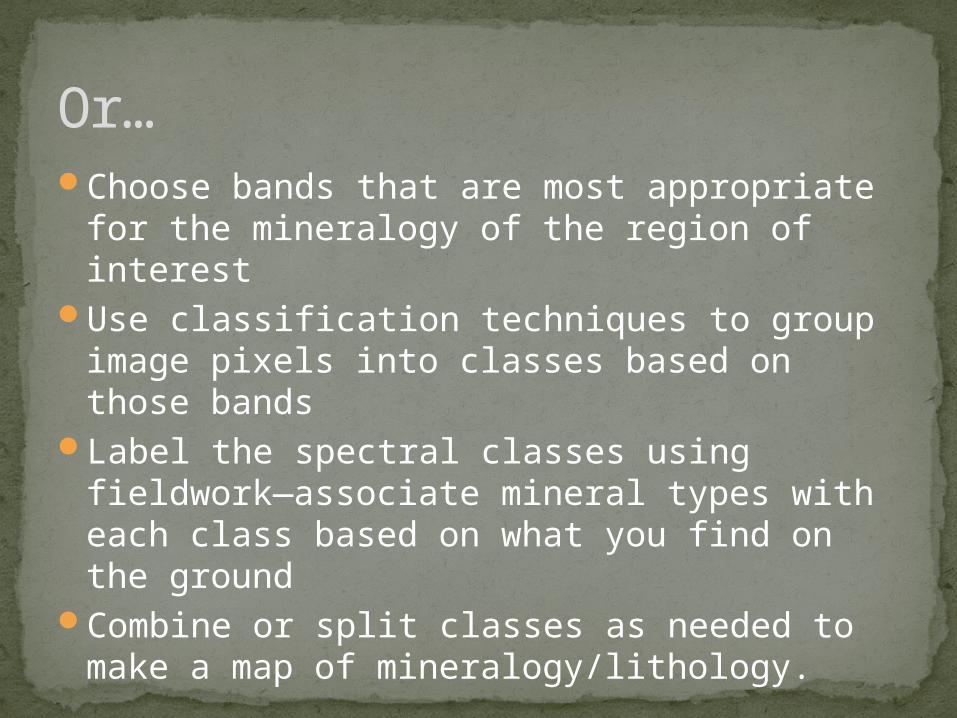
Choose bands that are most appropriate for the mineralogy of the region of interest
Use classification techniques to group image pixels into classes based on those bands
Label the spectral classes using fieldwork—associate mineral types with each class based on what you find on the ground
Combine or split classes as needed to make a map of mineralogy/lithology.
Or…
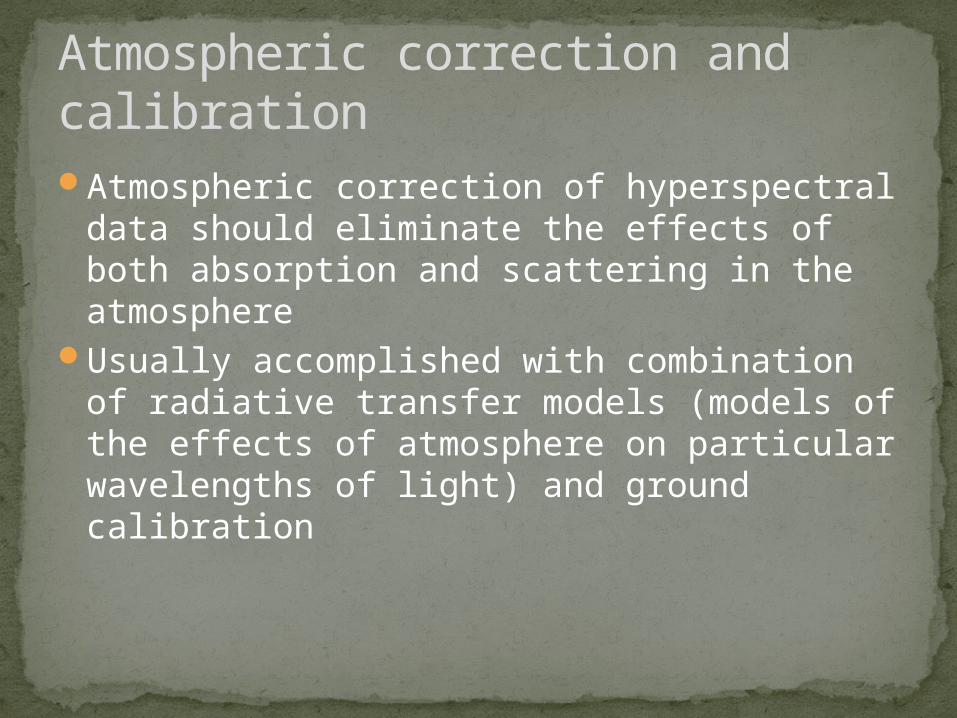
Atmospheric correction of hyperspectral data should eliminate the effects of both absorption and scattering in the atmosphere
Usually accomplished with combination of radiative transfer models (models of the effects of atmosphere on particular wavelengths of light) and ground calibration
Atmospheric correction and calibration
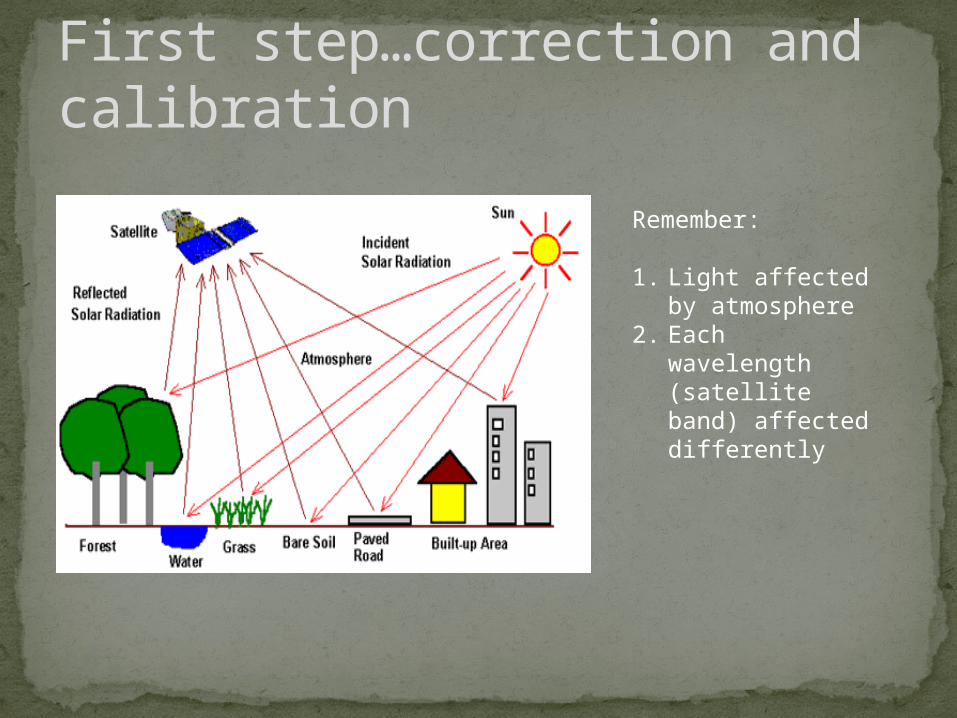
First step…correction and calibration
Remember:
1. Light affected by atmosphere
2. Each wavelength (satellite band) affected differently
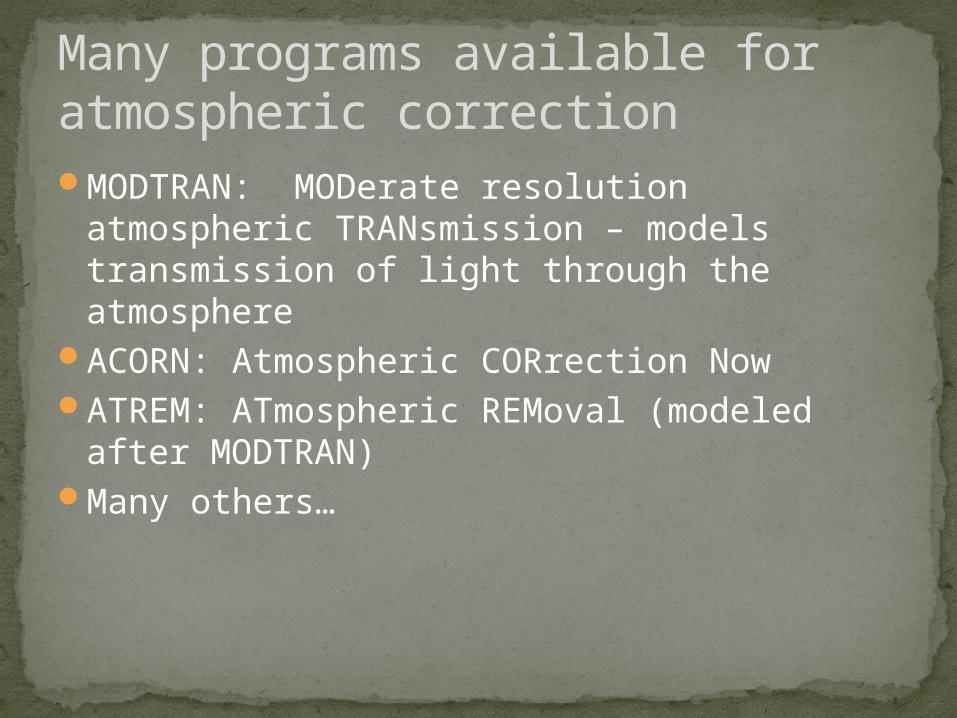
MODTRAN: MODerate resolution atmospheric TRANsmission – models transmission of light through the atmosphere
ACORN: Atmospheric CORrection NowATREM: ATmospheric REMoval (modeled
after MODTRAN)Many others…
Many programs available for atmospheric correction
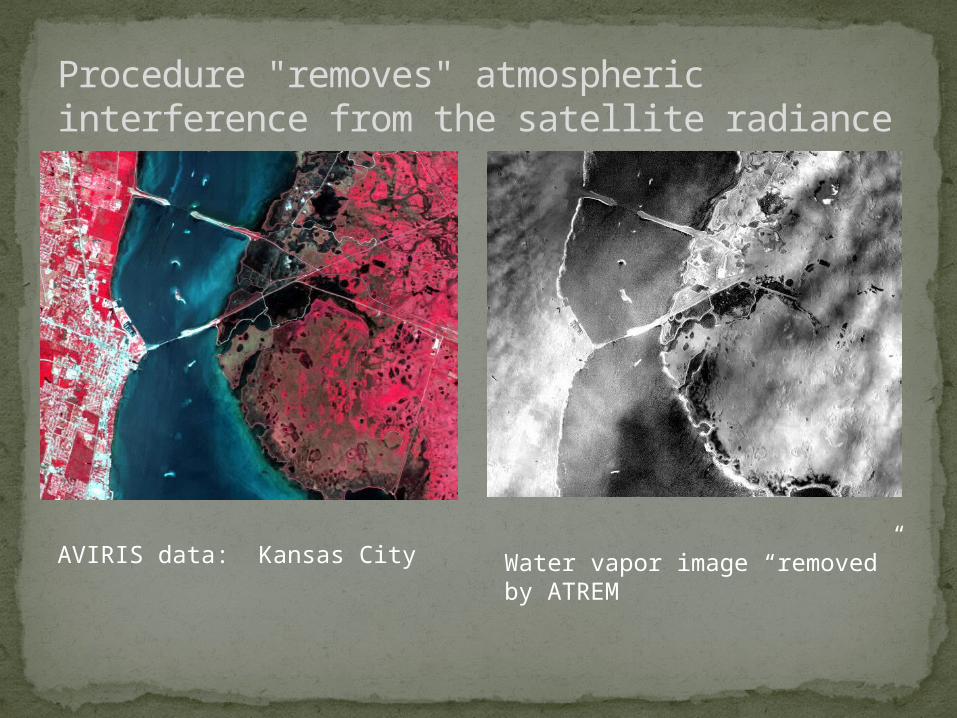
Procedure "removes" atmospheric interference from the satellite radiance
AVIRIS data: Kansas City Water vapor image “removed” by ATREM
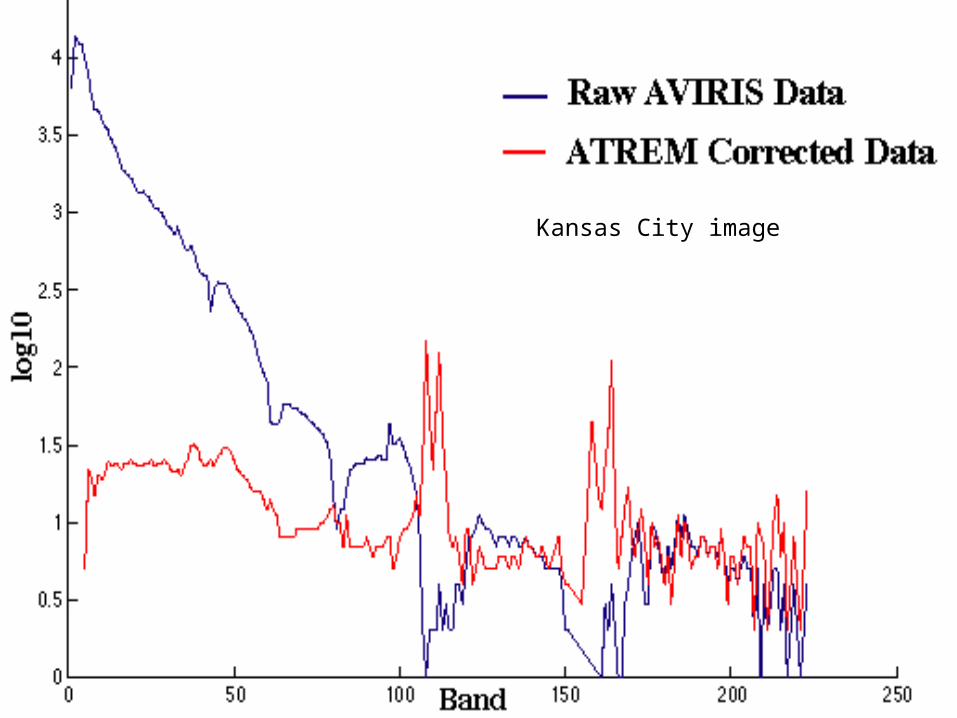
Kansas City image
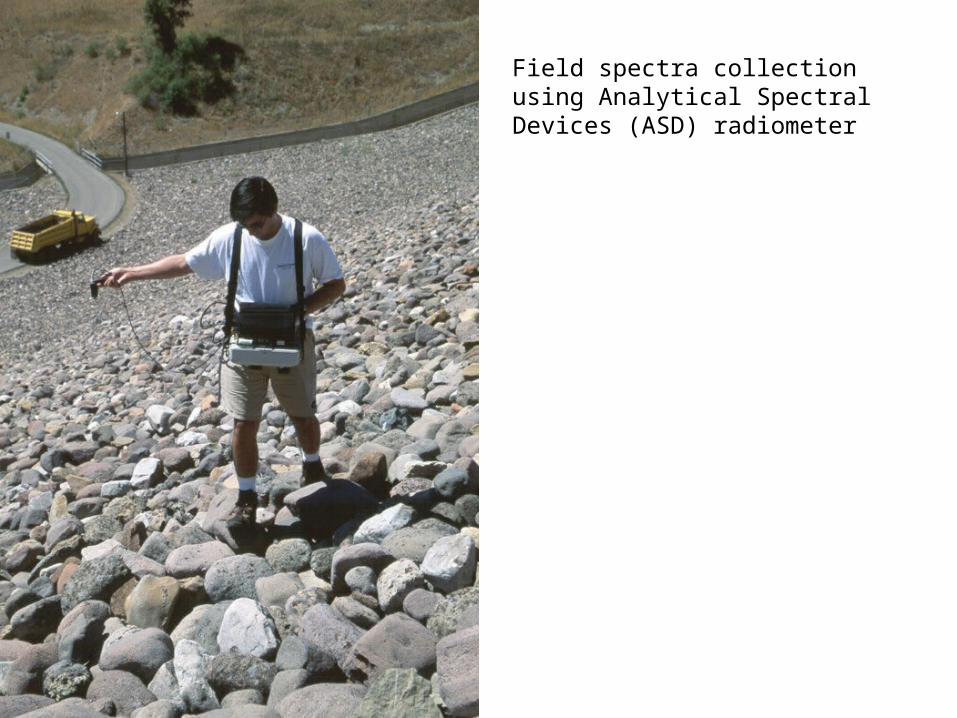
Field spectra collection using Analytical Spectral Devices (ASD) radiometer
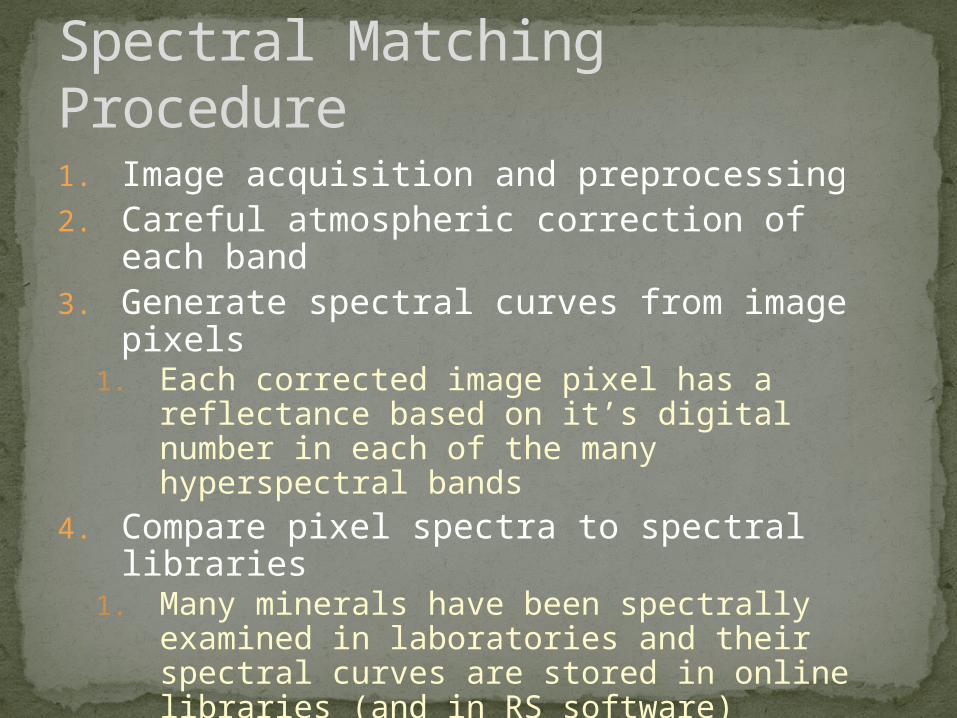
Spectral Matching Procedure1. Image acquisition and preprocessing2. Careful atmospheric correction of each
band3. Generate spectral curves from image pixels
1. Each corrected image pixel has a reflectance based on it’s digital number in each of the many hyperspectral bands
4. Compare pixel spectra to spectral libraries1. Many minerals have been spectrally
examined in laboratories and their spectral curves are stored in online libraries (and in RS software)
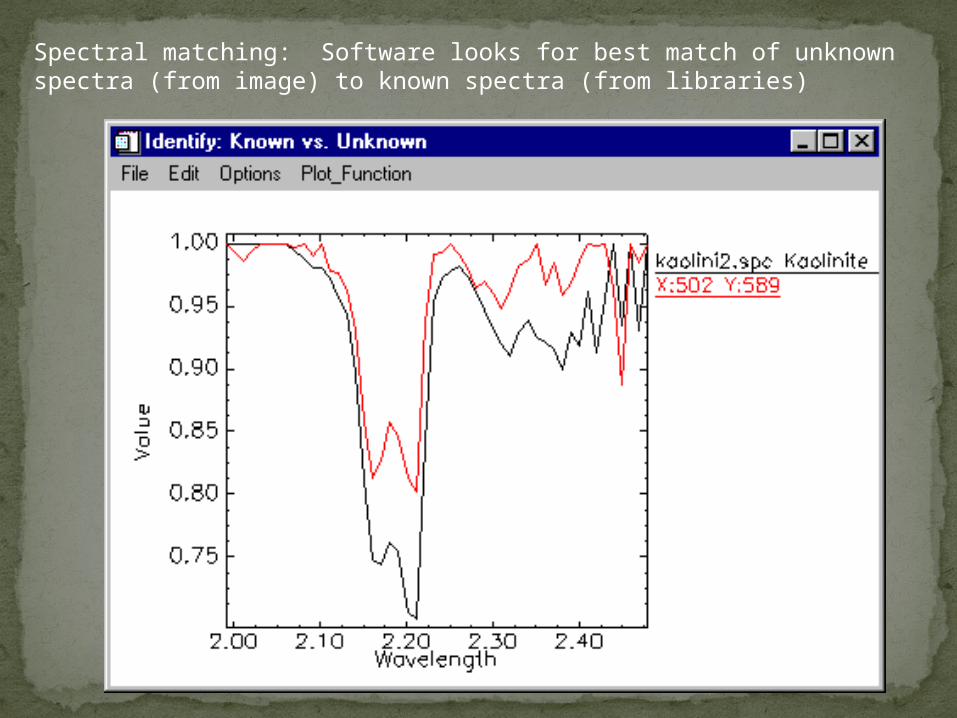
Spectral matching: Software looks for best match of unknown spectra (from image) to known spectra (from libraries)
Spectral data allow exploration geologists to quickly narrow down search areas and eliminate unproductive ground work
Geologists can map large structures, diagnostic mineralogy and lithology, and outcrop locations quickly with a satellite image
Mineral clues can point geologists to areas that might be associated with gold, silver, copper and other metal-bearing minerals
Petroleum is usually more deeply buried and requires structural analysis but often there are surface clues
Mineral and petroleum exploration
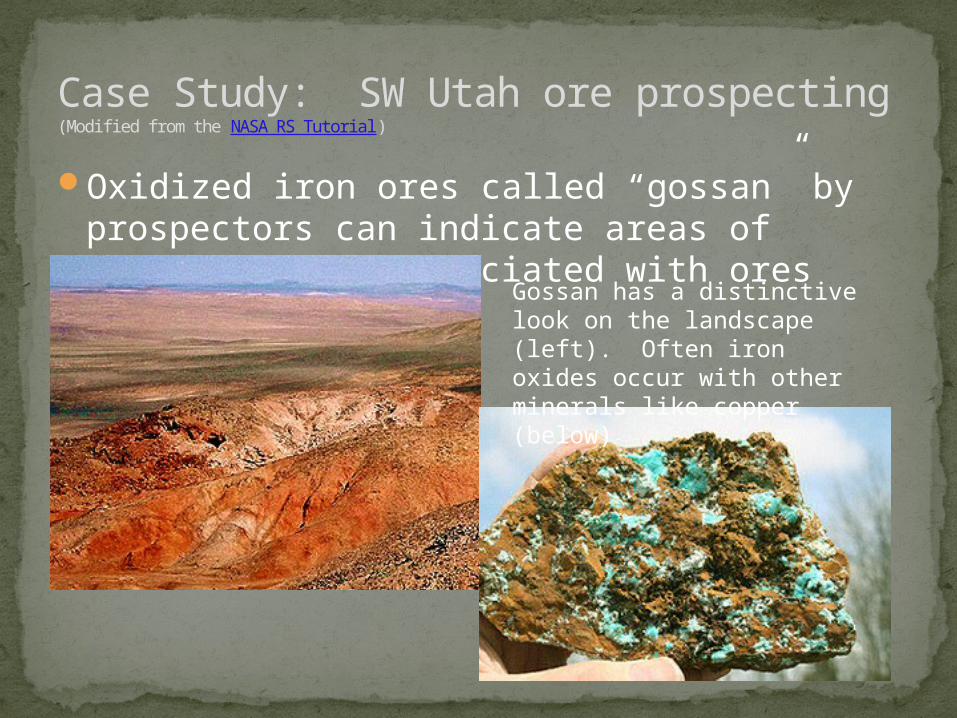
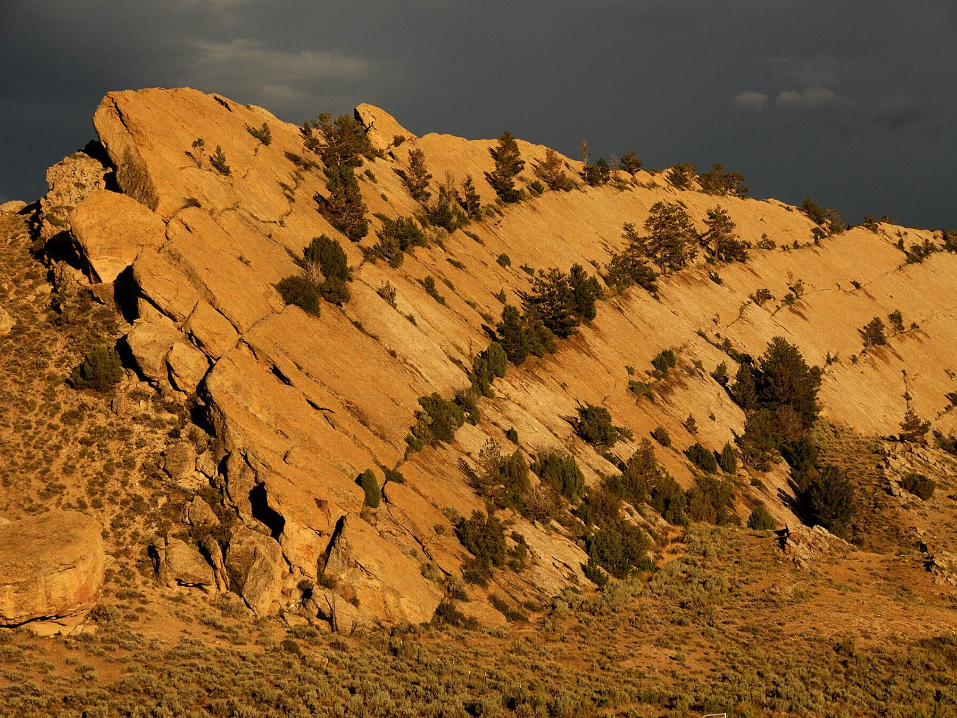
Oxidized iron ores called “gossan” by prospectors can indicate areas of mineralization associated with ores
Case Study: SW Utah ore prospecting(Modified from the NASA RS Tutorial)
Gossan has a distinctive look on the landscape (left). Often iron oxides occur with other minerals like copper (below)
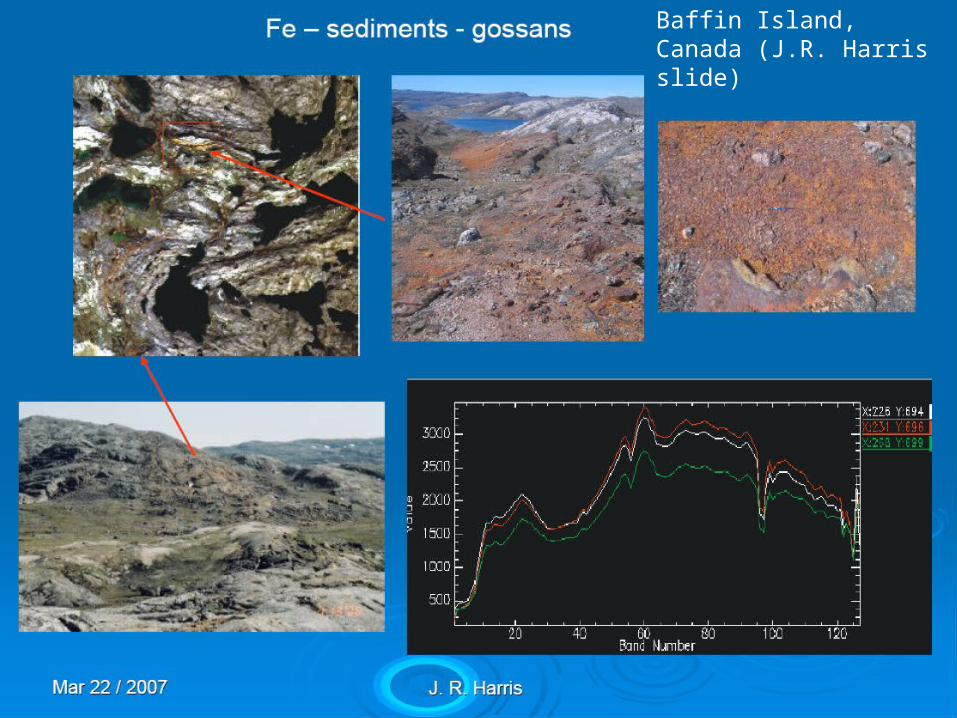
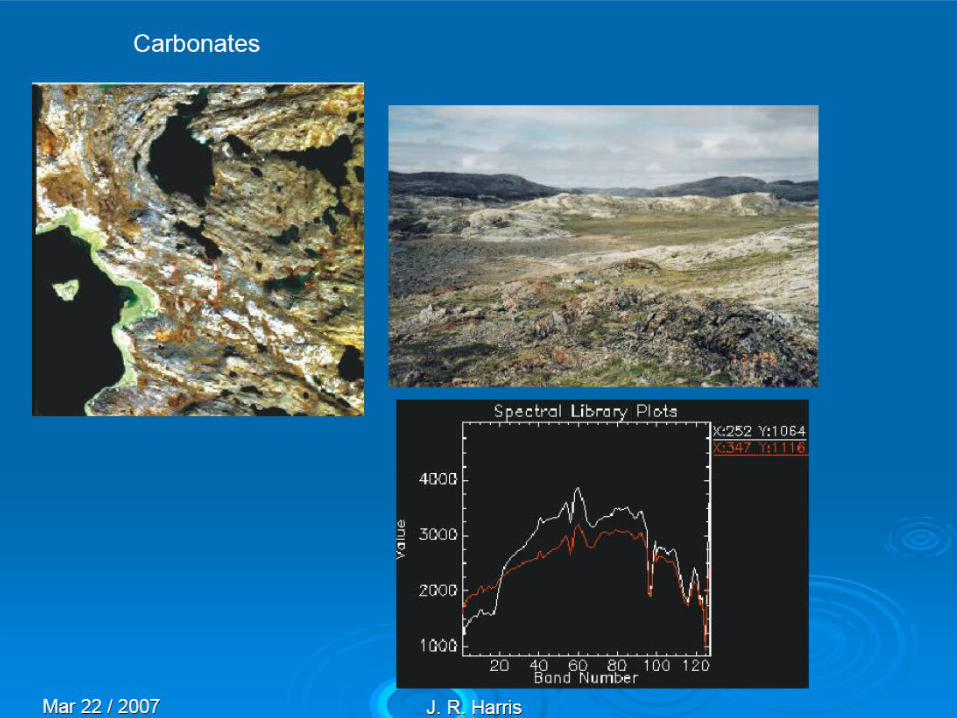
Baffin Island, Canada (J.R. Harris slide)
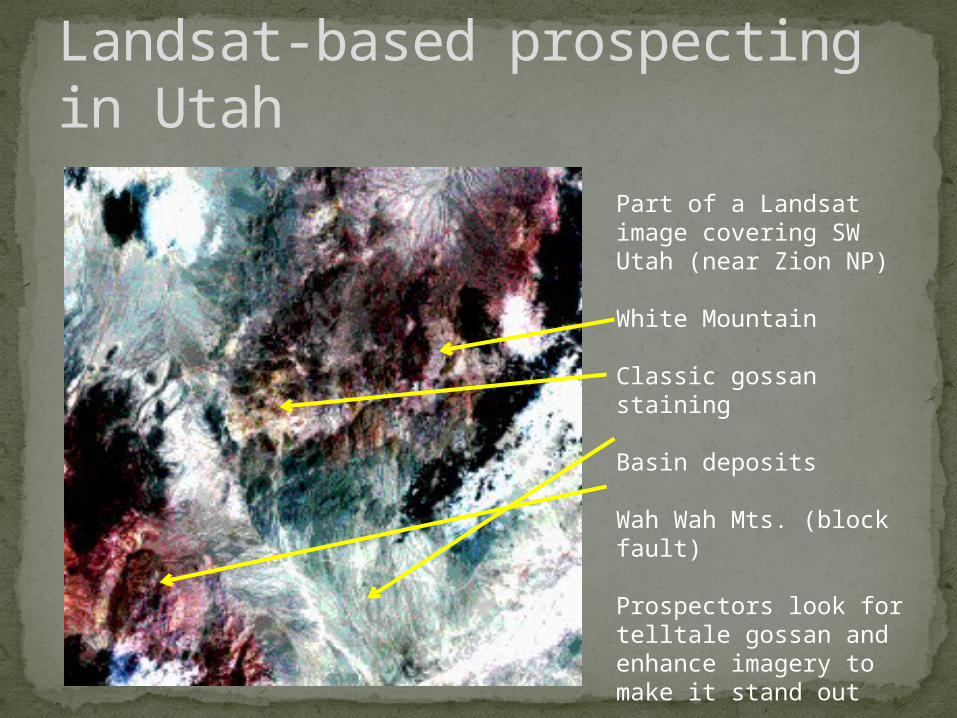
Landsat-based prospecting in Utah
Part of a Landsat image covering SW Utah (near Zion NP)
White Mountain
Classic gossan staining
Basin deposits
Wah Wah Mts. (block fault)
Prospectors look for telltale gossan and enhance imagery to make it stand out
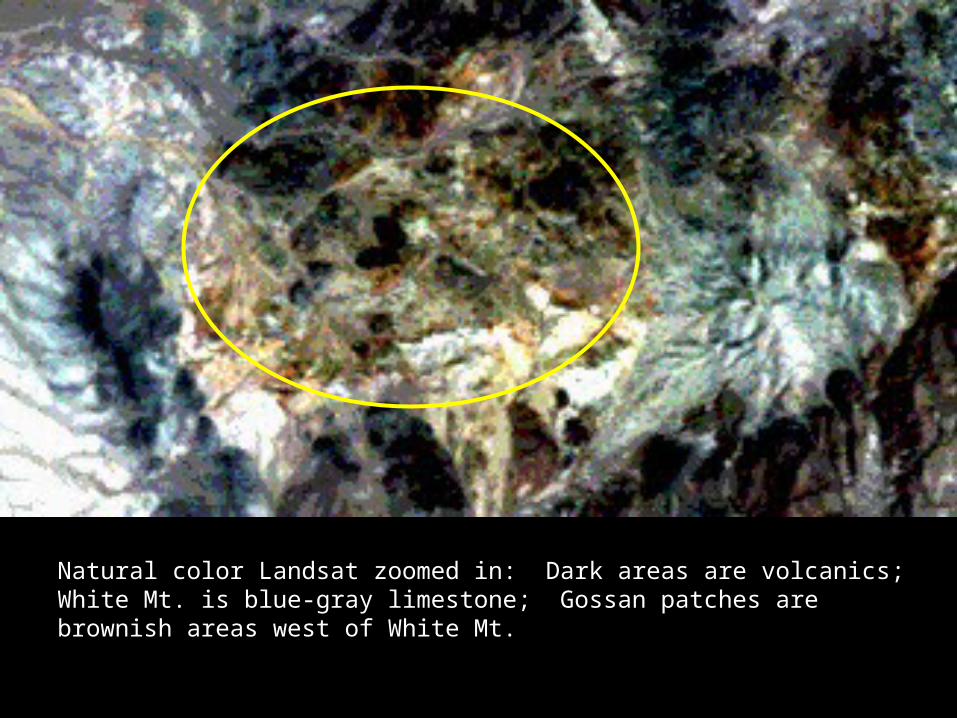
Natural color Landsat zoomed in: Dark areas are volcanics; White Mt. is blue-gray limestone; Gossan patches are brownish areas west of White Mt.
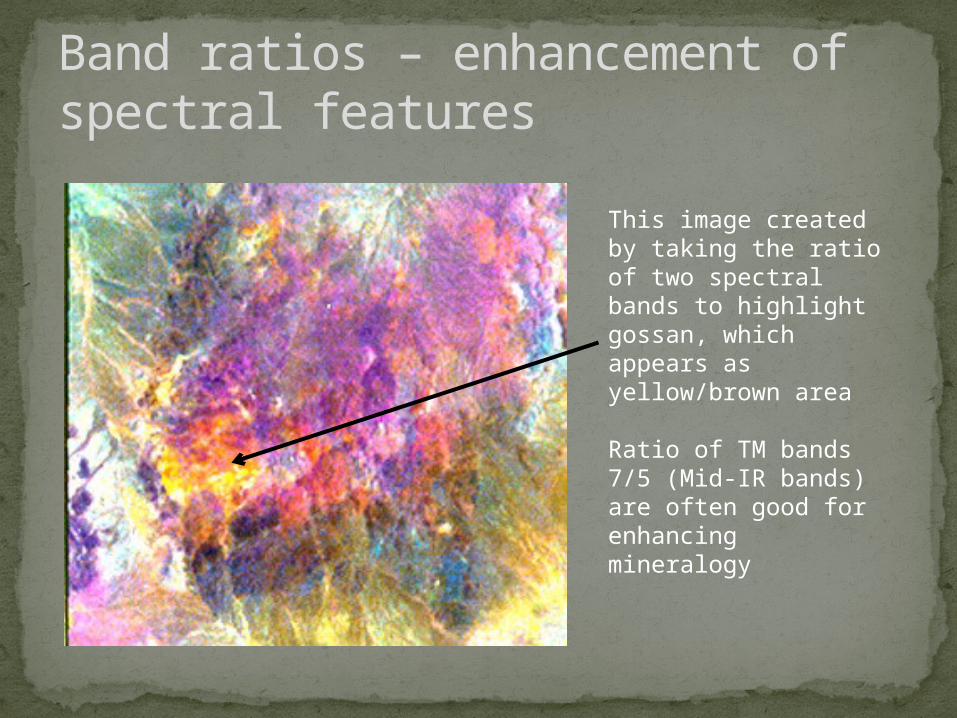
Band ratios – enhancement of spectral features
This image created by taking the ratio of two spectral bands to highlight gossan, which appears as yellow/brown area
Ratio of TM bands 7/5 (Mid-IR bands) are often good for enhancing mineralogy
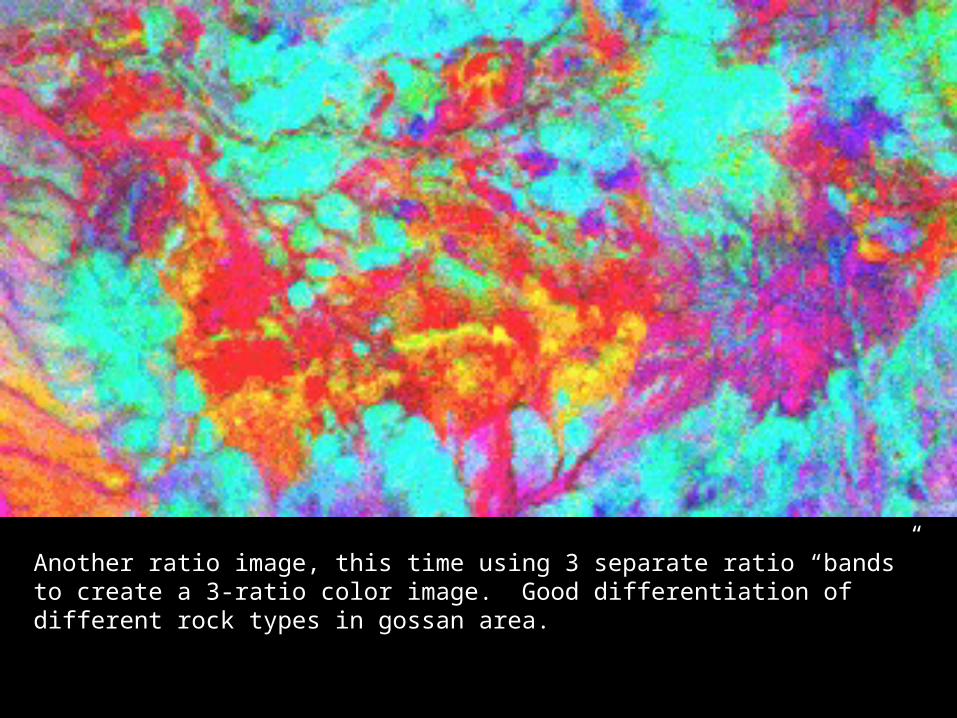
Another ratio image, this time using 3 separate ratio “bands” to create a 3-ratio color image. Good differentiation of different rock types in gossan area.
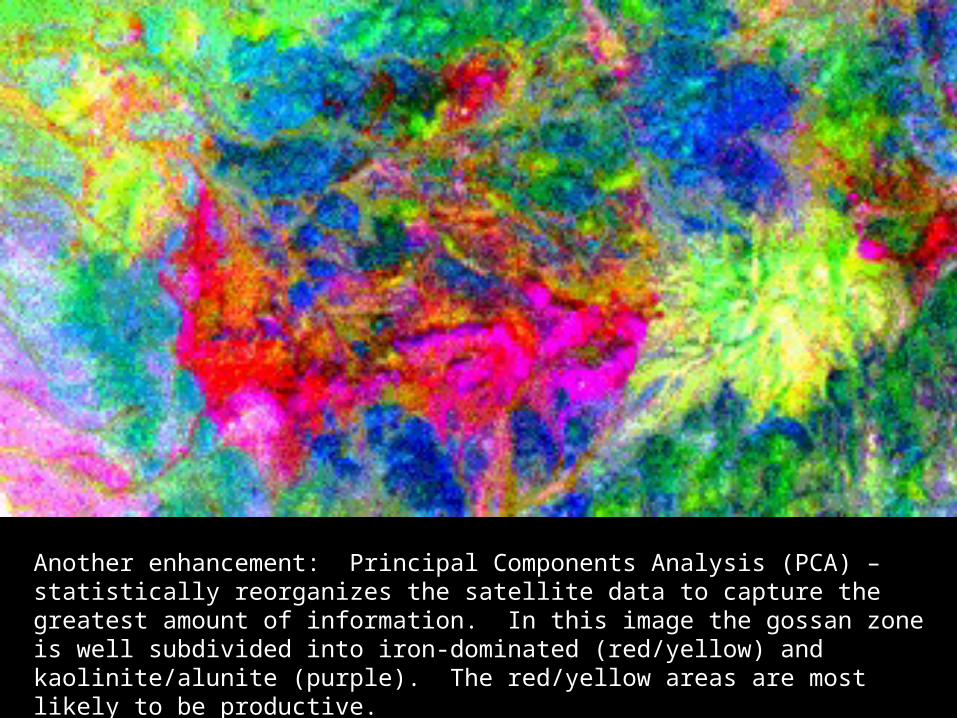
Another enhancement: Principal Components Analysis (PCA) – statistically reorganizes the satellite data to capture the greatest amount of information. In this image the gossan zone is well subdivided into iron-dominated (red/yellow) and kaolinite/alunite (purple). The red/yellow areas are most likely to be productive.
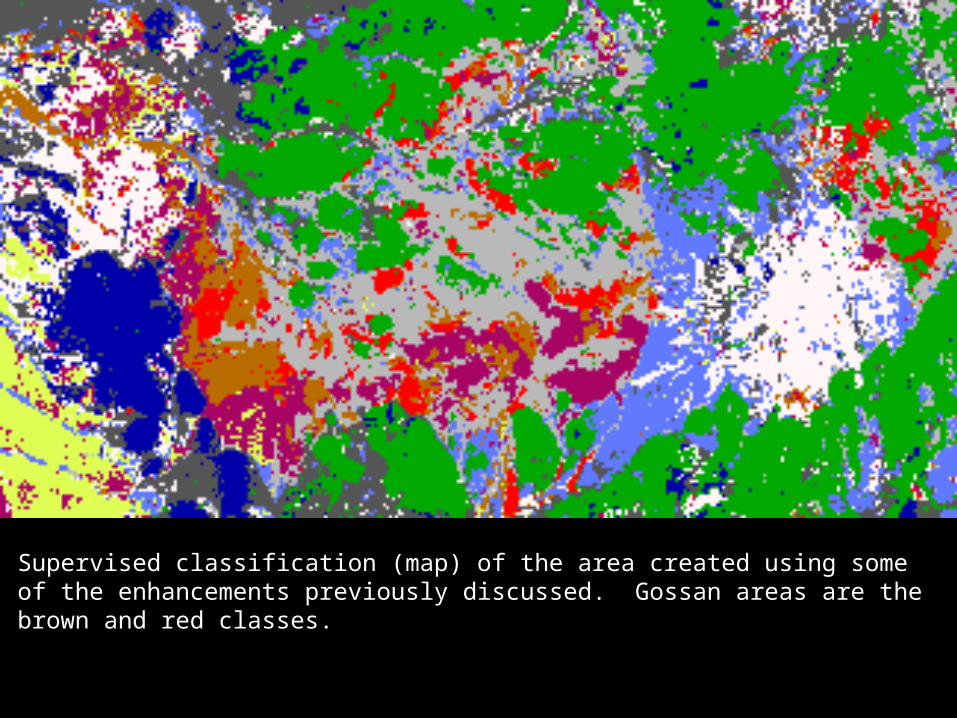
Supervised classification (map) of the area created using some of the enhancements previously discussed. Gossan areas are the brown and red classes.
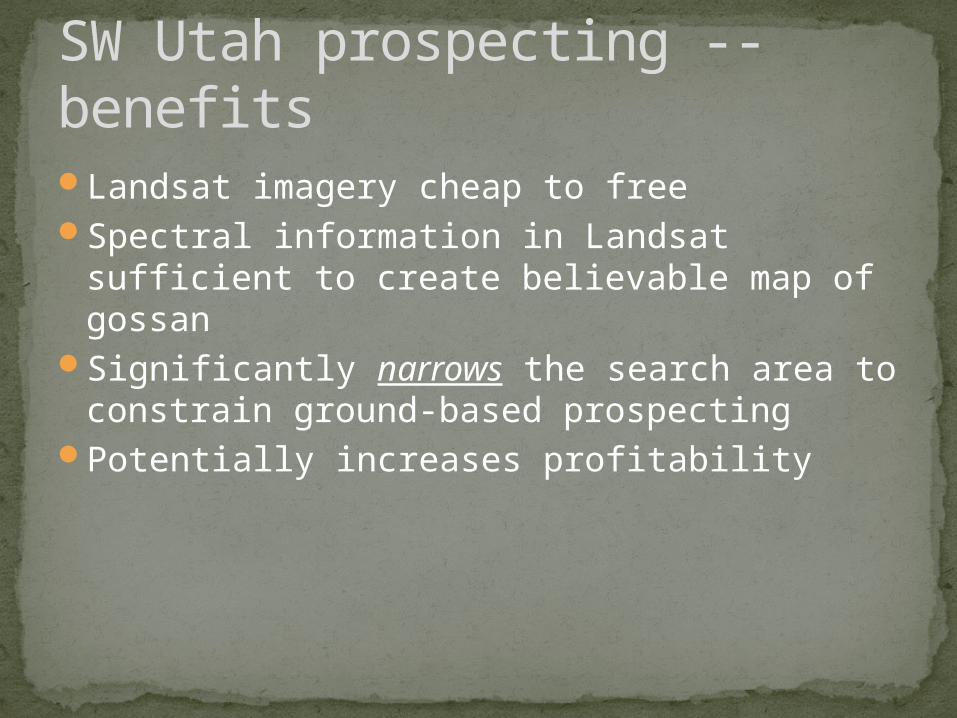
Landsat imagery cheap to freeSpectral information in Landsat sufficient to
create believable map of gossan Significantly narrows the search area to
constrain ground-based prospectingPotentially increases profitability
SW Utah prospecting -- benefits
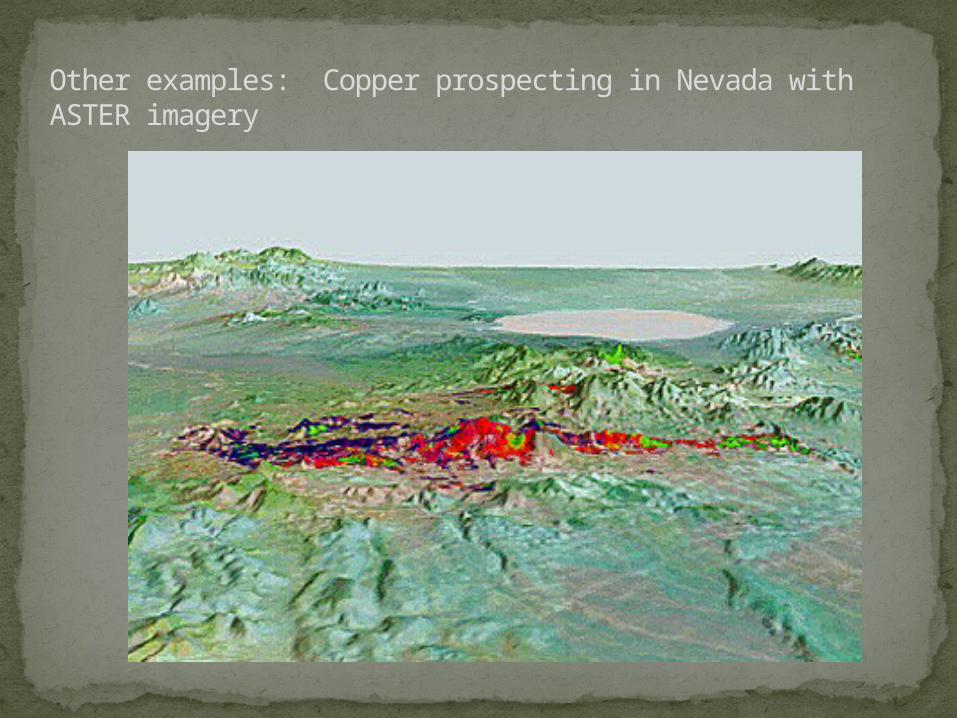
Other examples: Copper prospecting in Nevada with ASTER imagery
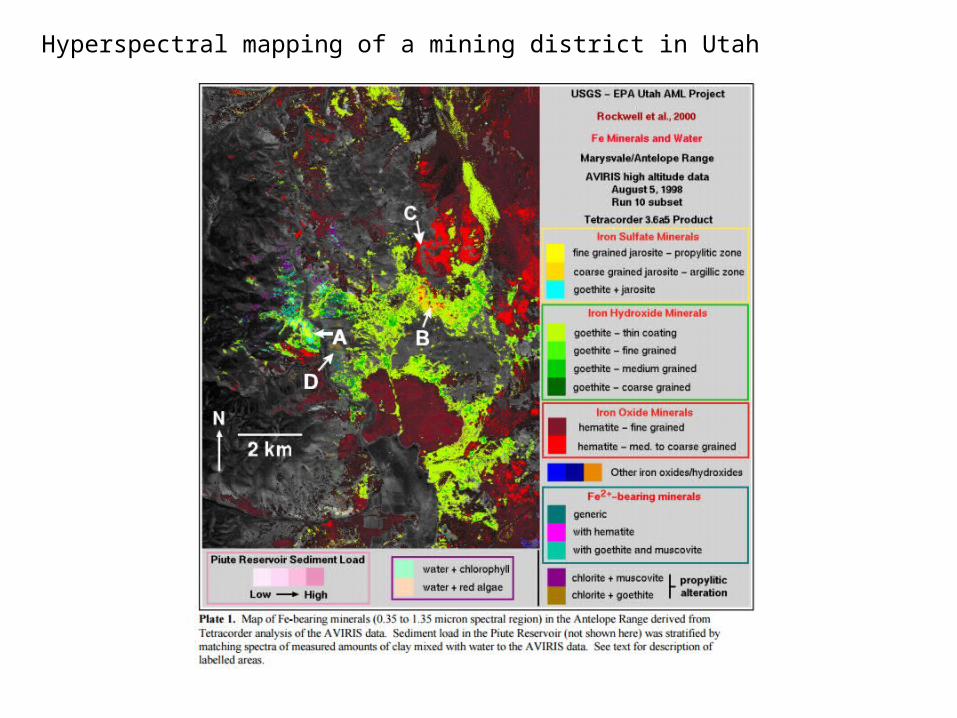
Hyperspectral mapping of a mining district in Utah
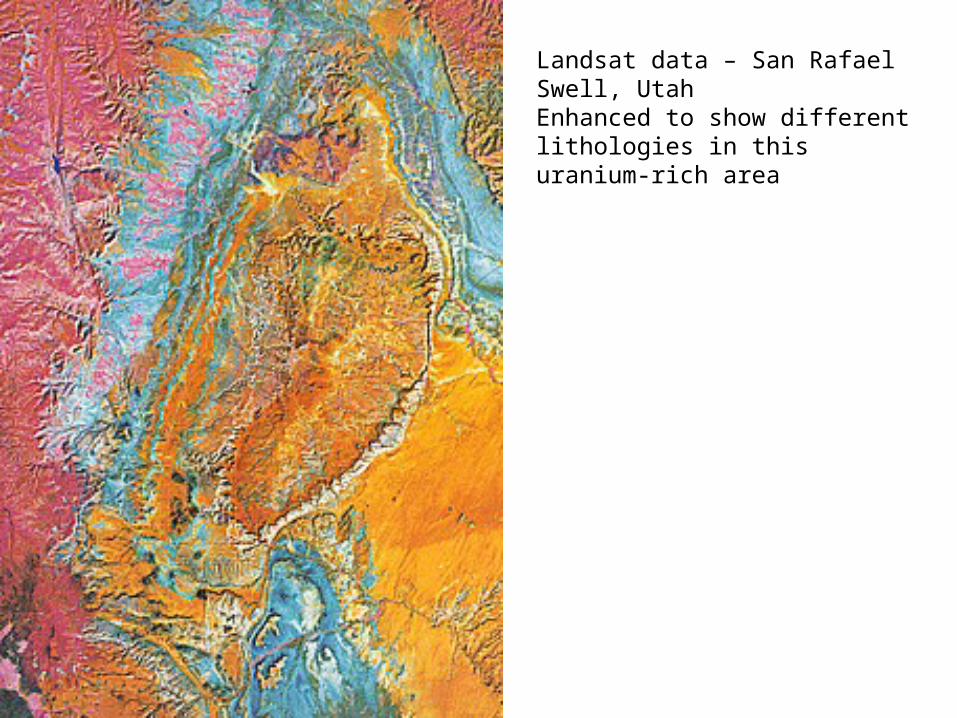
Landsat data – San Rafael Swell, UtahEnhanced to show different lithologies in this uranium-rich area
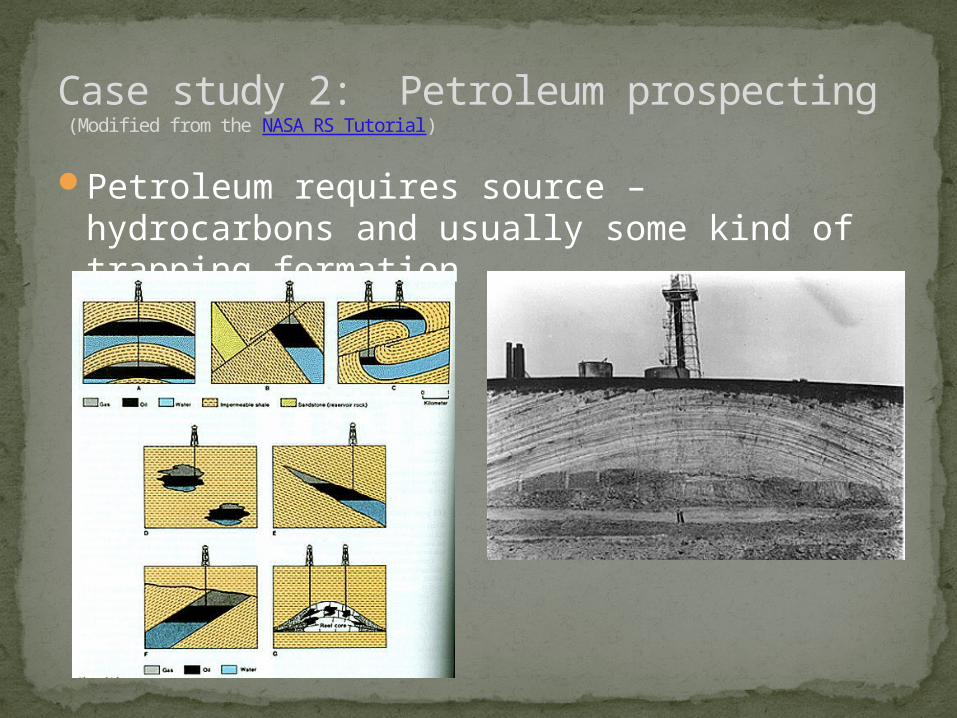
Petroleum requires source – hydrocarbons and usually some kind of trapping formation
Case study 2: Petroleum prospecting (Modified from the NASA RS Tutorial)
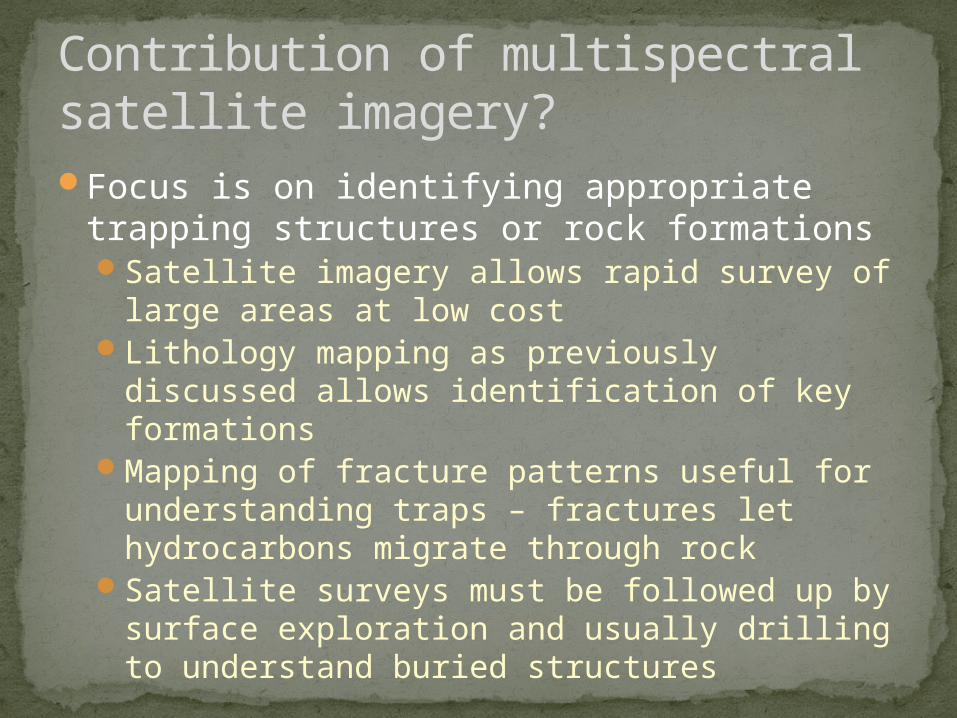
Focus is on identifying appropriate trapping structures or rock formationsSatellite imagery allows rapid survey of large
areas at low costLithology mapping as previously discussed
allows identification of key formationsMapping of fracture patterns useful for
understanding traps – fractures let hydrocarbons migrate through rock
Satellite surveys must be followed up by surface exploration and usually drilling to understand buried structures
Contribution of multispectral satellite imagery?
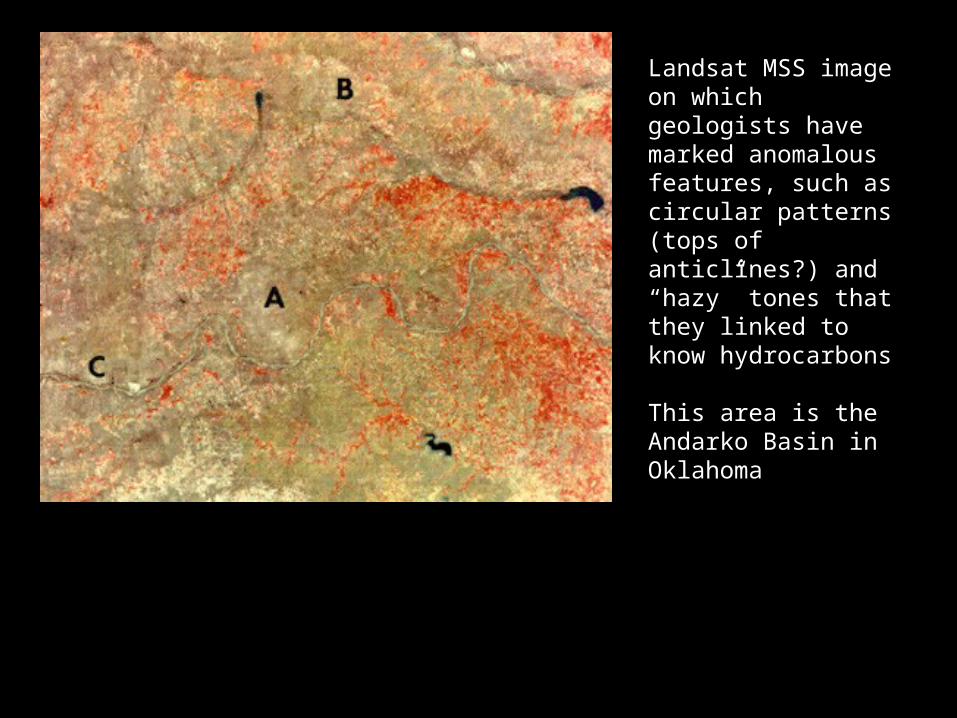
Landsat MSS image on which geologists have marked anomalous features, such as circular patterns (tops of anticlines?) and “hazy” tones that they linked to know hydrocarbons
This area is the Andarko Basin in Oklahoma
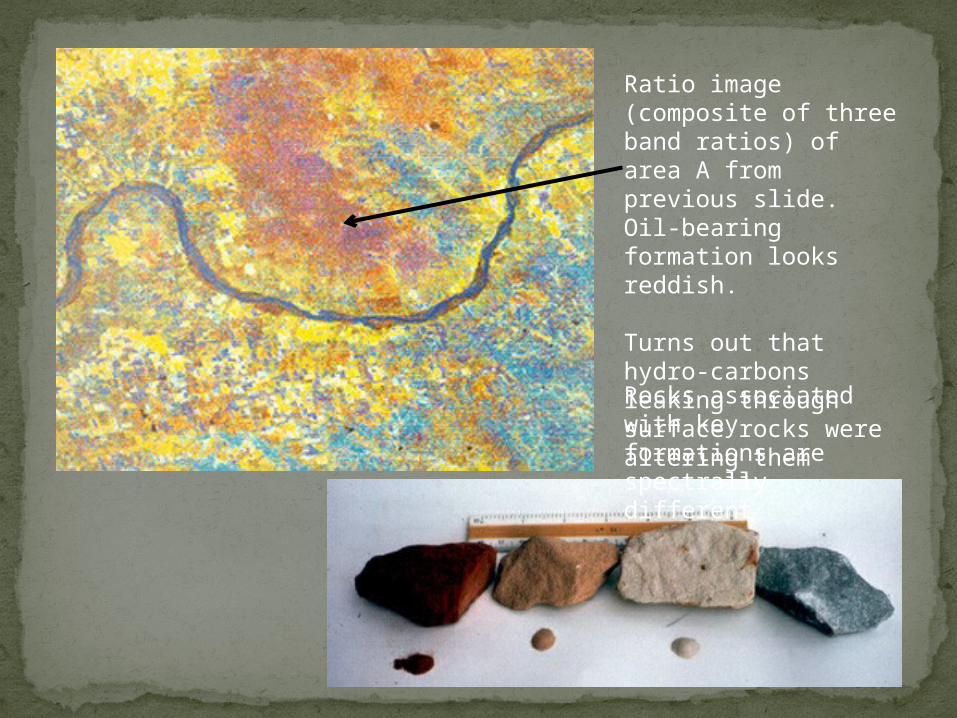
Ratio image (composite of three band ratios) of area A from previous slide. Oil-bearing formation looks reddish.
Turns out that hydro-carbons leaking through surface rocks were altering them spectrally Rocks associated with key formations are spectrally different
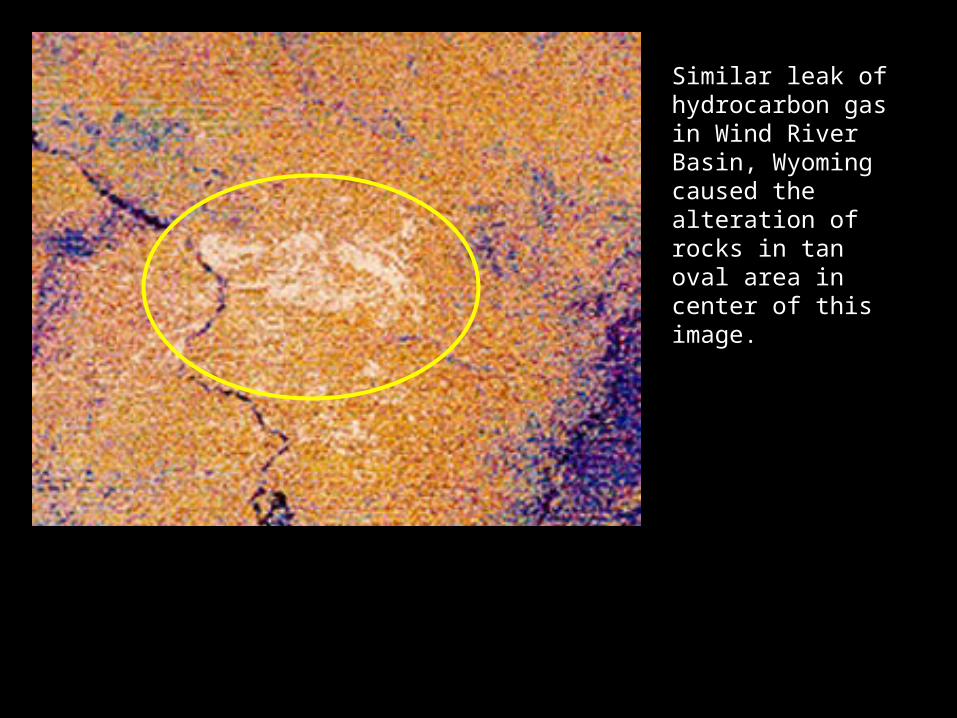
Similar leak of hydrocarbon gas in Wind River Basin, Wyoming caused the alteration of rocks in tan oval area in center of this image.
Geologists and remote sensing scientists in Michigan have found stressed vegetation in vicinity of hydrocarbon gas leaksShows up in the “red edge” of the vegetation
spectral curveEven without leaks, vegetation can be
associated with particular formations or it can follow structural features and fractures
Vegetation effects
Satellite data advantages for geologic studies include:Ability to survey large areas quicklySpectral resolution for mineral discriminationSpectral enhancement for broad scale mapping
Geologic work almost always requires follow-up on ground and/or exploration of the subsurface geology
Multispectral imagery like Landsat is good for quick assessments
Hyperspectral imagery allows fine discrimination of minerals but is more labor intensive to process
Summary


