Section 8 Geomorphic Evaluation 8-1 Section 8 Geomorphic Evaluation 8.1 Fundamentals of Fluvial Geomorphology Fluvial geomorphology is the science of how moving water shapes the land. It is the fundamental discipline of river science and allows the quantitative description stream behavior now and reasonable predictions of future behavior under specified conditions. Fluvial geomorphology and the related disciplines of hydrology and hydraulic engineering, geology and soil science together provide the technical underpinnings for sound watershed management. Following is a brief overview of geomorphic principles with emphasis on their application to stream and watershed management. 8.1.1 Major Models Streams exist in a state of dynamic equilibrium in which the forces driving channel form are balanced by the resisting forces. The driving force is gravity and acts on the stream as the rate at which water and sediment move through a stream while the resisting forces are the strength of the channel boundary materials and friction expressed as the channel shape. When the driving forces exceed the resisting forces, the stress applied by water or sediment exceeds the channel strength. The stream channel responds by altering its shape in plan, profile and cross-section to accommodate the change in flow volume and applied shear. Once disturbed, the processes by which streams respond are: 1) incision or degradation, 2) widening, 3) aggradation or deposition and 4) plan form adjustments. Through these processes, streams eventually re-establish equilibrium. Determining which process is dominant and the likely progression of stream processes is one of the principle challenges of stream management. Gravity and friction are first principles and drivers of channel form at the most fundamental levels. Stream managers grapple with their many manifestations including sediment source, sizes and abundance, varying hydrologic conditions, vegetative influences and a broad range of geological influences. Given the large number of independent variables and the complex relationships between the many dependent variables, it is reasonable to seek robust, relatively straightforward models that organize these variables. In disturbed systems such as Little Salt Creek, the chosen approach evaluates each channel process separately then develops an integrated assessment using energy relationships. Although there are three commonly recognized approaches to stream design, each with advantages and limitations (Skidmore et al. 2001), the two simplest approaches, often called analog and empirical methods, explicitly assume equilibrium conditions regarding hydrology and sediment transport. Because Little Salt Creek is not in an equilibrium condition, as discussed in more detail in Section 8.3.1 Existing Channel Process, the analytical approach is used.
Transcript
Section 8 Geomorphic Evaluation
8-1
Section 8 Geomorphic Evaluation 8.1 Fundamentals of Fluvial Geomorphology Fluvial geomorphology is the science of how moving water shapes the land. It is the fundamental discipline of river science and allows the quantitative description stream behavior now and reasonable predictions of future behavior under specified conditions. Fluvial geomorphology and the related disciplines of hydrology and hydraulic engineering, geology and soil science together provide the technical underpinnings for sound watershed management. Following is a brief overview of geomorphic principles with emphasis on their application to stream and watershed management. 8.1.1 Major ModelsStreams exist in a state of dynamic equilibrium in which the forces driving channel form are balanced by the resisting forces. The driving force is gravity and acts on the stream as the rate at which water and sediment move through a stream while the resisting forces are the strength of the channel boundary materials and friction expressed as the channel shape. When the driving forces exceed the resisting forces, the stress applied by water or sediment exceeds the channel strength. The stream channel responds by altering its shape in plan, profile and cross-section to accommodate the change in flow volume and applied shear. Once disturbed, the processes by which streams respond are: 1) incision or degradation, 2) widening, 3) aggradation or deposition and 4) plan form adjustments. Through these processes, streams eventually re-establish equilibrium. Determining which process is dominant and the likely progression of stream processes is one of the principle challenges of stream management. Gravity and friction are first principles and drivers of channel form at the most fundamental levels. Stream managers grapple with their many manifestations including sediment source, sizes and abundance, varying hydrologic conditions, vegetative influences and a broad range of geological influences. Given the large number of independent variables and the complex relationships between the many dependent variables, it is reasonable to seek robust, relatively straightforward models that organize these variables. In disturbed systems such as Little Salt Creek, the chosen approach evaluates each channel process separately then develops an integrated assessment using energy relationships.
Although there are three commonly recognized approaches to stream design, each with advantages and limitations (Skidmore et al. 2001), the two simplest approaches, often called analog and empirical methods, explicitly assume equilibrium conditions regarding hydrology and sediment transport. Because Little Salt Creek is not in an equilibrium condition, as discussed in more detail in Section 8.3.1 Existing Channel Process, the analytical approach is used.
Section 8 Geomorphic Evaluation
8-2
Lane’s Relationship In 1955, E.W. Lane expressed the relationships between the driving and resisting forces for channel change in the following simple proportionality. The expression is also illustrating in Figure 8-1.
QS D50 � S QW
Where QS � Rate of sediment flow D50 � Median size of mobile particles S � Slope of the channel bed QW � Rate of water flow
Figure 8-1: Lane’s Stable Channel Balance Here the D50 stands as proxy for boundary strength and S for channel shape. From this relationship, it is clear that a change in any of these parameters will, once a threshold is exceeded, induce a change in one or more of the others. The familiar increase in Qw associated with urban development illustrates this point well. The response to this increase is some combination of the following: a decrease in channel bed slope (incision), an increase in sediment load (increased erosion) and an increase in the median size of mobile particles.
� Initial change: QW �; response: QS�. Often the bed slope remains relatively unchanged at first, so to maintain the proportionality, Qs increases. The increase in sediment load is generated by down cutting of the channel bed (incision), scour of the stream banks or both. The incision locally steepens the channel slope, compounding the driving force for more erosion. This local steepening of bed slope is called a knickpoint. Knickpoints migrate upstream liberating sediment as they progress. When the stream banks exceed their critical height, mass failure ensues. This reconfiguring of the channel geometry continues until the equilibrium described by Lane is re-established.
Section 8 Geomorphic Evaluation
8-3
� Initial change: QW �; response: D50 �. This condition occurs when there is little sediment initially available in the bed or banks. So, to maintain Lane’s proportionality, the size of the median mobile particles increases. Under this condition, rock armor that previously protected a structure becomes mobile as the D50 increases. Subsequently, the service life of the infrastructure declines. Moreover, the natural bed armoring aggregate, previously mobile only during less frequent floods, becomes mobile during more frequent events and the underlying, more erosion-prone bed and bank materials are exposed to greater and more frequent erosive force.
� Initial change: QW �; response: S �. If the channel bed is relatively resistant to
incision, the stream may respond to increased flows by decreasing its slope. The stream accomplishes this decrease in slope by meandering or increasing the channel length over the same change in elevation. The downstream progression of point bars (crescent-shaped sediment deposited on the inside bank of stream bends) opposite the downstream progression of eroding and failing cut banks (steeper outside banks of stream bends) are classic signs of meandering.
� Initial change: S �; response: QS �. Increasing channel slope is often accomplished
through channel straightening to achieve greater flood conveyance or to optimize land development. This increase in slope causes an increase in sediment load, in mobile D50 size or both. Bed and banks erode to generate the sediment that deposits downstream where channel slopes are flatter. The effective change in water surface slope may extend upstream well beyond the actual channel straightening, extending the accelerated erosion. The sediment eroded from upstream of the channelization and deposited downstream counteracts the effect of the channelization and improvements in flood conveyance are often less than anticipated.
Lane’s Relationship is useful for broad conceptual understanding of stream behavior. The following models more specifically address stream process. Channel Evolution – Evaluating Channel Changes in Cross-Section
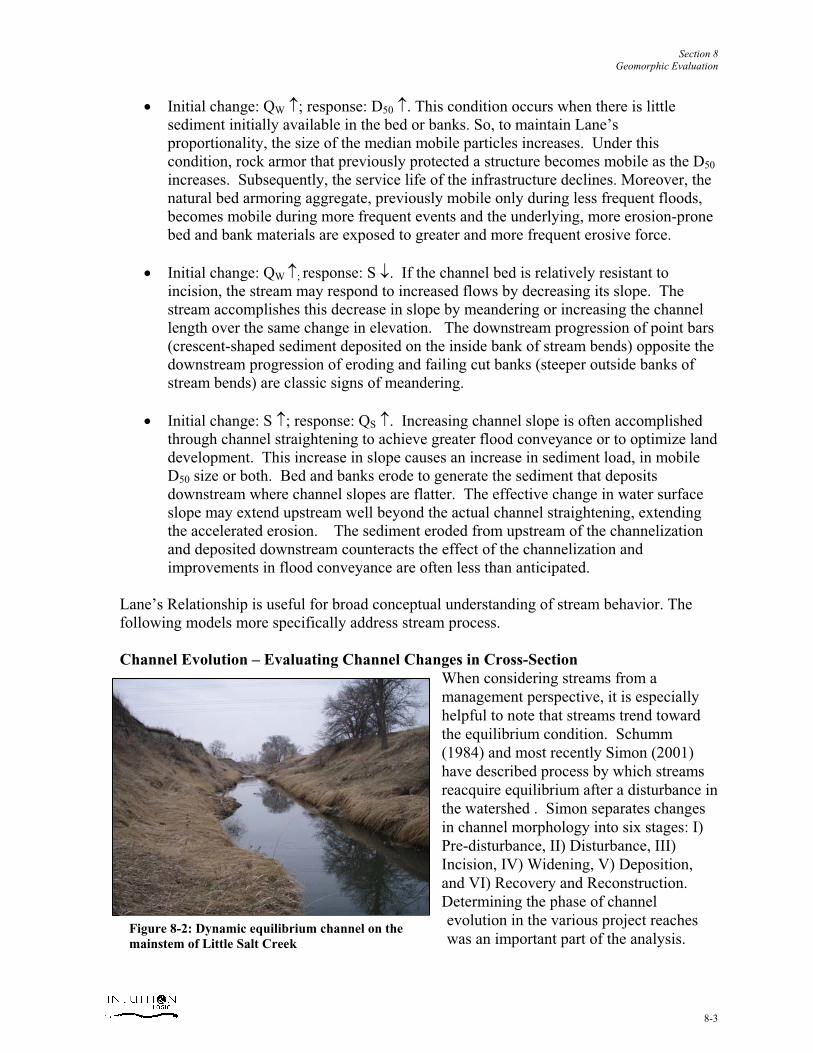
When considering streams from a management perspective, it is especially helpful to note that streams trend toward the equilibrium condition. Schumm (1984) and most recently Simon (2001) have described process by which streams reacquire equilibrium after a disturbance in the watershed . Simon separates changes in channel morphology into six stages: I) Pre-disturbance, II) Disturbance, III) Incision, IV) Widening, V) Deposition, and VI) Recovery and Reconstruction. Determining the phase of channel evolution in the various project reaches was an important part of the analysis.
Figure 8-2: Dynamic equilibrium channel on the mainstem of Little Salt Creek
Section 8 Geomorphic Evaluation
8-4
At Stage I, the channel is stable and transports the water and sediment delivered to it without significant adjustment. Although not a universal feature, internal floodplains are common in stable streams including those in the Central Midwest. Bankfull floodplains occur at the elevation corresponding to the dominant discharge. The dominant discharge is the flow that, over time, accomplishes the most work on the stream channel. In undisturbed streams, the dominant discharge typically occurs every 1.5 to 2 years. The bankfull floodplain performs a valuable function by lowering the bank shear during higher flows and effectively managing the stream energy.
During Stage II, natural or manmade events disturb the channel. In disturbed systems, the dominant discharge often occurs far more frequently and may not support the development of internal floodplains. Common forms of manipulation include increases in the rate, volume or
timing of flow or direct alteration of channel dimensions or alignment.
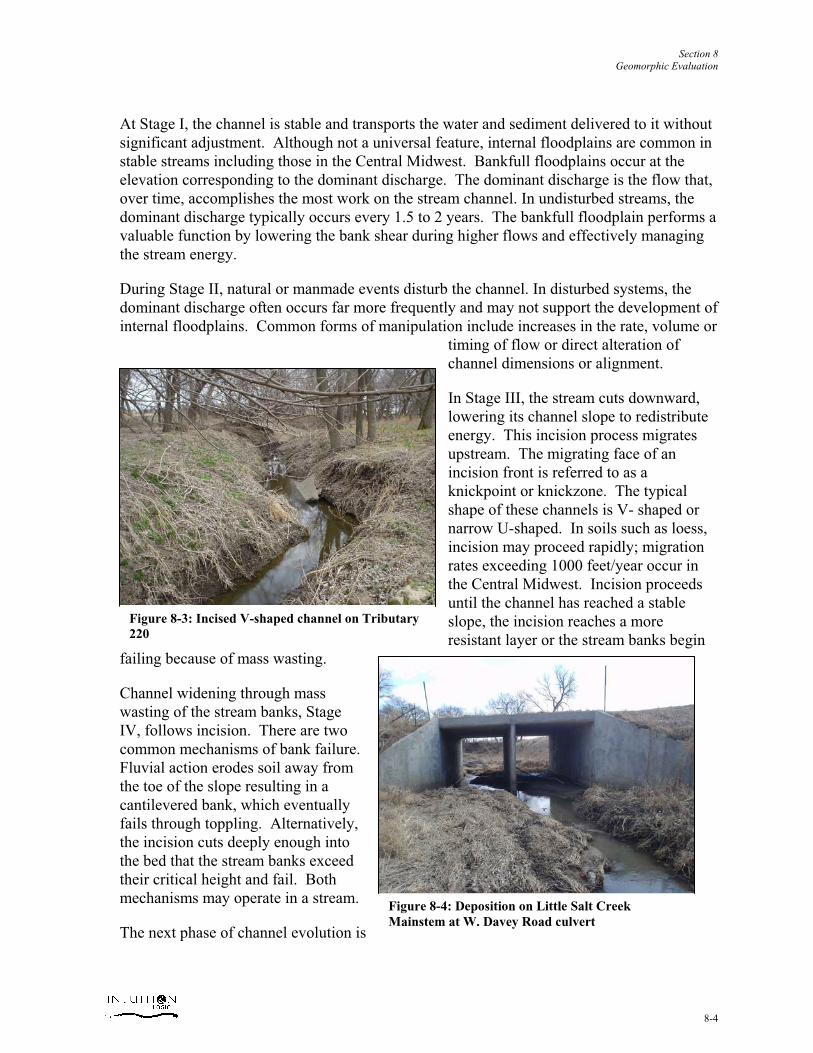
In Stage III, the stream cuts downward, lowering its channel slope to redistribute energy. This incision process migrates upstream. The migrating face of an incision front is referred to as a knickpoint or knickzone. The typical shape of these channels is V- shaped or narrow U-shaped. In soils such as loess, incision may proceed rapidly; migration rates exceeding 1000 feet/year occur in the Central Midwest. Incision proceeds until the channel has reached a stable slope, the incision reaches a more resistant layer or the stream banks begin
failing because of mass wasting.
Channel widening through mass wasting of the stream banks, Stage IV, follows incision. There are two common mechanisms of bank failure. Fluvial action erodes soil away from the toe of the slope resulting in a cantilevered bank, which eventually fails through toppling. Alternatively, the incision cuts deeply enough into the bed that the stream banks exceed their critical height and fail. Both mechanisms may operate in a stream.
The next phase of channel evolution is
Figure 8-4: Deposition on Little Salt Creek Mainstem at W. Davey Road culvert
Figure 8-3: Incised V-shaped channel on Tributary 220
Section 8 Geomorphic Evaluation
8-5
Stage V when the channel has sufficiently widened and begun depositing sediment eroded from upstream reaches in the bed. The deposits occur as channel bars and occasionally as internal floodplains.
In Stage VI, the channel regains the equilibrium condition and efficiently transports both water and sediment. If a substantial increase in Qw precipitated the adjustment, final dimensions of the channel will probably be larger than the pre-disturbance condition.
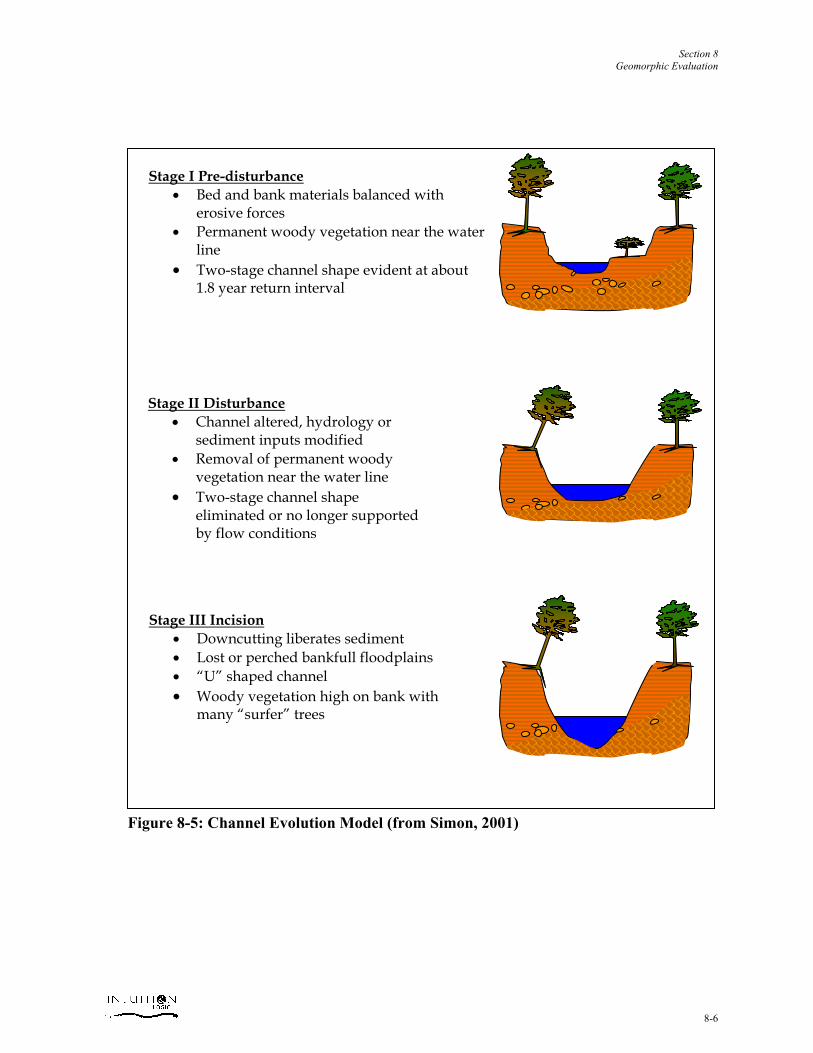
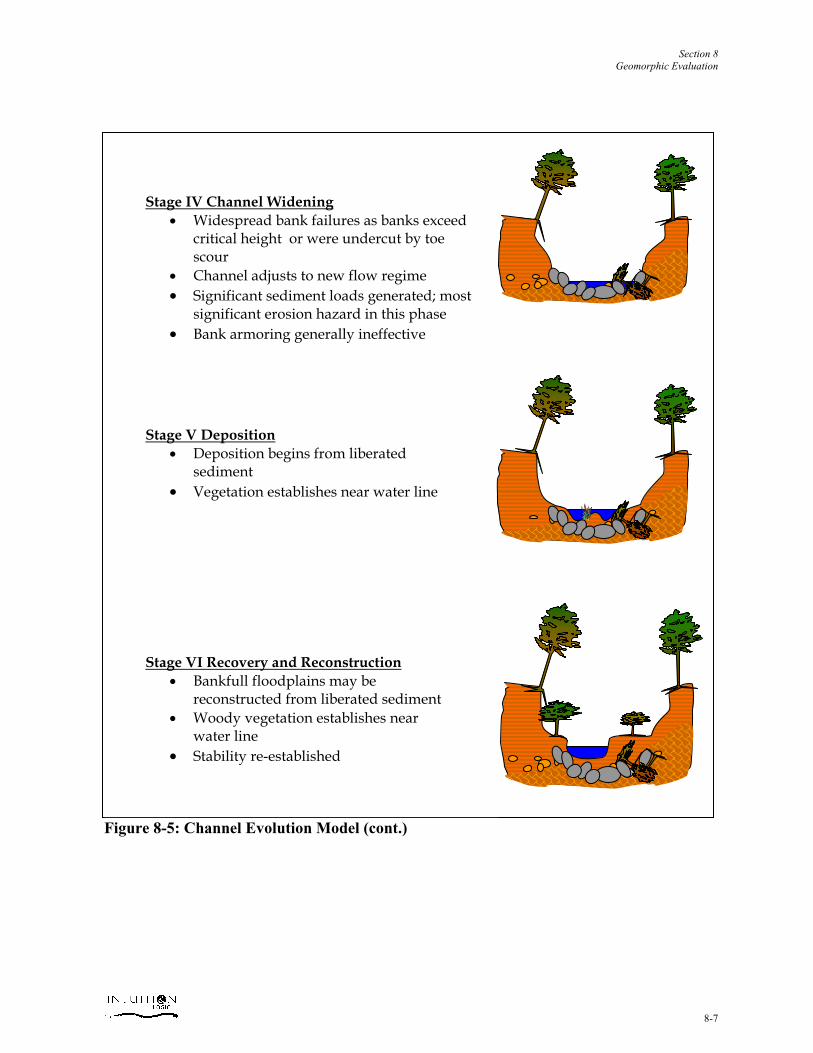
Each of these phases is depicted on Figure 8-5.
Section 8 Geomorphic Evaluation
8-6
Stage I Pre-disturbance � Bed and bank materials balanced with
erosive forces � Permanent woody vegetation near the water
line � Two-stage channel shape evident at about
1.8 year return interval
Stage III Incision � Downcutting liberates sediment � Lost or perched bankfull floodplains � “U” shaped channel � Woody vegetation high on bank with
many “surfer” trees
Stage II Disturbance � Channel altered, hydrology or
sediment inputs modified � Removal of permanent woody
vegetation near the water line � Two-stage channel shape
eliminated or no longer supported by flow conditions
Figure 8-5: Channel Evolution Model (from Simon, 2001)
Section 8 Geomorphic Evaluation
8-7
Stage V Deposition � Deposition begins from liberated
sediment � Vegetation establishes near water line
Stage VI Recovery and Reconstruction � Bankfull floodplains may be
reconstructed from liberated sediment � Woody vegetation establishes near
water line � Stability re-established
Stage IV Channel Widening � Widespread bank failures as banks exceed
critical height or were undercut by toe scour
� Channel adjusts to new flow regime � Significant sediment loads generated; most
significant erosion hazard in this phase � Bank armoring generally ineffective
Figure 8-5: Channel Evolution Model (cont.)
Section 8 Geomorphic Evaluation
8-8
Meander Formation and Migration – Evaluating Channel Change in Plan Form Adjustments in plan form are common and have an important influence on the sustainability of a stormwater system as well as on the safety and service life of near-stream infrastructure. Some plan form adjustments can liberate significant sediment and present major erosion hazards. The management requirements of plan form adjustment differ from those of an incising or widening stream. Consequently, distinguishing between these processes is an important part of the investigation and analysis. Straight stream channels are rare and require a narrow set of circumstances to maintain dynamic equilibrium in a natural setting. Like all other open systems, streams adjust their form to minimize the expenditure of energy. The formation of pool-riffle patterns and meanders are consistent with this trend towards maintaining an equilibrium condition. Meanders are complex in both formation and behavior. Meander formation graphically demonstrates the principle of cause and effect in stream mechanics. The cause is the force applied by moving water and sediment and the effect is the shape of stream channel. To describe the basic process of meander formation, the distinction between the meander flow or discharge centerline and the channel centerline is important. As illustrated in Figure 8-6, the channel centerline (effect) lags the discharge flowline (cause). The flow in a stream does not progress in straight lines parallel to the stream channel. Rather the flow is comprised of a primary flow oriented downstream and transverse flows oriented perpendicular to the primary flow. Along the discharge flow path, these inward and outward transverse flows are balanced. However, along the channel flow path, there is considerable asymmetry. Because of the variable turbulence and secondary flow patterns, the flow velocity, sediment transport and boundary shear stress are non-uniform cross the channel. These areas of turbulence produce alternating pulses of sediment, scour and deposition.
Figure 8-6: Meander Formation and Migration
Areas of scour and deposition alternate along the axis of discharge flow producing a pool along the outer bend and a corresponding point bar on the inner bend. As the pattern of scour and deposition alternates from one side of the channel to the other, the thalweg (deepest portion of the channel cross section) and maximum flow velocity cross over the center of the channel. Theses cross over points become the riffles. The alternating pattern of bar building and bank scour causes straight streams to evolve into meandering ones with a sinuous pattern. Specifically, this is how channelized reaches eventually reacquire a sinuous shape. Although the process of creating riffles and pools encompasses highly variable processes, the riffles and pools occur at generally predictable intervals. The spacing of these riffles or pools
FLOW CENTERLINE
FLOW LINE
Section 8 Geomorphic Evaluation
8-9
along the thalweg relates closely to the width of the stream at the elevation of dominant discharge. Figure 8-7 below illustrates riffle geometry in plan form. Further, the spacing of the pools, which are near the outside bend and slightly downstream of the maximum curvature of the meander, have essentially the same relationship to channel width as the riffles. In alluvial streams of homogeneous material, meanders take the form of sine-generated curves. Leopold and Langbein (1969) demonstrated that this shape is the most hydraulically efficient form for turning water. Further, Chang (1998) presents a more analytical assessment of this meander plan geometry. These relationships between stream width, riffle spacing, meander wavelength and radius of curvature are remarkably consistent for streams and rivers throughout the world. Most stable relationships in channel geometry include the channel width at the elevation corresponding to the dominant discharge. Riffle spacing (Z) generally occurs every 6.3 bank widths (W) where W is the width at the dominant discharge. This spacing is essentially 2�W. Meander wavelength is approximately 12 bank widths, which approaches 4�W. The radius of curvature is also related to the channel width at dominant discharge elevation. The ratio of meander radius of curvature (Rc) to channel width (W) generally ranges between 2 and 7. Bagnold’s (from Thorne et al, 1997) investigation of energy losses at bends confirmed the empirical observations by determining that flow energy losses are minimized through this shape. A tighter radius causes a flow separation and severe energy losses, a hydraulic inefficiency that is not persistent. In natural rivers, channel bends erode to a Rc/W ratio of 2-5 and then maintain that form, which indicates that the hydraulic efficiency is optimized by this form. In streams containing heterogeneous media and in confined channels, the meander pattern is interrupted by variations in bank structure, infrastructure, confluences, geologic features and channel manipulation. Streams out of equilibrium also display distortions in meander pattern and growth. Nevertheless, the fundamental relationships describing these patterns remain broadly applicable.
L
Rc
L = 4�W Rc/ W = 2 – 7
Riffle spacing (Z) = 2�W
W
Z
A
L = wavelength Rc = radius of curvature A = amplitude W = width at dominant discharge
Figure 8-7: Meander geometry
Section 8 Geomorphic Evaluation
8-10
Consistent with the location of peak stress downstream of each bend apex, meander waveforms migrate downstream. In stable streams, the meander migration generally occurs at a rate that does not affect infrastructure. However, accelerated migration may pose a substantial risk. A rapid increase in sediment load delivered from an incising reach upstream is the most likely trigger for accelerated migration in Little Salt Creek. Profile Analysis Little Salt Creek flows through erodible soils and has a low threshold for incision. A profile analysis reveals reaches where by virtue of bed slope and material strength, incision is likely. Abrupt changes in channel profile indicate areas where incision is occurring now or where the degradation is arrested by manmade or natural structures. In Little Salt Creek debris jams in the upper reaches are the most common natural structures restraining the advance of incision. The advancing front of incision is known as a knick point or, where slope changes are slightly less abrupt, knick zone. It is especially important to identify and manage incision because it usually precedes processes that are more destructive. The channels here are generally flatter at their mouths and steepen to the headwaters as is normal for watersheds. The exceptions are the northeast tributaries in the middle of the watershed which are in drier, less erodible soils and shown on Figure 8-8.
NW
12T
H S
T
MILL RD
N 1
ST S
T
W RAYMOND RD
W ALVO RD
N 8
0TH
ST
U.S
. HW
Y 77
ST
BLUFF RD
ARBOR RD
W LITTLE SALT RD
PURPLE HEART HWY
NW
40T
H S
T
W DAVEY RD
W BRANCHED OAK RD
NW
56T
H S
T
W ROCK CREEK RD
NW
27T
H S
T
W MCKELVIE RD HW
Y 79
ROCK CREEK RD
W MILL RD
BRANCHED OAK RD
W WAVERLY RD
W ASHLAND RD
WAVERLY RD
RAYMOND RD
LITTLE SALT RD
INTERSTATE 80
ASHLAND RD
N 8
4TH
ST
N 7
0TH
ST
N 4
0TH
ST
N 2
7TH
ST
DAVEY RDN
14T
H S
T
AGNEW RD 0 1.50.75Miles.
Figure 8-8
Little Salt CreekHydraulic Gradient Map
Hydraulic Gradient-8.0000 - 0.0000
0.0001 - 0.0063
0.0064 - 0.0188
0.0189 - 0.1020
Section 8 Geomorphic Evaluation
8-12
It appears that threshold slope for fluvial geomorphic processes is influenced by incipient moisture conditions and of course soil erodibility as demonstrated in Figure 8-9.
As the slope increases, the geomorphic process changes from plan form adjustment to incision to widening to dynamic equilibrium. The hydraulic slopes where determined for the 2-year flow event. The ranges of these hydraulic slopes where different fluvial geomorphic processes occur are shown in Table 8.1. Table 8.1 Hydraulic Slope and Fluvial Geomorphic Process Hydraulic slope from the modeled 2-year flow eventFluvial geomorphic process Salmo soils less erodible loams Plan form adjustment 0.0009 to 0.0015 0.0014 to 0.0087 Incision 0.0010 to 0.0082 0.0014 to 0.0198 Widening 0.0010 to 0.0041 0.0014 to 0.0089 Dynamic equilibrium Not observed 0.0033 to 0.0110
0.0000
0.0100
0.0200
0.0300
0.0400
0.0500
0.0600
0.0700
0.0800
0.0900
0.1000
0.1100
Mo
del
ed 2
-yr
hyd
rau
lic
slo
pe
by
Rea
ch
Decreasing erodibility
Plan Form Adjustment Incision Widening Dynamic Equilibrium Managed Swale or Ponds Undetermined
Figure 8-9: Erodibility vs. 2-yr Hydraulic Gradient Graph
Section 8 Geomorphic Evaluation
8-13
Energy Relationships Other fundamental relationships used to understand stream mechanics are energy, continuity and loss relationships. Remembering that energy can neither be created nor destroyed, that mass is conserved and that all dynamic systems have losses, we can calculate flood elevations and erosive stresses.
First, the total energy in a system can be expressed as:
E = w + v2/(2g) + z – L Where: E � energy (ft-lb/lb)
w � work per unit mass v2/(2g) � kinetic energy z � potential energy L � losses The total energy at any point is equal to the total energy at any other point and is expressed as:
w1 + v12/(2g) + z1 = w2 + v2
2/(2g) + z2 – L Additional equations such as continuity1 and Manning’s loss equation2 allow the designer to calculate the depth and velocity at any point in the system. Energy, continuity and Manning’s equations are the bases for programs such as HEC-RAS. Bringing these concepts together in the context of stream mechanics, work is the movement of sediment by water, kinetic energy is the movement of water, potential energy is the depth of the water and losses are friction and sound. HEC-RAS does not include a separate calculation of work. The energy exchange of work moving sediment is included by default in losses and kinetic energy. Some designers consider sediment transport competency for major projects by establishing a sediment budget to analyze sediment movement through the designed intervention. More sophisticated techniques include computer based analyses. For small projects, it is usually difficult to justify a sophisticated model. The designer, however, can achieve a basic understanding of sediment transport competency and erosion hazard from data and analyses used to determine water surface elevations. The designer estimates area of erosion and deposition from the continuity of the stream power or boundary shear stress. Routines in the HEC-RAS model calculate stream power and boundary shear stress. The values of either stream power or boundary shear stress are plotted against the longitudinal profile. The designer compares the zones of highest and lowest values to his field observations of size and distribution of bed material and the location of scour and erosion. The designer then establishes threshold values from these observations. Improved sediment transport 1For modeling purposes, the continuity relationship expresses the concept that the quantity of water in any one point in a system is the same as the quantity of water at another point or changes only gradually. At each confluence, hydraulic models are partitioned into discrete reaches. 2 Manning’s loss equation is commonly expressed as Q =1.49(R2/3S1/2)A/n
Section 8 Geomorphic Evaluation
8-14
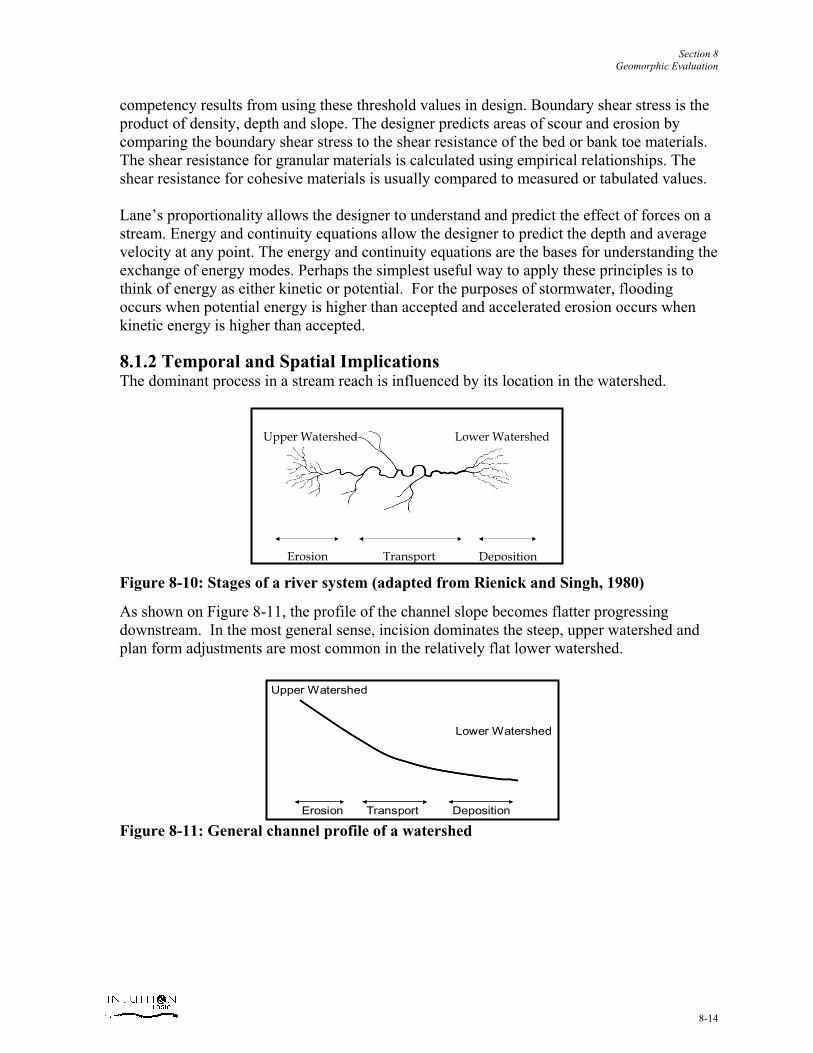
competency results from using these threshold values in design. Boundary shear stress is the product of density, depth and slope. The designer predicts areas of scour and erosion by comparing the boundary shear stress to the shear resistance of the bed or bank toe materials. The shear resistance for granular materials is calculated using empirical relationships. The shear resistance for cohesive materials is usually compared to measured or tabulated values. Lane’s proportionality allows the designer to understand and predict the effect of forces on a stream. Energy and continuity equations allow the designer to predict the depth and average velocity at any point. The energy and continuity equations are the bases for understanding the exchange of energy modes. Perhaps the simplest useful way to apply these principles is to think of energy as either kinetic or potential. For the purposes of stormwater, flooding occurs when potential energy is higher than accepted and accelerated erosion occurs when kinetic energy is higher than accepted. 8.1.2 Temporal and Spatial Implications The dominant process in a stream reach is influenced by its location in the watershed.
Figure 8-10: Stages of a river system (adapted from Rienick and Singh, 1980)
As shown on Figure 8-11, the profile of the channel slope becomes flatter progressing downstream. In the most general sense, incision dominates the steep, upper watershed and plan form adjustments are most common in the relatively flat lower watershed.
Figure 8-11: General channel profile of a watershed
New Old
Erosion Transport Deposition
Upper Watershed
Lower Watershed
Erosion Transport Deposition
Upper Watershed
Lower Watershed
DepositionErosion Transport
Upper Watershed Lower Watershed
Section 8 Geomorphic Evaluation
8-15
In disturbed watersheds, this pattern may be reset by infrastructure. For example, a dammed stream can act as the end of a watershed, as illustrated in Figure 8-12, where sediment and water is deposited in the receiving lake. Here the outfall behaves like a spring beginning the next watershed.
Stream crossings such as bridges and culverts can also reset river formation, as shown on Figure 8-13. In developing areas, the characteristic profile shape of natural watersheds may be repeated after each hard crossing that materially effects transport of water and sediment. These obstructions may geomorphically isolate the reach.
Figure 8-13: Effect of stream crossings resetting the stream formation sequences
Dep
ositi
on
Tra
nspo
rt
Ero
sion
Ero
sion
Dep
ositi
on
Tra
nspo
rt
DamAnd
Reservoir
Dep
ositi
on
Tra
nspo
rt
Ero
sion
Dep
ositi
on
Tra
nspo
rt
Ero
sion
Ero
sion
Dep
ositi
on
Tra
nspo
rt
DamAnd
Reservoir
Dep
ositi
on
Tra
nspo
rt
Ero
sion
Dep
ositi
on
Tran
spor
t
Ero
sion
Dep
ositi
on
Tra
nspo
rt
Ero
sion
Dep
ositi
on
Tran
spor
t
Ero
sion
Bridge
Bridge
Culvert
Dep
ositi
on
Tra
nspo
rt
Ero
sion
Dep
ositi
on
Tra
nspo
rt
Ero
sion
Dep
ositi
on
Tran
spor
t
Ero
sion
Dep
ositi
on
Tran
spor
t
Ero
sion
Dep
ositi
on
Tra
nspo
rt
Ero
sion
Dep
ositi
on
Tra
nspo
rt
Ero
sion
Dep
ositi
on
Tran
spor
t
Ero
sion
Dep
ositi
on
Tran
spor
t
Ero
sion
Bridge
Bridge
Culvert
Figure 8-12: Effect of dam resetting the stream formation sequence
Section 8 Geomorphic Evaluation
8-16
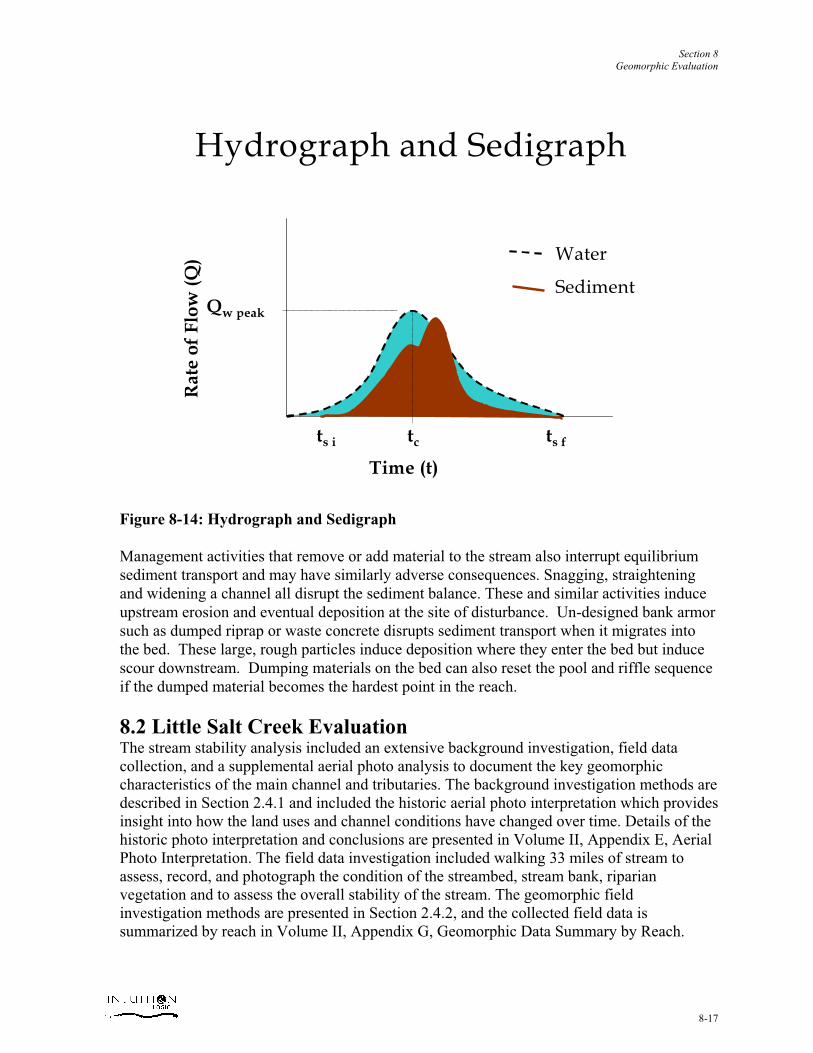
8.1.3 Sediment Transport Natural channels transport both water and sediment through the watershed. Sediment and water movement play parallel roles in flood and erosion control and in the performance of bridges and culverts. For this discussion, sediment includes large woody debris, man-introduced materials and other debris that comes to rest on the streambed. A stream in dynamic equilibrium maintains the movement of water and sediment without sudden and wholesale areas of erosion and deposition. Flow rate governs both the initiation of sediment movement and its deposition, moving material when the system has sufficient kinetic energy and depositing it when the kinetic energy is depleted. As described earlier, gravity, expressed here as hydraulic slope, is the driving force acting on the system. The movement of water transfers that force to dislodge and keep particles moving. Figure 8-12 is a generic hydrograph and sedigraph relating the rate of flow to time. Note that there is a lag between the flow of water and the movement of sediment (ts i). The lag represents the flow necessary to exceed the critical shear stress. At the peak water flow there is often a decrease in the transport of sediment as the hydraulic slope decreases. The falling leg of the hygrograph may coincide with the peak of the sedigraph with the particles already mobile and an increase in hydraulic slope. As the flow recedes and kinetic energy declines, the stream deposits particles of decreasing particle size. This process forms the riffles between pools. In Little Salt Creek, this is most apparent in the upper reaches where the woody debris jams morphologically behave as riffles. Issues of sediment transport are particularly relevant to stream managers at infrastructure crossings. Bridge, culvert and pipeline crossings may interrupt the hydraulic slope with predictable, adverse consequences. A crossing backwatered under high flow conditions decreases the hydraulic slope and may induce deposition that reduces flow capacity. Over-widened or excessively smooth crossings increase hydraulic slope and induce scour. The scour may occur immediately downstream and undermine the structure or may, as the result of an upstream drawdown curve, induce incision. This incision migrates upstream until the stream reaches a stable bed slope.
Section 8 Geomorphic Evaluation
8-17
Figure 8-14: Hydrograph and Sedigraph Management activities that remove or add material to the stream also interrupt equilibrium sediment transport and may have similarly adverse consequences. Snagging, straightening and widening a channel all disrupt the sediment balance. These and similar activities induce upstream erosion and eventual deposition at the site of disturbance. Un-designed bank armor such as dumped riprap or waste concrete disrupts sediment transport when it migrates into the bed. These large, rough particles induce deposition where they enter the bed but induce scour downstream. Dumping materials on the bed can also reset the pool and riffle sequence if the dumped material becomes the hardest point in the reach.
8.2 Little Salt Creek Evaluation The stream stability analysis included an extensive background investigation, field data collection, and a supplemental aerial photo analysis to document the key geomorphic characteristics of the main channel and tributaries. The background investigation methods are described in Section 2.4.1 and included the historic aerial photo interpretation which provides insight into how the land uses and channel conditions have changed over time. Details of the historic photo interpretation and conclusions are presented in Volume II, Appendix E, Aerial Photo Interpretation. The field data investigation included walking 33 miles of stream to assess, record, and photograph the condition of the streambed, stream bank, riparian vegetation and to assess the overall stability of the stream. The geomorphic field investigation methods are presented in Section 2.4.2, and the collected field data is summarized by reach in Volume II, Appendix G, Geomorphic Data Summary by Reach.
Hydrograph and Sedigraph
Time (t)
Rat
e of
Flo
w (Q
)
Qw peak
tc
Water
Sediment
ts i ts f
Section 8 Geomorphic Evaluation
8-18
Evaluation of 2007 aerial photographs supplements the field investigations on channels that were not walked. The supplemental aerial photo analysis methods are presented in Section 2.4.3 and the results are summarized by reach in Appendix G, Geomorphic Data Summary By Reach. 8.2.1 Channel Geometry Little Salt Creek Creek was evaluated in plan, cross section, and profile. Plan form information was obtained from the aerial photos and the LiDAR base mapping topographic data. Channel cross section information was generated from the LiDAR topographic data supplemented with field cross section measurements. Profile data was generated from the LiDAR data supplemented with the structure survey information. 8.2.1.1 Plan Form Evaluating the shape of the watershed in plan form provides insight on whether and how parts of the basin differ from one another. For example, subbasins with a greater degree of geologic control, higher density of tributaries, or more severe degrees of channel manipulation may require different management approaches than the remaining subbasins. The drainage basin analysis was conducted in accordance with the method described by Lueder (1959). Consistent with the regional geology, the drainage network analysis indicates relatively high erodibility, high groundwater and low permeability. The angle at which the tributaries intersect each other and intersect the main stem suggests manipulation, most likely channel relocation along farm field lines. The main stem is highly manipulated and while natural plan form adjustment is evident, a rough estimate of the degree of man-made channel shortening is 20%. The features of the Little Salt Creek basin are consistent with wind deposited land forms. The topography is gently undulating with generally uniform slopes and orientation roughly aligned with prevailing winds. The dense drainage network is also a characteristic of wind-deposited silt landforms as are near-vertical stream banks, steep head ends of gullies and other erosion features. This drainage network is dendritic meaning that it has an extensively branched or tree-like pattern. Classical Aeolian land forms are uniform and integrated. Here Little Salt Creek differs from the classical in having extensive seeps, marshes and other features that appear to lack a direct surface water connection to the stream. These discontinuities are indicative of dispersive soils although recent laboratory testing does not support this observation. These features may be associated with internal piping as described below in the section on soil. The distinctive features noted above also differentiate this basin from others in the Lincoln area. Scrolls, oxbows and other evidence of channel movement over time are abundant. While most of the changes in channel alignment are clearly man-made, some of the extensive migration across the broad, shallow valley may be natural. The main channel is flanked by depressions and slumps, some near the bank, others as far as 800 feet away. Surrounding soils are blotchy and mottled sometimes with evaporites at the surface.
Section 8 Geomorphic Evaluation
8-19
8.2.1.2 Cross Section The cross sectional shape of a stream channel indicates the stage of channel evolution. When integrated with plan and profile indicators such as erosion or knickpoints, cross section data are used to determine the dominant channel process, the foundation of stream management. No one data set is adequate to diagnose channel process, but analyzed together, it is possible to build a defensible case for the type of channel evolution. The field investigation revealed very few bankfull features at any elevation. Those few features identified as potential bankfull floodplains occurred at elevations well below the major breaks in slope now dominating the channel cross section. Channel features are masked by the high number of slumps. The most common failure modes are spreading and wedge with minor circular and one flow slide observed. Failures occur throughout the watershed on saturated, shallow reaches with steep banks Continual erosion at the toe of a slide and low shear resistance on failed surfaced enables creep to occur. Blocks of intact soil slowly creep toward the channel allowing spread. When sufficient movement has occurred the next block fails from the intact soil. This process will continue until the bank angle is lower than the critical angle. This process may be interrupted by higher flows that can easily scour away disturbed soils resulting in large mass wasting. 8.2.1.3 Profile The longitudinal profiles used in the HEC-RAS model formed the basis for the profile analysis. Reach average bed slope for the upper main stem above Agnew Road and for the tributaries varies between 0.5% and 1.14% for the 47 reaches included in the analysis. Of the 47 reaches, 17 or 36% have a slope of 0.9% to 1.0%. The main stem below Agnew Road has a reach average slope of 0.2%. Based on preliminary analysis, observations and experience in the region, a stable bed slope approaches 0.06%. Rock Creek Road Bridge and its downstream riprap have limited major incision upstream of the bridge based on analysis of the longitudinal profile and the location of seeps. 8.2.2 Boundary Material The bed and bank materials are composed of the native soil, introduce debris and rock, vegetation, groundwater and large woody debris in the wooded reaches. 8.2.2.1 Soil Soils throughout the basin are silts, clayey silts, silty clays, fine sandy silt and clay. The Salmo series dominates the lower watershed on the main stem while the Nodaway and Colo-Nodaway are predominate in the upper watershed. Most tributaries flow through the Nodaway or Colo-Nodaway soils except for tributaries 20 (Kennebec silt loam), 10 and 5 (Salmo silt loam). In general, the soils near the channels are weak and erodible, from the weakest, Salmo to Nodaway, Colo-Nodaway, then Kennebec Soils near the seeps and wetlands are erodible but not dispersive as previously suspected. Of the soils that were sampled and tested in the laboratory none were classified as dispersive (D1 or D2 see Section 2.5.2). However, the soils are dissected by ephemeral gullies and have the appearance of dispersive soils. Recent work by Glenn Wilson, Research Hydrologist, Agricultural Research
Section 8 Geomorphic Evaluation
8-20
Service, USDA 3 suggests this appearance is caused by internal erosion and collapse of the soils from preferential flow through soil pipes (piping) that discharge in ephemeral gullies. Gullies with an appearance similar to dispersive soils along Little Salt Creek are most often associated with seeps based on field observations and observations reported in the Technical Task Force meetings by staff of the University of Nebraska in Lincoln. The four samples, B-2, B-4, B-6 and B-8 were classified slightly dispersive (ND3 or SD). Samples B-2, B-6 and B-8 were identified as ML using Unified Soils Classification, indicating inorganic silt or clayey silt with slight plasticity. Sample B-4 was identified as CL indicating inorganic clay of low to medium plasticity. With the exception of Sample B-1, identified as CH, the tested soils are typical of soils that could support the phenomena reported by Wilson. The banks are generally poorly drained in the Salmo series and moderately well drained in the Nodaway series. In poorly drained soils, saturation increases the mass and weakens the soil. The majority of soils originally thought to be dispersive were observed in the Salmo series soils. This also supports the piping phenomena reported by Wilson. As the clay content increases, the fluvial process shifts from incision to widening. This is demonstrated on the main stem between Raymond and Branched Oak Roads. From Modeling Channel Instabilities and Mitigation Strategies in Eastern Nebraska, by E. J. Langendoen, A. Simon and C. V. Alonso, ASCE, 2000, the bed-material properties are 7.7 Pa for the average critical https://www1.gotomeeting.com/join/860835894 stress and 0.28×10⁻⁶ m/Pa s for the average erodibility. The streambed material of is a silt loam. The clay content on Little Salt Creek was 14%. The bank-material properties of intact soil on Little Salt Creek were 4.3 kPa for the average effective cohesion and 30.9 degrees for the average angle of internal friction. The average bulk density was 1.58 g/cm3. The bank-material composition was similar to that of the bed. 8.2.2.2 Debris This discussion of debris includes dumped concrete, rock, large woody debris and other waste. Other waste includes discarded appliances, hay bales, fence, and similar materials. Dumped debris falls into several categories; waste, bank armoring, or bed armoring. With the exception of infrastructure protection, there is little systematic armoring in this stream. Whether intended to stabilize a failing bank, arrest incision or dispose of waste, the dumped material in the stream is not effective in improving stream stability and in some cases aggravates the instability. The natural response to incision in this region is the development of woody debris jams. As trees and shrubs fall into the creek, the woody debris is distributed throughout the system
3 Wilson, G.V. 2007. The Role of Preferential Flow Through Soil-Pipes on Ephemeral Gully Erosion. Proceedings of the IV International Symposium on Gully Erosion. September 17-19, 2007, Pamplona, Spain, J. Casali and R. Gimenez (eds.). Public University of Navarra. pp. 136-137.
Section 8 Geomorphic Evaluation
8-21
forming a pool and riffle system. The debris jams generate the profile form that manages energy. The jams reinforce the bed and increase the hydraulic roughness dissipating erosive energy. The backwater effect of the jams lowers the hydraulic gradient for low flows. The critical shear resistance for woody debris is estimated at 3 psf. However, in this watershed the natural formation of sufficient woody debris jams to limit incision is limited by the absence of a woody corridor in the lower watershed and a narrow woody corridor in the upper watershed as discussed in the following section on vegetation. While debris jams may contribute to local flooding, they also reinforce local stability. Removal of debris jams without reinforcing the bed usually leads to incision, widening, or meandering. The location of debris jams is presented as a GIS layer.
8.2.2.3 Vegetation There are several distinct plant communities bordering this stream. Herbaceous plants dominate in the reaches bounded by the Salmo soil series while woody species such as locust, willow and elm are prevalent in the Nodaway and Colo-Nodaway series. Some reaches, particularly some headwaters are plowed over and have no persistent vegetation. In contrast some headwaters reaches have wide, dense woody corridors. The vigor and integrity of riparian vegetation plays an important role in the physical, chemical and biological health of stream systems. In their landmark report, Riparian Areas: Functions and Strategies for Management (National Research Council 1999), the authors define riparian areas as “transitional between terrestrial and aquatic ecosystems and are distinguished by gradients between biophysical conditions, ecological processes, and biota. They are areas through which surface and subsurface hydrology connect water bodies with their adjacent uplands.” Diverse stands of healthy native vegetation process and sequester pollutants, temper the volume and timing of surface runoff, moderate soil moisture, and increase the shear strength of stream banks. By adjusting the rate of evapotranspiration as plant-available moisture varies, marsh plants, grasses, trees and shrubs moderate the extremes of soil moisture and help maintain optimum moisture for soil strength. The riparian corridor of Little Salt Creek in general is in poor condition. Marshes have been drained, incision has isolated marshes from the channel, and woody riparian corridors are generally narrow. In reaches not influenced by salt, there are some stands of trees remaining; most of the watershed is denuded. When not farmed to the edge, the banks are often lined with a thin band of cottonwood, mulberry, or locust. The sparse trees and shrubs do not provide the benefits expected of a vigorous woody corridor. Both the water quality and physical stability of the system are affected as a result. The absence of an intact corridor increases the sensitivity of the banks to groundwater related failures. In the absence of extensive root reinforcement to mechanically strengthen the soil and evapotranspiration to reduce the saturation near the surface, the banks are vulnerable to failure under mild stresses.
8.2.2.4 Groundwater The groundwater level varies in relation to land use and the depth of incision. Marshes and wetlands are found where the groundwater level is high. Agricultural cropland is common
Section 8 Geomorphic Evaluation
8-22
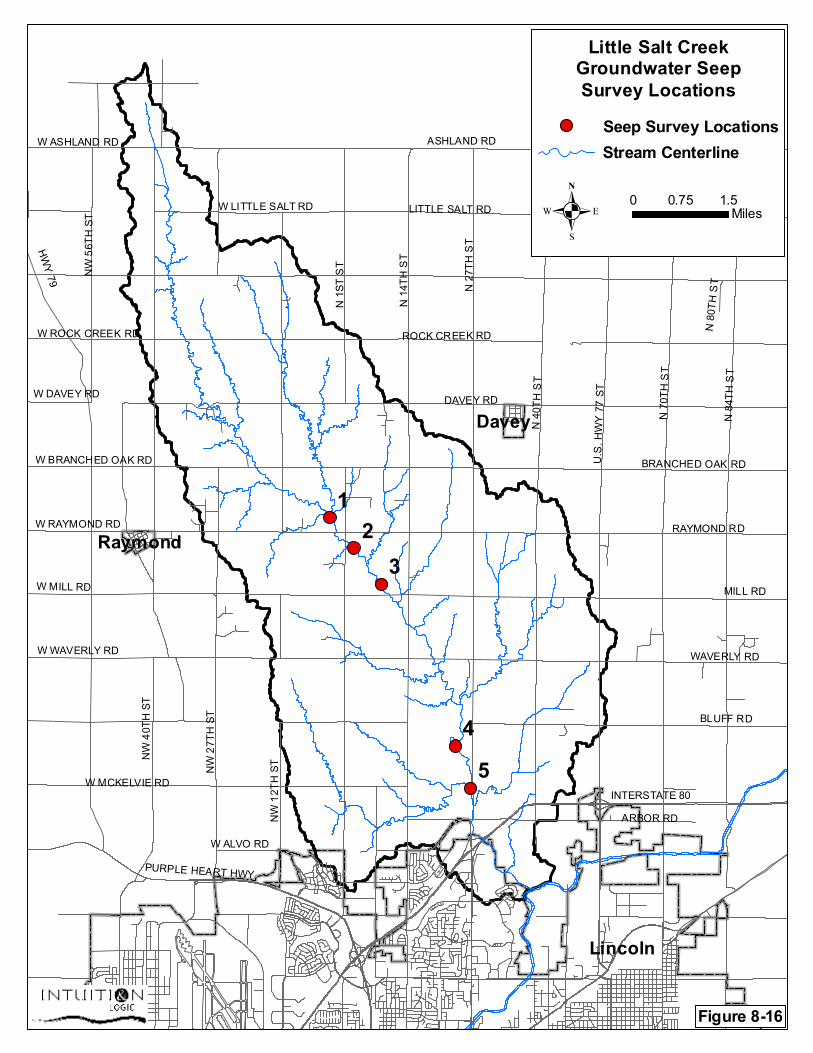
where groundwater levels are moderate to lower. Within the agricultural areas, where the groundwater level is high, the landuse is usually left as pasture. Many seeps were identified during the field work and are presented in Figure 8-15, Observed Groundwater Seeps. High ground water contributes to mass wasting by increase soil weight and decreasing shear strength. The seep may be a major contributor to the location and formation of gullies that look like dispersive soils. Both fresh and saline seeps occur in the main stem downstream of Davey Road. Freshwater seeps are predominant upstream of Branched Oak Road that is above the contact of the Salmo Soil Series. The physical location of seeps was surveyed at five discrete locations along the main stem of Little Salt Creek. These locations are shown on Figure 8-16. At the five locations, a topographic survey of 100 feet of channel was performed to identify the top of bank, toe of slope, channel bottom and water surface elevation. The relationship of the height of the stream bank, the depth of the stream, the height of the seep above the water level and the slope of the stream bank were compared for each location. The ratio of the seep height to bank height is highest for seep locations 1 and 2 as would be expected since these seep locations are likely to be in slightly stronger soils that occur higher in the watershed. In general, the locations of the seeps are consistent with those predicted by Dupuit’s theory of unconfined flow. This implies that the stream bank seeps are the result of the near-surface water table and are points of concentrated flow. Unless there is an impermeable layer beneath the water table (an aquiclude), the seeps will migrate down the slope if the channel continues to incise. As the channel deepens, the horizontal influence of the seeps increases, lowering the groundwater table further from the stream. This effect may result in increased drying of the near-bank wetland areas particularly during the dry summer months. The seep survey exhibits are found in Appendix P.
NW
12T
H S
T
MILL RD
N 1
ST S
T
W RAYMOND RD
W ALVO RD
N 8
0TH
ST
U.S
. HW
Y 7
7 ST
BLUFF RD
ARBOR RD
W LITTLE SALT RD
PURPLE HEART HWY
NW
40T
H S
T
W DAVEY RD
W BRANCHED OAK RD
NW
56T
H S
T
W ROCK CREEK RD
NW
27T
H S
T
W MCKELVIE RD H
WY
79
ROCK CREEK RD
W MILL RD
BRANCHED OAK RD
W WAVERLY RD
W ASHLAND RD
WAVERLY RD
RAYMOND RD
LITTLE SALT RD
INTERSTATE 80
ASHLAND RD
N 8
4TH
ST
N 7
0TH
ST
N 4
0TH
ST
N 2
7TH
ST
DAVEY RDN
14T
H S
T
Lincoln
Davey
Raymond
0 1.50.75Miles.
Little Salt CreekObserved Groundwater
Seeps Map
Groundwater SeepsStream CenterlineStreet CenterlineLittle Salt Creek Watershed
Figure 8-15
NW
12T
H S
T
MILL RD
N 1
ST S
T
W RAYMOND RD
W ALVO RD
N 8
0TH
ST
U.S
. HW
Y 7
7 ST
BLUFF RD
ARBOR RD
W LITTLE SALT RD
PURPLE HEART HWY
NW
40T
H S
T
W DAVEY RD
W BRANCHED OAK RD
NW
56T
H S
T
W ROCK CREEK RD
NW
27T
H S
T
W MCKELVIE RD H
WY
79
ROCK CREEK RD
W MILL RD
BRANCHED OAK RD
W WAVERLY RD
W ASHLAND RD
WAVERLY RD
RAYMOND RD
LITTLE SALT RD
INTERSTATE 80
ASHLAND RD
N 8
4TH
ST
N 7
0TH
ST
N 4
0TH
ST
N 2
7TH
ST
DAVEY RDN
14T
H S
T
Lincoln
Davey
Raymond 21
3
5
4
0 1.50.75Miles.
Little Salt CreekGroundwater SeepSurvey Locations
Seep Survey LocationsStream Centerline
Figure 8-16
Section 8 Geomorphic Evaluation
8-25
8.2.3 Hydraulics The Bed and channel shear stresses applied were generated using HEC-RAS. This shear data was integrated into the assessment of geomorphic process. The results of this analysis were compared with the field assessment of geomorphic stability with generally good agreement. The HEC-RAS was developed using the 2-foot Lidar contour data. The 2-year flows formed the bases for the applied shear stresses used in the analysis. This is the lower limit that is reasonable to use based on the topographic data and the arrangement of the model. Preliminary indications are that the 2-year flow is slightly greater than the stream forming flow. Shear values are calculated at discrete cross sections in the model. Reach-average shears are used in the analysis. For all tributaries except Tributary 20, the calculated shear stress exceeded the critical shear stress of the soils. In Tributary 20 and the main stem below Branched Oak Road and above Arbor Road, the calculated shear stress approaches critical shear stress. Scour and slumps occur throughout these reaches. The bed is slightly lower than that used in the HEC-RAS model based on water depth observed during the geomorphic fieldwork. Since tractive shear is directly proportional to water depth, increases in water depth for shallow flows will proportionately increase shear. Applied shear exceeds critical shear for most of the modeled watershed. Since the calculated shear stress approaches critical shear stress on the main stem between Arbor Road and Branched Oak Road interventions to lower the applied shear stress may be more effective in this reach.
8.2.4 Sediment Transport Competency Little Salt Creek is exporting sediment to Salt Creek. Little Salt Creek is extremely competent to transport sediment throughout the watershed. Once dislodged, the soil particles are easily transported. Although a lot of sediment is being delivered to the system, little is stored in bars. Although unconsolidated bars were observed during the fieldwork most bars are located on the main stem from the confluence with Salt Creek to a mile north of Arbor Road, a half-mile downstream of NW 12th Street and between NW 19th Street and Branched Oak Road. These are areas that are undergoing plan form adjustment or widening. Some bars were observed in the aerial photographic interpretation in the tributaries and are generally near the confluence with the main stem and similarly in areas undergoing plan form adjustment or widening. Slumps occur over most of the watershed, the result of scour at the toe and into the bed. Material that has slumped into the channel loses it soil structure as a result of excessive strain and becomes mobile. Once suspended this material is exported from the watershed. The particles generally do not consolidate into stable bars or benches because of frequent exposure to high shear stresses relative to the particle size. 8.3 Physical Stability of the Watershed
8.3.1 Existing Channel Process In this report the term dominant fluvial process refers to the stream process that overall best reflects the actions taking place in that stream reach. In any given reach there may be other
Section 8 Geomorphic Evaluation
8-26
local processes acting here or there but the dominant process best describes the reach as a whole and its likely interaction with other reaches. Generally, the terms used in this analysis to describe the dominant fluvial process are the same terms used to describe natural stream processes, such as incision and widening. All streams adjust their dimensions and alignment in response to the water and sediment delivered to them. The same processes occur in completely natural systems and in those influenced by man. In man-influenced systems, these processes may take place at a dramatically increased rate. Five dominant processes were identified in Little Salt Creek as follows:
1. Dynamic Equilibrium – A channel that is generally in a natural condition where bed and bank materials are balanced with erosive and depositional forces. Channel adjustments are generally gradual. Streams in dynamic equilibrium often have a two-stage or multi-stage channel shape, a lack of systemic bed or bank erosion, and permanent woody vegetation growing close to the water surface or channel bed. This typically describes a pre-disturbance or recovered condition.
2. Incision – Channel incision is a process of vertical channel adjustment, or channel
downcutting, generally in response to an alteration upstream or downstream of the incising reach. Channelization frequently induces upstream-migrating incision whereas sediment starvation may induce incision in a downstream reach. Incision occurs when bed material is more easily removed from the channel bed than it is from the stream banks. Incision is characterized by actively migrating breaks in bed slope called knick points, perched trees and steep banks.
3. Widening – Channel widening is characterized by widespread erosion and bank
failures as banks reach or exceed critical bank height, a deep “V” or “U”-shaped cross-section, inactive or perched floodplains, and unconsolidated bed material. Widening occurs as the channel adjusts in cross-section to a new flow or sediment regime. Steep and unstable channel banks fail to a stable shape, thereby increasing channel width and sediment load. Channels that are widening typically exhibit widespread erosion and mass wasting, along with deposition of unconsolidated material liberated from eroding stream banks.
4. Plan Form Adjustment – Plan form Adjustment occurs as the channel changes its alignment. This can take many forms including meander cut-off or increase in meander amplitude. However, in this watershed, the most common incarnation of this process was accelerated meander advance. That is, the natural wave form of the stream moves downstream at an accelerated rate. Excess sediment is often a driver of this process. Channels in accelerated meander advance typically exhibit a cut bank on the outside of bends downstream of the apex with scour at the toe and an advancing unconsolidated bar on the inside of the bend. The bar is typically irregularly shaped and more than 1/3 across the channel. The downstream side of bar is frequently steep, and the bar material is unsorted.
Section 8 Geomorphic Evaluation
8-27
5. Managed Swale and Pond – This is not a natural process but refers to ongoing
maintenance of a waterway. In most cases, these are farm ponds or straightened and graded swales.
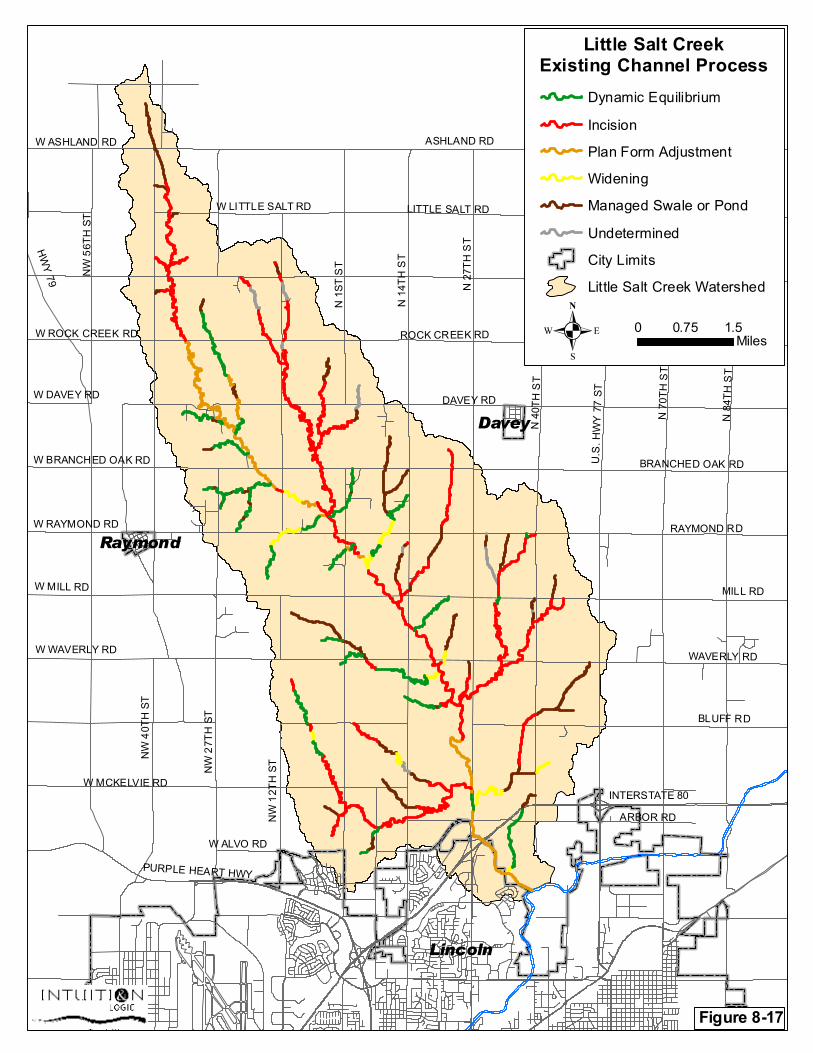
The results of the process analyses are presented on Figure 8-16 Existing Channel Process. Dynamic equilibrium reaches are indicated in green, widening reaches are yellow, incising reaches are red, plan form adjustment reaches are orange, and managed swales and ponds are indicated in brown. Generally, the geomorphic evaluation revealed widespread instability. The instability most commonly occurs as incision. Plan form adjustment is also common in the lower reaches. Incision is a downward cutting of the channel, migrating upstream and extending through the tributaries. The bed and bank materials are relatively weak and are responsive to increased stress. Stream bank failures are common in all parts of the watershed. The bank failures are usually a consequence of the incision. The absence of a vigorous woody corridor protecting the stream banks and the presence of seeps increases the frequency and severity of bank failures. The rate of bank failure and soil creep appears to be equivalent to the rate of scour and erosion resulting in little if any increase in channel width. Plan form adjustment is generally by meander advance. The incision observed in Little Salt Creek was initially caused by the incision of Salt Creek however Salt Creek is no longer incising. The USACE produced DM MSC11 - Channel Improvements and Levees Thru Lincoln; Omaha, NE in 1963 concluding that Salt Creek was no longer incising. The only current influence from Salt Creek is probably from flood backwater and the resulting deposition of fine sediment. The resulting fluvial process in the lowest portion of Little Salt Creek is plan form adjustment influenced by this backwater. A distinction in the Little Salt Creek Watershed is that there is little evidence of deposition (of the liberated sediment) and channel recovery. This may be due in part to the nature of the native soils in that once the soils are in suspension they are easily transported from the system. Other contributors may include continued manipulations such as the construction of in line ponds in the tributaries that cut off the sediment supply to downstream reaches.
NW
12T
H S
T
MILL RD
N 1
ST S
T
W RAYMOND RD
W ALVO RD
N 8
0TH
ST
U.S
. HW
Y 7
7 ST
BLUFF RD
ARBOR RD
W LITTLE SALT RD
PURPLE HEART HWY
NW
40T
H S
T
W DAVEY RD
N 5
6TH
ST
W BRANCHED OAK RD
NW
56T
H S
T
W ROCK CREEK RD
NW
27T
H S
T
W MCKELVIE RD H
WY
79
ROCK CREEK RD
W MILL RD
BRANCHED OAK RD
W WAVERLY RD
W ASHLAND RD
WAVERLY RD
RAYMOND RD
LITTLE SALT RD
INTERSTATE 80
ASHLAND RD
N 8
4TH
ST
N 7
0TH
ST
N 4
0TH
ST
N 2
7TH
ST
DAVEY RDN
14T
H S
T
Lincoln
Davey
Raymond
0 1.50.75Miles.
Little Salt CreekExisting Channel Process
Dynamic Equilibrium
Incision
Plan Form Adjustment
Widening
Managed Swale or Pond
Undetermined
City Limits
Little Salt Creek Watershed
Figure 8-17
Section 8 Geomorphic Evaluation
8-29
8.4 Methods of Management
8.4.1 Watershed-Scale Stability The unusual nature of this watershed, particularly the saline wetlands, weaker soils and absence of urban development pressure lends itself to management options that are not available or appropriate in most Lincoln area basins. Because of the absence of urban development and the accompanying intense focus on immediate stabilization there is an opportunity here to take advantage of more dynamic methods of watershed-scale stabilization. The instability extends throughout the watershed and a traditional, or even a soil bioengineering approach to stabilizing the channel would not be cost effective. Instead, we recommend protecting critical infrastructure with engineered structures to control grade and energy and providing the building materials for the channel to construct its own grade controls. 8.4.1.1 Supply Large Woody Debris Supplying large woody debris is the single most beneficial action available to stabilize the predominantly rural Little Salt Creek Watershed. A major issue influencing systemic stability is the scarcity of the woody riparian corridor. Streamside trees whether under storm stress or through channel adjustment contribute this debris. The lower main stem cannot support woody growth because of the saline groundwater. Other than the underlying Dakota Sandstone there is little durable or coarse material available to form riffles and knick zones to arrest incision or to naturally flatten the hydraulic slope for frequent flows. Large woody debris will form jams. Along with beaver dams, the debris jams effectively lower the hydraulic slope. A naturally occurring logjam can resist applied shear stresses of approximately 3.0 psf. Sufficient woody debris needs to be produced to replace deteriorating wood after the jams have formed. Dense jams composed of graded sizes of woody debris will also trap sediment and allow sufficient time for consolidation. This sediment will fill the bed and form bars upstream of the jams. As the woody material migrates down the channel the jams and subsequent exposed bars should eventually provide habitat for the Salt Creek Tiger Beetle. A wide band of native trees and shrubs also supports stream stability by increasing bank strength and reducing the influence of surface runoff. Stream bank vegetation influences sediment dynamics by trapping and storing suspended sediment. Good canopy cover also improves water quality and habitat by shading the stream and providing leaf litter important for benthic species. When coupled with engineered grade stabilization at bridges, a re-established woody corridor is a major step towards improving the condition of the stream now and preventing continuing incision. The corridor should be wide, dense, and extend the entire length of the stream except in areas of the saline marsh, habitat of endangered species or where salt seeps would prevent growth of natural woody species. Headwater reaches are particularly vulnerable to erosion and benefit from a protective corridor as much as lower reaches. Species represented should include canopy and understory trees, shrubs, and where appropriate, native grasses and forbs. Detailed, thoroughly researched guidance on the design and benefits of riparian buffers is
Section 8 Geomorphic Evaluation
8-30
available in the text released by the National Academy of Science (National Research Council 2002). 8.4.1.2 Arrest Channel Incision As presented in the ASCE (2000) paper and subsequent USGS report (2003), channel incision should be limited in the Little Salt Creek Watershed. Analyses presented in these publications indicated that the channel could incise two to three meters (6.5 to 9.8 feet) in areas not intercepting the Dakota Sandstone. Figure 9-2 in Section 9 of this report illustrates the estimated depth of incision over the next 30 years for the reach of Little Salt Creek Main Stem from upstream of Raymond Road to Bluff Road (from Langendoen, Simon, Alonso, 2000). Incision causes most of the problems throughout the basin including slumps along most of the channels. Fortunately, incision responds well to treatment. Stopping the incision “short circuits” the cycle of channel evolution and improves the likelihood that the channel will self-heal. The knickpoints and knickzones are sites where the hydraulic slope is locally high enough to induce upstream migrating erosion. Engineered grade control structures along with naturally occurring woody structures (jams and beaver dams) will lower the slope below the threshold for bed erosion in this stream. Because of the high erodibility of the streambed, it is necessary to dissipate energy gradually over the length of the structure. For this application, Newbury style grade control structures offer compelling advantages over concrete or sheet pile drop structures. These rock structures provide artificial riffles along the streambed. In addition to distributing energy, these rock structures improve water quality by increasing dissolved oxygen and providing refuge for benthic organisms. Regardless of the style of grade control structure, prevention of soil piping must be included in the design. Stabilizing the bed below bridges and culverts is recommended. 8.4.1.3 Groundwater Others are investigating the interaction between surface and groundwater and the influence of wetlands. The effects of groundwater should be considered in any stream intervention. As an example, possible freshwater seeps occur south of Waverly Road on the main stem. If these are freshwater seeps then common soil bioengineering techniques, such as live staking, can be used to help stabilize failing stream banks. Gullies are common in the basin. If seeps are implicated in the gully formation or progress, then any potential repair must take into consideration the recent work of Wilson, (2007). Wilson’s important work on gully genesis in fine grained soils is directly applicable to this watershed. More conventional gully repair schemes such as filling and grading will be ineffective in seep-influenced gullies. 8.4.2 Local Stability Little Salt Creek has an abundance of failed stream banks and a few areas of meander adjustment. Most of these problems are a consequence of incision and are best addressed in a context of systemic grade control. Once systemic incision is controlled, the driving force for bank failure will have been removed. However, stream banks with substantial toe scour will
Section 8 Geomorphic Evaluation
8-31
continue to fail until a stable cross section is achieved. Attempting to prevent all of these failures and repair all stream banks that are failing now is prohibitively expensive. It is appropriate to treat areas of threatened infrastructure using methods consistent with systemic stabilization. In addition to grade controls, bankfull floodplains may be used to flatten hydraulic gradients and lower shear stresses. An additional benefit of the bankfull floodplains is possibly habitat for the Salt Creek Tiger Beetle. The organizing principle for local stability is, like systemic stability, energy management. The goal is to manage energy throughout the intervention so that neither scour nor deposition is induced in the adjoining reaches. This implies managing hydraulic roughness, focusing flows and achieving an equilibrium channel shape. Where stream bank repair is necessary, it is preferable to reduce the stress acting on the bank while strengthening, rather than hardening, the bank. Lowering the slope of the bank above the effective discharge elevation and increasing the near-bank hydraulic roughness will lower the applied shear stress. Vegetative reinforcement and selective use of armor will provide the necessary strength. Failed stream banks may be stabilized by live-staking where sufficient sunlight is available. Where possible, opposite banks should be stabilized to limit inducing migration into an unstablized bank. Livestakes will not be successful in areas of saline groundwater. 8.4.3 Conclusions The soils in this basin are highly erodible, creating a low threshold for stream disturbance and have induced undesired changes in the stream that threaten people, habitat or property. The channelization of Salt Creek and historic farming practices have induced extensive channel down cutting and widening. There is little evidence that the stream is close to regaining its equilibrium, and the condition is likely to worsen. A major recommendation is the construction of the woody riparian buffer along Little Salt Creek and its tributaries and allowing woody debris jams to develop. Comprehensive grade stabilization, most of it constructed by the stream itself, will remove the driving force for continued bed degradation. Included in the comprehensive grade stabilization recommendation is the construction of grade control structures immediately downstream of the bridge crossings along the Little Salt Creek Main Stem. Whenever bridges are replaced or repaired, detailed consideration should be given to the effect of changes on applied shear stresses. A low flow channel should be maintained through the bridge, and the channel section under the bridge should closely match the channel upstream and downstream of the bridge. Whenever culverts are replaced or modified, outfall protection should be used to protect against erosion and channel degradation at the crossing. Together, these management measures contribute to a more robust, self-managing stream system.