Offshoring and Wage Inequality: Theory and Evidence from China † Liugang Sheng and Dennis Tao Yang September 12, 2019 † Contact information: Sheng, Department of Economics, The Chinese University of Hong Kong, Hong Kong; Email: [email protected]; Yang, Darden School of Business, University of Virginia, Charlottesville, Virginia; E-mail: [email protected]. We thank Robert Feenstra, Pol Antr` as, Costas Arkolakis, Paul Bergin, Andrew Bernard, Davin Chor, Ann Harrison, Zhiyuan Li, Justin Lin, Dan Lu, John McLaren, Lindsay Oldenski, Nina Pavcnik, Stephen Redding, John Ries, Andr´ es Rodr´ ıguez-Clare, John Romalis, Katheryn Russ, Deborah Swenson, Heiwai Tang, as well as the seminar and conference participants from various institutions for their useful com- ments and suggestions. All remaining errors are our own.
Transcript
Offshoring and Wage Inequality: Theory and Evidence from China†
Liugang Sheng and Dennis Tao Yang
September 12, 2019
†Contact information: Sheng, Department of Economics, The Chinese University of Hong
Kong, Hong Kong; Email: [email protected]; Yang, Darden School of Business, University of
Virginia, Charlottesville, Virginia; E-mail: [email protected]. We thank Robert Feenstra,
Pol Antras, Costas Arkolakis, Paul Bergin, Andrew Bernard, Davin Chor, Ann Harrison, Zhiyuan
Li, Justin Lin, Dan Lu, John McLaren, Lindsay Oldenski, Nina Pavcnik, Stephen Redding, John
Ries, Andres Rodrıguez-Clare, John Romalis, Katheryn Russ, Deborah Swenson, Heiwai Tang, as
well as the seminar and conference participants from various institutions for their useful com-
ments and suggestions. All remaining errors are our own.
Abstract
We present a global production sharing model that integrates the organizational choices
of offshoring into the determination of relative wages in developing countries. The model
shows that offshoring through foreign direct investment contributes more prominently
than arm’s length outsourcing to the demand for skill in the South, thereby increasing
the relative wage of skilled workers. We incorporate these theoretical results into an
augmented Mincer earnings function and test the model based on a natural experiment
in which China lifted its restrictions on foreign ownership for multinational companies
upon its accession to the World Trade Organization in 2001. Empirical findings based
on detailed Urban Household Surveys and trade data from Chinese customs provide
support to our proposed theory, thus shedding light on the changes in firm ownership
structure, the skill upgrading in exports, and the evolution of wage inequality from 1992
to 2008 in China’s manufacturing sector.
Key words: Offshoring, ownership structure, processing trade, wage inequality, China
JEL classification: F16, J31, D23
1 Introduction
In recent decades, trade in intermediate inputs through FDI and arm’s length off-
shoring has gained prominence in the global economy. Approximately two-thirds of the
world trade consist of transactions in intermediate inputs, and about half of such trans-
actions are conducted within the boundaries of multinational companies (MNCs).1 The
dramatic rise of offshoring has stimulated many researchers to investigate the microeco-
nomic structure and the effect of global sourcing on wage inequality. Seminal papers,
such as those of Antras (2003) and Antras and Helpman (2004), have investigated firms’
offshoring decision and organizational choices between FDI and outsourcing. A key in-
sight is that the ownership structure of offshoring greatly depends on the factor intensity
(i.e., headquarter service or skill content) of offshored production. Meanwhile, the pio-
neering work of Feenstra and Hanson (1996) and subsequent studies have examined the
effect of aggregate offshoring on the skill premia,2 without distinguishing the two types
of offshoring. Surprisingly, previous studies have not yet explored systematically the
effects of microeconomic structure of offshoring on wage inequality in developing coun-
tries despite the comparable importance of FDI and arm’s length offshoring in the global
economy.
This paper develops a framework that integrates the ownership structure of offshoring
into the determination of relative wages in developing countries and draws empirical ev-
idence from China. China provides a unique laboratory to test our model for two rea-
sons. First, China emerged as “the world’s factory” after its accession to the World Trade
Organization (WTO) in 2001 while becoming “the magnet for FDI” among developing
countries. Foreign firms contributed approximately one-third to the gross industrial out-
1See Johnson and Noguera (2012). Corroborative estimates from UNCTAD (1999, p. 232) show thatone-third of the world trade comprised intermediate inputs exchanged within firms.
2For instance, Feenstra and Hanson (1997, 1999), Hsieh and Woo (2005), and Zhu and Trefler (2005) findempirical evidence that offshoring increased the skill premia in both developed and developing countries.Ottaviano et al. (2013) study the differential roles of offshoring and immigration on native employment inthe U.S. See Goldberg and Pavcnik (2007) and Hummels et al. (2016) for a literature review.
1
put of China.3 Second, China provides an intriguing natural experiment of changing
policy regimes in regulating foreign investment. Until the late 1990s, the Chinese gov-
ernment had imposed restrictions on wholly foreign-owned companies yet encouraged
joint ventures and arm’s length offshoring. However, upon its accession to the WTO,
China began to relax its ownership restrictions on MNCs in the manufacturing sector.
Since then, wholly foreign-owned affiliates have grown extensively and have become
dominant forces in foreign investment and processing trade. Such liberalization of MNC
ownership, which is induced largely by external factors, presents a unique opportunity
for investigating the effects of the ownership structural changes of offshoring on skill
upgrading in exports and skill premium in China.
Figure 1 presents two empirical observations that motivate the current study. Figure
1(a) shows that the composition of FDI and arm’s length offshoring in China has changed
dramatically over time.4 Although both types of processing exports grew at an approx-
imately equal rate prior to 2001, the growth of FDI processing exports outpaced that of
outsourcing since China’s accession to the WTO. Closely correlated to this timing, Figure
1(b) illustrates that the college wage premium in the Chinese manufacturing sector re-
mained flat before 2001 but increased dramatically thereafter. The average earnings gap
between workers with and without college education was approximately 30% throughout
the 1990s, but the skill premium increased to 55% by 2006. These empirical observations
raise important questions that this papers seeks to answer. What policies and institu-
tions can affect the composition of FDI and arm’s length offshoring in the South? How
3According to statistical yearbooks published by the National Bureau of Statistics (NBS) of China, for-eign firms accounted for 32% and 28% of gross industrial output and value added in 2006, respectively, andapproximately half of such came from wholly foreign-owned firms. NBS stopped reporting these figuresafter 2006, but the contribution of foreign firms has grown in the past decade.
4FDI offshoring is measured as the processing exports of wholly foreign-owned enterprises, whereasarm’s length offshoring is defined as the processing exports of joint ventures and Chinese domestic firms.We use processing exports as a measure of offshoring because such activity involves a foreign firm thateither works with its own affiliates or contracts with local firms to assemble imported inputs with local fac-tors and re-export products to foreign markets. In other words, processing exports are offshored productionfrom foreign countries (Feenstra and Hanson, 2005). Processing exports play a major role in internationaltrade in China, accounting for an average of 56% of the total exports of the country from 1992 to 2008.
2
can different types of offshoring influence the skill demand in developing countries and
therefore affect the returns to skill?
We address these questions by developing a two-country, two-factor model of off-
shoring and wage inequality in developing countries. By introducing the property rights
theory (Grossman and Hart, 1986; Antras, 2005) into the offshoring framework (Feenstra
and Hanson, 1996), our model not only disentangles the role of comparative advantage
and contractual frictions in shaping the pattern of global sourcing, but also illustrates two
different channels through which offshoring can affect the skill demand in the South. The
first channel is the Feenstra-Hanson mechanism through which the relatively more skill-
intensive products offshored from the North increases the skill demand in the South. The
second is the ownership mechanism (e.g., Antras, 2003; Antras and Helpman, 2004; here-
after referred to as the Antras mechanism) in which multinationals offshore more skill-
intensive production to its foreign affiliates and outsource low-skill activities because of
incomplete contracts in the South. Accordingly, FDI offshoring contributes more than
outsourcing to the skill demand in the South. Based on the model, we analyze two sets
of institutional and policy reforms, namely, ownership liberalization of the MNCs and re-
duction in offshoring cost in host countries, that can attract FDI offshoring, thus increas-
ing the demand for and returns to skill in the South. The ownership mechanism forges a
novel and potentially important linkage between offshoring and skill premium because
of the prevalence of ownership restrictions and high offshoring cost in many developing
countries (Kalinova et al., 2010; UNCTAD, 2006). To test our model predictions, we incor-
porate the theoretical results into an augmented Mincer wage regression to examine the
determinants of skill premium with an implementable empirical specification.
In the empirical analysis, we processed and combined three comprehensive datasets
that cover the years from 1992 to 2008, namely, (a) the national sample of Chinese Ur-
ban Household Surveys (CUHS), which contains rich information on earnings and de-
mographic characteristics of households and individuals, (b) the Chinese customs trade
3
data that contain detailed descriptions of by-product exports and firm characteristics, and
(c) aggregate variables that capture the institutional and economic conditions of labor
markets at the province level. We also constructed two indicator variables for “encour-
agement” and “restriction” policies by industry based on a series of government deregu-
lation policies that liberalize the ownership structure of MNCs. Moreover, we measured
local offshoring costs by using information on the transportation infrastructure and accu-
mulative numbers of national policy zones.
Under a two-stage identification strategy, we find that FDI offshoring is more skill in-
tensive than arm’s length offshoring, thereby confirming a key result of the model. More-
over, the ownership liberalization of MNCs and the reduction in offshoring costs generate
an asymmetric effect by increasing FDI offshoring more than arm’s length offshoring. In
the second stage, we estimate the augmented Mincer regression based on rich spatial and
time variations in trade exposure because the CUHS and trade data cover 30 Chinese
provinces for 14 and 16 years respectively. The regression estimates indicate that aggre-
gate offshoring (the Feenstra-Hanson mechanism) and the share of FDI offshoring (the
Antras mechanism) are both important determinants of college wage premium in China.
These findings are robust to alternative control variables and other sensitivity checks, in-
cluding the endogeneity of worker ability and the selection of locations by multinationals.
The FDI offshoring triggered by the ownership liberalization of MNCs and the reduction
in offshoring cost can quantitatively explain approximately 34% of the increase in college
wage premium in the Chinese manufacturing sector between 2000 and 2006. The effect
of FDI offshoring far exceeds that of skill-biased technological changes and capital-skill
complementarity.
This paper is closely related to the literature on the organization of multinationals
in global production.5 Previous studies mainly focus on the joint determination of off-
shoring and the organizational structure of firms, without exploring the consequences
5Other representative studies, which are not yet cited, include Grossman and Helpman (2005) andCostinot et al. (2011).
4
of MNC decisions on factor prices. By introducing skilled and unskilled labor into the
framework, we forge a link between the behavior of multinationals and skill demand in
developing countries. We also investigate the institutional foundation of an MNC’s or-
ganizational choice, namely, the regulations on foreign ownership and the government
policies that affect offshoring costs, which complement the emphasis on incomplete con-
tracts. To the best of our knowledge, this study is the first to identify the significant effect
of the organizational structure of offshoring on wage inequality in a large developing
country. Therefore, this paper contributes to the broader literature on globalization and
income distribution.
The influential works of Feenstra and Hanson (1996) and subsequent studies analyze
the effect of aggregate offshoring on wage inequality with an emphasis on the North (e.g.,
Grossman and Rossi-Hansberg, 2008; Hummels et al., 2014). This study departs from the
literature by distinguishing FDI from arm’s length offshoring. The differential effects
of two types of offshoring on the demand for skill highlight the importance of policy
reforms in developing countries because removing restrictions on foreign ownership and
lowering offshoring costs can induce MNCs to transfer skill-intensive production to the
South.
This study also contributes to the burgeoning literature on the effect of globalization
on income inequality in developing countries.6 In the context of China, Han et al. (2012)
found that trade liberalization upon China’s WTO accession increases within-region wage
inequality by raising returns to education in urban China based on CUHS data from five
provinces. By developing a quantitative model that incorporates international and intra-
national trade as well as migration costs in China, Fan (2019) showed that the gains from
trade is greater for skilled workers than unskilled workers. Li (2018) found that the skill
content of Chinese exports influence human capital accumulation based on an analysis of
population census data. Although these studies shed light on the effect of trade liberal-
6See Goldberg and Pavcnik (2007) for a comprehensive review on the distributional effect of globaliza-tion in developing countries.
5
ization on income distribution, the underlying mechanisms have yet to be fully explored.
By contrast, this paper highlights the role of FDI offshoring as an important channel in
raising the skill premium in China. This study is also the first to estimate the Mincer wage
regressions in the context of international trade using China’s national urban household
sample covering a long period from 1992 to 2006.
The rest of this paper is organized as follows. Section 2 presents the theoretical frame-
work, derives testable hypotheses in the context of an augmented Mincer equation, and
formulates an identification strategy. Section 3 describes the globalization process in
China, the natural experiment of policy changes, and the data for empirical analysis. Sec-
tion 4 reports the empirical findings. Section 5 presents the concluding remarks with
discussions on policy reforms.
2 Model
In this section, we develop a 2-country× 2-factor model to study the joint decisions of
MNCs on offshoring and ownership structure, with an emphasis on the contractual fric-
tions and institutional environment of the host country. Our model forges a new linkage
between the organizational choice of MNCs and the demand for skill in the South. We
apply this model to investigate the consequences of two policy reforms, namely, owner-
ship liberalization of MNCs and reductions in offshoring cost on the returns to skill in
developing countries.
2.1 Setup
The world consists of two countries, the North and the South. There are two types of
labor, high- and low-skilled workers, which we denote by h and l, respectively. Supply of
labor is fixed and inelastic in two countries, and they are mobile within country but not
across the border. The wages of high- and low-skilled workers in country c are denoted
6
by qc and wc, where c ∈ N,S. The North has more abundant high-skilled labor than the
South. The world has one final good Y for consumption in both countries. The final good
is free traded, and produced with a continuum of differentiated intermediate products.
We assume that the North produces both the final good Y and intermediate products,
while the South only produces intermediate products.
The final good is assumed to be assembled costlessly over a continuum of differenti-
ated intermediate products indexed by z ∈ [0, 1] with a constant-elasticity-of-substitution
form in the North, i.e., Y = [∫ 1
0y(z)αdz]1/α. These goods are substitutes, implying 0 <
α < 1 and the elasticity of substitution between any two products of σ = 1/(1 − α) > 1.
Thus, the demand for each product z is given by y(z) = λp(z)−1/(1−α) where y(z) and p(z)
denote quantity and price, respectively. Moreover, λ measures the aggregate demand for
the differentiated products under the assumption that these products are freely shipped
without costs.
2.2 Intermediate Products
For any differentiated intermediate product z, a Northern innovator carries out R&D
in the North and obtains the technology (blueprint) to produce the high-tech input. The
innovator needs to find a low-tech input supplier in the North or South to manufac-
ture the product. In other words, the innovation and product manufacturing are frag-
mentable.7
The manufacturing of any intermediate product z requires high and low-tech inputs,
denoted as xh and xl respectively. More specifically, the production of the intermediate
product z is given by y(z) = ξzxzhx
1−zl , where ξz = z−z(1 − z)−(1−z) and 0 ≤ z ≤ 1. Thus,
intermediate products are produced with different technologies, and they are ranked by
7Our focus is the effect of offshoring on the labor market in the South. Thus, we avoid complicatedmodeling for the R&D decisions of the Northern innovator. For simplicity, we assume that the Northerninnovator pays a fixed cost f for R&D, which is below a threshold, such that each product will be producedin equilibrium. We further normalize the fixed cost to zero in subsequent analyses, which does not affectour model predictions.
7
the intensity of high-tech inputs. To simplify the exposition, we assume that one unit of
high-tech (low-tech) input requires one unit of high-skilled labor h (low-skilled l).8 We
also assume that the manufacturing of each intermediate product z is not fragmentable;
that is, the production of its two inputs takes place at the same location.9
For an intermediate good z, only the Northern innovator has the technology (blueprint)
for producing the high-tech input; however, she needs to find a low-tech input supplier
in the North or the South. The investments by the two parties are assumed to be relation-
specific. The contract environment is a key difference between the North and the South.
If the Northern innovator chooses to produce domestically, the contract is assumed to
be complete. However, if the innovator offshores to produce the product, then she faces
incomplete contracts because of poor legal environments in the South. With incomplete
contracts, the quality of the inputs xh and xl is not verifiable by a third party. Therefore,
on the basis of the literature of incomplete contracts (Grossman and Hart, 1986; Antras,
2005), we assume that the Northern innovator chooses the ownership structure (O) of
joint production. She can either set up a foreign affiliate (O = F ), or outsource produc-
tion to a Southern supplier (O = D). The supplier needs to pay the innovator a lump-sum
transfer T as a participation fee because many suppliers compete for the job in the South.
This fee results in the Southern supplier to break-even. Moreover, the Northern innovator
needs to pay an offshoring cost proportional to the output of z. Thus, for one unit of z,
the offshoring cost is t− 1 unit with t ≥ 1.
The above specifications on intermediate goods production are built on Antras (2005).
However, they have two noticeable differences because our research question is different
from his study on product cycle. First, we extend his model by including two types of
8We can relax this assumption to accommodate differences in labor productivity across countries.9Note that Feenstra and Hanson (1996, 1997) assumed non-fragmentable production of each interme-
diate good to evaluate the effect of offshoring on the skill premium. This assumption reflects the realitythat a processing firm in the South must hire high-skilled labor, such as managers and engineers, even ifa low-tech intensive product z is offshored to the South. The firm still requires production management,training, quality control, and so on. This assumption allows various outcomes for offshoring and demandfor skills in the South.
8
labor to examine the effect of offshoring on the demand for skill in the South. Second,
different from his model where only the low-tech inputs are offshorable, we assume that
for a given intermediate input z, the production of its two inputs takes place at the same
location, whereas different intermediate products z are produced either in the North or
the South depending on their high-tech input intensities. These specifications allow for
various outcomes to study the effect of offshoring on skill demand and wage inequality
in the South.
Now consider a Northern innovator who locates her production in the North. Given
that the contract is complete, the firm chooses low-skilled workers lN and high-skilled
worker hN to maximize π = R(z)− qNhN −wN lN , given R(z) = λ1−αy(z)α. This yields the
following profit:
πN(z) = (1− α)λ[α(1/qN)z(1/wN)(1−z)]α/(1−α) (1)
If the Northern innovator chooses to offshore, then the innovator and the Southern
supplier will engage in symmetric Nash bargaining over the surplus after production
from their relation-specific investments because of incomplete contracts in the South.
Symmetric Nash bargaining implies that the innovator and the supplier each obtains half
of the surplus, if the contract does not hold. Therefore, the ex-post revenue share of the
Northern innovator β is determined by the bargaining share and outside options associ-
ated the ownership structure. More specifically, if the innovator owns the firm (O = F ),
then it can fire the low-tech supplier in case they do not achieve an agreement with
bargaining. Although the supplier is left with nothing, the innovator can still obtain δ
fraction of the output, where 0 < δ < 1, and thereby generate a revenue of δαR. The
quasi-rent of this relationship is (1 − δα)R. Bargaining leaves each party with its outside
option plus one-half of the quasi-rent. Hence, the ex post revenue share of the innovator
is βF = 12(1 + δα). By contrast, if the Southern supplier owns the firm (O = D), then the
9
innovator’s share of revenue is βD = 12(1−δα). Clearly, we have 0 < βD < 1/2 < βF < 1.10
Since the delivery of the inputs xh and xl are not contractible ex ante, the two parties
choose their quantities to maximize their own payoffs. The supplier sets lS to maximize
(1− β)R(z)−wSlS , and the Northern innovator sets hS to maximize βR(z)− qShS , where
R(z) = λ1−αy(z)α/tα and β ∈ [0, 1] denotes the revenue share of the Northern innovator.
Moreover, before their relationship has been formed, the Northern innovator also offers
the contract by requesting a participation fee T from the suppliers whose outside option
is zero. Thus, the Northern innovator chooses T to make the low-tech supplier break even
To begin with, we consider a hypothetical case in which both the North and the South
have complete contracts. Let N(z) denote the corresponding “log profit ratio” of the
10The previous version of the paper shows that the qualitative results of the model continue to hold inthe presence of joint ventures with β = 1/2, which indicates that each party has the veto power.
10
Northern production relative to the Southern production:
N(z) ≡ 1− αα
ln(πN(z)/πS(z)) = z ln(ωl/ωh)− lnωl + ln t (3)
where ωh = qN/qS and ωl = wN/wS . Given that the North has an abundant supply
of high-skilled labor, we assume that ωh < ωl. To rule out the extreme case in which
all products are produced in one location, we assume that ωh < t < ωl. In this case,
N(z) increases in z, and there exists an unique interior solution z∗(t) ∈ (0, 1) such that
N(z∗(t)) = 0. Therefore, more skill-intensive intermediate goods (z > z∗(t)) are produced
in the North, and less skill-intensive intermediate goods (z < z∗(t)) are offshored to the
South. In this artificial case, our model generates the same pattern as in Feenstra and Han-
son (1996), who found that comparative advantage plays a crucial role in the allocation
of global production sharing. Moreover, the offshoring cost dampens the comparative
advantage of the South. In this case, a reduction in offshoring costs can help attract more
skill-intensive products to relocate to the South.
Next, we characterize the global production sharing when the contracts are incomplete
in the South. We define the “log profit ratio” of the Southern production under different
ownership choices relative to that of the Southern production with complete contracts as
follows:
S(z, β) ≡ 1− αα
ln(πS(z, β)/πS(z)) (4)
= z lnβ
1− β+ ln(1− β) +
1− αα
[ln(1− αβz − α(1− β)(1− z))− ln(1− α)]
where β ∈ (0, 1). This normalization procedure cancels out most of the common factors
in the profit function πS(z, β), such as the demand shifter λ, factor prices, and offshoring
costs, but highlights the key factors of ownership choice. The ownership choice in the
South is independent of factor prices, offshoring costs, and the demand shifter, instead
it only depends on the skill intensity of the product. Appendix A shows that S(z, β) is
11
supermodular in (z, β), concave in z, and strictly concave in β. Thus, for a given value of
z ∈ [0, 1], there is a unique maximizer β∗(z) ∈ [0, 1], and β∗(z) increases in z. Supermod-
ularity implies that the optimal revenue share of the Northern innovator is (positively)
determined by the skill intensity of the intermediate goods z, and this result captures
the spirit of the property right theory of the firm (Grossman and Hart, 1986; Hart and
Moore, 1990). Appendix B shows that among the offshored products, the Northern inno-
vators offshore more skill-intensive intermediate goods through their own affiliates and
outsource less skill-intensive intermediate goods to Southern suppliers.
We then analyze the joint decisions of the Northern innovator on sourcing locations
and ownership choices based on the comparison between the log profit ratios of the
Northern and Southern productions with ownership choices (N(z) and S(z, βO) for O =
F,D). To formally characterize the patterns of global production and ownership struc-
ture, we assume the following:
Assumption 1 (1) ωh < t; (2) ωl > t1−βF [ 1−α
1−α(1−βF )]
1−αα .
This assumption essentially rules out the extreme cases in which all products are pro-
duced in one location. The first part guarantees that the most skill-intensive product
z = 1 is produced in the North, in which the second part guarantees that the least skill-
intensive product z = 0 is produced in the South.11 Figure 2 plots the curves of log profit
ratios N(z), S(z, βD), and S(z, βF ), while Appendix A-C discuss the properties of these
curves in detail. The optimal choices for Northern innovators are the upper contour of
the three log profit ratios. Based on this assumption, we present our main proposition as
follows:
11This assumption imposes an upper bound for βF , that is, βF < β ≡ f−1(ωl/t), where f(β) =1
(1−β) [ 1−α1−α(1−β) ]
1−αα . The intuition for this upper bound for the Northern innovator’s revenue share is that
the South supplier will have little incentive to invest in low-tech input if his revenue share (1 − β) is closeto 0. f(β) is an increasing function. Therefore, if βF satisfies this inequality, then this inequality also holdsfor βD. Given that the upper bound depends on ωl and t, this assumption is more likely to hold if theoffshoring cost is low, given ωl.
12
Proposition 1 If Assumption 1 holds and three production modes coexist, then there exists two
unique cutoffs (z∗FN(t), z∗DF ), such that the more skill-intensive intermediate goods are produced
in the North (z > z∗FN(t)), the middle range skill-intensive goods are produced through FDI
offshoring (z∗FN(t) > z > z∗DF ), and the less skill-intensive goods are outsourced to the South
(z < z∗DF ). As offshoring cost t decreases, z∗FN(t) increases.
The proof in Appendix C is largely in line with the findings of Antras (2005).12 Figure
2 disentangles the role of comparative advantage and incomplete contracts in the global
production sharing in an integrated framework. The horizontal axis presents the bench-
mark, namely, the log profit ratio of production in the South with complete contracts
relative to itself. Thus, the upper contour of the curve N(z) and the horizontal axis to-
gether characterize the global production sharing with the North-South cutoff z∗(t) in a
contractual frictionless world of Feenstra and Hanson (1996). To the left of the cutoff, the
South specializes in less skill-intensive products because of her comparative advantage,
while to the right of the cutoff, the North specializes in more skill-intensive products.
By contrast, the upper contour of the three curves for N(z), S(z, βD), and S(z, βF ) de-
picts global production sharing with incomplete contracts in the South. The comparative
advantage still plays an important role, but incomplete contracts lead to an efficiency loss
both at the intensive margin (a profit loss for any given z when production takes in the
South) and extensive margin because fewer products would be offshored to the South
due to the reduced profits of Southern production. With incomplete contracts, the North-
South cutoff moves to z∗FN(t), and the product range between z∗FN(t) and z∗(t) reflects the
efficiency loss at the extensive margin. Importantly, these products that are potentially
offshorable to the South are skill intensive and are thereby relevant for high-skilled labor.
Moreover, the area between the upper contour of S(z, βD), S(z, βF ) and the horizontal
axis reflects the efficiency loss at the intensive margin due to the incomplete contracts in
12This proposition shows the pattern in which three production modes coexist. However, FDI offshoringmay not exist under certain conditions. Figure 2 provides a sufficient frameworks for conducting a generalanalysis.
13
the South.
2.4 Ownership Liberalization and Offshoring Cost
The model developed above can be applied to analyze the effects of ownership liber-
alization and reduction in offshoring cost on the patterns of offshoring. Figure 3 shows
that a decline in offshoring cost can be captured by shifting down the curveN(z) from the
solid line to the dotted line. Initially, when offshoring cost is high, the equilibrium cutoff
is z∗DN , that is, the Northern innovator only outsources limited low skill-intensive prod-
ucts through arm’s length contracting because a high offshoring cost dampens the com-
parative advantage of production in the South. No FDI offshoring occurs even if foreign
ownership is legally allowed. As the offshoring cost declines, when N(z) moves to the
right of the intercept of S(z, βD) and S(z, βF ), the MNC finds it profitable to offshore more
skill-intensive products to the South through their foreign affiliates.13 The model suggests
that when both organization forms coexist as shown in Figure 2, reductions in offshoring
costs have a stronger effect on FDI offshoring than on arm’s length offshoring in terms
of export revenue. While Appendix D presents the proof of this result, the intuition is
straightforward. Given that the revenue elasticities of offshoring cost is −α/(1 − α) for
both ownership types, a decline in offshoring cost increases the intensive margin of each
firm type proportionally for any given z. However, a reduction in offshoring cost also
increases the extensive margin of FDI offshoring but not the arm’s length transactions.
As a result, the export share of FDI offshoring increases with a decreasing offshoring cost.
Our model also provides a framework for analyzing the impact of ownership restric-
tion and liberalization of MNCs on the offshoring pattern and skill demand in the South.
13FDI offshoring is an optimal choice for skill-intensive products when z∗DN > z∗DF , as shown in Figure2. It would be ideal to pin down from the model the parameter conditions for z∗DN > z∗DF . Althoughwe show the existence of z∗DN and z∗DF in Appendices B and C, respectively, their close-form solutions areunavailable. Therefore, we cannot derive the exact parameter ranges for z∗DN > z∗DF . However, AppendixB shows that z∗DF is independent of offshoring cost t, whereas Appendix C shows that z∗DN increases withthe decrease of offshoring cost t, that is, more products are offshored to the South when offshoring costdeclines. Hence, it is more likely that z∗DN > z∗DF , when the offshoring cost is low.
14
Governments in developing countries often interfere with the ownership structures of
MNCs for several reasons including reducing competition with indigenous firms, pro-
moting technology transfer through joint ventures, and protecting strategic sectors (e.g.,
Kobrin, 1987; Gomes-Casseres, 1990). Figure 4 illustrates that when foreign ownership
is prohibited, the FDI offshoring curve S(z, βF ) is no longer in the MNC’s choice set.
The global production sharing settles at the intercept of S(z, βD) and N(z), where goods
within [0, z∗DN ] are offshored to the South through arm’s length transactions and all re-
maining production takes place in the North. Ownership liberalization can realize signif-
reduces to [0, z∗DF ], FDI offshoring expands to [z∗DF , z∗FN ], and the total offshoring to the
South grows by [z∗DN , z∗FN ]. Therefore, relaxing ownership restrictions promotes a skill
upgrade by relocating more skill-intensive production to the South. Accordingly, the ex-
pansion of FDI offshoring generates efficiency gains for the economy–as reflected by the
triangle area below S(z, βF ) and above S(z, βD) and N(z)–through optimizing the own-
ership structure.14 The following proposition summarizes our findings:
Proposition 2 If the offshoring cost is relatively low, the ownership liberalization and reduc-
tion in offshoring cost both increase the North-South production cutoff, that is, shifting more
skill-intensive products to the South through FDI offshoring, thereby increasing the share of FDI
offshoring.
2.5 Skill Premium
The model suggests a set of mechanisms through which institutions and offshoring
costs affect skill demand, and thereby the skill premium, in the South. First, we show
the property of relative skill demand for a given intermediate good. For simplicity of
exposition, we omit the superscript S that denotes the South.
14These analyses are applicable to the scenario in which both forms of offshoring coexist, a situation thatcharacterizes the empirical environment of China in the later empirical analysis.
15
Proposition 3 The relative demand for high-skilled labor for each product z, that is, h(z, β)/l(z, β) =
βz(1−β)(1−z)
wq
, increases in z and β but decreases in the relative wage of high-skilled labor.
This proposition indicates two channels through which offshoring increases skill de-
mand in the South. The first is the extensive margin in which skill demand increases when
more skill-intensive intermediate goods with higher z are offshored to the South. The sec-
ond is the intensive margin in which for given product z, a higher value of β associated
with the bargaining power of the MNC also increases the firm’s demand for high-skilled
labor. We then define the aggregate relative skill demand in the South as follows:
D(q/w, t,Ψ) =
∑βO∈Ψ
∫ΩΨh(z, βO)dz∑
βO∈Ψ
∫ΩΨl(z, βO)dz
, (5)
where Ψ denotes the ownership choice set, Ψ = βD, βD, βF. ΩΨ = [0, z∗DN ] if Ψ =
βD, and ΩΨ = ΩD ∪ΩF = [0, z∗DF ] ∪ [z∗DF , z∗FN ] if Ψ = βD, βF. We derive the following
proposition:
Proposition 4 (1) A reduction in offshoring cost raises the cutoff between North-South produc-
tion, which in turn increases the aggregate relative skill demand in the South.
(2) If offshoring cost is relatively low and 0 < α ≤ 1/2, the ownership liberalization for multina-
tionals increases the aggregate relative skill demand in the South.
(3) Ceteris paribus, ownership liberalization and a reduction in offshoring cost increase the skill
premium in the South.
The proofs are presented in Appendix E. Proposition 4 (1) shows the Feenstra-Hanson
mechanism where the aggregate relative skill demand increases when more products are
offshored to the South. This effect exists even in the presence of ownership restrictions.
However, the increase in skill demand is limited when arm’s length outsourcing is the
only option. Proposition 4 (2) presents the Antras’ ownership mechanism. After remov-
ing the ownership restriction, the aggregate relative skill demand increases through both
16
the extensive and intensive margins. In this case, more skill-intensive products are off-
shored by foreign affiliates, and the skill demand increases when firms switch from arm’s
length offshoring to FDI offshoring.
Given that the aggregate relative skill demand has a downward slope with 0 < α ≤
1/2, and with the assumption of an exogenously given relative skill supply, the skill pre-
mium increases as the aggregate relative skill demand shifts upward due to ownership
liberalization or a reduction in offshoring cost. Therefore, Proposition 4 (3) follows.
3 Data and Empirical Strategy
Our empirical strategy centers on a two-step procedure developed from Proposition
2 on the determinants of FDI offshoring and Proposition 4 on the effects of offshoring on
skill premium. We test the results by using an augmented Mincer earnings function that
connects the aggregate demand for skill to an empirical specification that is amenable
for estimating the impact of offshoring on wage inequality. We also describe the three
datasets that we used for the empirical analysis and explain the measurement of two key
explanatory variables, namely, FDI ownership liberalization and offshoring costs, both of
which are related to Chinese institutions and geography.
3.1 An Augmented Mincer Equation
The Mincer wage equation is widely used in analyzing the effects of investment in
schooling and skill on individual earnings. Our empirical specification builds on the
following basic form:
lnW (C,Φ) = α0 + α1C +α′2Φ + ε, (6)
where W (C,Φ) is the individual wage income at schooling level C and personal charac-
teristics Φ. In our study, C is a dummy variable for college graduates, which correspond
to high-skilled workers. Meanwhile, those without college education correspond to low-
17
skilled workers. Φ is a vector of other personal attributes that affect earnings, including
labor market experience, experience squared, gender, and a dummy variable for employ-
ment in the state sector. ε is a mean zero residual E(ε|C,Φ) = 0.
The coefficient of the dummy variable of schooling represents college wage premium
in percentage terms, that is, α1 = E(lnW |C = 1,Φ) − E(lnW |C = 0,Φ) = ln(q/w),
where q and w are the market equilibrium wages for college and non-college workers in
the South as specified in equation (3). Equation (5) implies that the college wage pre-
mium increases along with the aggregate relative skill demand through its inverse func-
tion ln(q/w) = lnD−1(t,Ψ), where a decline in offshoring cost t and an expansion in an
MNC’s offshoring ownership choice set Ψ can both increase the skill premium α1 as stated
in Proposition 4. Hence, we obtain an augmented Mincer wage equation that takes into
account the effects of offshoring on college wage premium:
lnW (C,Φ, t,Ψ) = α0 + α1(t,Ψ)C +α′2Φ + ε. (7)
3.2 Two-Stage Procedure
While equation (7) implies a direct connection between (t,Ψ) and college wage pre-
mium, our offshoring model provides a structural framework that allows a deeper inves-
tigation into the mechanisms through which offshoring affects the skill premium. Propo-
sition 2 suggests that falling offshoring costs and relaxing controls on an MNCs’ own-
ership choice increase not only the total offshoring but also the share of FDI offshoring.
Therefore, in the first stage, we assess the role of (t,Ψ) in determining the level and com-
position of offshoring:
lnRO = lnRO(t,Ψ), (8)
where RO is the revenue of processing exports by region and industry for firm ownership
O, where O ∈ D,F can be either domestic or foreign owned. The testable hypothesis
18
from Proposition 2 posits that a reduction in offshoring cost, along with the policies that
encourage foreign ownership, has a stronger positive effect on FDI offshoring relative to
arm’s length outsourcing.
In the second stage, we estimate an augmented Mincer regression that includes the
interaction terms of the college indicator C with regional total offshoring (R) and share
Propositions 2 and 4 suggest that the coefficients (α11 and α12) estimated for both in-
teraction terms are positive. The first coefficient presents a test for the Feenstra-Hanson
mechanism in which the skill premium increases when more productions are offshored to
the South. The second coefficient sheds light on the Antras ownership mechanism for the
composition of offshoring. Conditional on total offshoring, the transfer of skill-intensive
products by MNCs’ foreign affiliates to the South has an additional positive effect on skill
premium.
The two-stage identification strategy directly tests the main propositions (2) and (4) of
our model. The first stage assesses the effects of a reduction in offshoring cost and the
ownership liberalization of MNCs on the patterns of offshoring, while the second stage
identifies the types of offshoring that matter for the skill premium. As another advan-
tage, this strategy deals with the selection bias of MNCs where these companies choose
regions for offshoring based on local conditions, such as the quality of labor force and
other unobserved regional characteristics. In practice, our two-stage procedure offers a
natural instrument variable approach (IV) to deal with this selection issue. We use the ex-
ogenous variables (t,Ψ) to predict the variables (R,RSF ) in equation (8), which can serve
as the instrument variables and help mitigate the endogeneity problems in estimating the
effects of offshoring on the premium in equation (9). We address these specification issues
19
and deal with the ability bias embedded in the estimation of Mincer regressions in later
empirical analyses.
To explore the rich spatial variations in exposure to trade shocks, we implicitly assume
insufficient labor mobility across regions in China. If labor is freely mobile across regions,
then market forces tend to equilibrate the skill premia across regions, thereby making it
difficult to identify the effects of offshoring on wage inequality based on cross-regional
variations. Recent studies show a massive migration as response to trade liberalization
and reductions in migration costs (Fan, 2019; Facchini et al., 2019; Zi, 2019). Despite the
massive migrations across regions, the large spatial disparity in wage level and skill pre-
mia remains. In our urban household survey data, the average wage ratios of the 90th
to 10th percentile of provinces were 2.95 and 2.88 for non-college and college workers in
1992, respectively. By contrast, the corresponding ratios were around 1.5 on average for
the two types of labor across the states in the US. These regional wage ratios in China
have not declined but instead increased slightly to 2.96 and 3.01 in 2006, indicating that
migration costs cross regions are still substantial (Tombe and Zhu, 2015). Given the per-
sistent regional wage gaps and insufficient labor mobility across Chinese provinces, we
explore regional variations to identify the impact of offshoring on labor market outcomes.
In the sensitivity analysis, we will explicitly discuss the implications of migration on skill
premium, and directly control for the reduction in migration costs due to the reform on
Chinese Hukou system in our regression analysis.
3.3 Data and Policy Variables
We use three comprehensive data sources for our empirical analysis, namely, the own-
ership liberalization policy measure at the industrial level that we have constructed our-
selves (1995-2007), trade data from Chinese customs (1992-2008), and the Chinese Ur-
ban Household Surveys (CUHS 1992-2006). Both the trade and labor datasets cover all
provinces in mainland China except Tibet due to missing data in CUHS.
20
The experiment of ownership liberalization for foreign investment in China provides
a unique opportunity to test our model. As early as 1979, the Chinese government started
to encourage joint ventures, which was considered an effective way to learn management
skills and the latest technologies from advanced foreign countries. However, wholly
foreign ownership was restricted or prohibited in many manufacturing industries un-
til China’s accession to the WTO. For example, washing machines, refrigerators, and air
conditioners were on the restriction list for foreign ownership in 1995 according to the
Catalogue for the Guidance of Foreign Investment Industries (CGFII) published by the
National Development and Reform Commission. This ownership restriction industry
policy was against the spirit of the WTO Agreement on Trade-Related Investment Mea-
sures (TRIMs), which precludes the WTO members from imposing restrictions or dis-
tortions on foreign investment. Thus, the Chinese government undertook a major legal
and economic reform in regulating foreign investment in the late 1990s to remove for-
eign investment barriers. One major effort was revising the CGFII to relax the ownership
controls gradually by increasing the encouragement coverage and decreasing the restric-
tion coverage for foreign ownership. As documented by Sheng and Yang (2016), both the
expansion of encouragement coverage and the reduction in restriction/prohibition cover-
age reached their most significant levels around 2001. These policy reforms significantly
changed the composition of foreign direct investment capital inflows to China. Joint ven-
tures played a dominant role before 2001, but the share of wholly foreign-owned firms
has increased to 78% by 2008.
We construct the measure of ownership liberalization by using the official government
list (CGFII) of industries that were encouraged and restricted (or prohibited) for foreign
investment. The CGFII was first published in 1995 and was revised subsequently in 1997,
2002, 2004, and 2007. 15 In encouraged industries, foreign investors were given more free-
15Lu et al. (2017) also uses CGFII to document China’s FDI regulation policy changes at industrial levelbetween 1997 and 2002 to identify the effect of FDI spillover. Our analysis is more comprehensive as weinclude all versions of CGFIIs published between 1995-2007.
21
dom to choose their ownership structures and enjoyed other advantages, such as prefer-
able corporate tax rates, low land costs, and duty-free imported inputs. By contrast, the
Chinese government imposed stringent restrictions on ownership structures and high en-
try costs for foreign investors in restricted or prohibited industries. For the subsequent
regression analysis, we construct two proxies for ownership liberalization at the industry
level, namely, an encouragement policy indicator and a restriction (including prohibited)
policy indicator. We assign a value of 1 to the encouragement (or restriction) policy in an
industry if at least one product in that industry is formally stated on the government’s
encouragement (or restriction) list, that is, EPit = 1 (or RPit = 1); otherwise, we assign a
value of 0 to that industry. Therefore, the reference group consists of industries without
policy interventions, and these two policy indicators capture the effects of ownership reg-
ulations. We also assume that no policy is changed until a formal revision is announced
in the published catalogue.16
We use two proxies to measure the reduction in offshoring cost. The first measure is
the cumulative number of national policy zones.17 Recent studies such as Wang (2013)
show that the policy zones in China promote foreign investment and processing trade by
reducing offshoring costs, and Khandelwal and Teachout (2016) also show that firms in
policy zones have better access to infrastructure and customs clearance in Bangladesh and
India. For the second proxy, we follow Limao and Venables (2001) by using infrastructure
or the (log) density of highway and railway, to approximate the reduction in offshoring
costs.
16See Sheng and Yang (2016) for a detailed discussion on the method of variable construction, the ad-vantages and limitations of the indicator approach, and the exogenous nature of ownership policy changes.
17China started to establish special economic zones for its exports in coastal provinces in the early 1980sand later expanded these zones into inland provinces. These policy zones include an Economic and Techno-logical Development Zone, High-Tech Development Area, Bonded Area, and Export Processing Zone. Thecompanies in these zones enjoy various advantages, including low corporate tax rate, duty-free importedinputs, absence of import and export quotas, low land costs, and non-payment of property tax in the firstseveral years. They are also prioritized in streamlined customs clearance and 24-hour customs support.The central government authorized the establishment of national policy zones, and this process is arguablyan exogenous one that is beyond the control of provincial governments. The data are collected from theChina Development Zone Review Announcement Catalogue (NDRC, 2007).
22
The trade dataset records both the value and quantity of export at the product level
(six-digit HS code), the locations and destinations of exporters, firm ownership types, and
the types of Chinese custom regimes. Firm ownership types include Chinese-owned do-
mestic firms, joint ventures, and wholly foreign-owned firms. We use processing exports
as a proxy for offshoring because processing activities involve foreign firms that either
work with their own affiliates or contract with local firms to assemble imported inputs
for exporting to foreign markets. This definition corresponds closely to the specifications
of our model. Moreover, the existing literature also uses processing exports to measure
offshoring in the context of China (e.g., Feenstra and Hanson (2005) and Fernandes and
Tang (2012)).
The Chinese government implemented favorable regulations towards processing trade,
as opposed to ordinary trade, in the period of analysis. Those policies aimed to motivate
foreign firms to shift their offshore production to China and to encourage domestic firms
to process and assemble products for foreign clients. As part of the regulations, the gov-
ernment lowered the costs of importing raw materials and intermediate inputs with free
import duties for processing exports, given that average Chinese tariffs on imports were
still about 8% in 2008 after China’s accession into the WTO. Moreover, processing firms
received exemptions from value-added tax under the condition that they must export the
processed products. These special arrangements provided strong financial incentives for
foreign firms to offshore their production to China for processing and assembly, when
their markets were at home or in other countries outside of China. The share of foreign-
owned and joint ventures in processing exports increased from 39% in 1992 to 85% in
2008, and approximately 90% of processing exports during this period were sold to high-
income countries. Indeed, firms in China could choose ordinary or processing trade; how-
ever, most firms involved in global production sharing selected processing trade given the
favorable policies towards offshoring between 1992 and 2008.
Following the literature of vertical integration in the context of China such as Spencer
23
(2005), Fernandes and Tang (2012), and Luck (2017), we use processing export by wholly
foreign-owned firms to proxy FDI offshoring, and use processing export by other firms to
measure arm’s length offshoring. For the benchmark analysis, the North is represented
by high-income countries based on the World Bank classification.18
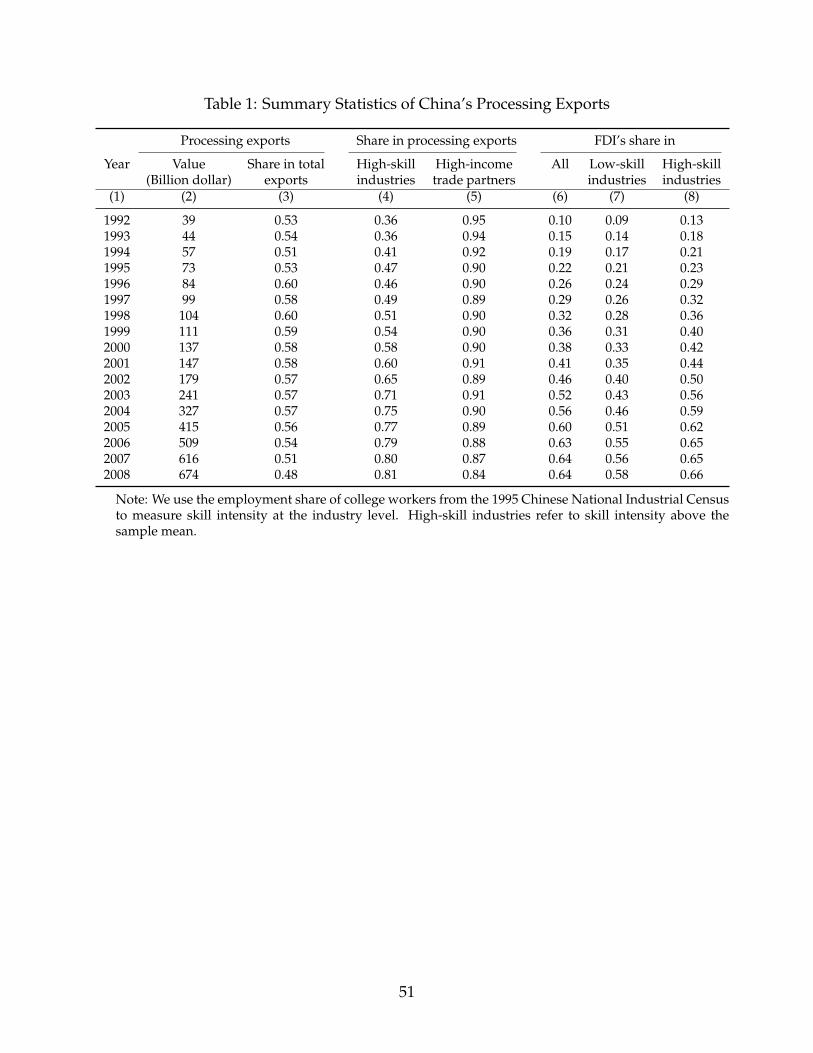
Table 1 presents the summary statistics of China’s processing exports. The data reveals
that processing exports play a major role in China’s international trade and account for
around 56% of the country’s total exports from 1992 to 2008. The share of FDI processing
exports have increased from 10% in 1992 to 64% in 2008, and the shares of FDI processing
exports in high-skilled industries exceeded the shares of FDI processing exports in low-
skilled industries.
The CUHS data records the basic conditions of urban households and provides de-
tailed individual information on the demographic characteristics (age, gender, and mar-
ital status), employment (income, educational attainment, working experience, occupa-
tion, and sector), and geographic residence (city and province). The survey includes in-
formation on 15,000 to 56,000 workers in each sample year. We focus on the annual wages
of manufacturing adult workers who engaged in wage employment. Wage income con-
sists of basic wage, bonus, subsidies, and other labor-related income from regular jobs.
We compute real wage by deflating annual wages to the base year (2006) using province-
specific urban consumption price indices.
18Our definition of high-income countries follows the World Bank’s standard classification, which covers66 countries. Taiwan is not included in the World Bank’s classification even if it qualifies as a high-incomeregion. We add Taiwan into our sample because this region is an important trade partner of mainlandChina. As a robustness check, we also use all of China’s trade partners as North countries. All of our majorempirical results hold for both samples.
24
4 Empirical Findings
4.1 Skill Content of Offshoring
We begin this section by examining the skill content of FDI offshoring and arm’s length
offshoring as proposed in Proposition 1. Figure 5(a) plots the evolution of the average skill
intensity of two types of processing exports, where intensity is defined as the weighted
average of industrial skill intensity, with the industrial shares of processing exports serv-
ing as the weights.19 The intensity measure zi for industry i is the employment share
of workers with college degrees or above in total industrial employment based on the
industrial employment information collected from the 1995 Chinese National Industrial
Census (CNIC1995).20 The figure shows that FDI offshoring is more skill intensive than
arm’s length offshoring and both types of processing exports show a significant skill up-
grading from 1992 to 2008.
Figure 5(b) presents additional evidence on the distribution of skill intensity for pro-
cessing exports by firm ownership type.21 This figure reveals two important findings.
First, the distribution of FDI processing exports is more skewed toward skill-intensive
sectors than that of arm’s length processing exports. In other words, the FDI processing
exports first-order stochastically dominate those of other firms. This feature is more sig-
nificant in 2008 than 1992. Second, processing exports, especially FDI processing, shows a
significant skill upgrading because all distributions shift toward the right direction across
the two years.
Following Delgado et al. (2002), we perform a non-parametric Kolmogorov-Smirnov
(KS) test for the first-order stochastic dominance. We first conduct a two-sided KS test to
19The average skill intensity for the firm ownership type O in year t is defined as zOt =∑i zi(R
Oi,t/∑iR
Oi,t) =
∑i zi ∗ RSOi,t, where O = F,D. zi denotes the skill intensity of industry i, while
ROi,t and RSOi,t denote the value and share of processing exports of industry i in year t for the given firmownership type O.
20Appendix F2 shows more details on data measurement and concordance.21The empirical distribution GO(z) is constructed as follows: GOt (z) =
∑i I(zi ≤ z) ∗RSOi,t, where I(.) is
the indicator function.
25
examine the equality of the two distributions, namely, GF (z) = GD(z). If the hypothesis
is rejected, then perform a one-sided test to examine the first-order stochastic dominance,
that is, GF (z) ≤ GD(z). If the hypothesis is not rejected, and given that GF (z) 6= GD(z),
we will conclude that GF (z) < GD(z).
Panel A in Table 2 presents the p-values for implementing the KS test for each year
from 1992 to 2008. The two-sided test rejects the null for years 1997 to 2008 at the 5%
significance level, whereas the one-sided test does not reject the null for all years in our
sample. The combined results confirm Proposition 1 that FDI processing exports are more
skill intensive than arm’s length processing exports for the years following 1997. The
failure to reject equal skill content prior to 1997 is consistent with the high offshoring costs
in those years when foreign ownership was restricted. Given that few foreign-owned
firms entered the China market, their skill distributions are not statistically different from
those of arm’s length offshoring. However, with the decline in offshoring costs and the
relaxation of restrictions on foreign ownership, MNCs offshored more intermediate goods
through foreign affiliates. As a result, the differences in skill content became statistically
significant.
This two-step KS testing procedure can be applied to examine the skill upgrading in
the processing exports for each type of firm. Panel B in Table 2 presents the results for
each five-year interval from 1992 to 2007. The two-sided test rejects the null at the 5%
significance level, while the one-sided test fails to reject the null for all firms in three time
regimes. These findings imply the significant skill upgrading in the processing exports
for all firms. The processing exports by foreign-owned firms became more skill intensive
than those by arm’s length contracts only after 1997. Therefore, the skill upgrading of all
firms was initially similar but became faster in FDI processing exports in later years.
We calculate the contribution of FDI processing exports to the skill content in total
processing exports by computing the ratio of the skill content in FDI processing exports to
that of total processing export, that is, skshrFt =∑
i ziRFi,t/∑
i ziRi,t = (zF/z)(∑
iRFi,t/∑
iRi,t) =
26
ZF ∗RSFt , whereZF = zF/z is the relative average skill intensity of FDI processing exports
in year t, and RSFt =∑
iRFi,t/∑
iRi,t is the revenue share of foreign owned firms in total
processing exports. Our calculation reveals that FDI’s weighted contribution has risen
from 12% to approximately 70% of the total skill content in processing exports. Therefore,
FDI is mainly responsible for the increase of the skill content in processing exports.22
4.2 Offshoring and Ownership Structure
Given that FDI processing exports are more skill intensive than arm’s length off-
shoring, their composition and distribution have important implications for skill demand
and skill premium. Accordingly, we examine different determinants of these two types
of processing exports across regions and industries. In particular, we test whether off-
shoring cost reduction and ownership liberalization increase both the total processing
exports and the proportion of FDI offshoring as predicted in Proposition (2).
Our model shows that the revenue of the MNC is log linear in offshoring cost, owner-
ship type, and factor prices (see equation D.1 in Appendix D). For regression specification,
the dependent variable ln(Roijt) denotes the log value of processing exports of firm own-
ership type o in industry i, province j, and year t. To assess the effects of different policies,
we interact the foreign ownership indicator variable Foijt with the encouragement policy
(EPit), the restriction policy (RPit), and the measures of offshoring cost reduction (Costjt),
22Data limitations prevent us from considering “within” industrial skill upgrading, such as in Hsieh andWoo (2005). Corroborative evidence from the National Economic Census in 2004 shows that the employ-ment share of skilled workers in foreign-owned firms is higher than that in other firms (Chen et al., 2011).We match these census data with the Chinese firm-level customs data to identify all processing firms, andwe find that the employment share of college graduates in wholly foreign-owned enterprises is 6 percent-age points higher than that in other firms. This skill comparison is largely consistent with internationalevidence that foreign firms are relatively more skill and capital intensive than domestic firms.
27
In this specification, the linear coefficients ρ shed light on the effects of industrial pol-
icy and offshoring cost variables on outsourcing processing export, while the coefficients
γ capture the effects of these variables on FDI processing export relative to outsourcing.
We focus on the magnitudes and signs of γ and expect γ1 > 0, γ2 < 0, and γ3 > 0 be-
cause the cost is measured in transport infrastructure and number of policy zones. We
also expect that the total effects of encouragement (restriction) policy and offshoring cost
reduction have positive (negative) on processing exports. Although the model predicts a
competition from the entry of foreign affiliates after ownership liberalization that can re-
duce outsourcing exports, we have not analyzed other empirically relevant counter-acting
forces in our model. For example, the learning effects that are associated with knowledge
spillovers from FOEs can neutralize the competition effect (Javorcik, 2004). Therefore, we
must be cautious in interpreting the estimates for ρ, because this coefficient empirically
captures the total effects of these opposing forces.
For control variables inX , we follow Romalis (2004) by interacting factor endowment
variables, physical and human capital, with industry-specific factor intensity.23 To control
for the role of institutions, we follow Nunn (2007) by including the interaction term be-
tween industry-specific contract intensity and quality of regional contract environment.24
To mitigate potential contemporaneous correlations between the error term and provin-
cial variables such as infrastructure, national policy zones, skill labor endowment, and
capital stock, we use one-year lagged values of these variables. For ease of interpretation,
23Industry-specific skill intensity is measured as the employment share of workers with college educa-tion, while capital intensity is measured as the ratio of fixed asset investment to output for the industry.Both variables are constructed based on data from the 1995 Chinese National Industrial Census. Provincialskill endowment is measured as the share of college workers in the population above the age of 6, whilecapital endowment is measured as the ratio of capital stock to output for the province. We are grateful toChongen Bai for sharing estimates of capital stock data.
24Industry-specific contract intensity is proxied by the inputs share of the relation-specific intermediatesbased on the Chinese input-output table. We are very grateful to Hong Ma for sharing the Nunn index. Theprovincial contract environment is measured using data from the Survey of Doing Business in 30 provincialcapital cities in China (World Bank, 2008). Specifically, we use the “court cost” variable, which is the ratioof official costs of going through court procedures to debt claim. Higher “court cost” indicates an ineffi-cient, rent-seeking legal system, implying a lower probability of upholding contracts between firms. Forconvenience of interpretation, we construct a court efficiency measure that equals to 0.5 minus the courtcost variable. Therefore, a higher index value implies a more efficient contract environment.
28
all variables, except for the indicator variables, are de-meaned before we compute the in-
teraction term. While ξi, ξj, and ξt are used to control for the industry, province, and year
fixed effects, we also control for province-year fixed effect as an alternative specification
to deal with unobserved time-varying provincial factors, such as local government poli-
cies and agglomeration. As a trade-off, the parsimonious control for province-year effects
may lead to loss of estimates for the observed province time-varying variables, such as
offshoring cost reduction measured at the provincial level. Accordingly, we also adopt
province-year cluster robust standard errors to control for sample dependence.
We begin with a simple specification in Table 3 that only includes the interaction terms
of organizational form with the key variables of ownership liberalization policy and off-
shoring cost and the fixed effects for organizational form, province, industry, and year.
The negative coefficient for the FDI indicator suggests that on average, FDI processing
exports are less than arm’s length processing exports during the sample period, thereby
indicating that for many years, the volume of outsourcing processing exports exceeded
that of FDI. Overall, both the encouragement and restriction policies do not have sig-
nificant effects on outsourcing processing exports, which holds true across alternative
specifications. The offshoring cost reduction that is measured using both policy zones
and infrastructure increase the outsourcing exports.
Column 1 shows the most important empirical findings through the four interaction
terms with the FDI indicator. These interaction terms are designed to test the hypotheses
developed in Proposition 2. The coefficient on F × EP is positive and statistically sig-
nificant, thereby supporting the prediction that relaxing ownership restrictions increase
FDI processing. By contrast, restriction policies reduce FDI processing exports relative to
that of outsourcing. In addition, the positive and statistically significant coefficients on
F×Policy zones and F×Infrastructure suggest that a lower offshoring cost increases the
processing exports of FDI more than those of outsourcing as predicted by the proposition.
Column 2 of Table 3 presents the interaction terms of industry-specific factor inten-
29
sities and provincial factor endowments. The positive coefficients of these interactions
indicate the role of comparative advantage. Those regions with more abundant skilled
labor (or capital) export more skill-intensive (or capital-intensive) products. Similarly,
those provinces with better contract environments export more contract-intensive prod-
ucts.25 Compared with the specification in Column 1, the only noticeable change in the
coefficients is that the policy zones have a reduced magnitude and statistical significance,
which is likely correlated with provincial endowment variables. However, the effect of
infrastructure on outsourcing exports remains positive and statistically significant.
To parsimoniously control for the other unobserved province-year varying factors that
will otherwise appear as omitted variables in the error term, Column 3 adds province-
year fixed effects. As a result, all province-year varying variables are removed from the
regression due to collinearity. Under this preferred specification with more robust con-
trols, the coefficients on ownership policy and offshoring cost remain stable. Quantita-
tively, compared with an industry that has no policy interventions, the implementation
of encouragement policy in an industry increases FDI processing exports by 24.4%, while
the implementation of restriction policy reduces FDI exports by 43.5%. Similarly, own-
ership policies do not significantly affect arm’s length processing exports. Under this
specification, a 1% increase in highway and railway density increases FDI processing ex-
ports by 0.21% relative to arm’s length processing. Adding one more national policy zone
in a province results in an 8% increase in FDI processing exports relative to arm’s length
processing.26 These estimates capture the average effects of policy and offshoring cost on
25Contract environments could be endogenous to trade, which would affect the estimates of the re-gression. On the basis of Feenstra et al. (2013) and Sheng and Yang (2016), we use former colonial tieswith countries, such as Britain, France, Russia, Germany, or Japan, or combination of multiple powers andprovincial population in 1953 as instrumental variables for contract environments. The coefficient of con-tract environment and industry-specific contract intensity decline slightly from the OLS estimate of 0.141to an IV estimate of 0.123, whereas other coefficients barely change.
26We include an interaction of EP × Policy zones and a triple interaction of F × EP × Policy zones toexplore a potential complementary relationship between national policy zones and encouragement policy.The result shows a positive and statistically significant coefficient for the triple interaction, which indicatesa complementary effect of national policy zones and encouragement policy for FDI processing exports. Thecoefficient for the simple interaction term is negative and statistically significant, which suggests that thenational policy zones favor FDI processing exports to arm’s length processing exports for industries with
30
processing exports across all industries.27
Because the role of FDI in processing exports differ across industries (see Table 1),
we also run separate regressions for high- and low-skill intensive industries by using the
sample mean of industrial college employment share as the threshold. Columns 4 and 5
of Table 3 present the estimation results. Overall, the effects of encouragement and restric-
tion policies on FDI exports are stronger than that of outsourcing in high-skill intensive
industries relative to low-skill intensive industries. 28 Moreover, infrastructure and policy
zones strongly enhance FDI processing exports in high-skill intensive industries. These
findings are consistent with the model predictions.29
Finally, we conduct several robustness checks on the determinants of processing trade.
First, we control for a number of concurrent policy changes during China’s ownership lib-
eralization on foreign investment, which can have significant effects on Chinese exports.
In the regression, we include China’s trade partners’ import weighted tariffs on Chinese
exports at the ISIC four-digit level and the reduction in trade policy uncertainty, as mea-
sured by weighted normal trade relation (NTR) tariff gap from Pierce and Schott (2016).
Moreover, we also remove from the sample of those industries that are affected by the
expiration of the Multi-Fiber Arrangement based on Khandelwal et al. (2013). As shown
in Table F.1 in the Appendix, our baseline findings are not sensitive to these extra con-
trols. The results show that reduced external tariffs increase China’s exports. Moreover,
encouraged policy. The other estimated coefficients are similar to our baseline results reported in Column3 of Table 3.
27The log specification in equation (10) drops all zero export values, thereby leaving out useful informa-tion from the data or generating potential bias due to the heteroskedastic multiplicative error. We followSilva and Tenreyro (2006) by adopting the Poisson pseudo-maximum likelihood (PPML) estimation, whichuses the level of trade flow as the dependent variable including the zero values. The effects of ownershippolicy and offshoring cost reduction on FDI processing exports remain strong in this alternative specifica-tion.
28The coefficients for key variables, including encouragement and restriction policies, their interactionswith the FDI indicator, and the interaction term of national policy zones with the FDI indicator, significantlydiffer from each other between the two sub-samples.
29Interestingly, the encouragement policy also increases outsourcing processing exports in high-skill in-dustries. This result is consistent with a positive spillover effect from FDI processing export to outsourcingor other preferable treatments with the encouragement policy. By contrast, the restriction policy has a neg-ative impact on outsourcing processing exports in low-skill intensive industries.
31
lower trade policy uncertainty in the U.S. has a positive yet insignificant effect on Chinese
exports to high-income countries, which possibly indicate that reduced uncertainty only
affects Chinese exports to the U.S.
Second, we control for industry-specific linear trends that can help identify the effects
of ownership liberalization policies on foreign investment. If the encouragement policies
covered those industries with higher rates of growth prior to the WTO accession, then
the estimated effects of ownership liberalization on processing exports may well capture
trend differences across industries, which result in an upward bias. Table F.1 shows that
the baseline results are not sensitive to the inclusion of industry-specific linear trends.
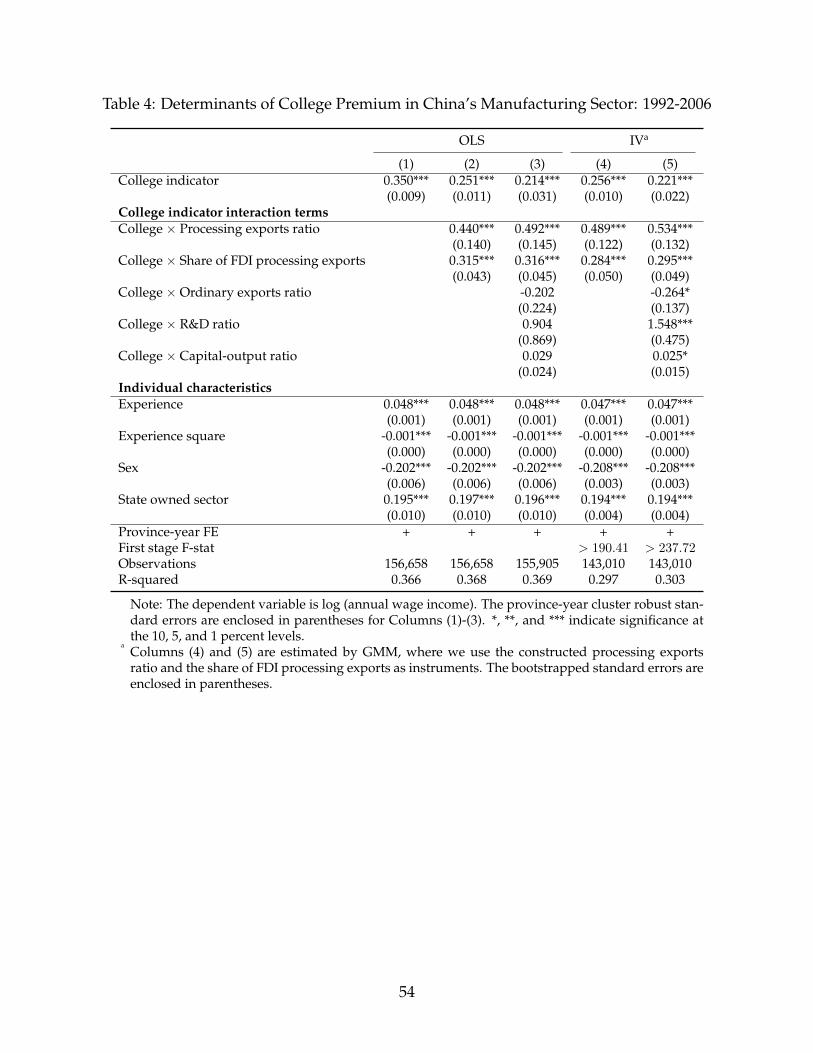
4.3 College Premium
The empirical evidence presented thus far has identified ownership liberalization and
decline in offshoring cost as significant contributors to the rapid expansion of regional
FDI offshoring, which is more skill intensive than arm’s length offshoring. In the sec-
ond stage of analysis, we test the implications of Proposition 4 by estimating the local
labor market outcomes of the exposure to FDI and arm’s length offshoring based the aug-
mented Mincer wage regression. Building on equation (9), we estimate the following
expanded form:
ln(Wmjt) = α0 + [α10 + α11Rjt + α12RSFjt +α′
13Vjt]× Cmjt +α′2Φmjt + δjt + εmjt, (11)
where ln(Wmjt) is the log real annual wage for individual m in province j and year t, Cmjt
is the college indicator which interacts with regional total offshoring scaled by industrial
output (Rjt) and the share of FDI offshoring (RSFjt), and Φ is a set of personal charac-
teristics including gender, potential labor market experience, experience squared, and a
dummy variable for state sector employment. While the coefficient α10 is the conventional
measure of college premium, the inclusion of Rjt and RSFjt takes into account the demand
32
for skill from offshoring in local labor markets. This specification captures both the aggre-
gate relative skill demand when more products are offshored to the South (the Feenstra-
Hanson mechanism through α11) and the composition effect of processing exports (the
Antras’ ownership mechanism through α12). Proposition 4 postulates that those regions
with more processing exports and higher shares of FDI offshoring experience a stronger
demand for skill and therefore realize an increase in their college premium, i.e., α11 > 0
and α12 > 0.
Equation (11) also controls for the other determinants of the skill premium at the
provincial level through the interaction termVjt×Cmjt. The first factor reflects the Stolper-
Samuelson theorem in which the relative wage of unskilled workers increases in regions
with abundant low-skilled workers as they export more low-skill intensive final goods.
We use the ratio of ordinary exports to industrial output to capture the exports of final
goods. The second determinant of relative wage is skill-biased technological changes
(SBTC; see for example, Bound and Johnson, 1992; Acemoglu, 1998), which are mea-
sured as the ratio of R&D expenditure to aggregate output, while the third determinant is
capital-skill complementarity (Krusell et al., 2000), which is measured as capital-to-output
ratio at the province level. We also include province-year pair dummies δjt to capture
the province-and-year differences in the determinants of wage income. Accordingly, we
adopt province-year cluster robust standard errors to control for sample dependence.
Ordinary least squares (OLS) is widely used to estimate the Mincer earnings function.
However, the OLS estimation of (11) presents two concerns, namely, (a) the two key vari-
ables Rjt, RSFjt are potentially endogenous to local labor market conditions, and (b) the
omission of an individual’s ability in the specification may result in a biased and incon-
sistent estimate of the college premium due to the positive correlation between schooling
and ability. With regard to (a), if MNCs choose to offshore or establish their foreign affili-
ates in regions with abundant high-skill and high-quality workers, the locational selection
would imply positive biases in the estimates for the interaction terms. To mitigate poten-
33
tial endogeneity, we adopt a two-stage IV approach (Angrist and Pischke, 2008).30 First,
we construct the predicted values of processing export-to-output ratio Rjt and the share
of FDI processing exports RSFjt from the determination of processing exports as follows:
Rjt =∑i,o
exp( lnRoijt)/ind outputjt
RSFjt =∑i,o=F
exp( lnRoijt)/∑i,o
exp( lnRoijt)
where lnRoijt is predicted value from regression (10) based on the preferred specification
in Column 3 of Table 3. We use these predicted values as instrumental variables for Rjt
and RSFjt in the augmented Mincer regression.31 Figure F.1 in the Appendix presents
scatter plots of actual and predicted values of processing export ratio and the share of
FDI processing export, which show close correlations.
These predicted values constitute legitimate instruments for the wage regression be-
cause key determinants of processing exports by type, such as ownership liberalization
policies, national policy zones, and infrastructure, are plausibly exogenous to labor force
characteristics, including the relative wage of skilled versus unskilled workers. This IV
approach would be questionable if the above policy initiatives targeted high skill pre-
mium growth in selected provinces, or national policy zones and infrastructure affected
skill premium growth other than the channel of FDI processing exports.
Many policy zones and infrastructure projects were already built before China’s ac-
cession to WTO in 2001, when nationwide ownership liberalization policies on foreign
30This two-stage IV approach is necessary because the sample dimensions are different between thetrade data and urban household survey data. The trade data in the first stage contains industry-level in-formation that allows us to identify the effects of FDI ownership liberalization on processing exports. Incomparison, the household data in the second stage do not contain industry-specific information but allowthe analysis of schooling returns at individual level. Given that both data have regional information, thetwo-stage procedure allows us to use regional variations upon exposure to offshoring to identify the effectsof processing exports on college premium in the Mincer regression.
31While this two-stage regression generates consistent estimates on the coefficients of interest, the esti-mated standard errors are incorrect. Therefore, we use the non-parametric bootstrap method to obtain thestandard errors.
34
investment were largely implemented. Thus, we can test whether policy zones and infras-
tructure projects targeted high skill premium growth based on information before China’s
accession to WTO. For this purpose, we compiled province-level data on cumulative pol-
icy zones and total lengths of railways and highways in 1992 and the subsequent changes
in college premiums between 1992 and 2000 estimated from the urban household survey
data. If the infrastructure projects and policy zones targeted subsequent growth of the
college premium, we would observe increases in high skill premium for the subsequent
period (1992–2000).
Our empirical analyses find no evidence of policy targeting on the growth of schooling
returns. In the benchmark case, we regress the change in college premiums between 1992
and 2000 on accumulative policy zones and infrastructure in 1992 conditional on college
premium in the initial year. As shown in Table F.2 in the Appendix, the estimated coeffi-
cients for the two policy variables are not statistically different from zero, which indicates
no evidence of policy targeting. This benchmark result is robust to various specifica-
tions, including alternative measures of college premium (i.e., from the baseline Mincer
regression to adding controls, such as gender, experience, and state-sector indicators) and
controlling additional covariates, such as capital-output ratio, relative skill endowment,
and real GDP per capita in 1992. This analysis also suggests that national policy zones
and infrastructure did not affect the skill premium through other channels before China’s
WTO accession.
We take a different approach to validate the exogeneity of ownership liberalization
policies, because college premium estimates are unavailable at the industry level. In-
stead, we provide direct and indirect evidence that trade liberalizations did not target la-
bor market outcomes. First, the relaxation of FDI regulations was largely due to China’s
compliance with the agreement on TRIMs, a requirement for the country’s accession into
the WTO. In accordance with TRIMs, China enacted new laws and amended existing
regulations regarding FDI inflows (Sheng and Yang, 2016; Lu et al., 2017). In 2002, the
35
government released an important document, ”Provisions on Guiding the Orientation of
Foreign Investment,” which provided guidelines for encouragement and restriction poli-
cies on FDI. The encouragement policies covered a wide range of industries, including
agriculture, energy, transportation, manufacturing, and raw materials. The restricted or
prohibited industries included health, public safety, military facilities, culture, and enter-
tainment, as well as industries that either have adverse effects on the environment or use
traditional technologies of China. Direct targeting on the labor market outcomes was not
observed.
Second, similar to our approach, Lu et al. (2017) also treated the liberalization of FDI
regulations around 2001 as a plausibly exogenous event. Their regression analyses sug-
gest that the industries under the encouraged policies are unrelated systematically to la-
bor force characteristics, such as employment and average wage. Such evidence lends
additional support for using ownership liberalization policies as instruments.
To address concern (b) of potential ability bias in the wage regression, we perform a
series of sensitivity tests, including cohort analysis. We will explain later that our main
findings are not sensitive to various controls for possible ability bias.
Table 4 presents the estimation results for the determinants of earnings by using the
CUHS data from 1992 to 2006.32 Column (1) starts with the OLS estimates of the ba-
sic regression. The interaction terms of offshoring variables Rjt, RSFjt with the college
indicator are added to Column (2), and additional controls for ordinary export, R&D
expenditure share, and capital-output ratio are included in Column (3). The two remain-
ing columns present the IV estimates of (2) and (3) along with the predicted values of
Rjt, RSFjt.
Several findings emerge from the basic specification. First, workers with college edu-
cation earn a 35% wage premium relative to workers without college education. Second,
the returns to experience for Chinese workers exhibit a typical concave profile, where one
32See Table F.5 for the summary statistics of household characteristics and related provincial variables.
36
year of experience increases a worker’s real wage by 4.8% at the beginning of their ca-
reers. Third, the average wage of female workers is 20.2% less than that of male workers,
thereby indicating a significant gender earnings gap. Fourth, workers in the state sector
earn a 19.5% wage premium compared with their counterparts in non-state sectors. These
estimates on experience-earning profiles, gender earnings gap, and state-sector wage pre-
mium are stable across all specifications and consistent with the findings of existing stud-
ies on the Chinese labor market.33
The most important empirical findings on wage inequality are presented through the
interaction terms of the college indicator with the two offshoring variables Rjt, RSFjt.
Each of these coefficients reported in Columns (2)-(4) are positive and statistically signifi-
cant, thus supporting Proposition 4, which posits that both the scale of offshoring and the
share of FDI offshoring are important for the local demand for skill and contribute to an
increase in college premium. While the coefficients for ordinary exports, R&D expendi-
ture share, and capital-to-output ratios are statistically insignificant in the OLS regression,
each of the coefficients becomes statistically significant in Column (5) in the IV specifica-
tion. In a test for weak instruments, the F-test statistics in the first stage are all above the
Stock-Yogo criteria of 10, thus rejecting the notion of weak instruments and giving sup-
port to (5) as the preferred specification. Compared with the basic OLS regression, the
coefficient for the college indicator drops from 35% in Column (1) to 22.1% in Column (5).
The interaction terms with the college indicator help identify the mechanisms through
which local labor market variables affect the college premium.
The IV estimates in Column (5) provide the basis for assessing the driving forces be-
hind the rising college premium in China’s manufacturing sector. Quantitatively, one
percentage point increase in the ratio of processing export to local industrial output and
in the share of FDI processing export increases the college wage premium by 0.534 and
0.295 percentage points, respectively. One percentage point increase in the ratio of or-
33See Ge and Yang (2014) for a recent analysis of China’s wage structure and the references cited therein.
37
dinary exports to industrial output reduces the returns to college by 0.264 percentage
point, which is consistent with the Stolper-Samuelson theorem that the exports of labor-
intensive goods increase the relative wage of unskilled labor. Meanwhile, one percent-
age point increase in R&D expenditure share and capital-output ratio is associated with a
1.548 and 0.025 percentage point increase in college premium, respectively. These findings
confirm the positive effects of skill-biased technological change and capital-skill comple-
mentarity on college premium.
After ownership restrictions were liberalized in China following the country’s acces-
sion into the WTO, the wage of college graduates relative to non-college graduates (log
wage differential) in China’s urban manufacturing sector increased by about 14.9 per-
centage points between 2000 and 2006. During this period, the ratios of processing and
ordinary exports to industrial output barely changed, thereby making their quantitative
contributions to the rising college premium insignificant. By contrast, the share of FDI
processing exports increased by approximately 25%, thereby contributing to nearly 50%
(25 × 0.295 = 7.375) of the observed increase in the college premium. Moreover, the em-
pirical estimates on the determinants of processing exports in Section (4.2) suggest that
17 out of the 25 percentage point increase in the share of FDI processing exports were at-
tributable to the ownership liberalization of MNCs and the reduction in offshoring cost.
These estimates imply that the FDI processing exports resulting from these two factors
account for 33.7% of the increase in the college premium.34 Our findings suggest that
the composition of offshoring through the Antras’ ownership mechanism plays a more
significant role than the scale of offshoring through the Feenstra-Hanson’s channel in in-
creasing the skill premium in China during this period.
34Hale and Long (2012, chap. 4) show that firms with higher shares of foreign ownership pay higher av-erage wages to their skilled workers, and the presence of foreign firms impose an upward pressure on thewages of workers of neighboring domestic firms, especially for skilled workers. Yang (2005) reports thatschooling returns are higher in Chinese cities with a greater degree of openness as measured by the per-centage of workers employed in foreign and joint-venture firms, which can either generate higher demandfor skills or create a driving force for competitive wage compensation. This empirical evidence providesadditional support for the role of foreign firms in the determination of schooling returns in China.
38
From 2000 to 2006, the R&D expenditure and capital-output ratios increased by 0.5
and 8 percentage points, thus contributing to 5.19% (0.774/14.9) and 1.34% (0.025/14.9)
of the rising college premium, respectively. Our results suggest that the contributions of
R&D expenditure and capital-output ratios to skill premium are limited compared with
the prominent role of FDI offshoring in explaining the rising skill premium in China’s
manufacturing sector from 2000 to 2006. We interpret this result in the context of the fol-
lowing factors. First, FDI and trade played a prominent role in the manufacturing sector,
whereas domestic R&D expenditures may only have limited influence on the SBTC in
manufacturing. Second, the shock of FDI inflows was particularly large immediately af-
ter China’s WTO accession in 2001. China soon became the ”world’s factory,” and foreign
firms accounted for approximately one-third of its gross industrial output in 2006. Mean-
while, China became one of the largest exporters in the world, with foreign companies
contributing 58% of its total exports. These FDI inflows in a short period appear to have a
large effect on labor markets in China. Similarly, Feenstra and Hanson (1997) found that
FDI growth in Mexico accounted for over 50% of the increase in the wage share of skilled
labor in the late 1980s in regions where FDI was concentrated. Finally, FDI offshoring can
also capture part of the SBTC because it is an important source of technology upgrading
in developing countries (Acemoglu et al., 2015).
4.4 Sensitivity Analysis
Here we discuss the results of extensive robustness checks for the benchmark specifi-
cation on college premium. First, recent studies suggest that trade liberalization in China
triggered internal migration, which was facilitated by reduced migration costs resulting
from household registration (Hukou) reforms (Fan, 2019; Facchini et al., 2019; Zi, 2019).
To control for potential confounding effects of migration frictions on estimating the col-
lege premium, we include a Hukou reform index, a proxy for changing migration costs
39
across Chinese provinces, in the Augmented Mincer regression.35 In principle, the inflow
of skilled migrants increases the relative supply of skills, which reduces skill premium in
the destination. However, educated migrants often work in skill-intensive industries and
can generate agglomeration effects, which increase college premium in those provinces.
Reductions in migration costs from Hukou reforms have similar offsetting effects on the
skill premium in provinces because high-skilled workers are more mobile than the low-
skilled ones. More specifically, we include an interaction term between changes in the
Hukou reform index and the college dummy in the Mincer regression as sensitivity anal-
ysis. We find that all baseline results remain stable after controlling for migration costs.
As shown in Column 1 in Table 5, the estimated coefficient for the interaction term in-
dicates that Hukou reforms have a positive yet statistically insignificant effect on col-
lege premium. This result indicates a possible agglomeration effect of skilled workers on
schooling returns.
Second, the estimation of schooling returns can be biased due to omitted ability, which
is likely correlated with the educational attainment of an individual. Given that CUHS
data do not report variables, such as individual dates of birth, parental schooling, and
sibling composition, which are potential instruments for the college indicator, we focus
instead on the birth cohort, that is, who was eligible for college education during the Cul-
tural Revolution (CR; 1966-1976) as a robustness check. College entrance examinations
were abolished during CR; thus, the selection of youth into college was politically ori-
ented and independent of the innate abilities of the candidates for learning. Park et al.
(2015) found that CR was an equalizer of educational access, and that the educational at-
tainment of youth in cities became considerably less correlated with that of their parents
compared with other cohorts before or after CR. To implement an approach with a limited
35 Fan (2019) constructed this city-level index based on news articles, official documents, and govern-ment regulations on Hukou policies using keyword searches on two comprehensive databases. He foundthat the changes in Hukou reform index have significant effects on migration. This measure capturesarguably exogenous changes in migration costs for individual migrants because policy requirements forHukou is set at the city level.
40
ability bias, we separate the cohorts born between 1947 and 1957 who would enter college
during CR from all other birth cohorts. Afterward, we run two separate wage regressions
with the preferred specification (5) in Table 4 for the two worker groups.
Columns 2 and 3 of Table 5 show that the college graduates earn a substantially higher
wage premium (26.1%) among the non-CR cohorts than college premium (13.3%) among
the CR cohorts. This gap in college premium between the two cohorts could reflect a pos-
sible upward bias associated with omitted ability and lower quality of education during
CR. However, the estimates for the two key interaction terms of college with the ratio of
processing exports and the share of FDI processing exports remain positive and statis-
tically significant; moreover, their magnitudes of (0.348, 0.301) and (0.498, 0.256) for the
two cohorts are not statistically different. These results indicate that the estimated effects
of skill demand from offshoring are not sensitive to possible omitted ability or changes to
education quality.
Third, the labor market participation of women in China declined significantly over
the sample period (Ge and Yang, 2014). Given that the change in labor force composition
can lead to potential complications and that the effects of processing and FDI processing
exports may not be gender neutral, we also estimate the earnings function by separating
the male and female samples. The results in Columns 4 and 5 indicate that the college
premium is larger among women (30.2%) compared with men (18.7%). Given these dif-
ferences, we reconfirm the results that an increase in processing exports and in the share
of FDI exports will increase the college premium for men and women. Processing ex-
ports have a larger effect on the returns to college for women, whereas FDI exports have
a larger effect on the college premium for men. Both findings lend support to Proposition
4.
Fourth, we use years of schooling as the alternative measure of skill and explore the
effect of processing export and its composition on schooling returns. We find that both
the size of processing exports and the share of FDI processing have significantly positive
41
effects on returns to education, as shown in Table F.3. We also find the highly significant
effects of SBTC on schooling returns and capital-skill complementarity, which is consis-
tent with our benchmark results in Column 5 of Table 4.
Fifth, we use the processing exports to all trade partners of China instead of exports
to only high-income countries as our alternative measure of offshoring. This alternative
measure considers the possibility that the outsourced products to China may not be nec-
essarily shipped back to the Northern innovator but can be sold to other countries. All
estimates reported in the last column of Table 5 are broadly consistent with our bench-
mark findings.36 These results are not surprising because China’s exports to high-income
countries accounted for approximately 90% of its total processing exports during the sam-
ple period (see Table 1).
Sixth, foreign firms can offshore production to China through their affiliates or joint
ventures. Thus far, empirical analysis has used processing exports by wholly-foreign-
owned firms as FDI offshoring, whereas grouping processing exports by joint ventures
and Chinese-owned firms as arm’s length offshoring. We include an interaction term be-
tween the share of processing exports by joint ventures and the college indicator in the
Mincer regression to examine whether foreign-owned firms and joint ventures played
different roles in skill premium growth in China. The estimated coefficient is small and
negative at −0.105 with 10% statistical significance, in contrast with the positive effect
of FDI processing exports. 37 This result is consistent with the hypothesis that joint ven-
tures are less skill-intensive than foreign-owned firms and that such ventures increase the
relative demand for non-skilled labor.
36The regression results for the trade equation (Equation 10) are also robust if we use processing exportsto all destinations as the dependent variable.
37In an earlier version of the paper, we analyzed three types of firm ownership in theory and by em-pirical analysis. Under the assumption of equal revenue shares for the two partners of a joint venture, themodel predicts that goods offshored through FDI are more skill-intensive than those offshored throughjoint ventures and indigenous firms in the South. The intuition is straightforward, while empirical evi-dence also supports this finding. However, a serious drawback of incorporating three ownership types isthe increased complexity of the model and the burden of presenting detailed empirical findings. Given thistrade-off, we decided to pursue a cleaner approach by grouping together the joint ventures and Chinesefirms in the model and the empirical analysis.
42
Lastly, Northern innovators can outsource part of their production to another foreign
firm operating in China (e.g., a Taiwanese company). In the study, we process this type
of outsourcing as FDI processing exports, which is arguably a misclassification. Unfortu-
nately, the coding of the data does not permit us to pin down specific details of offshoring
at different stages of the supply chain. In absence of ideal data, the existing literature
on global vertical integration has used the same measure as ours (see Spencer (2005),
Fernandes and Tang (2012), and Luck (2017) for offshoring to China). However, this sub-
tle measurement issue may not affect our estimates for the effect of processing exports
on college premium for two reasons. First, the skill content of the tasks that a North-
ern firm outsources to another foreign firm in China (e.g., the Taiwanese case) is likely
to fall between FDI processing exports and arm’s length processing exports, given that
foreign firms in China are perceived to have better technology and management than
typical Chinese firms. Second, as we have shown in Section 4.1, arm’s length process-
ing exports are less skill-intensive than FDI processing exports. Therefore, if low-skilled
arm’s length processing exports are misclassified as more-skilled FDI processing exports,
then our estimated effects of FDI processing exports on college premium would be rather
conservative.
5 Concluding Remarks
This paper studies a new mechanism through which the composition of offshoring
from developed economies affects the wage inequality in developing countries. Using
data from China’s processing exports, we find evidence of a higher skill intensity in FDI
offshoring than in arm’s length offshoring. When China relaxed its ownership restrictions
on MNCs and lowered its offshoring costs upon its accession to the WTO, more skill
intensive production was shifted to the World’s Factory through the affiliates of MNCs,
thereby increasing the relative demand for high-skilled labor. Our empirical analyses
43
reveal that an increase in FDI processing exports contributes to approximately one-third
of the increase in the college premium in China’s manufacturing sector between 2000
and 2006. This finding highlights the role of the organizational structure of offshoring in
shaping the skill content of trade and factor prices in developing countries.
The theory and evidence presented in this paper also have direct policy implications
for FDI and technology transfer to developing countries (e.g., Harrison et al., 2010). In the
globalized economy, offshoring involves the complex interactions between MNCs and
the governments in the South. In the case of China, those industrial policies that im-
pose joint-venture requirements and technology sharing are often ineffective in attracting
foreign investments and advanced technologies because MNCs tend to choose low-skill
arm’s length transactions under such policies and institutions. By contrast, if the host
country governments opt to improve the quality of their institutions, such as enhancing
contractual enforcement, relaxing ownership restrictions on FDI, and reducing offshoring
costs, MNCs have strong incentives to choose FDI offshoring with advanced products and
technologies. The expansion in skill-intensive offshoring in turn increases the returns to
skill in the South, thereby inducing human capital investment and enhancing economic
growth in the long run.
44
References
Acemoglu, D., 1998. Why do new technologies complement skills? Directed technical
change and wage inequality. Quarterly Journal of Economics 113 (4), 1055–1089.
Acemoglu, D., Gancia, G., Zilibotti, F., 2015. Offshoring and directed technical change.
American Economic Journal: Macroeconomics 7 (3), 84–122.
Angrist, J. D., Pischke, J.-S., 2008. Mostly harmless econometrics: An empiricist’s com-
panion. Princeton University Press.
Antras, P., 2003. Firms, contracts, and trade structure. Quarterly Journal of Economics
118 (4), 1375–1418.
Antras, P., 2005. Incomplete contracts and the product cycle. American Economic Review
95 (4), 1054–1073.
Antras, P., Helpman, E., 2004. Global sourcing. Journal of Political Economy 112 (3), 552–
580.
Bound, J., Johnson, G., 1992. Changes in the structure of wages in the 1980’s: An evalua-
tion of alternative explanations. The American economic review 82 (3), 371.
Chen, Z., Ge, Y., Lai, H., 2011. Foreign direct investment and wage inequality: Evidence
from China. World Development 39 (8), 1322 – 1332.
Costinot, A., Oldenski, L., Rauch, J., 2011. Adaptation and the boundary of multinational
firms. Review of Economics and Statistics 93 (1), 298–308.
Delgado, M. A., Faris, J. C., Ruano, S., 2002. Firm productivity and export markets: A
non-parametric approach. Journal of International Economics 57 (2), 397 – 422.
45
Facchini, G., Liu, M. Y., Mayda, A. M., Zhou, M., September 2019. China’s great migra-
tion: The impact of the reduction in trade policy uncertainty. Journal of International
Economics 120, 126–144.
Fan, J., July 2019. Internal geography, labor mobility, and the distributional impacts of
trade. American Economic Journal: Macroeconomics 11 (3), 252–88.
Feenstra, R., Hanson, G., 1996. Foreign investment, outsourcing and relative wages. Feen-
stra, R.C., Grossman, G.M. and Irwin, D.A, eds., Political Economy of Trade Policy:
Essays in Honor of Jagdish Bhagwati, MIT Press. 1996, pp.89-128.
Feenstra, R., Hanson, G., 1997. Foreign direct investment and relative wages: Evidence
from Mexico’s maquiladoras. Journal of International Economics 42 (3-4), 371–393.
Feenstra, R., Hanson, G., 1999. The Impact of Outsourcing and High-Technology Capital
on Wages: Estimates For The United States, 1979-1990*. Quarterly Journal of Economics
114 (3), 907–940.
Feenstra, R., Hanson, G., 2005. Ownership and control in outsourcing to China: Esti-
mating the property-rights theory of the firm. Quarterly Journal of Economics 120 (2),
729–761.
Feenstra, R. C., Hong, C., Ma, H., Spencer, B. J., 2013. Contractual versus non-contractual
trade: The role of institutions in China. Journal of Economic Behavior & Organization
94 (0), 281 – 294.
Fernandes, A., Tang, H., 2012. Determinants of vertical integration in export processing:
Theory and evidence from China. Journal of Development Economics 99 (2), 396 – 414.
Ge, S., Yang, D. T., 2014. Changes in China’s wage structure. Journal of the European
Economic Association 12 (2), 300–336.
46
Goldberg, P., Pavcnik, N., 2007. Distributional effects of globalization in developing coun-
tries. Journal of Economic Literature 45 (1), 39–82.
Gomes-Casseres, B., 1990. Firm ownership preferences and host government restrictions:
An integrated approach. Journal of International Business Studies 21 (1), 1–22.
Grossman, G., Helpman, E., 2005. Outsourcing in a global economy. Review of Economic
Studies 72 (1), 135.
Grossman, G., Rossi-Hansberg, E., 2008. Trading tasks: A simple theory of offshoring.
American Economic Review 98 (5), 1978–1997.
Grossman, S. J., Hart, O. D., 1986. The costs and benefits of ownership: A theory of vertical
and lateral integration. Journal of Political Economy 94 (4), 691–719.
Hale, G., Long, C., 2012. Foreign Direct Investment in China: Winners and Losers. World
Scientific Publishing Company.
Han, J., Liu, R., Zhang, J., 2012. Globalization and wage inequality: Evidence from urban
China. Journal of international Economics 87 (2), 288–297.
Harrison, A., Rodriguez-Clare, A., et al., 2010. Trade, foreign investment, and industrial
policy for developing countries. Handbook of Development Economics 5, 4039–4214.
Hart, O., Moore, J., 1990. Property rights and the nature of the firm. Journal of Political
Economy 98 (6), 1119–1158.
Hsieh, C., Woo, K., 2005. The impact of outsourcing to China on Hong Kong’s labor mar-
ket. American Economic Review 95 (5), 1673–1687.
Hummels, D., Jørgensen, R., Munch, J., Xiang, C., 2014. The wage effects of offshoring:
Evidence from Danish matched worker-firm data. American Economic Review 104 (6),
1597–1629.
47
Hummels, D., Munch, J., Xiang, C., 2016. Offshoring and labor markets. National Bureau
of Economic Research Working Paper Series, 22041.
Javorcik, B., 2004. Does foreign direct investment increase the productivity of domestic
firms? In search of spillovers through backward linkages. American Economic Review
94 (3), 605–627.
Johnson, R. C., Noguera, G., 2012. Accounting for intermediates: Production sharing and
trade in value added. Journal of International Economics 86 (2), 224 – 236.
Note: We use the employment share of college workers from the 1995 Chinese National Industrial Censusto measure skill intensity at the industry level. High-skill industries refer to skill intensity above thesample mean.
51
Table 2: Kolmogorov-Smirnov Test for Stochastic Dominance
Panel A: Skill difference between FDI and arm’s length processing exportsTwo-sided test One-sided test
P-value No difference between FDI weakly dominatestwo distributions arm’s length processing exports
(0.012) (0.012) (0.014) (0.017)Industry FE + + + + +Province and year FE + +Province-year FE + + +Observations 36,871 36,158 36,158 15,839 20,319R-squared 0.512 0.521 0.532 0.521 0.564
Note: The dependent variable is log (processing exports value). The province-year cluster robuststandard errors are enclosed in parentheses. *, **, and *** indicate significance at the 10, 5, and 1percent levels.
aProvince-year varying factors, such as skill endowments and capital-output ratio, are included inthe regression. Given their insignificant coefficients, they are not reported in the table.
53
Table 4: Determinants of College Premium in China’s Manufacturing Sector: 1992-2006
Note: The dependent variable is log (annual wage income). The province-year cluster robust stan-dard errors are enclosed in parentheses for Columns (1)-(3). *, **, and *** indicate significance atthe 10, 5, and 1 percent levels.
aColumns (4) and (5) are estimated by GMM, where we use the constructed processing exportsratio and the share of FDI processing exports as instruments. The bootstrapped standard errors areenclosed in parentheses.
54
Table 5: Sensitivity Analysis on the Determinants of College Premium
Migration Cul. Rev. Non-CR Male Female All tradeCost cohort cohort only only partners(1) (2) (3) (4) (5) (6)
Note: The dependent variable is log (annual wage income). The regressions are estimated by GMM using theconstructed processing exports ratio and the share of FDI processing exports as instruments. The bootstrappedstandard errors are enclosed in parentheses. *, **, and *** indicate significance at the 10, 5, and 1 percent levels.
55
010
020
030
040
0B
illio
n do
llar
1992 1996 2000 2004 2008
Arm's length processing exports FDI processing exportsSource: Chinese Customs Trade Data
(a) Ownership Structural Change in Processing Exports
Industry FE + + +Prov-Year FE + + +Observations 36,043 33,053 36,158R-squared 0.530 0.516 0.541
Note: The dependent variable is log (processing exports value) in all threecolumns. The last column includes industry-specific trends as additional con-trol variables. The province-year cluster robust standard errors are enclosedin parentheses. *, **, and *** indicate statistical significance at the 10, 5, and 1percent levels.
9
F.3 Augmented Mincer Wage Regressions
0.2
.4.6
Actu
al p
roce
ssin
g ex
port
ratio
0 .05 .1 .15 .2Predicted processing export ratio
0.2
.4.6
.8Ac
tual
sha
re o
f FD
I pro
cess
ing
expo
rts
0 .2 .4 .6 .8Predicted share of FDI processing exports
Figure F.1: Scatter Plots for First-Stage Regression
10
Table F.2: Effect of Policy Zones and Infrastructure on the Changes in College Premium
Note: Three different measures of college premium estimated from the Mincer regres-sion are used as dependent variables. Columns (1) and (2) use the unconditional col-lege premium, Columns (3) and (4) use conditional college premium with controls forindividual characteristics, including age, sex, experience and its square, and Columns(5) and (6) use college premium with additional controls for state-sector indicators.Columns (2), (4), and (6) include capital-output ratio, R&D ratio, and log real GDP percapita as control variables. Robust standard errors are in parentheses. *, **, and ***indicate statistical significance at the 10, 5, and 1 percent levels.
11
Table F.3: Years of Education and Schooling Returns
OLS IV
(1) (2) (3)
Schooling years 0.063*** 0.040*** 0.040***(0.002) (0.005) (0.003)
Interaction terms of schooling yearsSchooling years × Processing exports ratio 0.040** 0.050**
(0.018) (0.019)Schooling years × Share of FDI processing exports 0.072*** 0.073***
(0.007) (0.007)Schooling years × Ordinary exports ratio -0.110** -0.161***
(0.047) (0.024)Schooling years × R&D ratio 0.338* 0.574***
(0.205) (0.076)Schooling years ×K/Y 0.006 0.007***
Note: The dependent variable is log (annual wage income). The province-year clus-ter robust standard errors are enclosed in parentheses for Columns (1) and (2). *, **,and *** indicate statistical significance at the 10, 5, and 1 percent levels.
aColumn (3) is estimated by GMM, where we use the constructed processing exportsratio and the share of FDI processing exports as instruments. The bootstrapped stan-dard errors are enclosed in parentheses.
12
F.4 Provincial Variables
Table F.4: Variable Description
Variable Definition Source
R&D ratio R&D expenditure/nominalGDP
China Statistical Yearbook onScience and Technology, 1993-2009.
Capital-output ratio Capital stock/real GDP, in 1978price
Capital stock is provided byQian et al. (2007). Real GDPis computed from China Com-pendium of Statistics 1949-2008.
Court efficiency 0.5 - court cost Word Bank Doing Business Sur-vey
Infrastructure Log (the total length of high-ways and railroads in kilome-ters per land area in square kilo-meters)
China Compendium of Statistics1949-2008
National policy zones The number of national policyzones
China Development Zone Re-view Announcement Catalogue,NDRC, 2007.
Skill endowment The share of population agedabove 5 with college degrees
Annual Population Survey, pub-lished in the China PopulationStatistics Yearbook, 1993-2009.
13
Table F.5: Summary Statistics of Individual and Provincial Variables