26
Foreword & additional analysis by ©2013 LogMeIn, Inc, Version 1 Live Chat Effectiveness A Survey of Internet Shoppers 2013

Foreword & additional analysis by
©2013 LogMeIn, Inc, Version 1
Live Chat E�ectivenessA Survey of Internet Shoppers2013

Table of ContentsForeword: Lauren Freedman, President, the e-tailing group . . . . . . . . . . . . . . . 1 Introduction To The 2013 Edition . . . . . . . . . . . . . . . . . . . . . . . . . . . . . . . . . . . . . . . . . . . 4
The e-tailing group E�ect . . . . . . . . . . . . . . . . . . . . . . . . . . . . . . . . . . . . . . . . . . . . . . . . . . 4Methodology . . . . . . . . . . . . . . . . . . . . . . . . . . . . . . . . . . . . . . . . . . . . . . . . . . . . . . . . . . . . . . . 4
Sample and Survey Instrument . . . . . . . . . . . . . . . . . . . . . . . . . . . . . . . . . . . . . . . . . . . . 4Conclusions . . . . . . . . . . . . . . . . . . . . . . . . . . . . . . . . . . . . . . . . . . . . . . . . . . . . . . . . . . . . . . . . 5Detailed Conclusion Analysis . . . . . . . . . . . . . . . . . . . . . . . . . . . . . . . . . . . . . . . . . . . . . . . 6
#1: It’s A Multi-channel Communications World . . . . . . . . . . . . . . . . . . . . . . . . . . . 6#2: Social Media As A Sales And Support Channel Cannot Be Denied . . . . . . . 9#3: Ignore Email At Your Own Peril . . . . . . . . . . . . . . . . . . . . . . . . . . . . . . . . . . . . . . . 12#4: Live Chat Remains Strong And Continues To Have Loyal Fans . . . . . . . . . . 14
Proactive Chat . . . . . . . . . . . . . . . . . . . . . . . . . . . . . . . . . . . . . . . . . . . . . . . . . . . . . . . . . 15Live Chat Best Practices . . . . . . . . . . . . . . . . . . . . . . . . . . . . . . . . . . . . . . . . . . . . . . . . . 16
#5: Geography Matters . . . . . . . . . . . . . . . . . . . . . . . . . . . . . . . . . . . . . . . . . . . . . . . . . . . 20Recommendations And Next Steps . . . . . . . . . . . . . . . . . . . . . . . . . . . . . . . . . . . . . . . . . 23
Table of FiguresFigure 1: Sample Geographic Location . . . . . . . . . . . . . . . . . . . . . . . . . . . . . . . . . . . . . . . . 4Figure 2: Channel Usage (frequency) . . . . . . . . . . . . . . . . . . . . . . . . . . . . . . . . . . . . . . . . . . 6Figure 3: Channel Usage (satisfaction) . . . . . . . . . . . . . . . . . . . . . . . . . . . . . . . . . . . . . . . . . 7Figure 4: Phone, Live Chat, Email Against Customer Satisfaction Criteria. . . . . . . . 8Figure 5: Expected Response Times by Channel . . . . . . . . . . . . . . . . . . . . . . . . . . . . . . 9Figure 6: Percent Spending 3 or More Hours on Social Media . . . . . . . . . . . . . . 9Figure 7: Retailer Response Time via Social Media . . . . . . . . . . . . . . . . . . . . . . . . . . . . 10Figure 8: Preferred Communication Channel. . . . . . . . . . . . . . . . . . . . . . . . . . . . . . . . .11Figure 9: Why Social? . . . . . . . . . . . . . . . . . . . . . . . . . . . . . . . . . . . . . . . . . . . . . . . . . . . . . . . . 11Figure 10: Social Media Preferrers by Age . . . . . . . . . . . . . . . . . . . . . . . . . . . . . . . . . . . . 12Figure 11: Email Preference 2011 to 2013 . . . . . . . . . . . . . . . . . . . . . . . . . . . . . . . . . . . . 12 Figure 12: Preferred Channel Under Shopping Scenarios . . . . . . . . . . . . . . . . . . . . . 12Figure 13: Why Email Is Preferred . . . . . . . . . . . . . . . . . . . . . . . . . . . . . . . . . . . . . . . . . . . 13Figure 14: Chat Frequency . . . . . . . . . . . . . . . . . . . . . . . . . . . . . . . . . . . . . . . . . . . . . . . . . . 14Figure 15: Percent Preferring Live Chat 2011-2013 . . . . . . . . . . . . . . . . . . . . . . . . . 14Figure 16: Live Chat’s In�uence on Purchase . . . . . . . . . . . . . . . . . . . . . . . . . . . . . . . . 15Figure 17: Proactive Chat Receptiveness . . . . . . . . . . . . . . . . . . . . . . . . . . . . . . . . . . . . 15Figure 18: Proactive Chat Receptiveness – Invite Comparison . . . . . . . . . . . . . . . . . . 16Figure 19: Expectations of Proactive Chats . . . . . . . . . . . . . . . . . . . . . . . . . . . . . . . . . . 16Figure 20: Chat Session Success Factors . . . . . . . . . . . . . . . . . . . . . . . . . . . . . . . . . . . . . 17Figure 21: Questions Agents Should Be Able to Answer by Chat . . . . . . . . . . . . . . 18Figure 22: Chat Availability . . . . . . . . . . . . . . . . . . . . . . . . . . . . . . . . . . . . . . . . . . . . . . . . . 19Figure 23: Chat Button Placement . . . . . . . . . . . . . . . . . . . . . . . . . . . . . . . . . . . . . . . . . . 19Figure 24: Chat Buttons . . . . . . . . . . . . . . . . . . . . . . . . . . . . . . . . . . . . . . . . . . . . . . . . . . . . . 20Figure 25: Chat Usage . . . . . . . . . . . . . . . . . . . . . . . . . . . . . . . . . . . . . . . . . . . . . . . . . . . . . . 20Figure 26: Chat Usage (by Geography) . . . . . . . . . . . . . . . . . . . . . . . . . . . . . . . . . . . . . . . 21Figure 27: Preferred Communication Channel (by Geography) . . . . . . . . . . . . . . . 21Figure 28: Proactive Chat Receptiveness (by Geography) . . . . . . . . . . . . . . . . . . . . 22Figure 29: Chat’s In�uence over Purchase (by Geography) . . . . . . . . . . . . . . . . . . . . 23
Foreword & additional analysis by
CAUTION: Ignoring channels or shoppers can be dangerous
• Speed of response time is in the eye of the beholder and urgency a direct correlation given the customer’s circumstances.
• Consumers are aware of the time that it typically takes to get an answer in any given channel and factor that into their communication choices.
• Customers will give new channels a chance and in fact they’re willing to be patient when asked about acceptable retailer response times.
As we are not seeing any outliers in our research, one would have to be convinced that all of these methods are here to stay requiring retailer accommodation and proficiency.
Customer Service Trial And Error: Customers Will Find Their Preferred Means of Service but Circumstances Will Inform Their Choice Consumers are willing to try any and all methods and, in fact, the hundreds of responses I read suggest vigilance on the part of those who need service and a willingness to use multiple channels to solve problems.
Consumers know how to get the attention of companies they do business with often taking a multi-pronged approach to seeking support. Like me, they use any available means available escalating their issues through 2-channel inquiries in hopes of seeing a quicker andmore satisfactory resolution. Multi-channel examples included the following comments:
“I had tried to place an order multiple times and for some reason the website would not accept my membership card or my address. I called in and they said there was
Foreword:By Lauren Freedman, President, the e-tailing group
Solve My Problem Now: Customer Service, Any Way, Any Channel
Customers Embrace Every Form of Service AvailableIt’s almost shocking that our 2013 research revealed that today’s consumer is almost ambivalent when it comes to customer service channels; this generation of shoppers simply wants service their way. Of course, some custom-ers have a preference for one channel over another, but it appears that’s born out of experience more than anything else. What they aren’t ambivalent about is the level of service they expect to receive. From the stories they shared with us, it seems that service informs who they choose to do business with in the future and which communication channel ultimately becomes their platform of choice when seeking service and support from retailers.
Consumer Insights Revealed Having conducted market research for the past ten years, I have always found that while the numbers are instructive, there is tremendous value in open-ended responses. So, while much of the report that follows emphasizes the quantitative, I will focus on bringing the shopper voice to light.
By reading through hundreds of open-ended responses, one quickly concludes that when a shopper requires customer service from a retailer it is due to a finite set of circumstances. They likely have a distinct problem they want to resolve relative to product delivery or obtaining additional product information before consummating apurchase. In their quest to solve the issue, respondents’ narratives taught us that:
• Desired outcomes and timing include full resolution, efficient turnaround, and a consistently high quality experience.
1

Foreword & additional analysis by
CAUTION: Lack of email customer service may be a perilous decision given the favored status it sees across all of our research.
comes to email. Some retailers, perhaps unable to meet this threshold, have considered abandoning the channel. It appears that this will not be a wise strategy as our research overwhelmingly sees great interest, and usage.
For those who preferred email over the phone they cited not having to waste time on the phone and its inconve-nience relative to the workplace or where children are involved. Sentiments shared included, “Life is too short to wait on the phone and especially di�cult with children, so email is much easier and I can keep emails as reference.” Undoubtedly the “maze of automated phone lines before getting to an operator” contributes to their channel choice as well. Many cited, like one respondent, that “email lets you think as you compose questions so they are asked more considerately.” Several mentioned that with email they can “avoid speaking to agents directly where language barriers are nonexistent and clear understanding more likely.” It also became clear from the open-ended responses that the ability to create a paper trail and have a record of the communication would be important as this way “any promises or o�ers are made in writing” while another summed it up succinctly, “everything is in black and white” leaving “no room for doubt” about what has been said. Lastly, the thoroughness and precision of the answer should be noted as there is a belief that in other channels (most likely phone), compromises are made.
Social Media As a Sales and Support Channel Cannot Be DeniedAs a bit of a social media cynic, I was surprised to see the strong support of social relative to customer service. Over the past year, re�ecting on interviews conducted with retailers, I had learned that more consumers were connecting via social queries to solve customer service
nothing they could or would do. I then contacted their Facebook page and they promised to �x it but I have not gotten the response I was hoping for. They keep saying that they will call and make it right but it’s been more than a week. “
“I followed their instructions by sending details via their website. When I received no reply within 48 hours, I rang them and the details were taken down by their operators who said that the machine would be collected on a given date. The collection did not happen and when I rang again, they claimed that their computer had failed and the records were eliminated.”
“Had been sending emails and making phone calls for over a month but when I went to their Facebook page I got a response within hours and issue was resolved.”
“I emailed the sales desk to enquire if a handbag was still available and where I can buy it. They responded within 5 minutes, gave me the names of a store in my area. I then looked up the shop on Facebook, liked them then asked about the bag. They responded within 10 minutes I contacted the retail through Facebook and email.”
Learnings by ChannelThis report includes �ve important conclusions, and three of them are channel speci�c. In each of these cases, we have the bene�t of open-ended responses which add true color to the statistical data included in the report.
Ignore Email At Your Own PerilEmail, recently rumored in the media to be on the chop-ping block from a number of retailers appears to be the comeback kid (or one that never left the family). Ten service scenarios were presented and respondents wereasked to indicate which communication method theywould prefer to use. In every instance sending an email was the �rst choice making it universally appealing to customer service seekers.
Retailers know, and this research �nds, that consumers have a twenty-four hour turnaround expectation when it
2

Foreword & additional analysis by
CAUTION: Chat o�ers a unique opportunity for timely responses & relationship building with customers
CAUTION: Be trained and timely as public face is fraught with peril
is not long, they are knowledgeable and best of all-they have an option to have the entire chat emailed to us so there is NO misunderstanding of who said what later on. Love their support.”
Circling back to our multi-channel premise, proactive chat provides an interesting case study in consumer acceptance of new customer service options. Upon receipt of a proactive invite, the majority was receptive and their willingness to embrace is further seen in that over half of the sample had accepted invitation at one time or another. The response that speaks volumes is that 62% of shoppers had neither higher nor lower expecta-tions based on the fact that they’d been invited. At the end of the day, they were willing to test the channel and see what experience they would receive.
Customer Service: An All-Around GameOpenness to di�erent communication channels is the mindset that shoppers the world over seem to have when seeking service. Should you deliver on the prom-ises you make in every channel you have available, customer concerns will be virtually non-existent. It is when you are unable to resolve their issues they become vigilant in pursuit of their goals. This report should be a wakeup call to retailers to review their current service levels and to take a stand to support customer service anyway, anywhere.
Yours,
Lauren FreedmanPresident, etailing group
issues causing all of them to revisit their ability to respond in a timely fashion.
Retailers are well aware of the channel’s public facing nature which puts greater pressure on their organiza-tions to perform. One consumer candidly reported, “Retailers want to be seen as doing the right thing for their customers so Facebook tends to make them do it and if I get bad service, it is on a public forum where others can see the poor service the company gives.”
The speed of the response and its implications were clear in comments such as, “couldn’t get link on Facebook to work correctly so I posted on their wall and received a response within 5-10 minutes” or “monitoring their Twitter feed; they got back to me within hours about an account problem I had.” From a negative point of view the same challenges exist where retailers must ensure that high levels of service are seen contrary to these circumstances, “The people in Facebook don’t know the products so how can they answer me…” one respondent emphasized.
Live Chat Remains Strong and Continues to Have Loyal FansWhile email is a tour-de-force and social is on the rise, we see again that live chat remains important. The give and take mechanism inherent in the technology is ideal as one shopper noted, “if they have any questions to ask back at me about a product, I can tell them right away.” The pace is optimal as “online chat was quick and answered my complicated question easily and promptly.” The record of the encounter is once again noted where “proof of the conversation comes in the form of being able to print the conversation and keep it for reference.”
Believing the channel is e�ective at complete issue resolution, one shopper chimed in, “I love live one-on-one chat whenever I need help or a question answered. The wait
3
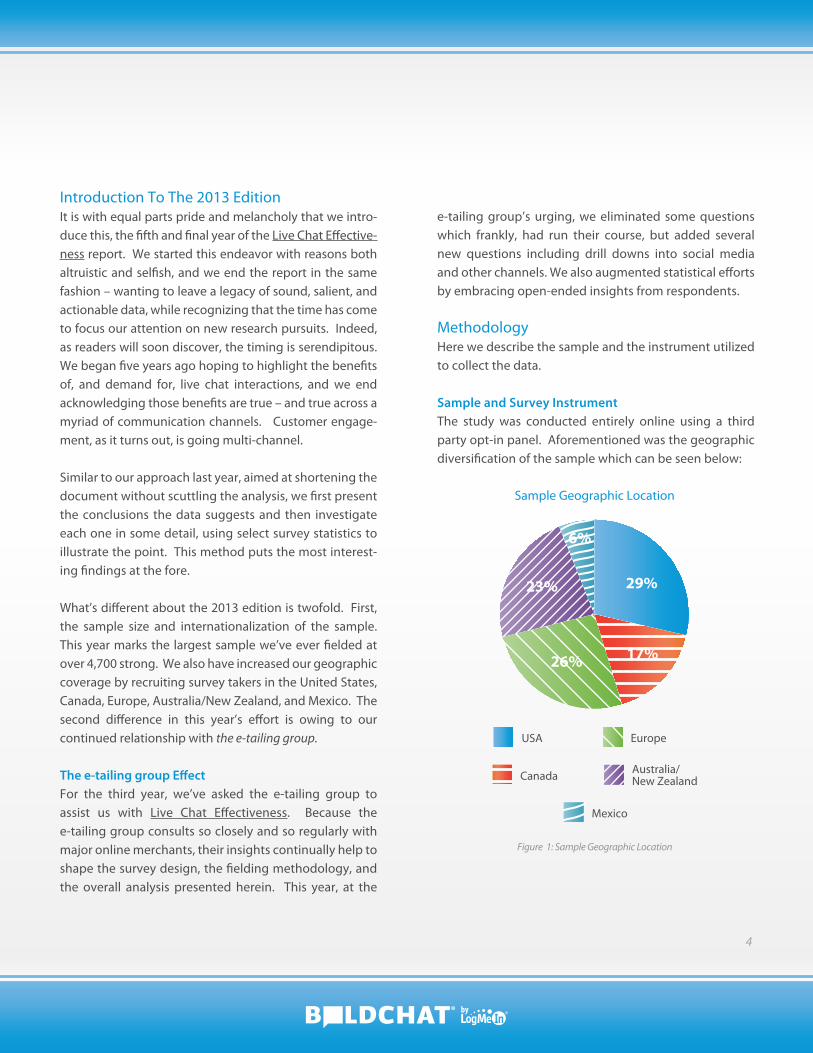
Figure 1: Sample Geographic Location
Sample Geographic Location
USA
Canada
Europe
Australia/New Zealand
Mexico
29%
17%26%
23%
e-tailing group’s urging, we eliminated some questions which frankly, had run their course, but added several new questions including drill downs into social media and other channels. We also augmented statistical e�orts by embracing open-ended insights from respondents.
MethodologyHere we describe the sample and the instrument utilized to collect the data.
Sample and Survey InstrumentThe study was conducted entirely online using a third party opt-in panel. Aforementioned was the geographic diversi�cation of the sample which can be seen below:
Introduction To The 2013 EditionIt is with equal parts pride and melancholy that we intro-duce this, the �fth and �nal year of the Live Chat E�ective-ness report. We started this endeavor with reasons both altruistic and sel�sh, and we end the report in the same fashion – wanting to leave a legacy of sound, salient, and actionable data, while recognizing that the time has come to focus our attention on new research pursuits. Indeed, as readers will soon discover, the timing is serendipitous. We began �ve years ago hoping to highlight the bene�ts of, and demand for, live chat interactions, and we end acknowledging those bene�ts are true – and true across a myriad of communication channels. Customer engage-ment, as it turns out, is going multi-channel.
Similar to our approach last year, aimed at shortening the document without scuttling the analysis, we �rst present the conclusions the data suggests and then investigate each one in some detail, using select survey statistics to illustrate the point. This method puts the most interest-ing �ndings at the fore.
What’s di�erent about the 2013 edition is twofold. First, the sample size and internationalization of the sample. This year marks the largest sample we’ve ever �elded at over 4,700 strong. We also have increased our geographic coverage by recruiting survey takers in the United States, Canada, Europe, Australia/New Zealand, and Mexico. The second di�erence in this year’s e�ort is owing to our continued relationship with the e-tailing group.
The e-tailing group E�ectFor the third year, we’ve asked the e-tailing group to assist us with Live Chat E�ectiveness. Because the e-tailing group consults so closely and so regularly with major online merchants, their insights continually help to shape the survey design, the �elding methodology, andthe overall analysis presented herein. This year, at the
4

Respondents were required to answer all questions completely in order for the results to be counted among those reported here.
While the individual questions themselves were not randomized (i.e.: Q#7 for one respondent was the same as Q#7 for another), randomization was used inside the questions themselves. This measure was taken to mitigate order bias.
ConclusionsThis �fth annual study of frequent online shoppers points to �ve important conclusions for Internet retailers.
#1: It’s a multi-channel communication world.Shoppers use and are satis�ed with a wide variety of channels to communicate with Internet retailers. And, because each channel carries with it di�erent expecta-tions regarding response and resolution times, retailers can use this knowledge to more e�ectively and pro�tably manage the interactions they have with customers and prospects.
#2: Social media as a sales and support channel cannot be denied.Those saying that social media is their preferred way to communicate with an Internet retailer is up 225% from last year. With 7% of the population choosing social media channels as their favored method, it isn’t hard to imagine that number growing to double digits very soon. An amazing 74% of respondents reported having inter-acted via social media with an Internet retailer and 96% of those interacting said that they received a response. Social media is here to stay, and has a growing role in commerce. The “public” nature of social channels means retailers must monitor communications and be sensitive to response times and relayed information.
Those surveyed (often referred to as “entire sample,” “entire universe,” “respondent universe,” “population,” or other derivatives of these terms) totaled 4,709 people – up from just over 2,000 respondents last year.
The survey took, on average, 10 to 15 minutes to complete and included a branch and several triggers in order to ask distinct follow-up questions to respondents depending on their preferred communication channel, their experience with proactive chat, and other factors.
As “Live Chat” is a term that is oft confused with instant messaging platforms and/or public chat rooms, the survey included the following prompt:
This year included visual prompts for proactive chat invitations1, button placement, and button design options. A video component was also used in order to gauge respondents’ reactions to a particular type of proactive invitation. Our goal was to understand consumer preferences in execution in hopes of making recommendations to retailers.
The instrument included several screening questions in order to validate shopping frequency, country of residence, and annual shopping expenditure. Only those respondents who indicated that they lived in one of the targeted geographies mentioned above, spent in excess of $500 USD per year online, and shopped at least once a month were allowed to participate. All other respondents were terminated.
In this next question and in several other questions in this survey, you will see the term, “Live Chat.” Live Chat, in this context, is a one-on-one keyboard based conversation between yourself and a website’s repre-sentative. Instant messaging services like “Yahoo Messenger” and “Skype” are NOT the type of live chat technology to which this survey refers.
51. “Proactive Chat”: the issuance of an image or form either manually or basedon a set of business rules tied to website visitor behavior, with the speci�c intent to invite the website visitor to engage in a one-on-one chat conversation.
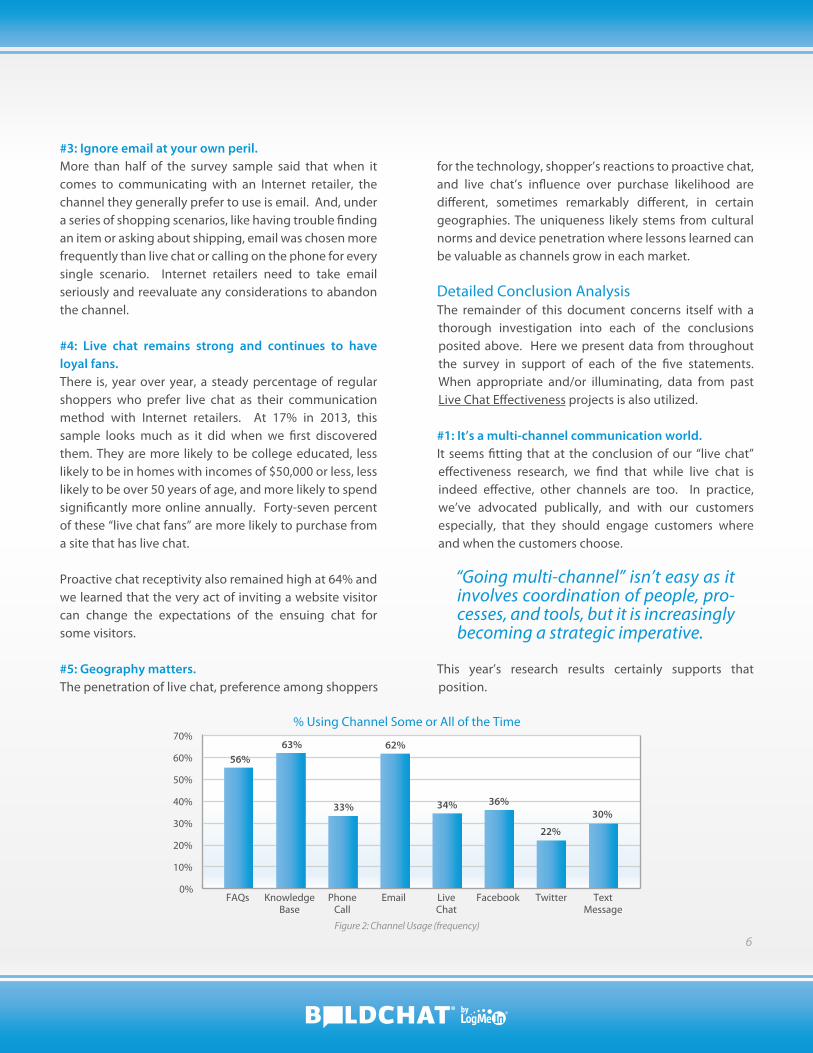
% Using Channel Some or All of the Time
Figure 2: Channel Usage (frequency)
0%
10%
20%
30%
60%
70%
40%
50%
63%56%
33%
62%
34% 36%
22%
30%
FAQs KnowledgeBase
PhoneCall
Email LiveChat
Facebook Twitter TextMessage
for the technology, shopper’s reactions to proactive chat, and live chat’s in�uence over purchase likelihood are di�erent, sometimes remarkably di�erent, in certain geographies. The uniqueness likely stems from cultural norms and device penetration where lessons learned can be valuable as channels grow in each market.
Detailed Conclusion Analysis The remainder of this document concerns itself with a thorough investigation into each of the conclusions posited above. Here we present data from throughout the survey in support of each of the �ve statements. When appropriate and/or illuminating, data from past Live Chat E�ectiveness projects is also utilized.
#1: It’s a multi-channel communication world.It seems �tting that at the conclusion of our “live chat” e�ectiveness research, we �nd that while live chat is indeed e�ective, other channels are too. In practice, we’ve advocated publically, and with our customers especially, that they should engage customers where and when the customers choose.
This year’s research results certainly supports that position.
#3: Ignore email at your own peril.More than half of the survey sample said that when it comes to communicating with an Internet retailer, the channel they generally prefer to use is email. And, under a series of shopping scenarios, like having trouble �nding an item or asking about shipping, email was chosen more frequently than live chat or calling on the phone for every single scenario. Internet retailers need to take email seriously and reevaluate any considerations to abandon the channel.
#4: Live chat remains strong and continues to have loyal fans.There is, year over year, a steady percentage of regular shoppers who prefer live chat as their communication method with Internet retailers. At 17% in 2013, this sample looks much as it did when we �rst discovered them. They are more likely to be college educated, less likely to be in homes with incomes of $50,000 or less, less likely to be over 50 years of age, and more likely to spend signi�cantly more online annually. Forty-seven percent of these “live chat fans” are more likely to purchase from a site that has live chat.
Proactive chat receptivity also remained high at 64% and we learned that the very act of inviting a website visitor can change the expectations of the ensuing chat for some visitors.
#5: Geography matters. The penetration of live chat, preference among shoppers
6
“Going multi-channel” isn’t easy as it involves coordination of people, pro-cesses, and tools, but it is increasingly becoming a strategic imperative.

Figure 3: Channel Usage (satisfaction)
Contact Method Satisfaction (Good+Excellent)
65%
69%
67%
71%
77%
79%
73%
75%
83%
85%
81%
82%
80%
77%
71%
73%
70%
Telephone Email Live Chat TextingClick-to-Call Social Media
We asked respondents to tell us how frequently they used a wide variety of channels – including self-help channels. Honestly, we expected to see clear winners and losers here, with some channels being used regularly and others almost nonexistent. The disparity was far less evident.
If forced to choose, you might say that Knowledge Base and Email are “winning” channels and Text Messaging and Twitter are the “losers” but a more accurate interpre-tation of this data is that all the channels get used.
And it’s no wonder that shoppers use di�erent channels, as they all seem to satisfy. We asked respondents to recall all their contacts with Internet retailers over the
past three months through a variety of channels, and to rate the satisfaction of those interactions.
Even social media, the clear newcomer to the channel �eld, had 70% of the population saying that when they used the channel with retailers, the experience was either good or excellent. For the three top channels, email, telephone, and live chat respectively, we wanted to understand their relative strengths and weaknesses in certain areas that are predictive of satisfaction. We asked the respondents who’d used those channels with retail-ers to rate each across seven di�erent factors. With only a couple exceptions, we were again surprised.
7

% Saying “Good” or “Excellent” For the Given Channel
Figure 4: Phone, Live Chat, Email Against Customer Satisfaction Criteria
0%
10%
20%
50%
60%
30%
40%
80%
90%
70%
78%75%
71%75%
79%83% 82% 82%84%
76%79%80% 80%
82%85%
59%
75%
70%68%
77%80%
Speed with whichquestion was
answered
Knowledgeof agents
Friendlinessof agents
Professionalismof agents
Thoroughnessof response
Waiting time toreach an agent
Chances that the�rst agent would
solve
Phone EmailLive Chat
In contacting an Internet retailer, there weren’t any glaring winners or losers among the phone, live chat, and email. The only notable exceptions were the relatively poor rating for the phone with regard to wait times and the chances that the �rst agent responding would be able to solve the shopper’s problem. But other than this outlier, all the channels were highly rated for response time, agent knowledge, agent friendliness, thoroughness, professionalism, wait time, and �rst contact resolution.
These multi-channel �ndings are intuitive if we place ourselves in the mind of the shopper. A particular chan-nel may be utilized simply because of circumstance – it is
far easier to place a call while sitting in tra�c for example. But we discovered another factor as well – the shopper’s expectation of timing for a response. We asked shoppers what a reasonable amount of time was to receive a response from a retailer if their inquiries were sent through di�erent channels. The �ndings are operation-ally instructive for retailers. The question used a very broad scale to capture responses:
< 1 min | 1-5 mins | 6-10 mins | 11-20 mins | 21-59 mins | 1-11 hrs | 12-24 hrs | 25-48 hrs | 2 days +
We’ve collapsed the scale here to gain better insight into the data.
8

9
% Satis�ed With Wait Times by Channel
Figure 5: Expected Response Times by Channel
Figure 6: Percent Spending 3 or More Hours on Social Media
% Spending 3 or More Hours on Social Media
28%
47%
12%
20%
YouTube
0%
40%
20%
80%
60%
100%
120%
73%
23%
86%
97%100%
80%
31%
90%
97%100%
33%
7%
59%
91%
100%
41%
10%
65%
93%
100%
44%
8%
71%
95%100%
18%
3%
39%
88%
100%
Phone Live Chat Facebook TextingTwitter Email
Undera minute
10 minor under
60 minor under
1 dayor under
More thantwo or under
#2: Social Media as a sales and support channel cannot be denied.In the 2012 report, we added “Social Media” to the list of choices for which a respondent could indicate their preferred method of communicating with an Internet retailer. Last year, 2% of the population selected this choice. In this year’s survey, we asked the same question – explored later – and expanded our analysis into social by asking about time spent on social channels and “memorable” social interactions with retailers.
Each channel clearly carries with it di�erent expectations regarding the timing of a response.
It is clear that some channels demand real-time resources while others allow more forgiveness. The combination, in fact, of Live Chat and Phone, Social and Texting, and Email seem to span the spectrum from immediacy to hours to days.
Looking at each channel is illustrative. Notice that for Phone and Live Chat, it is necessary to respond speedily in order to satisfy the majority of respondents. For Twitter, Facebook, and Texting, it seems shoppers are willing wait up to an hour to be satis�ed. 65% of shop-pers, for example, say that they are satis�ed if their Twitter inquiry is responded to within an hour or less. Finally, 88% of respondents said that waiting a day for an email response was satisfactory.
This �nding posits that some e�ciency could be achieved by contact centers simply through channel diversi�cation.

Figure 7: Retailer Response Time via Social Media
Retailer Response to Social Media Queries
Immediately In Minutes Within Hours Within a Day More than a Day
20%
31%
9%9%
27%
60% withinhours or less
20%
31%
9%
the experience was so positive. We asked survey takers to tell us about these positive social media experiences, and it is clear from reading them that Internet retailers can succeed in delighting customers by responding quickly and knowledgably.
“…when my package hadn't arrived, they provided me with the tracking number via twitter, which they messaged back almost immediately about.”
“[The retailer,] via twitter, suggested solutions and tweeted links I could follow.”
The amount of time respondents spend on social chan-nels coupled with the responsiveness of retailers to their social queries likely explains the growth in the social channel being a preferred communication method. Timing is of the essence as its performance is in the public domain which should ensure retailer monitoring.
Nearly half of the sample, 47%, spends 3 or more hours per week on Facebook. Other social channels experience less usage, but the results are still impressive with 28% and 20%, spending that much time on YouTube and Twitter, respectively.
Perhaps more surprising is that 74% of respondents indicated that they have posed a question or posted an inquiry to a retailer using social media. In response, Inter-net retailers have done overwhelmingly well, according to the sample.
To questions asked via social media, 96% of the universe said that they have received a response, and quickly too – with 60% saying the retailer communicated with them in hours, or less.
Twenty percent of respondents said that they could recall a speci�c social media interaction with a retailer because
10

Figure 8: Preferred Communication Channel
Why is Social Media your preferred channel?
Figure 9: Why Social?
Live Chat Email Telephone Social Media
Preferred Communication Channel 2011-2013
0%
10%
20%
50%
60%
30%
40%
70%
19%18% 17%
58%63%
53%
20% 20%23%
2%7%
Access frommultiple devices
Faster Spend so muchtime anyway
OtherIt’s public, getbetter service
0%
10%
20%
50%
60%
30%
40%
70%
80%
90%
100%
44%47%43% 43%
1%
2011 2012 2013
For the past three years, all respondents are asked to simply indicate their overall preferred way to communi-cate with an Internet retailer and this year, those saying “Social Media” is up 225% over last year. With 7% choos-ing Social as their preferred communication channel with retailers, it is very likely that this �gure will hit double-digits very soon – if not there already.
We asked those who chose social media as their preferred channel why they made this selection and, disappointingly, there wasn’t an overwhelmingly obvious reason though all could �t under the umbrella of convenience.
11

Email Preference 2011 to 2013
Figure 11: Email Preference 2011 to 2013
Number of Times Channel was the Winner over the past 5 years.
Figure 12: Preferred Channel Under Shopping Scenarios
Social Preferrers by Age
Figure 10: Social Media Preferrers by Age
21-30 31-40 41-50 51-60 60+
2013 Sample
0%
10%
20%
5%
15%
30%
40%
45%
25%
35%
38%
25%28%
24%
41%
14% 14%
5%8%
2% 2011 2012 201348%
50%
54%
52%
58%
62%
64%
56%
60%
20%
18%
14%
16%
10%
8%
6%
12%
63%
58%
53%
-8%-8%
Email % Change
Live ChatEmail Phone
Having trouble �nding item
To ask a general question
Experience checkout error
To ask about guarantees
Inquire about specials
To inquire about an orderalready placed
3
4
3
5
5
5
0
0
1
0
0
0
2
1
1
0
0
0
Social Preferrers
12
For every other channel – email, live chat, and the phone - there was a top reason which likely explains a shopper’s preference, but as Figure 9 shows, nothing stands out for social media. A possible theory has to do with the demo-graphic pro�le of the “social media preferrer,” which skews younger.
Perhaps not surprisingly, the population who choose social media as their preferred way to communicate with an Internet retailer are much more likely to be aged 21-30 and 31-40 and much less likely to be older than that. Given that many younger people use social media as a matter of routine, it could simply be that the reason they prefer social media to communicate is out of a sense of normalcy.
#3: Ignore email at your own peril.For respondents who indicated that they’ve never had a chat with a retailer, we asked them why they hadn’t ever engaged, and the number one response, with 44% indicating the reason, was simply because they “preferred to use email.” The next most popular answer only had 29% of respondents selecting it.
And even though email as a preferred communication method with retailers has declined from 63% to 53% over the years, the fact is that email remains the domi-nant choice among survey respondents.
Interestingly, when the preference question is posed under a series of shopping scenarios, email – for the �rst time in �ve years of research – was selected by more respondents in each case than phone or live chat. And, if you look at the scenarios over the past �ve years, email has consistently been a strong performer.

Why Email Is Preferred
Figure 13: Why Email Is Preferred
I’m not in a hurryto get a response
I’m always onmy computer
Other
I can check frommultiple devices
I receive a morecomplete answer
I prefer one-waycommunication
vs a dialogue
0% 10% 20% 30% 40% 50% 60% 70%
9%
22%
26%
41%
58%
45%
13
While only 22% of those choosing email as their preferred communication method with a retailer say that one of the reasons is because they’re “…not in a hurry to get a response,” recall that respondents were willing to wait much longer (up to a day) for an email response.
Email, by far, was the standout champion sweeping three scenarios completely and taking the winning title a total of 25 times over the history of this research.
We asked those who chose email as their preferred chan-nel why they selected it and it’s clear that thoroughness and ubiquity or access are the main factors.
Of note, the number one answer from the 9% of respon-dents who said, “other” was the ability to have a docu-mented “paper trail” associated with the communication. Had one of the answers to this question been, “I receive a more complete and documented answer,” it’s likely that many from the “Other” category would have migrated in that direction. These two factors, email’s asynchro-
nous nature coupled with the fact that more than 50% of shoppers prefer the channel, make the inten-tioned management of email an imperative for retailers.

How Many Times Chattedwith Retailers in the Past 3 Months
Figure 14: Chat Frequency
% Preferring Live Chat 2011-2013
Figure 15: Percent Preferring Live Chat 2011-2013
2012 2013
50%
60%
20%
30%
40%
80%
90%
70%
10%
80%75%
20%25%
4 or more1-3
Live Chat20122011 2013
20%
30%
40%
45%
10%
25%
35%
15%
18% 17%19%
14
The pro�le of this “live chat fan” has also remained stable over time. The nature of this pro�le should be kept top-of-mind for its potential value for any retailer.
• More likely to be less than 50 years of age• More likely to be college educated• Less likely to be from a household making $50,000/yr
or less• Far more likely to be frequent shoppers• Far more likely to spend more per year than other
shoppers• This year, it became clear that the live chat fan is more
likely to be a woman
The impact of live chat’s presence on a website remains encouraging with a quarter of respondents saying that seeing live chat on an Internet retailer’s site makes them more likely to purchase. Live chat fans are more influenced, with nearly half saying the same.
#4: Live chat remains strong and continues to have loyal fans.Across the universe, the frequency with which chatters engage with a retailer is trending up, with a quarter reporting four or more engagements in the past ninety days.
Interestingly, those who chose live chat as their preferred communication channel with retailers were only slightly more likely to have engaged in four or more chats in the past three months (26% vs. 25% for the entire sample.)
Since we began asking the question three years ago, the percentage of regular online shoppers who choose chat as their preferred communication method has remained essentially steady.

Proactive Chat Receptiveness
Figure 17: Proactive Chat Receptiveness
Live Chat’s In�uence on Purchase
Figure 16: Live Chat’s In�uence on Purchase
0%
10%
20%
50%
60%
30%
40%
70%
80%
90%
100%
Entire Sample Prefer Chat Chatters Non-Chatters
14%
25%
6.8%
47%36%
11%
14%
17%
0%
10%
20%
50%
60%
30%
40%
70%
0%
10%
20%
50%
60%
30%
40%
70%
2010 2011 2012 2013
14%
14%
24%
15%
18%
29%
21%
18%
27%
21%52%
62% 66% 64%
17%
27%
No impact
61%46% 54%
69%
Less likely to purchase More likely to purchase
3 Total Receptive4 5
Proactive chat – the practice of actively inviting website visitors into a chat interaction – enjoys continued receptivity among the survey takers.
15
This year we also asked about a particular proactive technology employed by some live chat providers. We know from previous surveys that one of the practices that can drive someone away from a website is an invitation that “interfered with their shopping.” We showed the respondents a video of such an invite and then repeated our receptivity question. Not surprisingly, this type of invite is received more negatively as can be seen by the skewing of the “forced invite” line in Figure 18. While 19%
Proactive Chat
We ask respondents to rank the practice on a 1 to 5 scale where 1 is “annoyed”, and 5 is “glad to know help is available.” Those choosing 3, 4, or 5, are judged to be receptive to the practice.

Proactive Receptiveness - Invite Comparison
Figure 18: Proactive Chat Receptiveness
1 2 3 4 5
20%
30%
10%
15%
25%
0%
5%
20%
27%
15%13%
25%
17%
27%
17%21%
19%
Forced Invite General Invite
Do you have higher expectations of theinteraction because the retailer invited you?
Figure 19: Expectations of Proactive Chats
12%
62%
26%
Yes, Higher
Neither Higheror Lower
No, Lower
16
This �nding, combined with an increase in the number of respondents who indicate that they’ve left a website because of poor invitation practices (up to 32% from 20% last year) tells Internet retailers a cautionary tale about proactive chat. We know that proactive chat works – visitors engaging in proactive chats are eight times more likely to buy than regular website visitors2 – but doing proactive chat right takes a focused or strategic e�ort and continual measurement.
Live Chat Best PracticesIn addition to asking about the factors that make a chat session successful, we expanded our line of questioning in order to gauge shopper opinion about what kind of inquiries they expect to see handled through chat, when they want chat available, and aesthetic preferences regarding chat button design and placement.
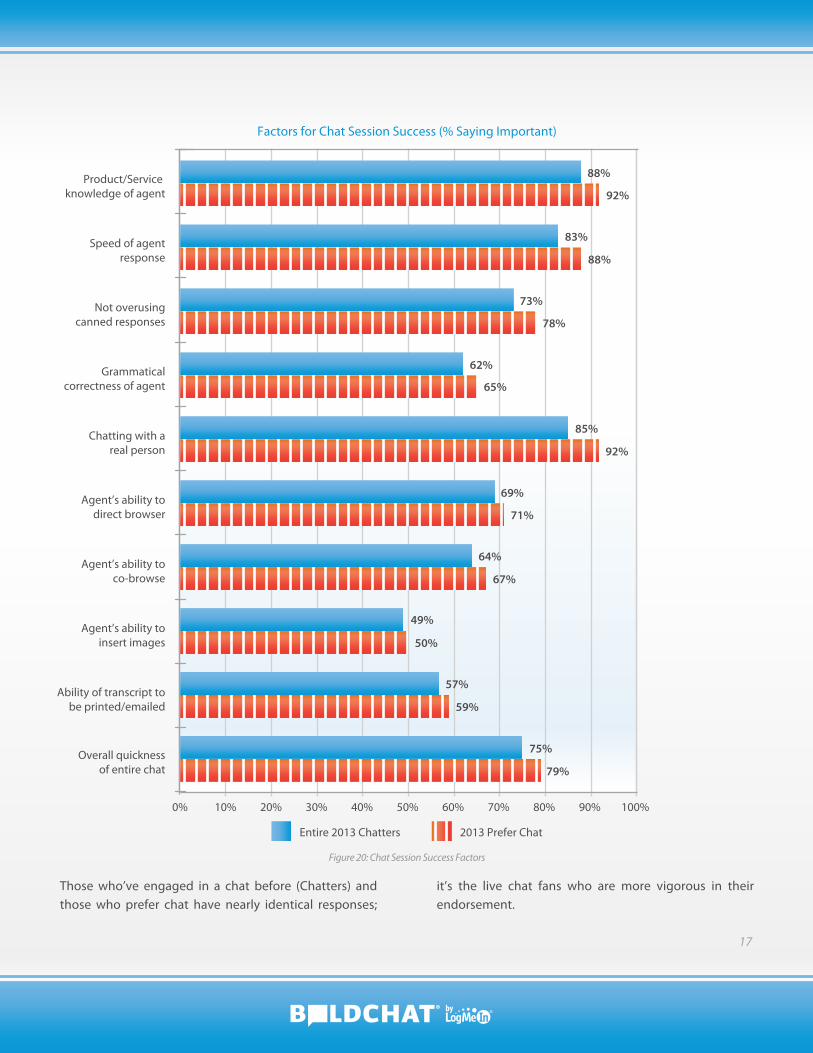
Consistent with past years, we learned that the factors most critical to someone judging a chat session a success is the knowledge and speed of the agent – and a human agent at that.
Of those who have ever accepted an invite, (52% and �at compared to 2012), the vast majority of them (89%) are either somewhat or very satis�ed with the resultant chat conversation. Interestingly, we learned that the practice of inviting website visitors can impact the visitor’s expec-tations of the subsequent chat, making their satisfaction score even more impressive.
are strongly annoyed with invitations in general, 25% are annoyed with invitations that essentially interrupt their shopping.
2. Live Chat Performance Benchmarks: A Statistical Analysis, 2012, LogMeIn
17
Product/Service knowledge of agent
Speed of agentresponse
Not overusingcanned responses
Grammaticalcorrectness of agent
Chatting with areal person
Agent’s ability todirect browser
Agent’s ability toco-browse
Agent’s ability toinsert images
Ability of transcript tobe printed/emailed
Overall quicknessof entire chat
90% 100%0% 20% 40% 60% 80%10% 30% 50% 70%
92%
88%
88%
83%
78%
73%
65%
62%
92%
85%
71%
69%
67%
64%
50%
49%
59%
57%
79%
75%
Factors for Chat Session Success (% Saying Important)
Figure 20: Chat Session Success Factors
Entire 2013 Chatters 2013 Prefer Chat
Those who’ve engaged in a chat before (Chatters) and those who prefer chat have nearly identical responses;
it’s the live chat fans who are more vigorous in their endorsement.
18
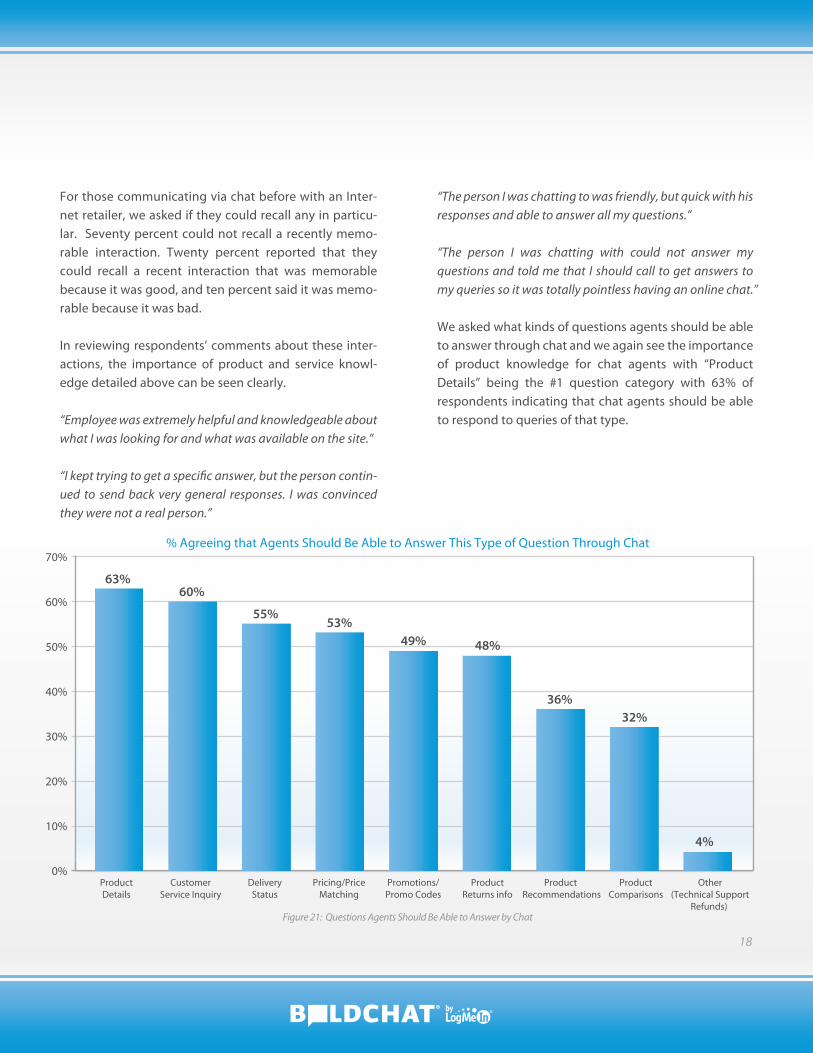
% Agreeing that Agents Should Be Able to Answer This Type of Question Through Chat
Figure 21: Questions Agents Should Be Able to Answer by Chat
0%
20%
10%
30%
60%
40%
50%
70%
60%63%
55%53%
49% 48%
36%32%
4%
ProductDetails
CustomerService Inquiry
DeliveryStatus
Promotions/Promo Codes
Pricing/PriceMatching
ProductReturns info
ProductComparisons
Product Recommendations
Other(Technical Support
Refunds)
“The person I was chatting to was friendly, but quick with his responses and able to answer all my questions.”
“The person I was chatting with could not answer my questions and told me that I should call to get answers to my queries so it was totally pointless having an online chat.”
We asked what kinds of questions agents should be able to answer through chat and we again see the importance of product knowledge for chat agents with “Product Details” being the #1 question category with 63% of respondents indicating that chat agents should be able to respond to queries of that type.
For those communicating via chat before with an Inter-net retailer, we asked if they could recall any in particu-lar. Seventy percent could not recall a recently memo-rable interaction. Twenty percent reported that they could recall a recent interaction that was memorable because it was good, and ten percent said it was memo-rable because it was bad.
In reviewing respondents’ comments about these inter-actions, the importance of product and service knowl-edge detailed above can be seen clearly.
“Employee was extremely helpful and knowledgeable about what I was looking for and what was available on the site.”
“I kept trying to get a speci�c answer, but the person contin-ued to send back very general responses. I was convinced they were not a real person.”

Chat Button Placement
Figure 23: Chat Button Placement
Chat Availability
Figure 22: Chat Availability
Availability Important
24/7
Weekday Hours (8 to 5)
Weekday Extended (5 to 10)
Weekend Day Hours (8 to 5)
Weekend Extended (5 to 10)
77%
83%
84%
84%
79%
19
While 77% of the sample did say that round-the-clock availability was important, far more say that making chat available on weekdays after work hours and on weekend days is important. That this coincides with “regular” shopping hours is likely no accident.
We asked respondents to rank order two aesthetic aspects for live chat – button location and button design. Each rank position was worth a certain number of points, with the �rst place ranking obviously being worth more than subsequent positions. We calculated the results based on the percentage of the total points won for each choice.
Below you can see the same visual prompt that survey takers did with four di�erent button locations being shown on a �ctional eCommerce website.
Many companies wrestle with whether or not to make chat available on a 24X7 basis. We asked respondents how important it was for chat to be available at di�erent times.
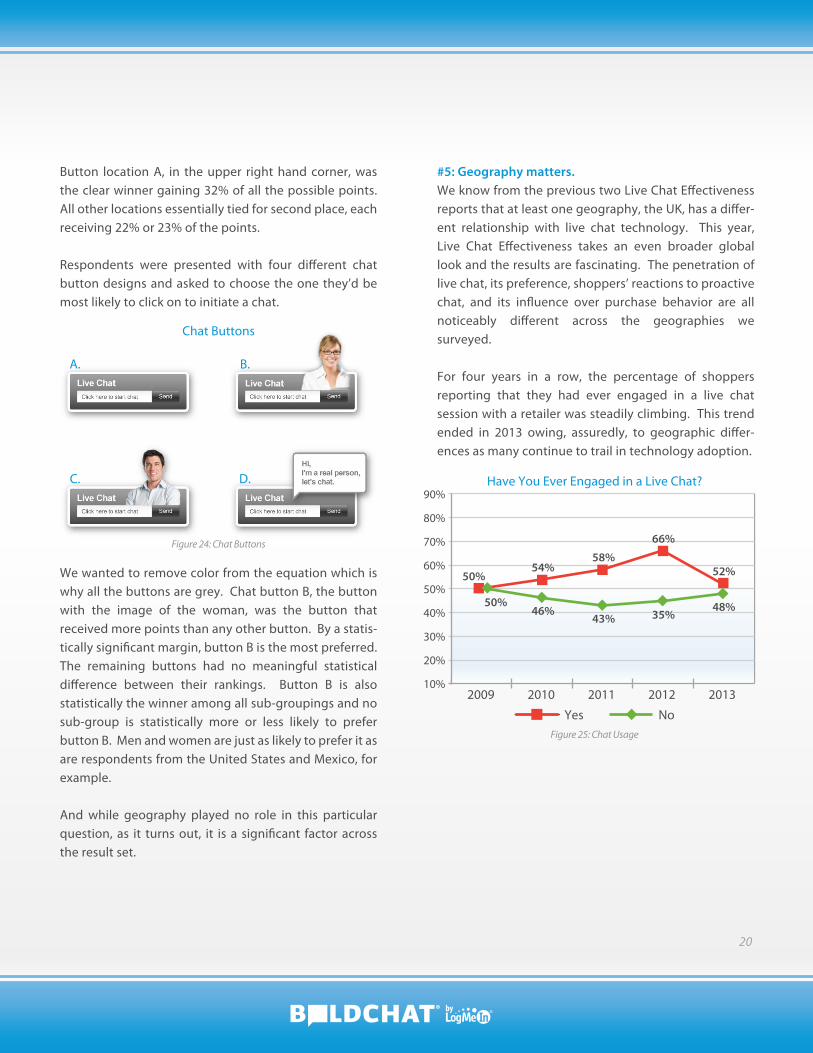
Chat Buttons
Figure 24: Chat Buttons
Have You Ever Engaged in a Live Chat?
Figure 25: Chat Usage
A. B.
C. D.
2012201120102009 2013
50%
60%
20%
30%
40%
80%
90%
70%
10%
54%
46%
66%
50%
50%
52%58%
35%48%
43%
Yes No
20
Button location A, in the upper right hand corner, was the clear winner gaining 32% of all the possible points. All other locations essentially tied for second place, each receiving 22% or 23% of the points.
Respondents were presented with four di�erent chat button designs and asked to choose the one they’d be most likely to click on to initiate a chat.
We wanted to remove color from the equation which is why all the buttons are grey. Chat button B, the button with the image of the woman, was the button that received more points than any other button. By a statis-tically signi�cant margin, button B is the most preferred. The remaining buttons had no meaningful statistical di�erence between their rankings. Button B is also statistically the winner among all sub-groupings and no sub-group is statistically more or less likely to prefer button B. Men and women are just as likely to prefer it as are respondents from the United States and Mexico, for example.
And while geography played no role in this particular question, as it turns out, it is a signi�cant factor across the result set.
#5: Geography matters.We know from the previous two Live Chat E�ectiveness reports that at least one geography, the UK, has a di�er-ent relationship with live chat technology. This year, Live Chat E�ectiveness takes an even broader global look and the results are fascinating. The penetration of live chat, its preference, shoppers’ reactions to proactive chat, and its in�uence over purchase behavior are all noticeably di�erent across the geographies we surveyed.
For four years in a row, the percentage of shoppers reporting that they had ever engaged in a live chat session with a retailer was steadily climbing. This trend ended in 2013 owing, assuredly, to geographic di�er-ences as many continue to trail in technology adoption.

21
Have You Ever Engaged in a Live Chat?
Figure 26: Chat Usage (by Geography)
Preferred Communication by Geography
Figure 27: Preferred Communication Channel (by Geography)
Yes
0%
10%
20%
50%
60%
30%
40%
70%
80%
90%
100%
Entire 2013 United States Canada Europe Australia/New Zealand
Mexico
48%35%
49% 55% 62%
24%
76%
0%
40%
50%
20%
30%
60%
10%
70%
53%
17%
23%
7%
35%
27%
33%
5%
53%
16%
26%
5%
64%
11%
16%
9%
35%
20%22%
24%
Entire 2013 United States Canada MexicoEurope
38%45%51%
65%52%
No
Live Chat Email Telephone Social Media
Looking at the same question by geographic grouping explains the data and presents an interesting global view of the opportunity for live chat. While three quarters of Mexico’s regular Internet shoppers and nearly two thirds of America’s have chatted with an Internet retailer, only 38% in Australia/New Zealand, and just 45% in Europe had done the same.
Even more interesting is how the di�erent geographies responded to the question about a generally preferred communication channel with retailers.

22
Proactive Invitation Receptiveness
Figure 28: Proactive Chat Receptiveness (by Geography)
3 4 5
0%
10%
20%
50%
60%
30%
40%
70%
80%
90%
Entire 2013 United States Canada Europe Australia/New Zealand
Mexico
17%
21%
65%
27%
22%
67% 67%
16% 23%
19%19%
63%59%
16%
28%
13%
21%
76%
16%
22%
38%
25%25%29%
given the slightly younger audience that was surveyed in Mexico. That fact, combined with a decent smart phone penetration rate, likely explains why the younger and more frequent shopper in Mexico relies on social channels.
It could be this same phenomenon responsible for Mexico’s above average receptiveness to being proac-tively invited to chat.
There are some meaningful di�erences across the globe when it comes to proactive inviting and this �nding should encourage proactive practitioners to consider using proactive chat rules that are di�erent based on the geographic region of the visitor.
While email, for example, is a preferred communication method for about half the total sample, it is far more preferred in Europe. The United States and Mexico have a more equitable preference for email, the phone, and live chat. Mexico is similar in its channel preference equitability, including 24% of respondents saying that social media is their preferred way to communicate witha retailer. This �nding isn’t as shocking as it may seem
Retailers with global businesses should pay careful attention to this data as there are signi�cant di�er-ences among the geographies with regard to channel preference - signi�-cant enough, perhaps, to have opera-tional consequences.

23
Chat’s In�uence Over Purchase Likelihood
Figure 29: Chat’s In�uence over Purchase (by Geography)
0%
100%
20%
60%
40%
80%
120%
Entire 2013 United States Canada Europe Australia/New Zealand
Mexico
14%
25%
61%
27%
8%
66%
9%
64%
27% 23%
23%
54%
11%
69%
21%
26%
29%
45%
No impact More likely to purchaseLess likely to purchase
successful in connecting with their online customers. As such, we hope that primary research studies like this can help to uncover information regarding:
• Embracing and optimizing all communication chan-nels, especially considering many customers’ penchant for using multiple channels at once about the same issue.
• Evolving trends in chat on a global basis• Exemplary practices for interacting with consumers
across any channel• Monitoring consumer preferences along with a
predisposition to testing new channels
One thing is certainly clear from all �ve years of this research combined – sales and customer service isn’t standing still. Its dynamic nature and high velocity require retailers to be ever vigilant in order to maintain standards of excellence.
Similarly, the presence of chat on an Internet retailer’s website is viewed with some differences depending on the region.
In Europe, the presence of chat has an equal chance to make the shopper more or less likely to buy which certainly points to the need for careful and well thought out deployment in that geography. Mexico, likely again owing to the somewhat younger audience that was surveyed, is much more likely to be positively influenced by chat’s presence.
Recommendations And Next StepsIn last year’s edition of this study, we recommend further analysis into the email channel, additional insights into proactive chat, and a broadening of the sample to include a more global analysis. The findings presented here certainly accomplished those goals but, and as with any research project, it begs more questions. While there will not be a Live Chat Effectiveness 2014 version we do intend to continue our use of primary research to help practitioners of technologies like live chat to be more
24
BoldChat is a market-leading live chat solution enabling businesses to quickly and e�ectively engage visitors on their websites. BoldChat is o�ered in di�erent editions and includes other integrated communications technolo-gies like click-to-call, co-browsing, email management, SMS management, and Twitter management. Organiza-tions of all sizes – from small proprietorships to large ecommerce enterprises – can drive more conversions and higher customer satisfaction by using BoldChat.
BOLDCHATFor more information: Phone: (866)753-9933 Email: [email protected]
Chat with us, start a trial or download more resources like this one at: www.BoldChat.com
BoldChat is owned by LogMeIn, Inc. For more information, please visit www.LogMeIn.com


