+ All Categories
Home > Documents > Live Oak Development Site Land Tracts for Sale - CoStar...

Live Oak Development Site Land Tracts for Sale - CoStar...

Date post: 28-Jan-2019
Category:
Upload: hoangkien
View: 215 times
Download: 0 times
Share this document with a friend
15
210 524 4000 8023 Vantage Dr, Suite 1200 San Antonio TX 78230 reocsanantonio.com SAN ANTONIO RE OC Live Oak Development Site Judson Road & Retama Hollow, San Antonio, Texas 78233 Land Tracts for Sale or Build-to-Suit Todd A. Gold, CCIM CEO, Managing Partner Direct Line 210 524 1309 [email protected] Carl Bohn Vice President Direct Line 210 524 1321 [email protected] SOLD UNDER CONTRACT
Transcript

210 524 40008023 Vantage Dr, Suite 1200

San Antonio TX 78230reocsanantonio.comSAN ANTONIO

R E O C

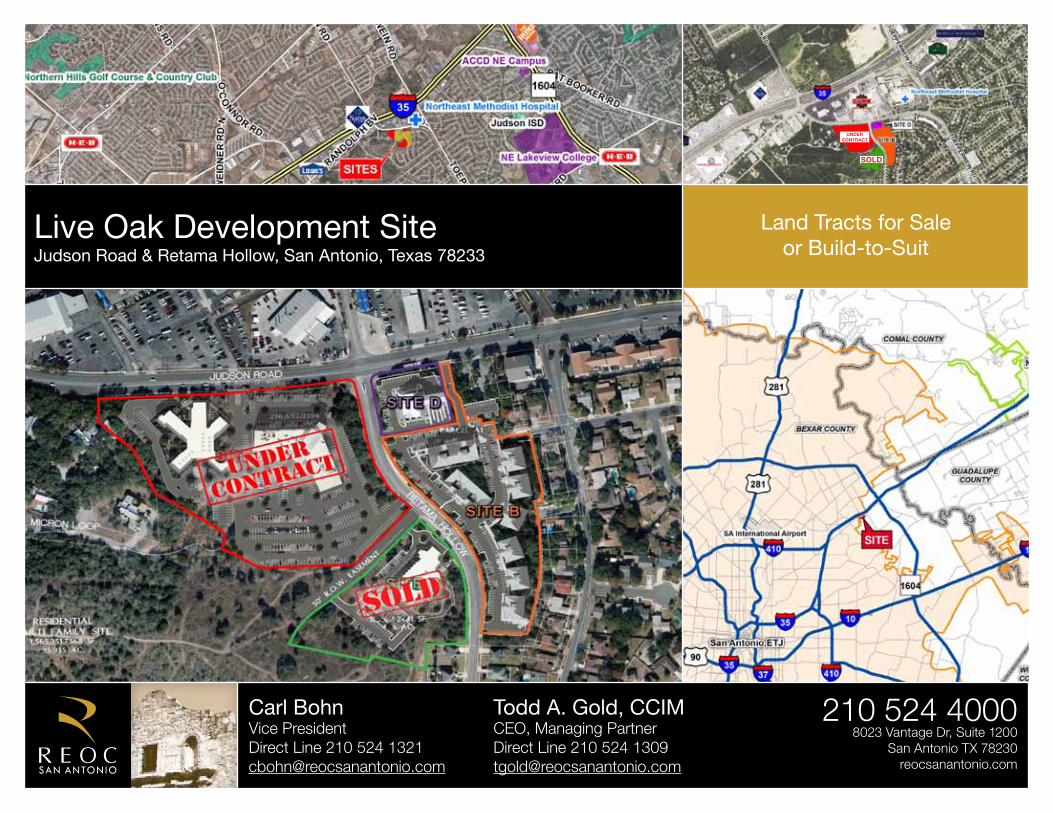
Live Oak Development SiteJudson Road & Retama Hollow, San Antonio, Texas 78233

Land Tracts for Sale or Build-to-Suit

Todd A. Gold, CCIMCEO, Managing PartnerDirect Line 210 524 [email protected]

Carl BohnVice PresidentDirect Line 210 524 [email protected]

SOLD

UNDERCONTRACT

Carl BohnVice PresidentDirect Line 210 524 [email protected]

Todd A. Gold, CCIMCEO, Managing PartnerDirect Line 210 524 [email protected]

210 524 4000

SAN ANTONIOR E O C

SECTION 1 Maps

SECTION 2 Development Plan

SECTION 3 Market Summary

SECTION 4 Quote Sheet

SECTION 5 San Antonio Overview

SECTION 6 Selma/IH-35 Corridor Overview

SECTION 7 Demographics

SECTION 8 TREC Agency Disclosure

Table of Contents

© 2015 REOC San Antonio. REOC San Antonio is a licensed Real Estate broker in the State of Texas operating under REOC General Partner, LLC. The information contained herein is deemed accurate as it has been reported to us by reliable sources. As such, we can make no warranty or representation as to the accuracy or completeness thereof. Further, the property is presented subject to availability, change in price or terms, prior sale or lease, or withdrawal from the market.

Carl BohnVice PresidentDirect Line 210 524 [email protected]

Todd A. Gold, CCIMCEO, Managing PartnerDirect Line 210 524 [email protected]

210 524 4000

SAN ANTONIOR E O C City Location Map

Carl BohnVice PresidentDirect Line 210 524 [email protected]

Todd A. Gold, CCIMCEO, Managing PartnerDirect Line 210 524 [email protected]

210 524 4000

SAN ANTONIOR E O C Aerial Map

Carl BohnVice PresidentDirect Line 210 524 [email protected]

Todd A. Gold, CCIMCEO, Managing PartnerDirect Line 210 524 [email protected]

210 524 4000

SAN ANTONIOR E O C Aerial Map

SOLD

UNDERCONTRACT

Carl BohnVice PresidentDirect Line 210 524 [email protected]

Todd A. Gold, CCIMCEO, Managing PartnerDirect Line 210 524 [email protected]

210 524 4000

SAN ANTONIOR E O C Area Restaurants

Restaurants

1. Zio’s2. Dairy Queen3. Flaco’s4. El Tejano5. Shang-Hai6. Mr. Gatti’s7. Domino’s8. Wing Stop

9. Blimpie’s10. Felix Restaurant11. Longhorn Cafe12. Popeye’s13. Taza’s Coffee14. Nicha’s Comida Mexicana15. Cold Stone Creamery16. Buffalo Wild Wings17. Texas Road House18. Bikini’s

19. Hooligan’s20. IHOP21. Outback Steakhouse22. Las Palapas23. Wendy’s24. Firehouse Subs25. Genghi’s Grill26. Subway27. Sea Island28. Red Robin

29. Starbuck’s30. Baskin Robbin’s31. Panda Express32. Chili’s33. Chipotle34. Cici’s Pizza35. Macaroni Grill36. TGI Friday’s37. Chick-fil-A38. Freddy’s Frozen Custard

39. Cheddar’s40. Hooter’s41. Chuy’s42. Freebird’s43. Chuck E. Cheese44. Houlihan’s45. Jack in the Box46. Jim’s47. McDonald’s48. Taco Cabana

49. Subway50. Carl’s Jr.51. Whataburger52. Denny’s53. Sonic54. Bill Miller55. Bush’s Chicken56. 54th Street Bar & Grill57. Burger King58. McAllister’s

Carl BohnVice PresidentDirect Line 210 524 [email protected]

Todd A. Gold, CCIMCEO, Managing PartnerDirect Line 210 524 [email protected]

210 524 4000

SAN ANTONIOR E O C Potential Development Plan

Carl BohnVice PresidentDirect Line 210 524 [email protected]

Todd A. Gold, CCIMCEO, Managing PartnerDirect Line 210 524 [email protected]

210 524 4000

SAN ANTONIOR E O C Market Summary

Market Area

� Adjacent to the newly renovated, upgraded and expanded Northeast Methodist Hospital

� City of Live Oak

� Extensive medical/clinical services in the area

� Close proximity to many new and established residential neighborhoods

� Close proximity to many area restaurants, shopping, other amenities and services

� High growth area

� High traffic area

� Perfect location for medical users, medical related retail, etc.

� Site offers tremendous connectivity due to the retail power centers, major employers, colleges and highly concentrated residential development in the direct area

� Over 1,200,000 square feet of retail in the nearby the well occupied retail power center, Forum at Olympia Parkway

� Excellent access to and from IH-35 and Loop 1604

� Excellent visibility from IH-35

� Convenient circulation around the site enables users to obtain easy access to IH-35

� IH-35 corridor commuter traffic is an essential element for successful businesses in this area

� Many recreational attractions located nearby including Retama Park, multiple golf courses and unlimited shopping in the area’s many shopping center options

Drive Time Highlights

� 4.8 miles (8 minutes) to Rackspace Hosting, an IT hosting company ranked in 2011 as one of the top 100 places to work by Fortune Magazine with 2,400 employees in San Antonio

� 1.2 miles (4 minutes) to Randolph Brooks Federal Credit Union Headquarters which has 400,264 members and 1,150 employees

� 2.6 miles (6 minutes) to the main office of Judson Independent School District which employs 2,799 full time teachers, administrators and staff and has 22,503 students enrolled in 2012

� 2.6 miles (5 minutes) to Northeast Lakeview College which currently serves over 6,000 students and will serve 15,000 students at capacity

� Less than 2 miles from two additional Alamo Community College satellite locations

Traffic Counts

IH-35 west of Judson Road; 196,975 vpd (2015)

IH-35 east of Judson Road; 191,955 vpd (2015)

Toepperwein south of IH-35; 14,220 vpd (2010)

Toepperwein east/south of Judson Road; 19,240 vpd (2000)

Judson Road west of Retama Hollow; 15,560 vpd (2000)Traffic counts from TxDOT Statewide Planning Map & MPSI (Market Planning

Solutions Inc.) Systems Inc. d.b.a. DataMetrix

Carl BohnVice PresidentDirect Line 210 524 [email protected]

Todd A. Gold, CCIMCEO, Managing PartnerDirect Line 210 524 [email protected]

210 524 4000

SAN ANTONIOR E O C Quote Sheet

Total Site A B C D

Acres 10.044 7.3 4.13 1.22

SF 571,651 317,988 180,011 53,913

Zoning B-3 B-1 B-3 B-3

Sale Price/SF UNDER CONTRACT $8.25 SOLD $9.75

Actual Sale Price under any proposed purchase contract is a function of the relationship of numerous characteristics including credit worthiness of buyer and other factors deemed important by the Seller.

This Quote Sheet does not constitute an offer. Neither this document nor any oral discussions between the parties is intended to be a legally binding agreement, but merely expresses terms and conditions upon which the Landlord may be willing to enter into an agreement. This Quote Sheet is subject to modification, prior sale or withdrawal without notice and neither party hereto shall be bound until definitive written agreements are executed by and delivered to all parties to the transaction. The information provided herein is deemed reliable, however, no warranties or representations as to the accuracy are intended, whether expressed or implied.

Carl BohnVice PresidentDirect Line 210 524 [email protected]

Todd A. Gold, CCIMCEO, Managing PartnerDirect Line 210 524 [email protected]

210 524 4000

SAN ANTONIOR E O C San Antonio Overview

Largest U.S. Cities

1 New York2 Los Angeles3 Chicago4 Houston5 Philadelphia6 Phoenix7 San Antonio8 San Diego9 Dallas10 San Jose

Ethnicity

Black Alone

American Indian Alone

Asian Alone

Some Other Race Alone

Two or More Races

White Alone

74.2%7%

0.8%

12%

3.5%

2.3%

Hispanic Origin (Any Race)

Non-Hispanic

45%

55%

San Antonio-New Braunfels Metro Area

Pop

ulat

ion

Med

ian

Age

Tota

l Hou

seho

lds

Avg

. Hou

seho

ld In

com

e

Med

ian

Hou

seho

ld In

com

e

Per

Cap

ita In

com

e

1,711,703

2,142,508

2,318,052

2,524,054

2000 Census

2010 Census

2015 Estimate

2020 Projection

32.9

34.1

34.8

35.6

601,265

763,022

829,834

906,792

$51,426

$62,458

$72,664

$82,673

2000 Census

2010 Census

2015 Estimate

2020 Projection

$39,029

$50,146

$52,913

$60,771

$18,443

$22,135

$26,383

$30,048

Sources: U.S. Census; ESRI 2015 Estimates; U.S. Census Bureau 2010, ESRI forecasts for 2015 & 2020; Fortune 2015 Rankings

Austin80 miles

Dallas280 miles

Houston200 miles

Corpus Christi145 miles

Laredo/Nvo. Laredo 150 miles

Mexico City900 miles

San Antonio

Located in South Central Texas within Bexar County, San Antonio occupies approximately 504 square miles. Situated about 140 miles north of the Gulf of Mexico where the Gulf Coastal Plain and Texas Hill Country meet.

Major Industries

In Billions

$0 $5 $10 $15 $20 $25 $30

Manufacturing

Health Care & Bioscience

Finance

Real Estate & Construction

Military

Hospitality/Tourism

Major Industries

Finance

Real Estate & Construction

Military

Hospitality & Tourism

Health Care & Bioscience

Manufacturing

$0 $5 $10 $15 $20 $25 $30

1 Valero Energy 13

2 Tesoro Corp 77

3 USAA 122

4 CST Brands, Inc 277

5 iHeart Media 429

6 NuStar Energy 741

Fortune 500 CompaniesSAT USRankings

Carl BohnVice PresidentDirect Line 210 524 [email protected]

Todd A. Gold, CCIMCEO, Managing PartnerDirect Line 210 524 [email protected]

210 524 4000

SAN ANTONIOR E O C Selma/IH-35 Corridor North Overview

� The Live Oak Development Site is situated along the IH-35 corridor, which runs from Mexico to Chicago and cuts through the heart of the Randolph Metrocom area in the northeast sec-tor of the San Antonio metro area.

� The City of Live Oak is one of several bedroom communities that surround the Randolph Air Force Base which is where the term Randolph Metrocom originated. Other cities include Schertz, Selma, Universal City, Converse, Cibolo, Marion, Windcrest, Kirby and Garden Ridge. These towns straddle three counties (Comal, Bexar and Guadalupe) and have a combined total of more than 335,000 residents.

� Northeast Methodist Hospital serves the three counties; Bexar, Comal, and Guadalupe, as well as the underserved rural areas. On an annual basis Northeast Methodist Hospital serves a total of 62,347 patients (2012) and contains 179 licensed beds for patient use.

� Northeast Methodist Hospital has undergone major renova-tions to include advanced services in 24-hour emergency, surgical, cardiovascular units, a spacious intensive care unit and inpatient rehabilitation services.

� The area offers a broad selection of affordable housing, good schools and sits in close proximity to major employers includ-ing Fort Sam Houston, San Antonio Military Medical Center (SAMMC), Randolph Air Force Base, Rackspace, and Ran-dolph-Brooks Federal Credit Union.

� Strong residential growth in these bedroom communities over the past decade supported the northward migration of retail away from the once dominant Walzem corridor to the Loop 1604 & IH-35 interchange and beyond.

� Traffic counts along IH-35 near the Loop 1604 interchange average above 170,000 every day as commuters make their way along the corridor to San Antonio and Austin.

� The epicenter of this retail hub is the immensely successful Fo-rum at Olympia Parkway project, which stretches along IH-35

from Loop 1604 to Olympia Parkway. The project features 1.4 million square feet of big-box and inline retail space along with a myriad of dine-in and quick serve restaurants.

� With the Forum at maximum build-out, demand continues to spill over to spur nearby developments. Construction was recently completed on Forum Pointe, a retail center located directly across from The Forum and adjacent to similar-kind centers including The Village at Forum Parkway and the Mar-ket at the Forum.

Traffic CountIH-35 at Loop 1604; 191,955 vpd (2015)Source: TxDOT Statewide Planning Map

Selma/I-35 NMarket Area*

2010Census

2016Estimate

2021Forecast

Population 171,201 188,681 205,484

Total Households 61,585 67,255 72,933

Median Age 35.5 36.4 36.5

Avg HH Income - $78,377 $84,683

Median HH Income - $65,758 $75,807

Per Capita Income - $28,350 $30,452Source: U.S. Census Bureau, Census 2010 Summary File 1. Esri forecasts for 2016 and 2021.

*Market Area = 5-mile radius I-35 N & Old Austin Road

155000

160000

165000

170000

175000

180000

185000

190000

195000

200000

205000

2010 2015 2020

Population Growth- Selma/I-35 N5-miles radius I-35 N & Old Austin Road

Source: US Census, ESRI

Carl BohnVice PresidentDirect Line 210 524 [email protected]

Todd A. Gold, CCIMCEO, Managing PartnerDirect Line 210 524 [email protected]

210 524 4000

SAN ANTONIOR E O C

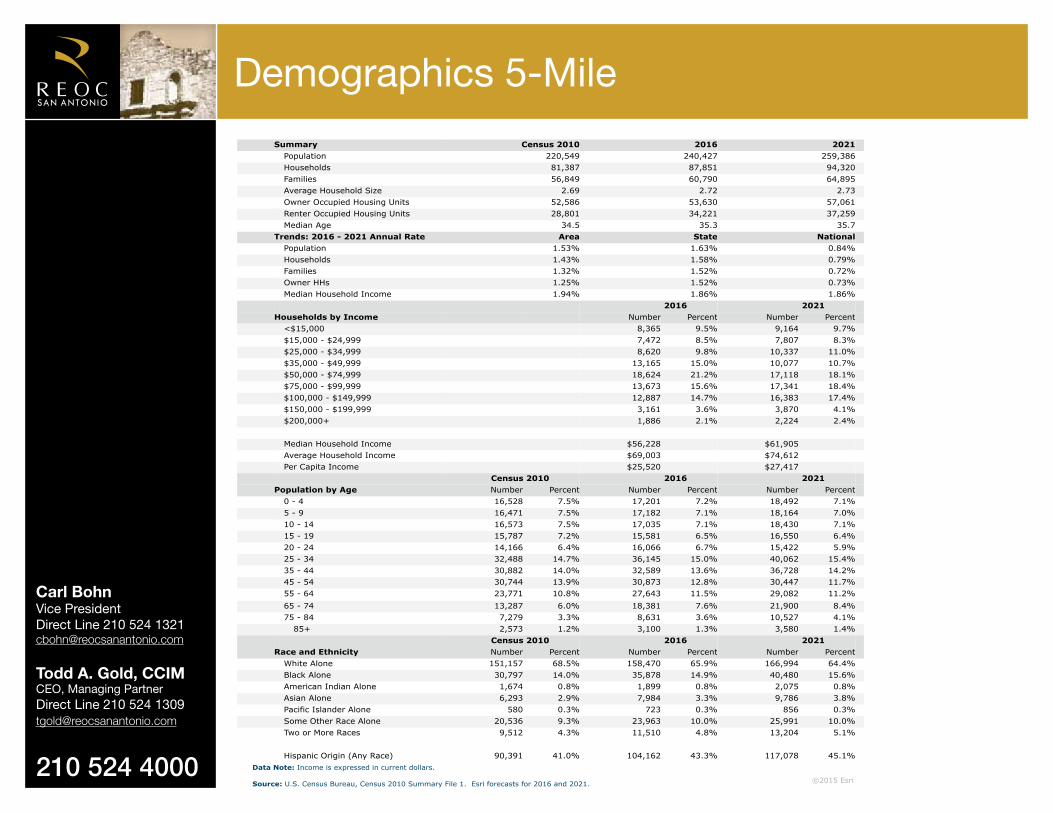
Demographic and Income ProfileLive Oak Development Prepared by Esri12605 Judson Rd, San Antonio, Texas, 78233 Latitude: 29.55468Ring: 1 mile radius Longitude: -98.35695

Summary Census 2010 2016 2021Population 9,230 10,156 11,042Households 3,160 3,417 3,678Families 2,415 2,595 2,783Average Household Size 2.92 2.97 3.00Owner Occupied Housing Units 2,480 2,560 2,724Renter Occupied Housing Units 680 857 953Median Age 34.5 35.2 35.2

Trends: 2016 - 2021 Annual Rate Area State NationalPopulation 1.69% 1.63% 0.84%Households 1.48% 1.58% 0.79%Families 1.41% 1.52% 0.72%Owner HHs 1.25% 1.52% 0.73%Median Household Income 3.03% 1.86% 1.86%

2016 2021 Households by Income Number Percent Number Percent

<$15,000 210 6.1% 226 6.1%$15,000 - $24,999 162 4.7% 162 4.4%$25,000 - $34,999 289 8.5% 331 9.0%$35,000 - $49,999 433 12.7% 308 8.4%$50,000 - $74,999 882 25.8% 791 21.5%$75,000 - $99,999 713 20.9% 887 24.1%$100,000 - $149,999 639 18.7% 859 23.4%$150,000 - $199,999 53 1.6% 66 1.8%$200,000+ 37 1.1% 46 1.3%

Median Household Income $64,921 $75,361Average Household Income $71,949 $78,820Per Capita Income $24,244 $26,276

Census 2010 2016 2021 Population by Age Number Percent Number Percent Number Percent

0 - 4 745 8.1% 780 7.7% 848 7.7%5 - 9 726 7.9% 808 8.0% 856 7.8%10 - 14 728 7.9% 762 7.5% 886 8.0%15 - 19 560 6.1% 666 6.6% 733 6.6%20 - 24 511 5.5% 570 5.6% 619 5.6%25 - 34 1,421 15.4% 1,456 14.3% 1,549 14.0%35 - 44 1,353 14.7% 1,483 14.6% 1,699 15.4%45 - 54 1,260 13.6% 1,305 12.8% 1,325 12.0%55 - 64 1,049 11.4% 1,151 11.3% 1,164 10.5%65 - 74 611 6.6% 803 7.9% 883 8.0%75 - 84 214 2.3% 303 3.0% 396 3.6%

85+ 53 0.6% 70 0.7% 83 0.8%Census 2010 2016 2021

Race and Ethnicity Number Percent Number Percent Number PercentWhite Alone 6,575 71.2% 6,922 68.2% 7,328 66.4%Black Alone 891 9.7% 1,051 10.3% 1,195 10.8%American Indian Alone 76 0.8% 86 0.8% 94 0.9%Asian Alone 330 3.6% 452 4.5% 576 5.2%Pacific Islander Alone 42 0.5% 59 0.6% 74 0.7%Some Other Race Alone 885 9.6% 1,049 10.3% 1,148 10.4%Two or More Races 431 4.7% 537 5.3% 627 5.7%

Hispanic Origin (Any Race) 4,010 43.4% 4,667 46.0% 5,279 47.8%Data Note: Income is expressed in current dollars.

Source: U.S. Census Bureau, Census 2010 Summary File 1. Esri forecasts for 2016 and 2021.

July 29, 2016

©2016 Esri Page 1 of 6

Demographics 1-Mile

Carl BohnVice PresidentDirect Line 210 524 [email protected]

Todd A. Gold, CCIMCEO, Managing PartnerDirect Line 210 524 [email protected]

210 524 4000

SAN ANTONIOR E O C Demographics 3-MileDemographic and Income Profile

Live Oak Development Prepared by Esri12605 Judson Rd, San Antonio, Texas, 78233 Latitude: 29.55468Ring: 3 mile radius Longitude: -98.35695

Summary Census 2010 2016 2021Population 101,441 110,768 119,379Households 37,345 40,364 43,305Families 26,460 28,301 30,167Average Household Size 2.69 2.72 2.73Owner Occupied Housing Units 26,005 26,700 28,426Renter Occupied Housing Units 11,340 13,664 14,879Median Age 35.7 36.8 37.0

Trends: 2016 - 2021 Annual Rate Area State NationalPopulation 1.51% 1.63% 0.84%Households 1.42% 1.58% 0.79%Families 1.29% 1.52% 0.72%Owner HHs 1.26% 1.52% 0.73%Median Household Income 2.70% 1.86% 1.86%

2016 2021 Households by Income Number Percent Number Percent

<$15,000 3,325 8.2% 3,550 8.2%$15,000 - $24,999 2,827 7.0% 2,935 6.8%$25,000 - $34,999 4,002 9.9% 4,780 11.0%$35,000 - $49,999 5,780 14.3% 4,178 9.6%$50,000 - $74,999 8,832 21.9% 7,919 18.3%$75,000 - $99,999 7,033 17.4% 8,997 20.8%$100,000 - $149,999 6,353 15.7% 8,234 19.0%$150,000 - $199,999 1,398 3.5% 1,738 4.0%$200,000+ 815 2.0% 974 2.2%

Median Household Income $59,423 $67,881Average Household Income $71,189 $77,627Per Capita Income $26,327 $28,519

Census 2010 2016 2021 Population by Age Number Percent Number Percent Number Percent

0 - 4 7,160 7.1% 7,492 6.8% 8,040 6.7%5 - 9 7,373 7.3% 7,565 6.8% 7,980 6.7%10 - 14 7,438 7.3% 7,698 6.9% 8,278 6.9%15 - 19 7,056 7.0% 6,931 6.3% 7,462 6.3%20 - 24 6,019 5.9% 6,914 6.2% 6,584 5.5%25 - 34 14,598 14.4% 16,056 14.5% 17,761 14.9%35 - 44 14,140 13.9% 15,127 13.7% 16,920 14.2%45 - 54 14,039 13.8% 14,241 12.9% 14,216 11.9%55 - 64 11,578 11.4% 13,224 11.9% 13,770 11.5%65 - 74 6,901 6.8% 9,363 8.5% 10,934 9.2%75 - 84 3,730 3.7% 4,510 4.1% 5,527 4.6%

85+ 1,405 1.4% 1,646 1.5% 1,906 1.6%Census 2010 2016 2021

Race and Ethnicity Number Percent Number Percent Number PercentWhite Alone 72,502 71.5% 76,252 68.8% 80,357 67.3%Black Alone 11,204 11.0% 13,133 11.9% 14,835 12.4%American Indian Alone 710 0.7% 804 0.7% 874 0.7%Asian Alone 2,933 2.9% 3,822 3.5% 4,733 4.0%Pacific Islander Alone 270 0.3% 342 0.3% 409 0.3%Some Other Race Alone 9,397 9.3% 11,035 10.0% 11,990 10.0%Two or More Races 4,426 4.4% 5,380 4.9% 6,181 5.2%

Hispanic Origin (Any Race) 41,433 40.8% 48,089 43.4% 54,173 45.4%Data Note: Income is expressed in current dollars.

Source: U.S. Census Bureau, Census 2010 Summary File 1. Esri forecasts for 2016 and 2021.

July 29, 2016

©2016 Esri Page 3 of 6

Demographic and Income Profile12605 Judson Road - 9.89 ac12605 Judson Rd, San Antonio, Texas, 78233 Latitude: 29.55468Ring: 3 mile radius Longitude: -98.35695

Summary Census 2010 2015 2020Population 101,441 107,876 115,411Households 37,345 39,862 42,707Families 26,460 28,020 29,849Average Household Size 2.69 2.68 2.68Owner Occupied Housing Units 26,005 26,755 28,508Renter Occupied Housing Units 11,340 13,108 14,199Median Age 35.7 36.6 36.7

Trends: 2015 - 2020 Annual Rate Area State NationalPopulation 1.36% 1.52% 0.75%Households 1.39% 1.54% 0.77%Families 1.27% 1.49% 0.69%Owner HHs 1.28% 1.47% 0.70%Median Household Income 3.05% 2.84% 2.66%

2015 2020 Households by Income Number Percent Number Percent

<$15,000 2,916 7.3% 2,756 6.5%$15,000 - $24,999 2,955 7.4% 2,224 5.2%$25,000 - $34,999 3,660 9.2% 3,343 7.8%$35,000 - $49,999 5,550 13.9% 5,516 12.9%$50,000 - $74,999 9,219 23.1% 8,715 20.4%$75,000 - $99,999 7,108 17.8% 8,883 20.8%$100,000 - $149,999 6,282 15.8% 8,347 19.5%$150,000 - $199,999 1,363 3.4% 1,976 4.6%$200,000+ 810 2.0% 947 2.2%

Median Household Income $60,453 $70,260Average Household Income $71,317 $79,910Per Capita Income $26,516 $29,727

Census 2010 2015 2020 Population by Age Number Percent Number Percent Number Percent

0 - 4 7,160 7.1% 7,314 6.8% 7,871 6.8%5 - 9 7,373 7.3% 7,427 6.9% 7,757 6.7%10 - 14 7,438 7.3% 7,571 7.0% 8,151 7.1%15 - 19 7,056 7.0% 6,811 6.3% 7,340 6.4%20 - 24 6,019 5.9% 6,821 6.3% 6,366 5.5%25 - 34 14,598 14.4% 15,632 14.5% 17,294 15.0%35 - 44 14,140 13.9% 14,842 13.8% 16,532 14.3%45 - 54 14,039 13.8% 13,936 12.9% 13,713 11.9%55 - 64 11,578 11.4% 12,740 11.8% 13,285 11.5%65 - 74 6,901 6.8% 8,896 8.2% 10,083 8.7%75 - 84 3,730 3.7% 4,301 4.0% 5,211 4.5%

85+ 1,405 1.4% 1,585 1.5% 1,808 1.6%Census 2010 2015 2020

Race and Ethnicity Number Percent Number Percent Number PercentWhite Alone 72,502 71.5% 74,864 69.4% 78,406 67.9%Black Alone 11,204 11.0% 12,658 11.7% 14,214 12.3%American Indian Alone 710 0.7% 781 0.7% 848 0.7%Asian Alone 2,933 2.9% 3,451 3.2% 4,135 3.6%Pacific Islander Alone 270 0.3% 335 0.3% 411 0.4%Some Other Race Alone 9,397 9.3% 10,615 9.8% 11,479 9.9%Two or More Races 4,426 4.4% 5,172 4.8% 5,918 5.1%

Hispanic Origin (Any Race) 41,433 40.8% 46,402 43.0% 52,051 45.1%Data Note: Income is expressed in current dollars.

Source: U.S. Census Bureau, Census 2010 Summary File 1. Esri forecasts for 2015 and 2020.

June 29, 2015

©2015 Esri Page 3 of 6

Carl BohnVice PresidentDirect Line 210 524 [email protected]

Todd A. Gold, CCIMCEO, Managing PartnerDirect Line 210 524 [email protected]

210 524 4000

SAN ANTONIOR E O C Demographics 5-MileDemographic and Income Profile

Live Oak Development Prepared by Esri12605 Judson Rd, San Antonio, Texas, 78233 Latitude: 29.55468Ring: 5 mile radius Longitude: -98.35695

Summary Census 2010 2016 2021Population 220,549 240,427 259,386Households 81,387 87,851 94,320Families 56,849 60,790 64,895Average Household Size 2.69 2.72 2.73Owner Occupied Housing Units 52,586 53,630 57,061Renter Occupied Housing Units 28,801 34,221 37,259Median Age 34.5 35.3 35.7

Trends: 2016 - 2021 Annual Rate Area State NationalPopulation 1.53% 1.63% 0.84%Households 1.43% 1.58% 0.79%Families 1.32% 1.52% 0.72%Owner HHs 1.25% 1.52% 0.73%Median Household Income 1.94% 1.86% 1.86%

2016 2021 Households by Income Number Percent Number Percent

<$15,000 8,365 9.5% 9,164 9.7%$15,000 - $24,999 7,472 8.5% 7,807 8.3%$25,000 - $34,999 8,620 9.8% 10,337 11.0%$35,000 - $49,999 13,165 15.0% 10,077 10.7%$50,000 - $74,999 18,624 21.2% 17,118 18.1%$75,000 - $99,999 13,673 15.6% 17,341 18.4%$100,000 - $149,999 12,887 14.7% 16,383 17.4%$150,000 - $199,999 3,161 3.6% 3,870 4.1%$200,000+ 1,886 2.1% 2,224 2.4%

Median Household Income $56,228 $61,905Average Household Income $69,003 $74,612Per Capita Income $25,520 $27,417

Census 2010 2016 2021 Population by Age Number Percent Number Percent Number Percent

0 - 4 16,528 7.5% 17,201 7.2% 18,492 7.1%5 - 9 16,471 7.5% 17,182 7.1% 18,164 7.0%10 - 14 16,573 7.5% 17,035 7.1% 18,430 7.1%15 - 19 15,787 7.2% 15,581 6.5% 16,550 6.4%20 - 24 14,166 6.4% 16,066 6.7% 15,422 5.9%25 - 34 32,488 14.7% 36,145 15.0% 40,062 15.4%35 - 44 30,882 14.0% 32,589 13.6% 36,728 14.2%45 - 54 30,744 13.9% 30,873 12.8% 30,447 11.7%55 - 64 23,771 10.8% 27,643 11.5% 29,082 11.2%65 - 74 13,287 6.0% 18,381 7.6% 21,900 8.4%75 - 84 7,279 3.3% 8,631 3.6% 10,527 4.1%

85+ 2,573 1.2% 3,100 1.3% 3,580 1.4%Census 2010 2016 2021

Race and Ethnicity Number Percent Number Percent Number PercentWhite Alone 151,157 68.5% 158,470 65.9% 166,994 64.4%Black Alone 30,797 14.0% 35,878 14.9% 40,480 15.6%American Indian Alone 1,674 0.8% 1,899 0.8% 2,075 0.8%Asian Alone 6,293 2.9% 7,984 3.3% 9,786 3.8%Pacific Islander Alone 580 0.3% 723 0.3% 856 0.3%Some Other Race Alone 20,536 9.3% 23,963 10.0% 25,991 10.0%Two or More Races 9,512 4.3% 11,510 4.8% 13,204 5.1%

Hispanic Origin (Any Race) 90,391 41.0% 104,162 43.3% 117,078 45.1%Data Note: Income is expressed in current dollars.

Source: U.S. Census Bureau, Census 2010 Summary File 1. Esri forecasts for 2016 and 2021.

July 29, 2016

©2016 Esri Page 5 of 6

Demographic and Income Profile12605 Judson Road - 9.89 ac12605 Judson Rd, San Antonio, Texas, 78233 Latitude: 29.55468Ring: 5 mile radius Longitude: -98.35695

Summary Census 2010 2015 2020Population 220,549 233,554 249,365Households 81,387 86,467 92,425Families 56,849 59,979 63,778Average Household Size 2.69 2.68 2.68Owner Occupied Housing Units 52,586 53,712 56,981Renter Occupied Housing Units 28,801 32,755 35,444Median Age 34.5 35.1 35.4

Trends: 2015 - 2020 Annual Rate Area State NationalPopulation 1.32% 1.52% 0.75%Households 1.34% 1.54% 0.77%Families 1.24% 1.49% 0.69%Owner HHs 1.19% 1.47% 0.70%Median Household Income 2.63% 2.84% 2.66%

2015 2020 Households by Income Number Percent Number Percent

<$15,000 7,828 9.1% 7,700 8.3%$15,000 - $24,999 7,967 9.2% 6,276 6.8%$25,000 - $34,999 8,503 9.8% 8,081 8.7%$35,000 - $49,999 12,174 14.1% 12,277 13.3%$50,000 - $74,999 18,393 21.3% 17,532 19.0%$75,000 - $99,999 14,251 16.5% 17,631 19.1%$100,000 - $149,999 12,570 14.5% 16,605 18.0%$150,000 - $199,999 3,095 3.6% 4,364 4.7%$200,000+ 1,684 1.9% 1,959 2.1%

Median Household Income $56,852 $64,729Average Household Income $68,360 $76,414Per Capita Income $25,447 $28,453

Census 2010 2015 2020 Population by Age Number Percent Number Percent Number Percent

0 - 4 16,528 7.5% 16,765 7.2% 17,913 7.2%5 - 9 16,471 7.5% 16,762 7.2% 17,438 7.0%10 - 14 16,573 7.5% 16,608 7.1% 17,913 7.2%15 - 19 15,787 7.2% 15,279 6.5% 16,079 6.4%20 - 24 14,166 6.4% 15,917 6.8% 14,959 6.0%25 - 34 32,488 14.7% 35,061 15.0% 38,784 15.6%35 - 44 30,882 14.0% 31,604 13.5% 35,274 14.1%45 - 54 30,744 13.9% 30,274 13.0% 29,280 11.7%55 - 64 23,771 10.8% 26,725 11.4% 28,222 11.3%65 - 74 13,287 6.0% 17,396 7.4% 20,321 8.1%75 - 84 7,279 3.3% 8,203 3.5% 9,795 3.9%

85+ 2,573 1.2% 2,962 1.3% 3,387 1.4%Census 2010 2015 2020

Race and Ethnicity Number Percent Number Percent Number PercentWhite Alone 151,156 68.5% 155,176 66.4% 162,007 65.0%Black Alone 30,797 14.0% 34,492 14.8% 38,559 15.5%American Indian Alone 1,674 0.8% 1,823 0.8% 1,982 0.8%Asian Alone 6,293 2.9% 7,249 3.1% 8,558 3.4%Pacific Islander Alone 580 0.3% 709 0.3% 849 0.3%Some Other Race Alone 20,536 9.3% 23,063 9.9% 24,816 10.0%Two or More Races 9,512 4.3% 11,043 4.7% 12,595 5.1%

Hispanic Origin (Any Race) 90,391 41.0% 100,331 43.0% 111,852 44.9%Data Note: Income is expressed in current dollars.

Source: U.S. Census Bureau, Census 2010 Summary File 1. Esri forecasts for 2015 and 2020.

June 29, 2015

©2015 Esri Page 5 of 6

REOC General Partner, LLC

493853

[email protected]

N/A

Brian Dale Harris

405243

[email protected]

N/A

N/A

N/A

N/A

N/A

Carl Henry Bohn

174479

[email protected]

N/A

REOC San A

ntonio, 8023 Vantage D

r. Suite 1200 San Antonio, TX

782302105244000

2105244029Blake Bonner

IABS Form


Recommended