40
LIVE WEBINAR Top Trends in Category Management: Accelerating Maturity & Sophistication Audio Dial In: (877) 273-4202 Passcode: 6360544#
| Date post: | 19-May-2018 |
| Category: |
Documents |
| Upload: | truongquynh |
| View: | 218 times |
| Download: | 1 times |

LIVE WEBINAR
Top Trends in Category Management:
Accelerating Maturity & Sophistication
Audio Dial In: (877) 273-4202
Passcode: 6360544#

Speaker Introductions
Gordon Wade,
Category Management Association
– Managing Partner and Director of Best Practices
Vaughn Roller, Revionics
– Vice President of Assortment and Space
2

Implications of Change in the Marketing Ecosystem
The Category Management Association
3

• CatMan & The CMA
• Major Trends
– Retailer Power Growth
– Shopper Empowerment
– Big Data Impact
• Implications/Recommendations
– CatMan Commitment & Maturity
– Retailer/Supplier Collaboration
– Data & Analytics
Agenda

Category Management
• Demand-side Process
• Purpose: Optimize Shopper Experience
• Drives Supply-side & Replenishment
• Data Intensive & Increasingly Complex
Category Definition
Category Role Category
Assessment Category
Scorecard Category Strategy
Category Tactics
Plan Implementation
Category Review

• Mission: Increase CatMan ROI by Improving Shopper Experience via:
– Thought Leadership
– Sharing Best Practices
– Facilitating Member Interaction
– Professional Competence Certification
Category Management Association
• Global Professional Community

Three Major Trends Driving Change
Growing Power of the Retailer
Digital Empowerment of the Shopper
Impact of the “Big Data” Big Bang
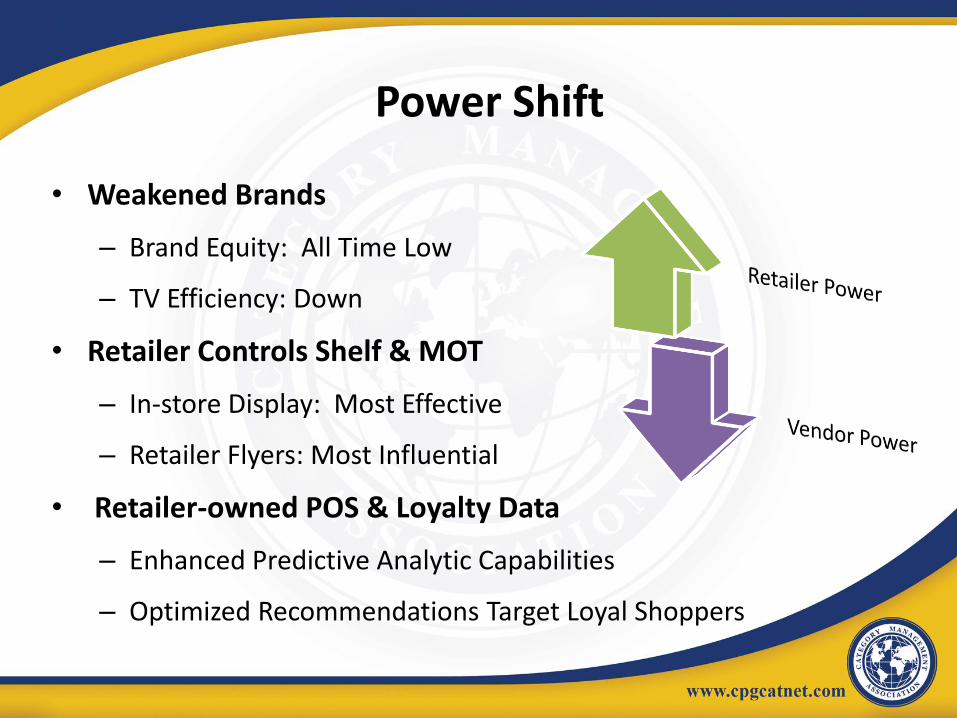
Power Shift
• Weakened Brands
– Brand Equity: All Time Low
– TV Efficiency: Down
• Retailer Controls Shelf & MOT
– In-store Display: Most Effective
– Retailer Flyers: Most Influential
• Retailer-owned POS & Loyalty Data
– Enhanced Predictive Analytic Capabilities
– Optimized Recommendations Target Loyal Shoppers
Threats to Conventional Food Retailers
• Changed Shopper Attitudes
– New Value Mentality Triggered by Recession
– Increased Shopper Individuation
– Increased Category Cherry Picking by Format
• Growth in Value Format Alternatives
– Dollar Stores
– Deep Discounters
– Walmart
– Amazon
• Margin Compression
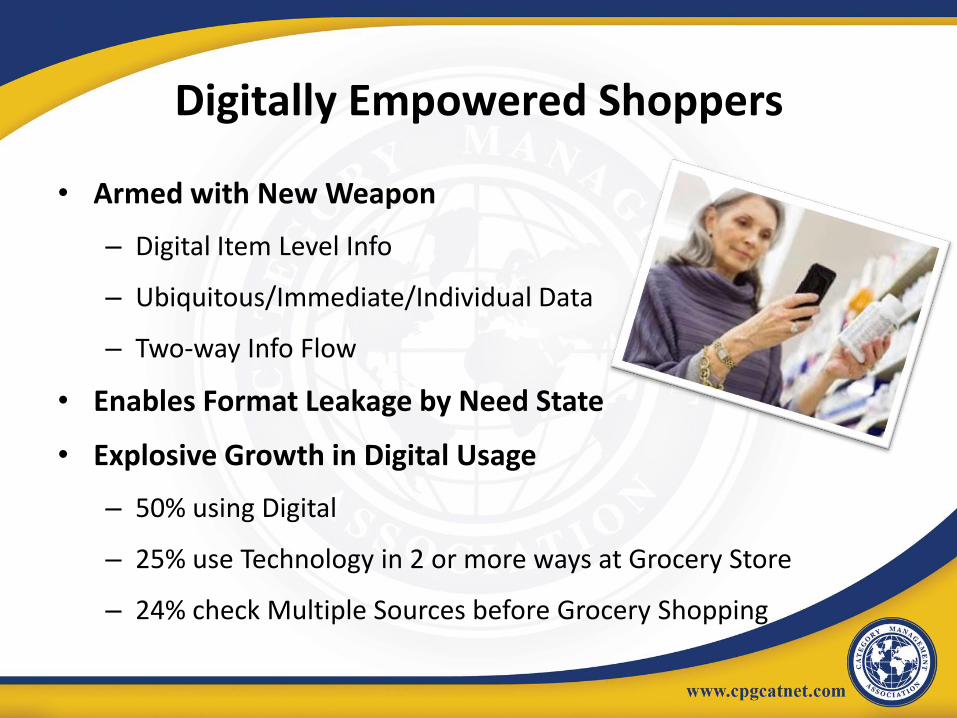
Digitally Empowered Shoppers
• Armed with New Weapon
– Digital Item Level Info
– Ubiquitous/Immediate/Individual Data
– Two-way Info Flow
• Enables Format Leakage by Need State
• Explosive Growth in Digital Usage
– 50% using Digital
– 25% use Technology in 2 or more ways at Grocery Store
– 24% check Multiple Sources before Grocery Shopping

Digitally Empowered Access & Innovation
• Smartphone Shopping Lists
• Online Comparison:
– Testimonials
– Inventory
– Pricing
– Promotions

Digitally Empowered Shopper Data
Retailer Shopper
Shopper Data
Targeted Offers (traditional channels)
• Basket History • Loyalty Card • Demographic Data
Digital Platform
Intent Driven Targeted Offers
• In-Store Actions & Habits • Responsiveness to Offers • Lists & List History • In-Store Searches & Scans • Shopper Location & Shopping Patterns
• Product Details • Price • Inventory • Product Location • Store Map
Premium Data • Nutrition • Eco-index • Recipes • Ratings & Reviews • Comparisons • Related Products
Product Data
What is the Value of Big Data?
• Enables:
– Granular Understanding of Shopper Attitudes & Behaviors
– Customized Merchandise & Offers at Store/SKU Level
– More Efficient & Effective Management of Demand & Supply

Organizing Big Data for Insights
Household Behavior Filter
Need States Filter
Insight Generation
Need States Insights
Category Insights
Price Optimization
Forecasting
Inputs Retail Loyalty
Card
Other Retail Behavior
Social Media
Media Consumption
Lifestyle Behaviors
Filters
Analytics
Outputs
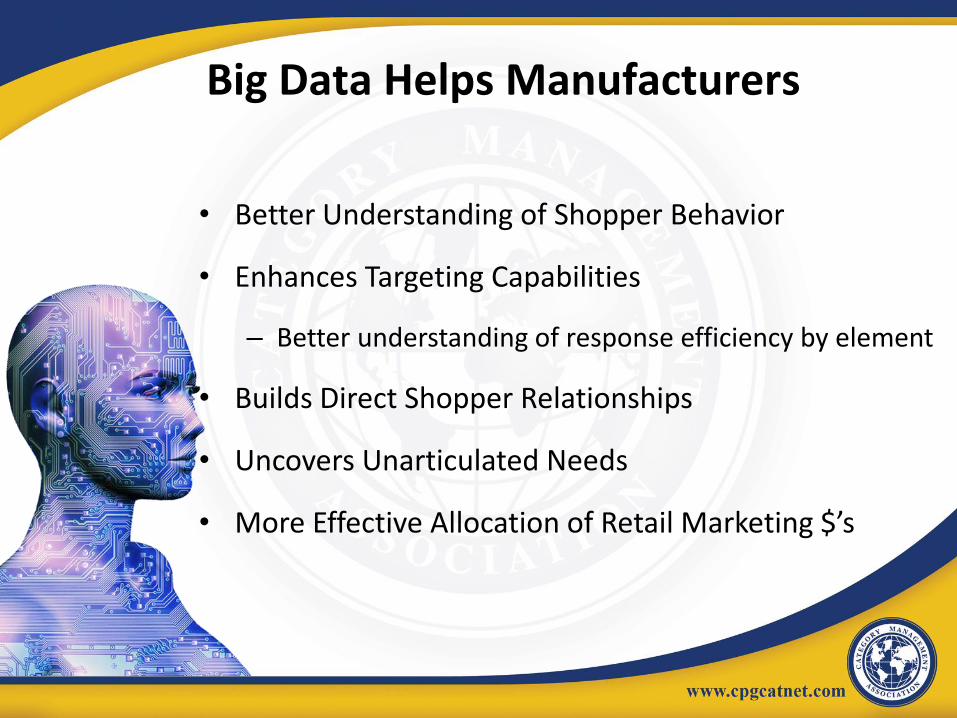
• Better Understanding of Shopper Behavior
• Enhances Targeting Capabilities
– Better understanding of response efficiency by element
• Builds Direct Shopper Relationships
• Uncovers Unarticulated Needs
• More Effective Allocation of Retail Marketing $’s
Big Data Helps Manufacturers

• Household Level Merchandise/Offer Customization
• Localize/Customize Pricing
• Individualize Communication
• Target Private Brand Conversion
• Create Loyalty Strengthening Offers
• Market to Need States
• True Shopper Management
Big Data Helps Retailers

• Total Store Optimization/Customization:
– Dramatic >/< of Category Space
– Right Sizing of Categories by Cluster
– Assortment Customization by Cluster
– Shopper Segment Profit Optimization
– Antidote to Leakage
Big Data Enables Total Store Optimization
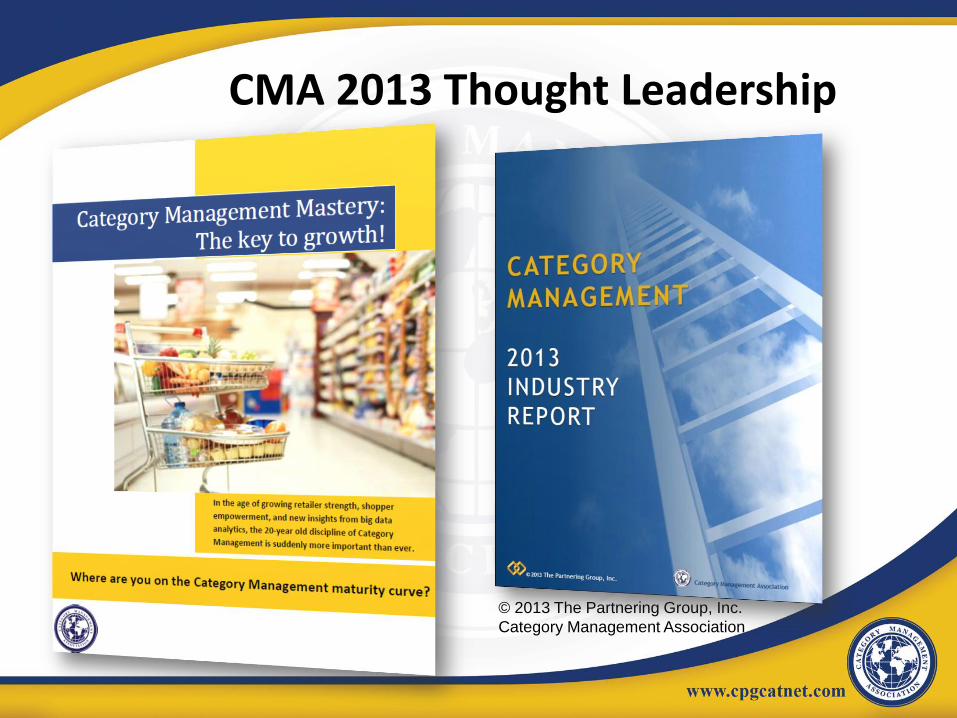
CMA 2013 Thought Leadership
© 2013 The Partnering Group, Inc.
Category Management Association
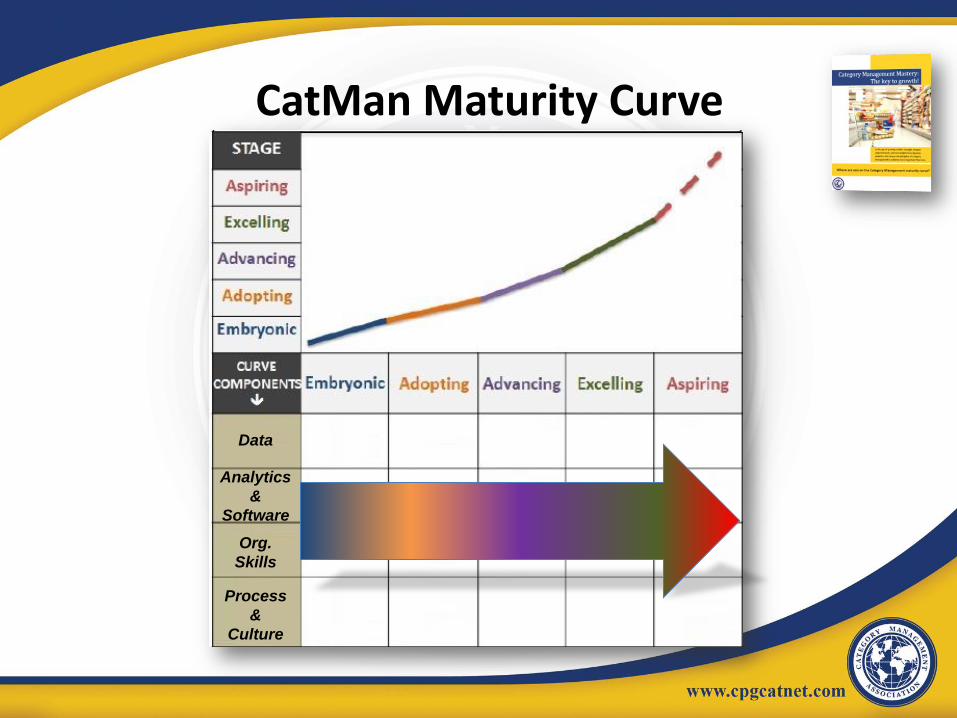
CatMan Maturity Curve
Data
Analytics
&
Software
Org.
Skills
Process
&
Culture
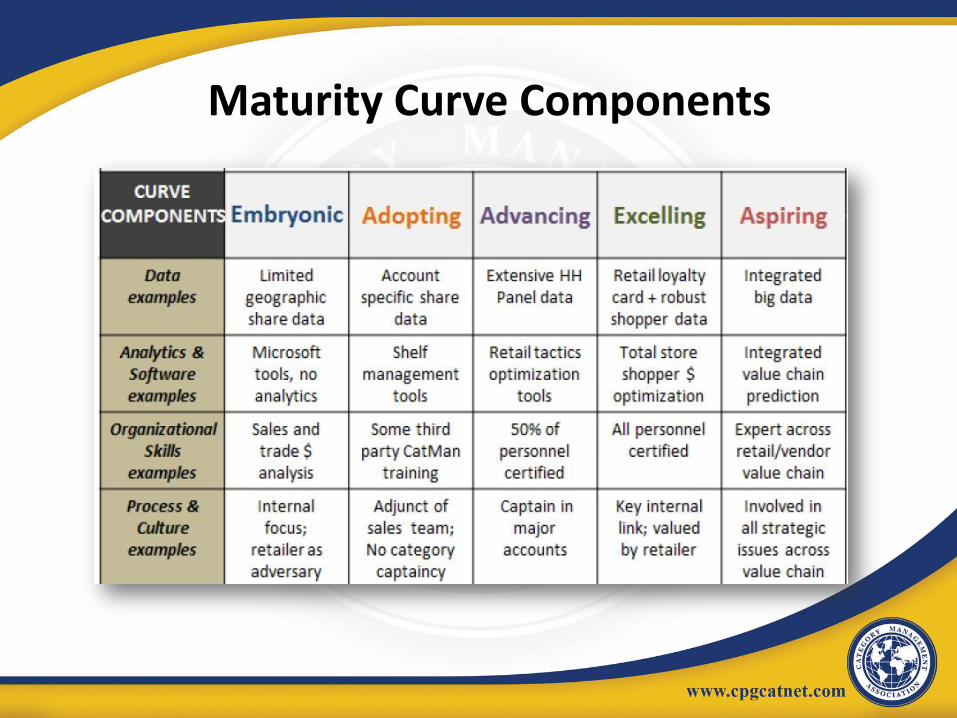
Maturity Curve Components

Analytics & Software Maturity
• Excelling Stage Requirements:
– Advanced space & assortment analytics by total store & aisle
– Activity based costing for category, brand & items
– Shopper behavior analytics by multiple shopper segments
– Advanced loyalty card & 3rd party analytics by need state
– Individual store level supply chain analytics to reduce OOS
– Success models for assortment, shelf merchandising, pricing & promotion by format & banner

Manufacturer/Retailer Partnership
Collaboration & Commitment = Success
• Collaborators get better business results!!
– Better Value Chain Transparency
– Better Shopper Understanding via Jointly Developed VOS
– Better Planning of What is Needed from Each Partner
– Better Forecasting
– Less Format Leakage
– Better ROI
2013 State of the Industry Survey

Results: Supplier – What’s Working
23

Supplier – Retailer Collaboration
24

Implications for 2018 Ecosystem
• Growth of Internet as Marketing Platform
• Shopper Individualism Drives Complexity
• Big Data is a Problem & Opportunity
• Requires Superior Data, Tools & 3rd Party Analytics
• Leakage Conquered via Need State Marketing
• Total Store Optimization Becomes Competitive Necessity

Optimization Case Studies
Leveraging Science, Data & Analytics to
Right-Size Space & Localize Assortments
Vaughn Roller
VP Assortment & Space
Revionics
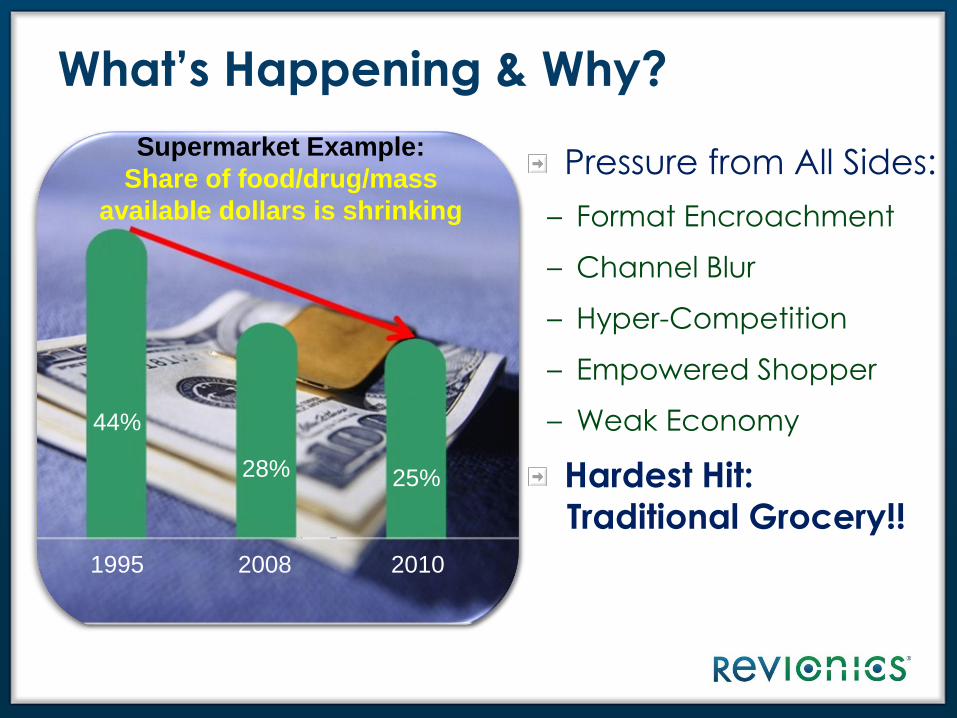
What’s Happening & Why?
Pressure from All Sides:
– Format Encroachment
– Channel Blur
– Hyper-Competition
– Empowered Shopper
– Weak Economy
Hardest Hit: Traditional Grocery!!
Supermarket Example:
Share of food/drug/mass
available dollars is shrinking
44%
28%
1995 2008
25%
2010
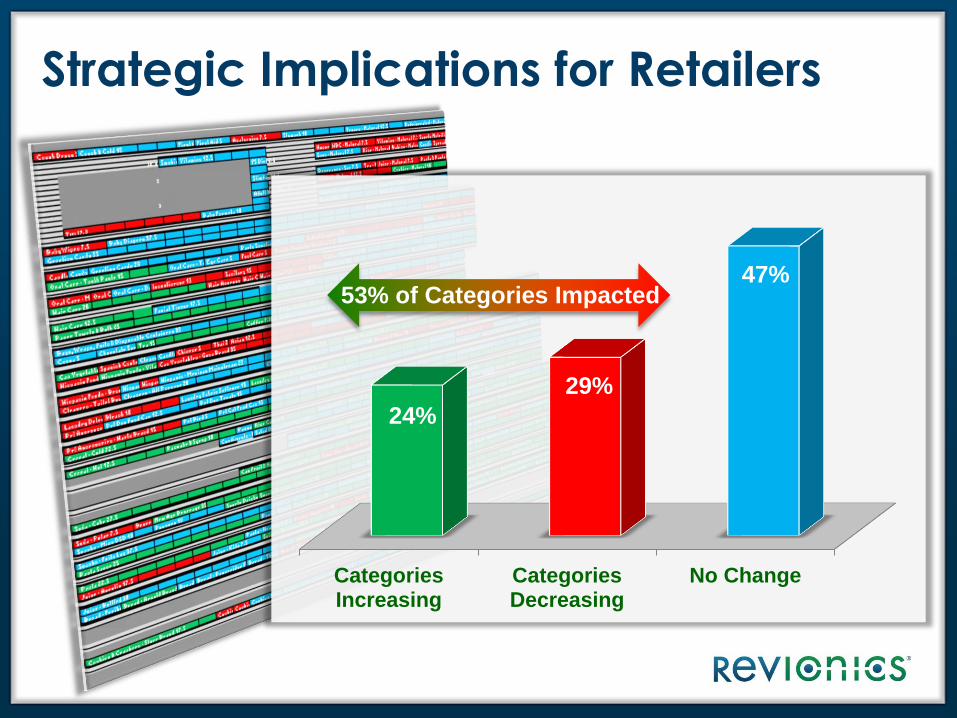
Categories Increasing
Categories Decreasing
No Change
24%
29%
47%
Strategic Implications for Retailers
53% of Categories Impacted

Leveraging Science, Tools & Data
29
Science ● Simulation ● Predictive Analytics
zzzzzzzzzzzzzzzzzzz Business Rules
Operational Constraints
Strategic Objectives
Category Roles
Category Strategies
Financial Objectives
Right Sized Localized Space & Assortments
Basket
Drivers
Loyalty
Drivers
Competitive
Gaps Affinities Elasticity
Floor Plans
Planograms
Market Data
P.O.S./T-Log
Inventory
Loyalty Data

“Right” Sizing Space Diminishing Returns
2200 2000 1800 1600
Linear Base Space
Sale
s Ch
ange
- 5000
0
5000
Current Space Allocation Unproductive Space Removal Diminishing Improvement Loss From Current Sales
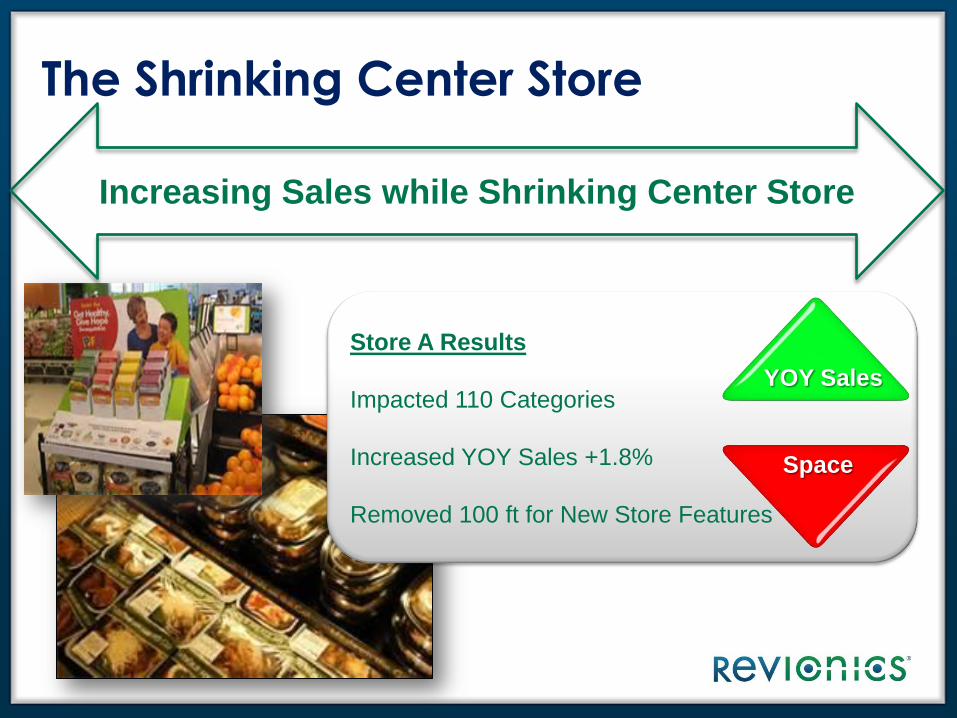
The Shrinking Center Store
Store A Results
Impacted 110 Categories
Increased YOY Sales +1.8%
Removed 100 ft for New Store Features
YOY Sales
Space
Increasing Sales while Shrinking Center Store

Making Room for Growing Categories
Store B Results
45 Categories Reduced by 250 ft
Performance for Reduced Categories
Increased YOY Sales +1.0%
Optimization Recommendations
• Made Room for Growing Categories
• Increased Sales in Reduced Categories
YOY Sales
Space
Reallocating Center Store Space to New or
Growing Categories & Line Extensions

The Importance of Store Specificity
Category Increase
Space
Decrease
Space
No
Change
Cheese 75% 25%
Yogurt 42% 58%
Juice/Drinks 42% 17% 41%
Cottage Cheese 17% 83%
Butter/Margarine 25% 75%
RTE Desserts 33% 67%
Bread 42% 58%
Localize Space to:
• Shopper Demand
• Market Conditions
•Store Format/Layout
Number of Stores Requiring Category Size Changes
% of Stores Requiring Category Size Changes

Total Inventory (Cost)
Pre Optimized Change % Change
Store
Average $ 1,090,000 $ 980,000 $ (110,000) -10.1%
Excess Inventory (>60 Days of Supply)
Pre Optimized Change % Change
Store
Average $ 288,000 $ 228,000 $ (60,000) -20.8%
Days of Supply
Pre Optimized Change % Change
Store
Average 80 74 -6 -7.5%
Enforcing Pack-Out
Standards Decreased:
• Out-of-Stocks
• Excess Inventory
• Labor Costs
Optimizing Inventory Across The Store Reducing Out-of-Stocks & Excess Inventory
Optimization Reduced:
• Total Inventory
• Excess inventory

Market Performance
Optimization Cut Baby Diaper Space in Half
• Space Reduced by 24ft
• Space Performance Increased by 76%
• $35/foot (48ft) Increased to $62/foot (24ft)
• Stock Target Minimums Covered
At Half Space, Baby Diaper Category outperformed Market at -2.6%
Evolving Category Roles Changing Market Dynamics
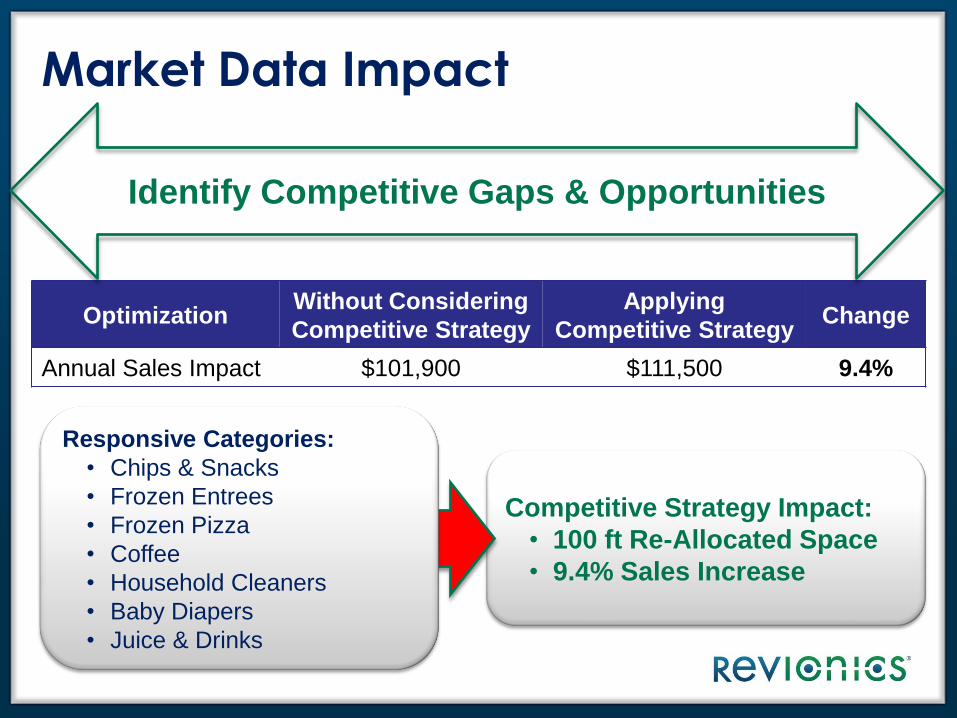
Competitive Strategy Impact:
• 100 ft Re-Allocated Space
• 9.4% Sales Increase
Market Data Impact
Optimization Without Considering
Competitive Strategy
Applying
Competitive Strategy Change
Annual Sales Impact $101,900 $111,500 9.4%
Responsive Categories:
• Chips & Snacks
• Frozen Entrees
• Frozen Pizza
• Coffee
• Household Cleaners
• Baby Diapers
• Juice & Drinks
Identify Competitive Gaps & Opportunities

Market Basket Impact
Basket Impact:
• On Category Space
• On Assortment
Category
Change With
Sales Only
Optimization
Change With
Sales &
Basket
Impact
Net
Difference
Dinners/Side Dishes - 1 0 + 1
Natural Snacks +3 0 - 3
Cat Litter - 2 -1 + 1
Rice + 3 +2 - 1
Item
Objective
Score
(Sales
Only)
Rank Objective
Score
(Sales &
Basket)
Rank
Kraft Velveeta Shells & Cheese 12 oz 0.95 1 1.05 2
Kraft Mac & Cheese Dinner 7.25 oz 0.77 2 1.60 1
Kraft Deluxe Dinner 14 oz 0.69 3 0.73 3
Kraft 3 Cheese Mac & Cheese 7.25 oz 0.35 12 0.44 8

Loyalty Data Impact
Understanding Loyalty Impact:
• On Category Space
• On Underlying Assortment
Category
Change
Without
Loyalty
(ft)
Change
With
Loyalty
(ft)
Net
Difference
(ft)
Condiments - 2 0 + 2
Cough & Cold - 3 0 + 3
Household Cleaners - 4 0 + 4
Laundry Detergent - 4 0 + 4
Item
Objective
Score
Without
Loyalty
Rank Objective
Score
With
Loyalty
Rank
Best Foods Real Mayonnaise 9.96 1 11.86 1
Best Foods Mayonnaise Light 2.98 2 3.55 3
Heinz Ketchup Squeeze Bottle 2.88 3 3.64 2
Heinz Ketchup Easy Squeeze 2.58 4 3.24 4

What Revionics Does
39

Q & A Gordon Wade, Category Management Association
– Managing Partner and Director of Best Practices
Vaughn Roller, Revionics
– Vice President of Assortment and Space


