Livelihoods after Land Reform - research findings and policy implications from a three country study Professor Ben Cousins Institute for Poverty, Land and Agrarian Studies (PLAAS) University of the Western Cape
Transcript
Livelihoods after Land Reform - research findings and policy
implications from a three country study
Professor Ben CousinsInstitute for Poverty, Land and
Agrarian Studies (PLAAS)University of the Western Cape
Presenter
Presentation Notes
Thank you for the opportunity
A 3.5 year research project (2007-2010)
• Three countries: South Africa, Namibia, Zimbabwe• Funding: Economic and Social Research Council of UK
Objectives: 1. To provide empirical data in systematic and comparable
form on the livelihoods impacts of land redistribution2. To develop conceptual tools for the analysis of livelihood
and production support measures, interrogating competing notions of ‘viability’
3. To understand what policies (transfer mechanisms, planning models, land tenure regimes, post-settlement support) are likely to result in poverty reduction
Research Design• Three regions (within countries) that are broadly
comparable in terms of agro-ecology and livelihoods: (Limpopo, Masvingo, Hardap & Omaheke)
• A range of field sites within each region, including both low-input dry land agriculture and joint ventures for high value irrigated crops
• A mix of qualitative and quantitative data, at different levels (household, enterprise, project, district)
Livelihoods after Land Reform – South Africa
Component: ‘Projects and People’
M. Aliber, T. Maluleke, T. Manenzhe,
G. Paradza and B. Cousins
Methodology• Project census (Capricorn and Vhembe
DMs)• In-depth project fieldwork (Molemole &
Makhado Local Muncipalities)– Life-history interviews– Household census and/or surveys– Focus groups– Enterprise analysis– Key informants
Vhembe Capricorn LimpopoAfrican HHs who farm 189,910 168,513 606,460 as % of all black HHs 67% 50% 44%African individuals (15+) who 'farm' 387,941 297,718 1,084,365 as % of all African individuals 52% 35% 32%African women (15+) who 'farm' 265,462 199,217 745,723 as % of all Africans 'farming' 68% 67% 69%
Agriculture in Limpopo
Land redistribution programmes
• SLAG (1995-2000) – R16 000 per household
• LRAD (2001-2007) – R20 000 to R100 000 per adult individual
• LRAD (2008-2009) – R111 000 to R400 000 per adult individual
Land reform in Limpopo
• To date, – approx 500,0000 HA restituted (4.4 million
Case Study 1: Maiwashe (LRAD)• Single-household project on Goedgedacht farm• The project has three beneficiaries, a father and his two
sons• The land had 993 ha and 83 ha was sold to the
neighbours• Acquired the land through LRAD program in 2002
through an estate agent• They have ‘employed’ a farm manager = nephew, 3
other permanent employees and casual workers from Zimbabwe
• Beneficiaries are not hands on the project• They use 20 ha for crop farming/ vegetable garden and
the rest is used for cattle grazing and game• The farm has 165 cattle 60 pigs
Maiwashe (cont.)
• Pays R24 per month per livestock unit for technical advice from an expert for Bonsmara farming
• Sells 60-70 weaners per year at Bandolierkop Vleisentraal.
• Benefits: selling of vegetables, selling of livestock, occasionally selling access to game hunters and sometimes selling pigs
LRAD project trajectories
Non-farmer Farmer or part-time farmer
Succeed
Fail and exit
Struggle
Carry on, bequeath…
Sell/lease out land; ‘de- capitalise’
Land lies fallow or
‘returns to land reform’; de-capitalise
LRAD project trajectories• Straightforward• Some variation in relation to whether or
not full-time or part-time, on own account or for family….
• Future unclear, but alternatives straightforward
Case study 2: Fanang Diatla (SLAG)
• SLAG project of initially 49 beneficiaries (12 former workers and 37 from surrounding villages)
• The farm is 61 HA in size and under the former owner was used for orchards and cash crops
• SLAG applicants got the land in 2000; used balance of the grant to purchase tractor and other implements
• Also took a loan from the Land Bank; purchased a bakkie etc.
• New owners continued with the use of orchard (kind of), vegetable gardens but in addition established a poultry project with grant (CASP) funding
Fanang Diatla (cont.)• However, by 2003 couldn’t sustain monthly pay for the
workers/project members, service loans. Alleged misuse of money by trustees? But even so….
• Majority of members abandoned the project; only three original beneficiaries remained; they live with their families on the farm
• Those who left went to look for jobs on nearby farms or around Polokwane
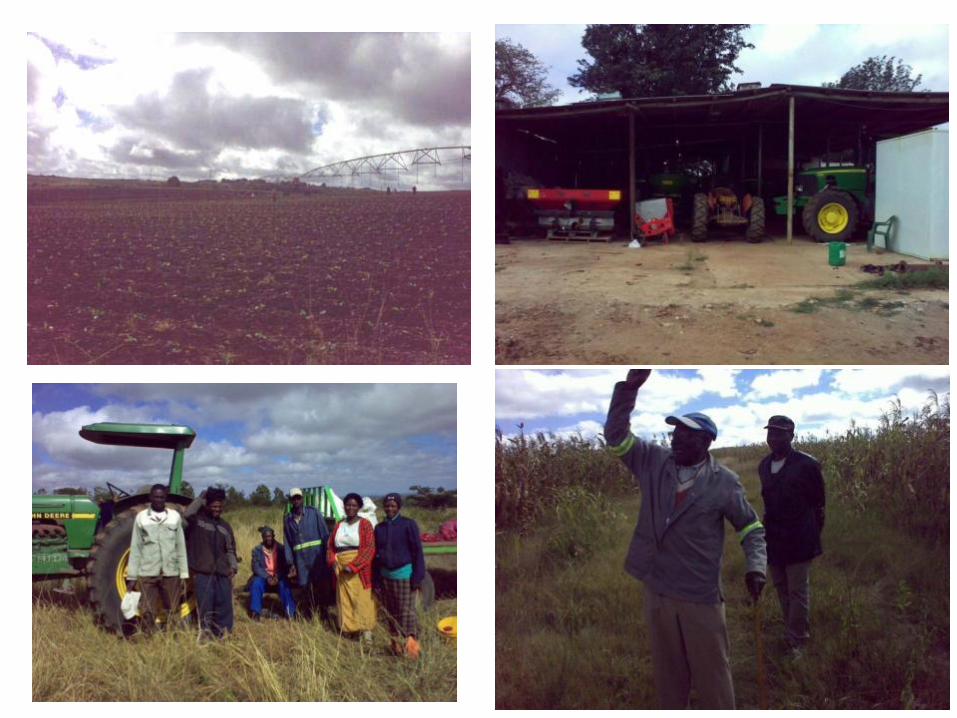
• Three remaining began cutting firewood for sale in order to raise funds to start afresh farming activities
• In 2006 neighbouring white farmer loaned them a tractor and they started ploughing cabbages, tomatoes, beetroot, chilies and pepper
• Resurrection!
Fanang Diatla (cont.)• In 2008 they managed to employ another 9
employees who are paid at the end of every harvest; (R30 rand per day)
• Now the government wants to move them from the farm because they say it is too big for the three
• The three beneficiaries were told by government to look for a farm and inform government when they find it
Case study 3: Mmasetlha Project (SLAG)
• SLAG project near Morebeng with 396 HA on the farm Driefontein
• The project had 60 beneficiaries when it was started in 1999, incl small number of former farmworkers
• The chief of Dikgale assisted his subjects to acquire the land from government
• When started in 1999 beneficiaries were very active but by 2002 they started fighting each other and started to loot project resources
• By 2006 most beneficiaries had left project and sought employment on nearby white-owned farms; 6 beneficiaries remained behind
Mmasetlha (cont.)
• In 2007 the 6 beneficiaries leased the land to a local businessman due to lack of resources to run the farm – Mr Tshilipo
• All 6 beneficiaries were employed by him on their own farm
• Tshilipo pays R1000 pm for rent, R500 pm to workers for 3-week month
• They also have their own land for their own production on the farm – sometimes use depending on rain
• Tshilipo has more than 80 pigs, few cattle, vegetable plot and a plot to produce maize
SLAG project trajectories
Farmworkers + ‘villagers’
Group-based project
Resurrect and expand
Subdivide
Stabilise
Membership shrinkage
Resurrect through ‘joint
venture’
?
Take over by investor
Sell/lease
Fallow/lose
?
Fail
Fail
SLAG project trajectories
• Common denominators: – Combination of farmworkers and extra
recruits (‘rent-a-crowd’)– Membership shrinks, leaving core of original
farmworkers• What we don’t see, and what it means that
we don’t see it
Case study 4: Mundzhedzi (restitution)
• It is a historical community of Venda and Shangaan speakers; living under Chief Nthabalala under headman Rambau Mundzhedzi
• The community claimed three farms, mostly unoccupied• Land invasion orchestrated by the chief in 2000, in 2002
the land was restituted back to the community• The land is 1225 ha and mostly used for settlement• As of March 2008, 170 claimants HHs and 800 non-
claimants HHs had settled• Most of the settled non-claimants were from nearby
communities• About 550 people are practicing subsistence agriculture
and 20 of them practicing commercial smallholder agriculture
• People are in an advantageous location, ie on well- travelled route into Elim and Makhado town
Self-provisioning of maize in Munzhedzhi
Case study 5: Morebene (restitution)
• A restitution claim settled in 2004 and restoring 1700 ha of agricultural land to Morebene CPA
• The CPA has 590 households with 1337 beneficiaries• CPA experienced internal disputes resulting in land not
being used, mainly between 2004 and late 2007• Disputes emanated from CPA committee which
disagreed on how to operate the farm; allegations of embezzlement
• In 2007, one of the beneficiaries’ grandson (a young black entrepreneur) intervened and organized beneficiaries to come together and resolve their differences
• This grandson, Elias, is based in Gauteng and has businesses in Johannesburg, appears to be successful
• Elias accesses two farms which he farms for own account; has employed a white farm manager
Morebene (cont.)• Employs 44 beneficiaries paid on a monthly basis • He produces potatoes, strawberries, maize, sweet
potatoes and avocados on the orchard site. He also has livestock on site.
• In return, Elias supports beneficiaries to farm plots of maize on two other farms for their own benefit; 35 in 2007/08; 60 in 2008/09, but over 100 others joined in to plough maize with own resources on same farm
• No extension support since December 2007
Restitution project trajectories
Claimant households
(and others?)Land
transfer
Spontaneous settlement
‘Wait’
Use for communal
grazing
Fail
Consolidat e
?
Formalisation;service provision
Use for individual production
Enter partnership
Use for group
production
Lease out
Dissolve
Settle &/or use somehow
Group prodn
Indiv prodn
Planned settlement
‘People types’ and benefits• People involved with / affected by land reform in
different ways:– Official versus unofficial beneficiaries – Farm workers – Tenants – I nvestors
2 main types of livelihood benefits• Via ‘direct use’• Via employment relationship
‘People types’• ‘Lifetime farm-dwellers’ – spend lives on farms, limited social
networks, little/no entrepreneurial experience; sometimes have no other home
• ‘Foot-loose labourers’ – have tried different things, e.g. working in Gauteng or mines, small enterprise; often some agricultural experience
• ‘Communal area dwellers’ – pursue multiple-livelihood strategies, including subsistence farming, trade, etc.
• ‘Communal area farmers’ – farm commercially, often with livestock (but also orchards, cash crops, etc.), often linked to other enterprises, embedded in local economy
• ‘Teachers and career civil servants’ – have often farmed on the side, want to go into agriculture more fully when retire, some means but not rich
• ‘Poor nephew’ – might be similar to a foot-loose labourer, but have a well-off relative
• ‘Successful businessman’ – from rural area (usually communal ?) d it i b t t di if i t i
‘People types’‘Lifetime farm-
dwellers’‘Foot-loose labourers’
‘Communal area
dwellers’
‘Communal area
farmers’
‘Teachers and career civil servants’
‘Poor nephew’ ‘Successful businessman’
LRAD
Employees- Maiwashe- Vele
Employees- Karishume- Chokoe
Direct user / tenant
- Chokoe
Managers- Maiwashe- Springkaan
Direct users/ mangers
- Chokoe- Vele- Karishume
SLAG
Direct users- Makhamotse- Fanang Diatla
Beneficiary- employees
- Marobala- Mmatsehla
Direct users- Fanang
Diatla
‘Ex-bene- ficiaries’!
Investor/ manager
- Mmatsehla
Managers- Marobala
Resti- tution
Direct users /claimants
- MakgatoEmployees / claimants
- LevubuEmployees / non-claimants
- Levubu
Direct users /claimants
- MunzhedziDirect users / non- claimants
- MunzhedziBrokers- Munzhedi
Employees:- Manavhela
Direct users / claimants
- MunzhedziDirect users / non- claimants
- Munzhedzi‘Rent collectors’
- Levubu
Direct users / claimants
- Makgato- Munzhedzi
Direct users /claimants
- Kranspoort
Investor- Morebene
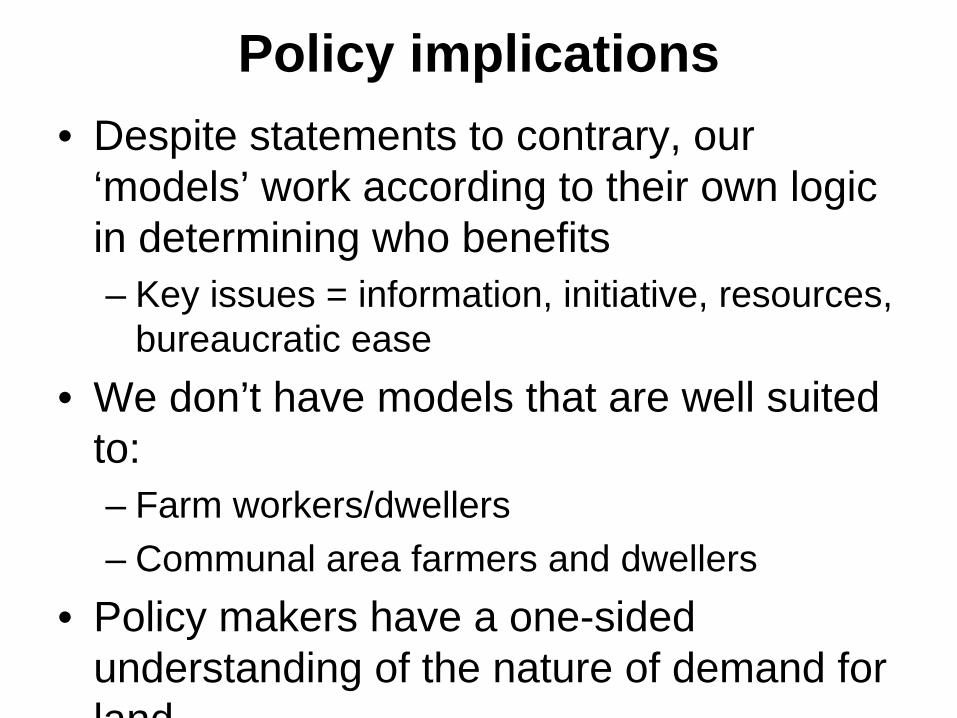
Policy implications• Despite statements to contrary, our
‘models’ work according to their own logic in determining who benefits– Key issues = information, initiative, resources,
bureaucratic ease• We don’t have models that are well suited
to:– Farm workers/dwellers– Communal area farmers and dwellers
• Policy makers have a one-sided understanding of the nature of demand for land
…Policy implications• Need to build on what is working, whether
as result of deliberate planning or spontaneous evolution, eg:– many LRAD projects are working well;
intensifying, attracting additional resources– Settlement-oriented projects can benefit many
people (esp if not too much planning?)– ‘Non-traditional partners’ (like relatives who
are entrepreneurs) may be useful for land reform beneficiaries
Land Reform in Zimbabwe: myths and realities
Researchers: Nelson Marongwe, Chris Sukume, BZ Mavedzenge, Felix Murimbarimba, Jacob
Mahenehene , Ian Scoones • Masvingo: survey of 400 households, 177 in
depth, 120 life histories (and use of some household data from 2006)
Transect – 4 clusters, agroecological N = 400, N=177 Detailed survey work complemented with qualitiative ethnographic inquiry Longitudinal. Most sites since 2004-5, some since 2000. Asked: what happened to people’s livelihoods when they got land?
Category Area (hectares) % of Total
A1 1 195 564 21.1%
A2 371 520 6.5%
Old Resettlement 440 163 7.8%
Communal area 2 116 450 37.4%
Gona reZhou National Park 505 300 8.9%
Remaining large scale farms (white owned) 44 724 0.8%
Other (indigenous- owned large scale farms, small scale
farms, state farms etc)
982 879 17.5%
Total 5 656 600 100.0%
Masvingo province: a new agrarian structure has emerged
Presenter
Presentation Notes
Add A1, A2 total area, nos of people etc. (cut following slide)
Total area ( ha ) 154522 70455 248176 722411 1 195 564
Total settlers 5 479 3209 11155 12 754 32 597
Average area /
settler(ha)28.2 21.9 22.2 56.6 36.7
A 2
Total farms settled 18 21 73 64 176
Total area ( ha ) 58281 27755 73927 211557 371 520
Total settlers 179 372 672 372 1 169
Average area /
settler(ha)326 75 110 569 318
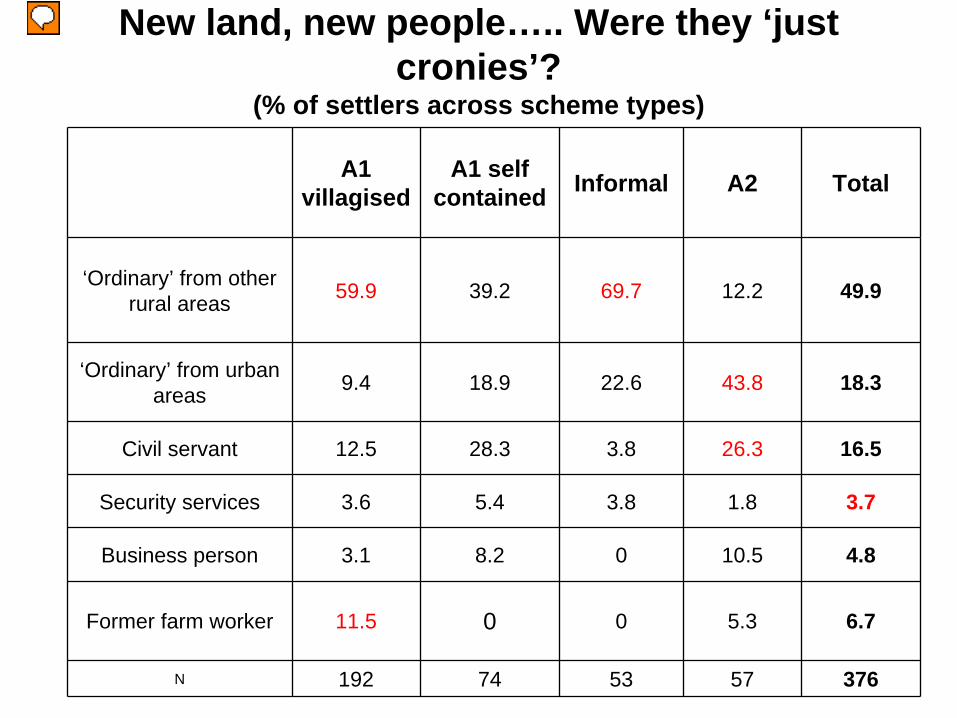
New land, new people….. Were they ‘just cronies’?
(% of settlers across scheme types)
A1 villagised
A1 self contained Informal A2 Total
‘Ordinary’ from other rural areas 59.9 39.2 69.7 12.2 49.9
‘Ordinary’ from urban areas 9.4 18.9 22.6 43.8 18.3
Civil servant 12.5 28.3 3.8 26.3 16.5
Security services 3.6 5.4 3.8 1.8 3.7
Business person 3.1 8.2 0 10.5 4.8
Former farm worker 11.5 0 0 5.3 6.7
N 192 74 53 57 376
Presenter
Presentation Notes
Who got what land where, depended critically on the processes by which land was acquired – through leading or joing land invasions, through administrative application or through patronage. Or combinations of each. For each of our sites it was unique, specific to the particular dynamics of invasion on each farm, the character of the war veteran leanders, the forms of resistance displayed by the commerical farmer, past historical relstions between white farmers and the wider community, the interests of the elites and so on ….. Not all cronies Different to communal/resettlement areas Gender – female hh Age – Education Agricultural training Farm workers War veterans In flows – magnet effect
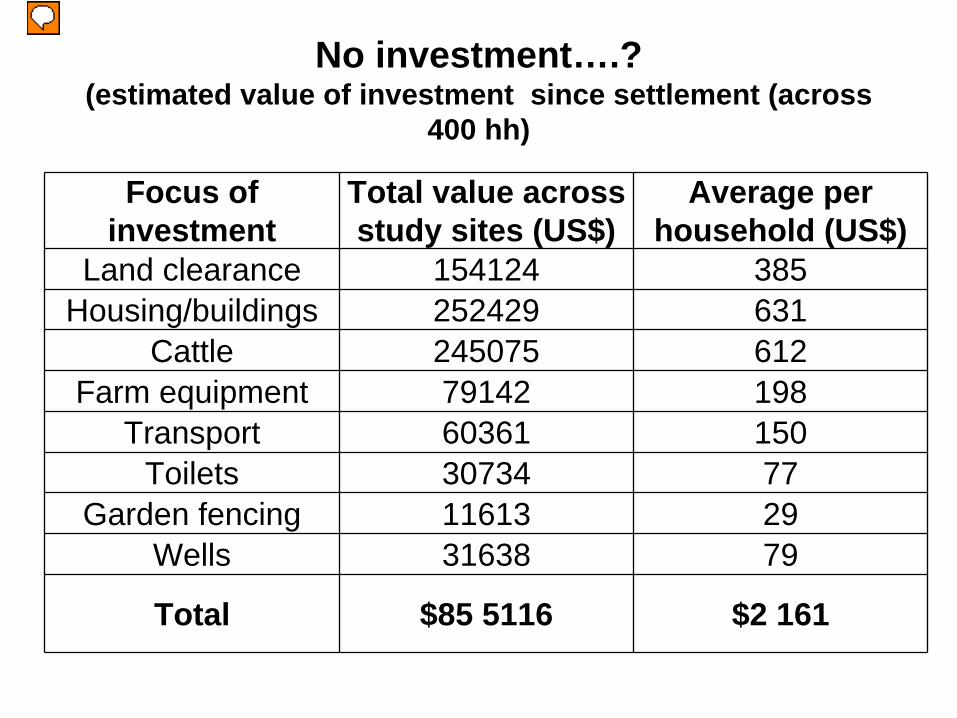
Focus of investment
Total value across study sites (US$)
Average per household (US$)
Land clearance 154124 385Housing/buildings 252429 631
Cattle 245075 612Farm equipment 79142 198
Transport 60361 150Toilets 30734 77
Garden fencing 11613 29Wells 31638 79
Total $85 5116 $2 161
No investment….? (estimated value of investment since settlement (across
400 hh)
Presenter
Presentation Notes
Methodology 33766 new A1 and A2 households - total of $73m of investment Dispel myth of no investment…. More interesting though: Relationship to scheme type/tenure – not clear (local micro politics) Social group: differentiated… (gender dynamics)
Despite tough conditions …
• Highly variable rainfall, 4 droughts in 10 years
• Wider economy in free fall (hyper-inflation, rent-seeking in currency markets, rapid decline in formal employment)
• Poor availability of seed, fertilizer, fuel
Tough conditions….
National agricultural output since 2000: variable by crop
It all depends….. Shift to small scale production, different mix (more beans, small grains, and stability in cotton) But declines in wheat, tobacco, and other crops like tea coffee Maize interesting (and data difficult as underreporting now) – overall aggregate declines, but much more local provisioning. Also greater vbility due to lack of irrigation. Big question: what to rebuild? What are new comparative advantages? Maybe not tobacco….?
Perennial food insecurity….? (% of hh producing more than a tonne of
maize)
Presenter
Presentation Notes
Several things Overall increase in output over time – first clearing (extensification to 2005 ish) then intensification Good rainfall years 2005-06 and 2008-09 – significant produciton, but also drought (another this year). Yields not high – perhaps max 3-4t/ha. Low input system, but also sustainability questions (cleared virgin land) Wetter areas better than drier areas (of course), but when add in sorghum, not so different A1 s-c the top producers. A2 lowest, but are part-time
A1 farmer maize harvest, 2009
Differentiation occurring amongst land reform
beneficiaries• Not all households doing equally well• 3 x “success groups” identified, using local
Differentiation and production (bags of maize sold in 2009 by ‘success
group’)
Presenter
Presentation Notes
Top success group – perhaps a third of hhs – engaging in cdity prodn for market. And with substantial amounts Rank order A1 s-c, A vill, A2, informal (mostly in drier areas) Even beyond top SG in A1 sites over half selling, most regularly. Not subsistence, but commercial production
Scheme Type
SG 1 SG 2 SG 3
At settlement 2008 At
settlement 2008 At settlement 2008
A1 6.3 10.4 4.5 4.5 1.9 2.6
A1 self- contained 11.2 16.2 1.3 10.9 0.9 3.7
A2 18.9 20.5 13.6 14.8 11.1 4.4
Informal 7.5 12.5 4.5 3.8 0.0 0.5
Differential accumulation…. (no’s of cattle per household by success
group)
Presenter
Presentation Notes
Similar pattern. Showing importance of cattle as indicator of accumulation. All A1 and informal sites accumulating, but concentrated. SG2 in A1 s-c however, big leaps..
A1 and informal
Temporary cropping
Temporary livestock Permanent both Permanent
cropping Permanent livestock
Percentage of hhs employing
workers20 13 9 11 9.3
Nos employed 244 29 19 38 12
% of these female 48 31 26 32 25
A2
Temporary cropping
Temporary livestock Permanent both Permanent
cropping Permanent livestock
Percentage of hhs employing
workers67.6 43.5 44.8 71.9 43.3
Nos employed 233 15 60 88 25
% of these female 27 7 23 26 28
Labour: the new farm workers
Presenter
Presentation Notes
Much debate on labour and fate of farm workers post 2000. Before 2000, approx 340,000 farm workers working on commercial farms. 150,000 resident hh, rest temporary labour, often female Concentrated in highveld commercial farms (tobacco, flowers, horituclutre etc.), plus large estates (sugar etc.) Post 2000, estimates vary wildly: some got land (5-10%), some still working (mostly estates) (about 30-35%), some in situ displaced (around 15-20%) and some left back to home areas (35-40%) But what replaced? Who are the new farmworkers? Total labour on our sites: Temporary: A1/informal: 273 and A2: 249; Permanent: A1/informal: 69, A2 173. Hiring in labour: on average A2 5.1 (P) and 7.3 (T), A1/informal 0.5 (P) and 1.9 (T). In addition to hiring in, also hiring out (35% hh temp; 13% perm) Often relationships between groups (SG3 to SG1, A1 vill/inf to A1 s-c/A2) Most labour casual, temporary, female, and low paid and with poor conditions….. But still a significant new labour pool generating employment and livelihoods. Compared to ranching operations before 1 worker per 500 ha on average for province (equivalent to 2 A2 farms and 15 A1 farms), significantly more labour employed – 10 to 15 times. Overall national situation less clear.
Category Livelihood Strategies Total
Dropping out (10.0%)
Exits 4.4%
(Chronically poor, destitute) 3.3%
(Ill health) 2.2%
Hanging in (33.6%)
Asset poor farming, local labour 17.8%
Keeping the plot 10.3%
Straddling 5.6%
Stepping out (21.4%)
Survival diversification 2.8%
Local off-farm activities 5.3%
Remittances from within Zimbabwe 5.0%
Remittances from outside Zimbabwe 4.4%
Cell phone farmers 3.9%
Stepping up (35.0%)
Hurudza 18.3%
Part-time farmers 10.6%
New (semi-)commercial farmers 4.7%
Farming from patronage 1.4%
Presenter
Presentation Notes
From our analysis of farmers’ success ranking – profiles of all hh (360), allocated to a range of 15 different livelihood strategy in order to identify patterns nad process of differentiation and perhaps some hints at the emergent class dynamics involved. Used four broad categories, drawing on the work of Andrew Dorward. Some interesting patterns: Dropping out: chronic poverty, exit. Hanging in: two types: holding, not committing, and asset poor farming, plus labouring (class linkages to other groups…) Stepping out: diversification: three types, with different implications. First, survival (e.g. ) and local (e.g. ) – a group which labours for others, but marginal, fragmented labour. Second: remittances (different types – major difference in 2000s) – the worker-peasants of migrant labour economies, often accumulating on farm, and third cell phone farmers (farm part of a wider set of activities – often linked to elite non-agrarian interests). Stepping up: Here dominated by a pattern of accumulation from below: hurudza, part-time farmers (classic petty commodity production), and semi-commercial (perhaps an emergent rural bourgeouisie). Also, significant although numerically relatively small (and perhaps allied to the cell phone farmers), farming from patronage: accumulation from above Distribution of these groups across scheme types and study sites also significant. Concentration of ‘accumulators from below’ in A1 self-contained schemes, but also a significant number in A1 and informal. Significantly more than the successful farmers that drove Zimbabwe’s 1980s green revolution in the communal and old resettlement areas. We argue that this is an important new middle farmer group, rooted in petty commodity production, linked into successful accumulation from below. The new semi-commercial farmers, the patronage farmers and the cell phone farmers dominate the A2 – clear divide between those who are investing/accumulating on their own account and those not. Also, a large group of others, pursuing a variety of livleihood strategies, who are struggling – but also, significantly, providing labour to others in the same area, or diversifying out of farming to provide local services. As a group the worker-peasant, reliant on remittances with strong links to urban areas, remain significant (perhaps 10 pc), but less than before due to collapse in the economy. This is of course a snap-shot, but one that offers some interesting glimpses of emerging dynamics of agrarian change unfolding in Zimbabwe’s countryside. SO what are the implications? My final two slides focus on implications for livelihoods and agrarian politics.
Myths and realities….
• Myth 1: Zimbabwean land reform has been a total failure
• Myth 2: The beneficiaries of Zimbabwean land reform have been largely political ‘cronies’
• Myth 3: There is no investment in the new resettlements
• Myth 4: Agriculture is in complete ruins creating chronic food insecurity
• Myth 5: The rural economy has collapsed
Presenter
Presentation Notes
5 myths. Regularly repeated – in academic, media, donor discourse. Not straw people. Real. Donors meeting last month – look at yr reports!
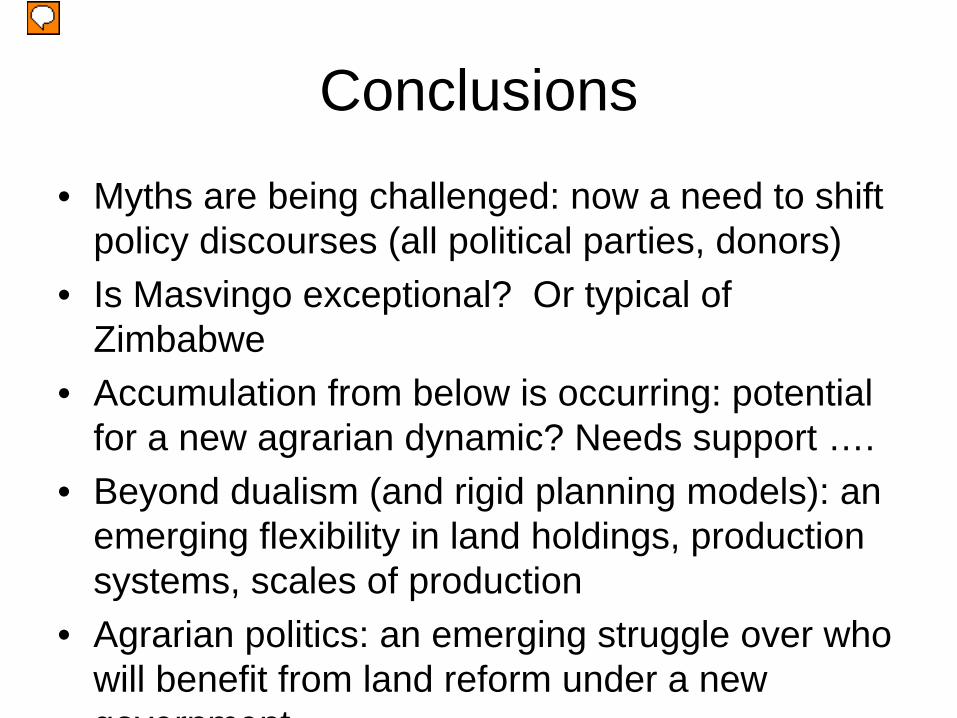
Conclusions
• Myths are being challenged: now a need to shift policy discourses (all political parties, donors)
• Is Masvingo exceptional? Or typical of Zimbabwe
• Accumulation from below is occurring: potential for a new agrarian dynamic? Needs support ….
• Beyond dualism (and rigid planning models): an emerging flexibility in land holdings, production systems, scales of production
• Agrarian politics: an emerging struggle over who will benefit from land reform under a new government
Presenter
Presentation Notes
Myths: beyond discourse that big is always best, that the past was better and that the present is chaos. 2. Highveld vs elsewhere (of course, but… large scale ranching, with some focused agric common). Zimbabwe: not a classic land reform where predatory, pre-capitalist landed property taken over, or large-scale capitalist farms nationalised. Here large scale commerical commerical units – some highly successful – taken over and replaced with s-s farming. Thus, even accounting for the massive underutilisation of land and gross inefficiencies of the commerical sector, the development potential of the new agrarian configuraiton must be proved against a different benchmark. 3. Accumn from below: not a naïve populist argument for peasant agriculture – Petty cdity producers/emergent rural bourgeousie linked into circuits of capital, engaging with markets. But requires investment – just as was done in the 1950s and 60s for white agriculture – in infrastructure (dams, roads), in financing (credit systems), in supply systems (fertiliser, seed), in technology (intermediate), in coordination (institutions, policy) – that allows agriculture to grow – and be sustained (unlike 1980s GR snuffed out by ESAP). Prospects for high returns good (and certain if comparision is with beef ranching – low employment, low return) 4. Dualism gone, but not completely. Large scale sector still present (estates etc.), but also A2-A1 dynamic imagined as a scaled down, indigenised dualism (commerical and subsistence). Have to get away from this, and accept much more blurring of boundaries, overlap in models etc. And facilitate flexibility in land holding sizes through regulated lease/trasnfer market – allowing accumulators to accumulate and those who are exiting to do so, and a new group of rural labour to emerge. 5. Politics: Post 2000 struggles over land, permeated by social inequality and shifting class formations (Peters). Post 2009, GPA and inclusive govt: New Elite alliances - land grabs and ‘commercial’ agriculture vs emergent rural farming classes, war veterans. Not along party lines – splits in both major political formations, reflected in fragility of ‘inclusive govnmt’. And also deeply entwined with divisions based on gender, ethnicity, religion and other social divisions.