Page 1
1
Benjamin Katz (1), Josh Chaffin (2), Inbal Alon (3) and Alastair Ager (1)
(1) Mailman School of Public Health, Columbia University, USA
(2) Women’s Refugee Commission, USA
(3) Western Uganda Bantwana Program, Uganda
Livelihoods, Economic Strengthening,
Child Protection and Well-Being in
Western Uganda
Final Report, June 2012
Page 2
2
Acknowledgements
This study could not have been completed without the work of:
Jennifer Birungi, Florence Kabege, Rose Tusiime and Sharif Muhamed, Kabarole
Research and Resource Center;
Richard Sempijja, Rwenzori Development and Research Centre;
Nathan Rwabulemba, Toil and Promote Agriculture;
Ben Kasota and Christine Kiiza, Western Uganda Bantwana Program;
Joyce Wanican, Child Protection in Crisis Network, Uganda.
The work was conducted with the financial and/or in-kind support of Columbia University‘s
Program on Forced Migration and Health at Mailman School of Public Health; the Child
Protection in Crisis Learning Network; the Western Uganda Bantwana Program; Women‘s
Refugee Commission; and the Displaced Children and Orphans Fund of the United States
Agency for International Development. This report does not necessarily represent the views of
these organizations, but those of the authors alone.
Address for correspondence: Alastair Ager, Professor of Clinical Population & Family Health,
Program on Forced Migration & Health, 60 Haven Ave, New York, NY 10032, email:
[email protected] or Josh Chaffin, Women‘s Refugee Commission, New York, email:
[email protected] .
Page 3
3
Contents
Summary ....................................................................................................................................................... 4
Introduction .................................................................................................................................................. 5
Methodology ................................................................................................................................................. 9
Results ......................................................................................................................................................... 12
Discussion.................................................................................................................................................... 23
References .................................................................................................................................................. 27
Page 4
4
Summary
Governments and NGOs in humanitarian crisis settings are increasingly interested in tackling the
intergenerational cycle of poverty through holistic interventions that integrate support for child
development/protection and economic strengthening of households. This study addresses the
relationship between household livelihoods and children‘s well-being and protection in two
districts of Western Uganda supported by the Western Uganda Bantwana Initiative (WUBP).The
study involves a survey of a total of 246 households with orphans and vulnerable children (OVC).
Sampling allowed comparison of 142 households that had received WUBP services (for one or
two years) with 104 households that had not yet received services.
Across all households both the level of assets owned and the intensity of livelihood strategies
were found to be significant predictors of improved physical well-being of children, as well as of
improved household provision of children‘s basic needs. However, children‘s psychosocial well-
being was not found to be related to household income, assets or intensity of livelihood activities.
Households with greater assets reported fewer child protection risks. The greater the number of
children in a household‘s care, the worse the reported outcomes for children on all measures:
physical well-being, psychosocial well-being and protection.
The greater the number of Bantwana services received by a household, the more likely the
household was to report good psychosocial well-being of children. The level of Bantwana
services received also predicted the likelihood of reporting child protection risks, indicating
either increased risk or— as appears more likely— a greater awareness of protection concerns.
Findings suggest not only the value of economic strengthening activities to support the well-
being of children, but also the potential importance of psychosocial support to households in
complementing such provision. The significant contribution that reproductive health and family
planning services may have in sustaining gains regarding children‘s well-being and protection in
vulnerable contexts is also highlighted.
Page 5
5
Introduction
To speed recovery and tackle intergenerational cycles of poverty, governments and agencies
working with vulnerable populations in humanitarian crisis settings are looking for scalable ways
to ensure children‘s well-being and protection from harm. As they move toward more holistic
models of service delivery, some are seeking to better integrate their work in child protection
with community-level economic strengthening interventions. Evidence has begun to emerge
regarding associations between income, assets, livelihood activity and child well-being but, in
general, little attention has been given to examining such relationships in more unstable contexts.
As economic approaches gain favor among child protection actors in these crisis settings, the
need for documented evidence on program impact in such contexts increases.
Impacts on Children of Economic Strengthening
While the evidence base on impacts for children from economic strengthening programs has
begun to grow, it remains underdeveloped and fragmented.1Most studies have chosen only to
focus on outcomes in education, nutrition, health and child labor, and there remains a lack of
evidence from multi-sectoral interventions that include economic strengthening. Even fewer
studies have looked at the effects of such programming on children‘s psychosocial well-being
and vulnerability to risks of abuse.
Traditionally, economic strengthening programs have measured success by monitoring outputs
such as program participation, and by evaluating outcomes such as increases in income and
assets. Few have focused on the effects on all individuals within a household, much less on their
emotional and social well-being. Donors, policymakers and implementers have assumed that an
increase in financial stability of one household member would benefit the rest of the household,
and rarely considered the intra-household dynamics that might mediate the flow of benefits
within the home or exactly how each child might gain or lose from additional resources.
A handful of studies have demonstrated a link between increased wealth and assets with
improved health, educational achievement and better nutrition outcomes in various settings.2
Recent evaluative research in development contexts have focused on the impact from microcredit
schemes, cash transfers, vocational skills training and other income-generating programs on
child outcomes, primarily on the provision of basic needs like education and health, and also on
child labor. The results have been mixed. A multi-region, cross-sectional study on the impact of
microfinance on children found that, as household income increased, so did spending in
education and healthcare.3 Another multi-country report found similar results, where households
who benefitted from microfinance interventions prioritized their increased income on children‘s
education and purchasing more food.4 Conversely, a study from rural Bolivia illustrated the
problematic effect that increased opportunities for farming (resulting from a microfinance
intervention) had on a household‘s demand for child labor. The lowest income households who
benefitted from the program saw more gain from putting children to work for more hours in the
1The Impacts of Economic Strengthening Programs on Children. CPC Livelihoods and Economic Strengthening
Task Force, August, 2011. 2See Chowa et al.; Shanks; Zhan &Sherraden.
3 Impacts of Microfinance Initiatives on Children: Overview of the Study Report, CIDA, 2007.
4Jarrell Lynne et al. Human Faces of Microfinance Impact, Freedom From Hunger International, 2011.
Page 6
6
fields, compared with the longer-term investment of sending their children to school.5 Although
household members are most likely aware of the advantages of educating their children,
extremely impoverished conditions lead them to sacrifice the potential flow of future benefits in
order to compensate for their current lack of sufficient income.6
In some contexts, an economic strengthening intervention results in both positive gains and
unintended negative consequences. An emergency agricultural project employing asset transfers,
skills training and credit access approaches in Niger saw increased nutritional outcomes for
children, but also found an increased demand for labor among girls as a result of the project.7
There is growing evidence of an inverted U-shape relationship between child labor and the
amount of a micro-loan, where an initial boost in resources will increase the demand for child
labor until productivity or income rises to a certain threshold level. At that point households can
afford hiring outside labor.8
Although few in number, recent findings that identify child labor as a negative unintended
consequence of improvement in livelihood capabilities and financial opportunities warrant
further investigation of other potentially negative impacts on children. Also lacking in the
literature are indications of other child protection outcomes like abuse and neglect, and
psychosocial issues concerning emotional distress and social well-being. As more OVC
initiatives take rights-based, integrated approaches, the need grows for rigorous evidence-
gathering around the effects of economic changes on not just the provision of basic needs but
also on psychosocial well-being and protection risks.
Ugandan Context
Uganda is one of Africa‘s fastest-growing countries, with a current population estimated at 34.5
million, growing at an annual rate of 3.1%.9 With over half the population below the age of 16
and a total fertility rate of 5.9 (per woman aged 15-49), Uganda has one of the youngest
populations in the world.10
This population is comprised of 2-3 million orphans, where
approximately 15% of the under-18 population and a total of 8 million (51% of under 18) are
listed as moderately or critically vulnerable.11
Many factors contribute to children‘s vulnerability
in Uganda, including poverty, HIV/AIDS, child labor, inadequacy of child protection services,
insecurity and disease.12
In response, the Government of Uganda has drawn upon a National
OVC Policy and a National Strategic Programme Plan for OVC.
5Maldonano, Jorge H. and Claudio Gonzalez-Vega. Impact of Microfinance on Schooling: Evidence from Poor
Rural Households in Bolivia, 2008. 6Ibid.
7Burns, John C. and Omeno W. Suji. Impact Assessment of the Chical Integrated Recovery Action Project, Niger,
Feinstein International Center, 2007 8Del Carpio, Ximena V. Does Child Labor Always Decrease with Income? An Evaluation in the Context of a
Development Program in Nicaragua, Policy Research Working Paper 4694, World Bank, 2008. 9State of the World Population 2011. UNFPA
10 Uganda: At the Beginning of the Demographic Transition. Population Reference Bureau, Population Bulletin, July
2011. (A fertility rate of 6.7 children per woman has also been reported in the OVC Status Report, NSPPI-1 Review,
Ministry of Gender, Labour, and Social Development.) 11
The criteria used in the Ugandan OVC analysis’ definition of vulnerability include (but are not limited to)
orphanhood, child marriage, being affected by HIV or other diseases, living in an area under conflict, living in a
child-headed household, and lacking in access to basic services such as schooling. OVC Situation Analysis Final
Report, March 2010. 12
OVC Status Report. Ministry of Gender, Labour and Social Development, June 2010
Page 7
7
A national household survey conducted in 2006 found that 7.5 million children were living in
poverty, with the highest proportion in rural areas.13
Although agriculture as a share of total
national employment has grown in the last several years, overall productivity has declined,
representing a major concern for rural households dependent on farming as both a major source
of income and food.14
The combination of high population growth and declining agricultural
productivity leads to increased poverty, food insecurity and malnutrition, thereby magnifying the
vulnerabilities children face.
Western Uganda
While children‘s vulnerability is widespread in all regions of the country, a recent situational
analysis showed that, after the northern region, where the highest levels are primarily attributable
to violent conflict, the western region has the second-highest percentage of ‗critically vulnerable‘.
There, the declining productivity and dependence on agriculture in rural areas is of particular
concern.15
Child labor has been noted as a primary concern by local officials, due to the demand
for cheap labor at the region‘s tea plantations and lime processing and quarry sites.16
Displacement and migration due to the civil strife in Eastern DRC and rebel activity along the
Western Ugandan border over the past two decades have only exacerbated problems affecting
young people. A governmental mission in 2008 found lower school attendance and higher rates
of teenage pregnancy and defilement in regions still affected by the fighting between Uganda‘s
military and the rebel group Allied Democratic Forces.17
While Uganda has developed a framework at the national level to respond to the immense needs
faced by OVC throughout the country, a lack of resources and mixed priorities at the district and
local levels has left a gap. In many areas, local and international NGOs have stepped in to deliver
varying combinations of child protection and other community development services.
Western Uganda Bantwana Program (WUBP)
WUBP is a project of the Bantwana Initiative, a collaboration between the US-based NGO
World Education, Inc. and the US-based public health management consulting firm John Snow,
Inc. Active in the western region since 2008, WUBP builds the management and technical skills
of community-based organizations to provide comprehensive services to OVC and their families.
The program invests in targeted technical, management, and customized follow-up support in
three areas of community-identified needs: child protection, livelihoods, and psychosocial
support.18
WUBP is focused on promoting child rights using a child-centered approach; providing
livelihood opportunities to OVC households; psychosocial support and counseling at the
household level; and rigorous monitoring and evaluation to influence OVC policy and practice.
Bantwana works on the assumption that improving the financial security of households—
13
Uganda National Household Survey 2005/2006.Report of the Socio-economic Module. Kampala: Uganda Bureau
of Statistics (UBOS), 2006. 14
Uganda Census of Agriculture 2008/09 at a Glance. UBOS, May 2011. 15
Ibid. 16
Bantwana Report – Staff Interview with Senior Development and Labour Officer for Kyenjojo District
Community Based Services Department, July 2007. 17
OVC Status Report. 18
Bantwana Program Overview, http://bantwana.org/Work/uganda.htm
Page 8
8
delivered as part of a comprehensive, integrated package including child protection and
psychosocial support interventions—can help to improve children‘s overall well-being.19
WUBP provides targeted training and support supervision for income generating efforts to bring
livelihoods beneficiaries higher up the value chain—specifically working with beneficiaries to
form associations for collective marketing and value addition in volume and quality. WUBP‘s
household livelihood interventions are based on a vulnerability assessment of individual
households, which contributes to a joint selection (between Bantwana and household members)
of an income generating activity for caregiver(s) to pursue. WUBP links households with the
program‘s other community-based economic strengthening initiatives, often including savings
and loan groups, support from community-based organizations, and collective marketing
schemes, among others.
WUBP additionally increases advocacy for an awareness of child rights through the
establishment and support of: child-led child protection clubs, radio programs, development of
resource materials and tools written for and by children, household-level sensitization and
counseling about child protection by community volunteers, and collaboration with school,
community and district stakeholders. WUBP utilizes community-based volunteers to provide
psychosocial support to children and caregivers to build resiliency and the ability to cope with
and work through grief, trauma, sorrow and other stresses.
The contribution of sustainable livelihoods to child protection and well-being is central to the
WUBP approach, but as mentioned above, the global evidence-base concerning the linkages
between livelihoods programming and various child outcomes is lacking. This study was
designed to examine these connections, both to inform future WUBP service delivery and the
global conversation around livelihoods, child protection and well-being.
Sound evidence of any significant relationship between income, assets and livelihoods and child
outcomes in a program evaluation context requires that positive outputs in financial and
economic gains are first achieved. A successful program that leads to improved livelihood
capabilities and strategies like increased access to credit or improved agricultural skills ensures
that a sample population has undergone recent changes to income, assets or livelihoods—so that
they can be analyzed in turn to show potential effects on children.
With this premise, the following research questions were developed for the evaluation research
study: Does a household‘s livelihood status (measured in income and assets) predict the
likelihood of protection from risks and/or the well-being of children? Do household livelihood
strategies (measured in terms of recent adjustments to household economic activity) predict child
protection and well-being outcomes? Does receipt of any services (inputs from WUBP or other
programs active in the area) at the household level predict any of these child outcomes?
19
WUBP Child Protection Case Study Results, October 2010
Page 9
9
Methodology
Organizational Setting
Bantwana works with nine CBOs in four districts in western Uganda to implement an integrated
program for households caring for OVC. Two of these CBOs— REDROC and TAPA—were
selected for this study based on their demonstrated effectiveness, and because they implement
more livelihood services than the other CBOs, including collective marketing and value addition
training. While REDROC and TAPA are distinct and work with different populations, they both
have experience working with rural communities and addressing issues related to poverty,
HIV/AIDS, and psychosocial support through a rights-based approach to development.
REDROC and TAPA both base their definition of vulnerability on national guidelines and local
perspectives. Project managers use a list of criteria that includes orphan status, HIV status,
evidence of recent abuse, conflict or displacement, poverty level, female or child-headed
household, and school enrolment. Staff then works with local leaders to make the national
criteria relevant to the local context.
Sampling
The research team utilized CBO reports to identify villages with the highest number of
beneficiary households in their respective catchment areas for sampling. Selected villages were
judged to be broadly representative of all the villages serviced by REDROC and TAPA based on
their proximity to one another and lack of differentiation in Bantwana reports. All beneficiary
households within the selected villages were identified for participation in the intervention group
of the study.
A control group consisted of households with OVC, residing in the same villages as the
intervention group, that were pre-enrolled in the next phase of the WUBP program. Eligibility
for pre-enrollment used the same OVC criteria met by intervention households. This next phase
of the WUBP program was scheduled to start after the data collection for this study was
completed.
Using CBO reports verified by local staff, a total of 144 households currently receiving benefits
and 108 households for comparison were identified. A total of six households either declined to
participate or were unavailable for interviews, resulting in participation from a total of 246
households (142 intervention and 104 control, see Table 1). This represented a response rate of
97%.
Measures
A household survey questionnaire was developed covering five major themes: livelihood status,
livelihood strategies, child protection, child well-being (including measures of physical and
psychosocial well-being) and exposure to the intervention (i.e. receipt of services). Questions
were developed through literature review, meetings with stakeholders at the national level,20
and
adaption to local contexts during the survey enumerator training and pilot testing.
20
The Uganda Child Protection in Crisis (CPC) Program Learning Group, consisting of INGOs, local NGOs,
government ministries, donor agencies and academics.
Page 10
10
Livelihood Status: Livelihood status was determined by respondent-reported income and assets.
A value for total earned income was computed from reported profits selling crops and livestock,
asset disposal and any alternative means of income, based on a recall period of 12 months.
Assets were quantified by the value of current livestock owned, other items owned worth at least
30KUsg. (i.e. 30,000 Ugs., approximately $11 USD)21
, and total savings. In addition to
generating a monetary value for assets, enumerators asked participants whether they owned
certain household items (iron roof, cement floor, paraffin lamp, bicycle, two-battery radio, and
mobile phone) that were identified prior to data collection by local CBO staff and the Ugandan
research team as significant household assets. Each household was then scored on this
‗household item scale‘.
Livelihood Strategies: Livelihood strategies were categorized based on respondents‘ income-
generating or investment activities over the previous year: selling crops, selling livestock, buying
livestock, receipt of a loan and whether they had a specific plan to earn more income in the near
future. Respondents were also asked about changes in hours worked, if they hired any labor, and
if they cultivated more or less land compared to the previous year. Livelihood strategies
indicators were based upon emerging literature and development practice, and refined with input
from local livelihoods program staff and researchers during the enumerator training and pilot
testing.22
Basic Needs and Physical Well-being: One question was asked with regard to each of the
following areas: occurrence of food shortages, number of sets of clothing owned for each child
within the household, and whether each child slept on a mattress. Caregivers reported how many
children lived in the household, the number of single or double orphans in the household, school
enrollment status for each child and an estimated number of hours of daily household work per
child, all disaggregated by sex.
Psychosocial Well-being: Primary caregivers were asked about the social and emotional well-
being of the children in their care. Indicators included hours of play (disaggregated by sex),
frequency of signs of emotional distress, and a measure of isolation (whether the child has no
friends or does not interact with others outside the household). Previous evaluations by
Bantwana had identified a positive connection with adults as an important determinant of
improved psychosocial well-being. Consequently, the survey included a question to measure the
frequency and type of activities carried out between caregiver and children as a proxy indicator
for connection to caregiver.23
Child Protection: Because caregivers and not children were targeted as survey respondents,
results in this category are best seen as perceived risks faced by children. Respondents were
asked if the children in their care were subject to abuse at home, in the community or at school,
and if caregivers used beatings and denial of food as means of discipline. Caregivers were also
asked if ―compared to last year, are children from the household now safer from risks of abuse,‖
which was quantified on a 3-point scale, indicating ―less safe‖, ―same‖, or ―more safe‖. Finally,
caregivers were asked whether any children in the household were engaged in work for payment
outside the home, as an indicator of child labor. It is acknowledged with this indicator that as
caregivers become more aware of child protection issues, they are more likely to have the
21
All currency conversions are based on a rate from July 1, 2011 (1 KUgs. = 0.38 USD) 22
Kabarole Research and Resource Center located in Fort Portal, Uganda was integral to the process due to their
local expertise on economic development and livelihoods capacities. 23
S. Zuilkowski. Western Uganda Bantwana Program Child Profiling Study Report. Bantwana, February 2011.
Page 11
11
capacity to identify risks or label certain practices as child rights violations, and therefore an
increase in awareness may correspond with an increase in perceived risks.
Bantwana Services: Each household was characterized as either enrolled in Bantwana‘s program
(depending on the date of enrollment, for either one or two years) or pre-enrolled for
participation (comparison group).The CBOs offer a comprehensive package of interventions to
all project households; however, participation in activities is optional and different households
choose to take up different interventions. Additional questions were therefore asked to measure
the scope of the intervention package received. Services provided by both TAPA and REDROC
were measured: savings and lending groups; support for an income-generating activity (IGA:
seeds or livestock); training in farming and/or home gardening, training in record-keeping and
collective marketing; home-based psychosocial support counseling; referral to other
psychosocial services; and participation of household children in a child rights club.
Procedure
The survey instrument was adapted to the context through a collaborative process with the local
research team and CBO program staff. Enumerators worked together to identify common phrases
and local definitions, translating the questionnaire into Rutooro. However, based on preference,
they chose to carry an English copy of the survey to the field for data collection. Field testing of
the survey was conducted in WUBP villages where TAPA and REDROC had no presence.
The research team worked with CBO staff and community volunteers to identify beneficiary and
comparison households within the selected villages. In both districts, the research team notified
the Local Council (LC) before embarking on data collection. Enumerators were guided by
community volunteers to identify households and, on average, completed between six and seven
thirty-minute surveys per day. Upon arrival in the field, some discrepancies and overlap were
found on the household lists, where some households originally thought to be located in one
village were located in another. Enumerators sought out primary female caregivers in each
household for participation. When a female adult was absent or professed lack of knowledge to
address certain questions, an adult male caregiver was asked to participate.
Statistical Analysis
Data were entered and cleaned in Microsoft Excel and later transferred into SPSS 18.0 for
analysis. The key independent variables of interest were household asset value; income level;
and intensity of livelihood activity. Both assets and income were analyzed by quartile intervals.
Asset ‗scores‘ based on the household item checklist were found to have a strong positive
correlation with the continuous household asset value variable (0.705, p<.001) and consequently,
only the asset-value quartiles were utilized for both bivariate and multivariate analysis.
Composite indices were created for livelihood strategies; child protection; basic needs/physical
well-being; and psychosocial well-being outcomes by clumping relevant variables together. An
overall score of the intensity of livelihood strategies was measured by combining the eight
livelihood variables mentioned above. Households earned one point for every livelihood activity
engaged in over the previous year, producing a household score on a 9-point scale (0-8). In Table
4, scores are consolidated into four categories to indicate degree of intensity of livelihood
strategies: 0-2 was coded as weak, 3-4 as moderately weak, 5-6 as moderately strong, and 7-8 as
a strong indication of improved livelihood strategies.
Page 12
12
The composite indices created for child protection, physical well-being/basic needs, and
psychosocial well-being were used to generate scores for each household on these three
dependent variables of interest. Basic needs/physical well-being, psychosocial well-being and
child protection outcomes were indexed to 4-point, 5-point, and 7-point scales respectively (see
Tables 5 and 6).
The 4-point scale (0-3) for physical well-being/basic needs was created by indexing variables
concerning food security, clothing and bedding. Each household earned a point if they reported
never having to reduce the amount of food for children due to lack of money, every child having
at least two sets of clothing and all children in the household sleeping on a mattress. If a
household did not report any of these positive outcomes for children, it was scored a zero.
Psychosocial well-being was measured by compiling variables related to hours of play,
emotional distress, and isolation, into a 5-point scale (0-4). One point was added to the
household score for every negative outcome reported. For subsequent analysis, scores were listed
in reverse order and coded so that a zero indicated low-functioning emotional and social well-
being and a 4 meant high-functioning, or in other words, a happy and social child.
In order to measure child protection risk, a composite index was generated combining occurrence
of abuse (as reported by the caregiver), perceived change in safety, abusive methods of discipline,
and occurrence of child labor. While the theoretical range for this scale was 0-9, no household
scored above a 6, thus producing a 7-point scale (0-6) used for analysis. Scores of 0 were coded
as low risk households, 1 as moderately low risk, 2 as moderately high and households that
scored 3-6 were determined high risk. A key challenge with this child protection composite
indicator is acknowledged to be distinguishing increases in actual child protection risks from an
increase in reporting and awareness. Especially in households receiving Bantwana services, the
emphasis in understanding child rights and protection and reporting these issues may mean that
caregivers are now able to label activities in the home, school, or community as child abuse,
whereas in the past those activities may have been more readily tolerated.
Measurement of ‗services received‘ focused on breadth, or the quantity, of WUBP services
received by an individual household in the 12 months preceding data collection. Each household
was allocated a point for every service delivered, for a maximum of 7, leading to an 8-point scale
(0-7).
Primary analysis tested for significant bivariate correlations between the above-mentioned
independent and dependent variables using Spearman Rho measures to account for the uneven
distribution of the dependent variables. The statistically significant relationships found were then
used to test for predictive values in a multivariate linear regression model. A stepwise variable
selection procedure was used to generate the regression models to ensure that only variables
relatively more associated with the outcome were included in this stage of the analysis. In
addition to the independent variables of interest (income, assets, livelihood activity and range of
services), the following demographic variables were originally entered into the model for
analysis: district, sex of respondent, number of adults in the household, and number of children
in the household.
Results
Page 13
13
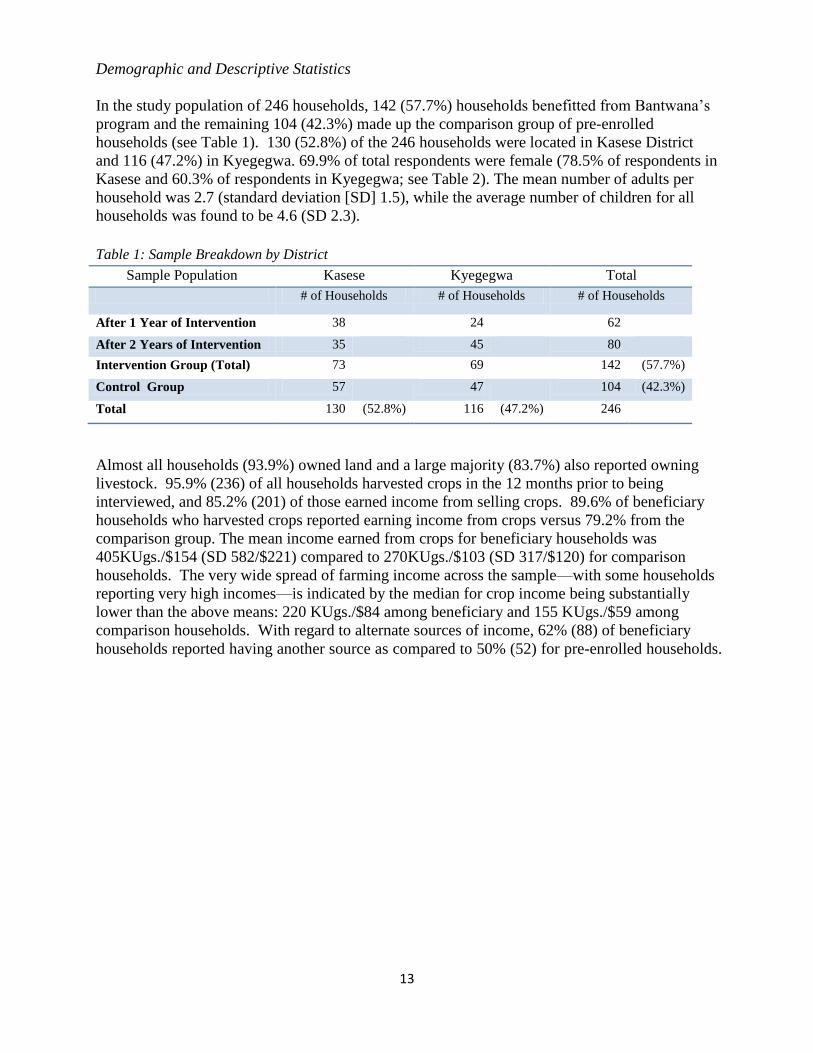
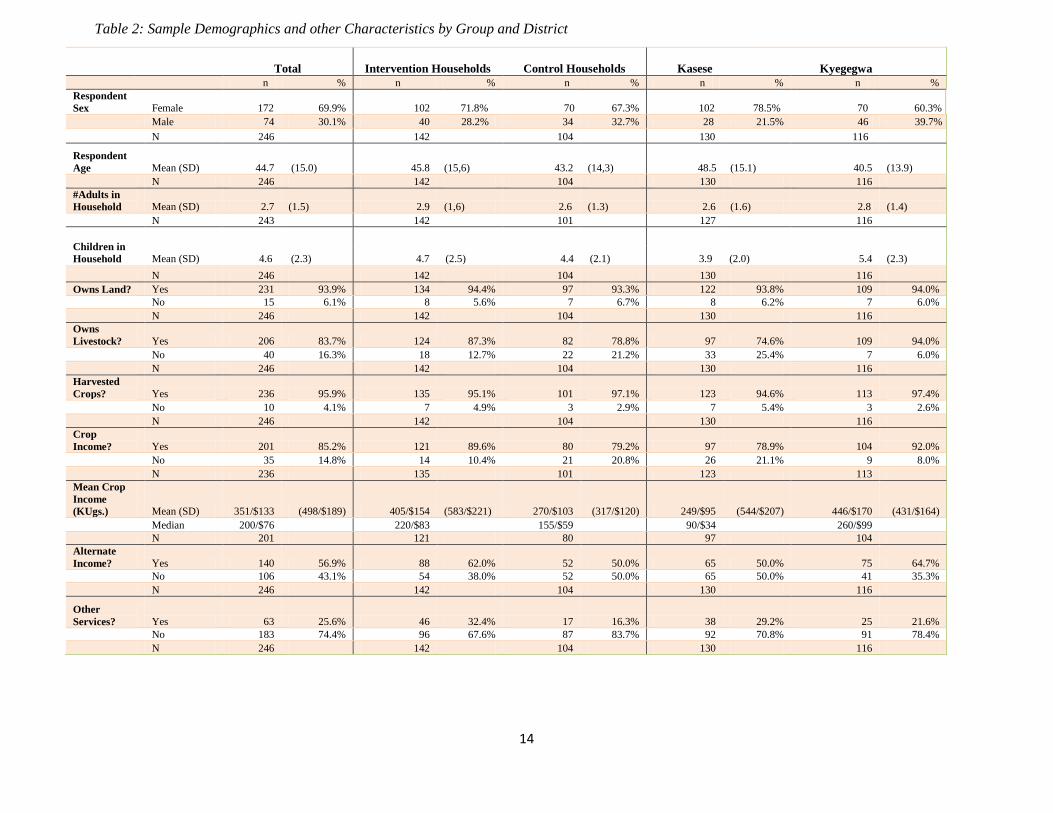
Demographic and Descriptive Statistics
In the study population of 246 households, 142 (57.7%) households benefitted from Bantwana‘s
program and the remaining 104 (42.3%) made up the comparison group of pre-enrolled
households (see Table 1). 130 (52.8%) of the 246 households were located in Kasese District
and 116 (47.2%) in Kyegegwa. 69.9% of total respondents were female (78.5% of respondents in
Kasese and 60.3% of respondents in Kyegegwa; see Table 2). The mean number of adults per
household was 2.7 (standard deviation [SD] 1.5), while the average number of children for all
households was found to be 4.6 (SD 2.3).
Table 1: Sample Breakdown by District
Sample Population Kasese Kyegegwa Total
# of Households # of Households # of Households
After 1 Year of Intervention 38 24 62
After 2 Years of Intervention 35 45 80
Intervention Group (Total) 73 69 142 (57.7%)
Control Group 57 47 104 (42.3%)
Total 130 (52.8%) 116 (47.2%) 246
Almost all households (93.9%) owned land and a large majority (83.7%) also reported owning
livestock. 95.9% (236) of all households harvested crops in the 12 months prior to being
interviewed, and 85.2% (201) of those earned income from selling crops. 89.6% of beneficiary
households who harvested crops reported earning income from crops versus 79.2% from the
comparison group. The mean income earned from crops for beneficiary households was
405KUgs./$154 (SD 582/$221) compared to 270KUgs./$103 (SD 317/$120) for comparison
households. The very wide spread of farming income across the sample—with some households
reporting very high incomes—is indicated by the median for crop income being substantially
lower than the above means: 220 KUgs./$84 among beneficiary and 155 KUgs./$59 among
comparison households. With regard to alternate sources of income, 62% (88) of beneficiary
households reported having another source as compared to 50% (52) for pre-enrolled households.
Page 14
14
Total
Intervention Households Control Households Kasese
Kyegegwa
n % n % n % n % n %
Respondent
Sex Female 172 69.9% 102 71.8% 70 67.3% 102 78.5% 70 60.3%
Male 74 30.1% 40 28.2% 34 32.7% 28 21.5% 46 39.7%
N 246 142 104 130 116
Respondent
Age Mean (SD) 44.7 (15.0) 45.8 (15,6) 43.2 (14,3) 48.5 (15.1) 40.5 (13.9)
N 246 142 104 130 116
#Adults in
Household Mean (SD) 2.7 (1.5) 2.9 (1,6) 2.6 (1.3) 2.6 (1.6) 2.8 (1.4)
N 243 142 101 127 116
Children in
Household Mean (SD)
4.7 (2.5) 4.4 (2.1) 3.9 (2.0) 5.4 (2.3) 4.6 (2.3)
N 246 142 104 130 116
Owns Land? Yes 231 93.9% 134 94.4% 97 93.3% 122 93.8% 109 94.0%
No 15 6.1% 8 5.6% 7 6.7% 8 6.2% 7 6.0%
N 246 142 104 130 116
Owns
Livestock? Yes 206 83.7% 124 87.3% 82 78.8% 97 74.6% 109 94.0%
No 40 16.3% 18 12.7% 22 21.2% 33 25.4% 7 6.0%
N 246 142 104 130 116
Harvested
Crops? Yes 236 95.9% 135 95.1% 101 97.1% 123 94.6% 113 97.4%
No 10 4.1% 7 4.9% 3 2.9% 7 5.4% 3 2.6%
N 246 142 104 130 116
Crop
Income? Yes 201 85.2% 121 89.6% 80 79.2% 97 78.9% 104 92.0%
No 35 14.8% 14 10.4% 21 20.8% 26 21.1% 9 8.0%
N 236 135 101 123 113
Mean Crop
Income
(KUgs.) Mean (SD) 351/$133 (498/$189) 405/$154 (583/$221) 270/$103 (317/$120) 249/$95 (544/$207) 446/$170 (431/$164)
Median 200/$76 220/$83
155/$59 90/$34
260/$99
N 201 121 80 97 104
Alternate
Income? Yes 140 56.9% 88 62.0% 52 50.0% 65 50.0% 75 64.7%
No 106 43.1% 54 38.0% 52 50.0% 65 50.0% 41 35.3%
N 246 142 104 130 116
Other
Services? Yes 63 25.6% 46 32.4% 17 16.3% 38 29.2% 25 21.6%
No 183 74.4% 96 67.6% 87 83.7% 92 70.8% 91 78.4%
N 246 142 104 130 116
Table 2: Sample Demographics and other Characteristics by Group and District
Page 15
Livelihoods and Child Well-Being in Uganda
15
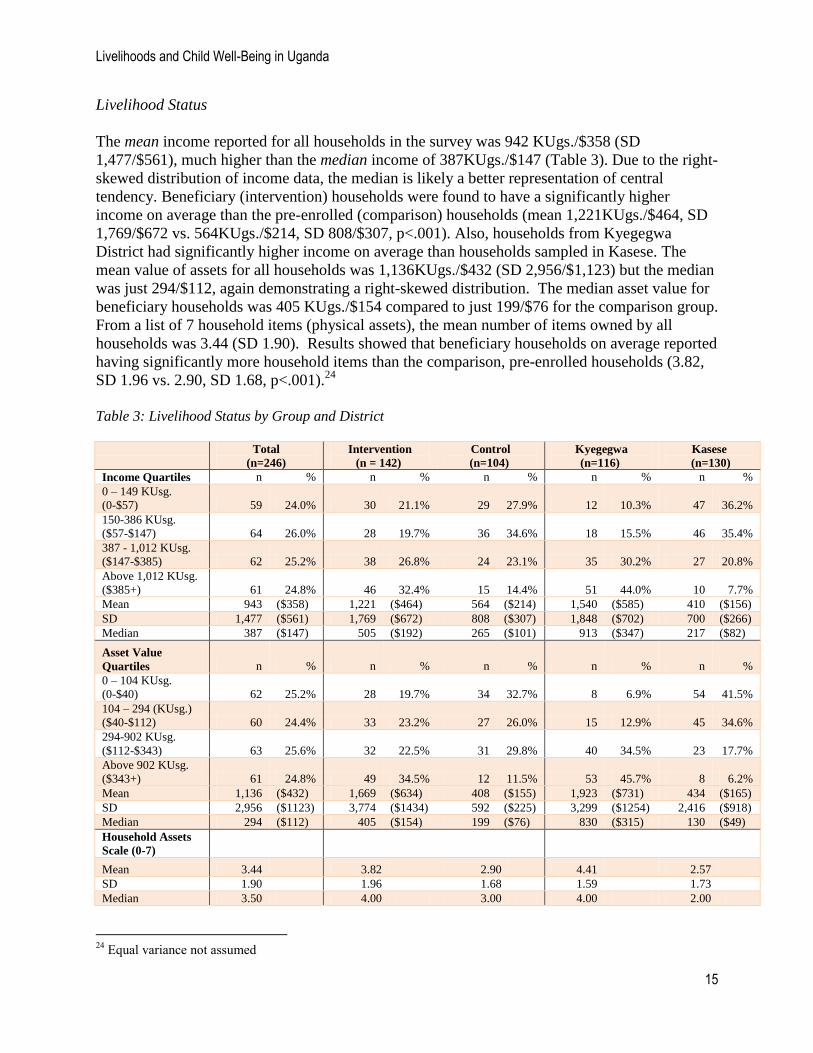
Livelihood Status
The mean income reported for all households in the survey was 942 KUgs./$358 (SD
1,477/$561), much higher than the median income of 387KUgs./$147 (Table 3). Due to the right-
skewed distribution of income data, the median is likely a better representation of central
tendency. Beneficiary (intervention) households were found to have a significantly higher
income on average than the pre-enrolled (comparison) households (mean 1,221KUgs./$464, SD
1,769/$672 vs. 564KUgs./$214, SD 808/$307, p<.001). Also, households from Kyegegwa
District had significantly higher income on average than households sampled in Kasese. The
mean value of assets for all households was 1,136KUgs./$432 (SD 2,956/$1,123) but the median
was just 294/$112, again demonstrating a right-skewed distribution. The median asset value for
beneficiary households was 405 KUgs./$154 compared to just 199/$76 for the comparison group.
From a list of 7 household items (physical assets), the mean number of items owned by all
households was 3.44 (SD 1.90). Results showed that beneficiary households on average reported
having significantly more household items than the comparison, pre-enrolled households (3.82,
SD 1.96 vs. 2.90, SD 1.68, p<.001).24
Table 3: Livelihood Status by Group and District
Total
(n=246)
Intervention
(n = 142)
Control
(n=104)
Kyegegwa
(n=116)
Kasese
(n=130)
Income Quartiles n % n % n % n % n %
0 – 149 KUsg.
(0-$57) 59 24.0% 30 21.1% 29 27.9% 12 10.3% 47 36.2%
150-386 KUsg.
($57-$147) 64 26.0% 28 19.7% 36 34.6% 18 15.5% 46 35.4%
387 - 1,012 KUsg.
($147-$385) 62 25.2% 38 26.8% 24 23.1% 35 30.2% 27 20.8%
Above 1,012 KUsg.
($385+) 61 24.8% 46 32.4% 15 14.4% 51 44.0% 10 7.7%
Mean 943 ($358) 1,221 ($464) 564 ($214) 1,540 ($585) 410 ($156)
SD 1,477 ($561) 1,769 ($672) 808 ($307) 1,848 ($702) 700 ($266)
Median 387 ($147) 505 ($192) 265 ($101) 913 ($347) 217 ($82)
Asset Value
Quartiles n % n % n % n % n %
0 – 104 KUsg.
(0-$40) 62 25.2% 28 19.7% 34 32.7% 8 6.9% 54 41.5%
104 – 294 (KUsg.)
($40-$112) 60 24.4% 33 23.2% 27 26.0% 15 12.9% 45 34.6%
294-902 KUsg.
($112-$343) 63 25.6% 32 22.5% 31 29.8% 40 34.5% 23 17.7%
Above 902 KUsg.
($343+) 61 24.8% 49 34.5% 12 11.5% 53 45.7% 8 6.2%
Mean 1,136 ($432) 1,669 ($634) 408 ($155) 1,923 ($731) 434 ($165)
SD 2,956 ($1123) 3,774 ($1434) 592 ($225) 3,299 ($1254) 2,416 ($918)
Median 294 ($112) 405 ($154) 199 ($76) 830 ($315) 130 ($49)
Household Assets
Scale (0-7)
Mean 3.44
3.82
2.90
4.41
2.57
SD 1.90
1.96
1.68
1.59
1.73
Median 3.50 4.00 3.00 4.00 2.00
24
Equal variance not assumed
Page 16
Livelihoods and Child Well-Being in Uganda
16
Livelihood Strategies
The mean score on an 8-point livelihood activity scale was 4.19 (SD 1.72; see Table 4). The
mean level for enrolled households was 4.57 (SD 1.80) compared with 3.67 (1.46) for pre-
enrolled households. 52.8% of the enrolled households indicated moderately strong to strong
levels of livelihood activity compared to just 32.7% of pre-enrolled households.
Table 4: Livelihood Strategies
Total (n=246) Intervention (n = 142) Control (n=104) Kyegegwa (n=116) Kasese (n=130)
Livelihood
Strategies
n % n % n % n % n %
Weak (0-2) 45 18.3% 21 14.8% 24 23.1% 14 12.1% 31 23.8%
Moderately Weak
(3-4) 92 37.4% 46 32.4% 46 44.2% 41 35.3% 51 39.2%
Moderately
Strong (5-6) 84 34.1% 51 35.9% 33 31.7% 44 37.9% 40 30.8%
Strong (7-8) 25 10.2% 24 16.9% 1 1.0% 17 14.7% 8 6.2%
Mean 4.19
4.57
3.67
4.53
3.88 SD 1.72
1.80
1.46
1.69
1.70 Median 4.00
5.00
3.50
5.00
4.00
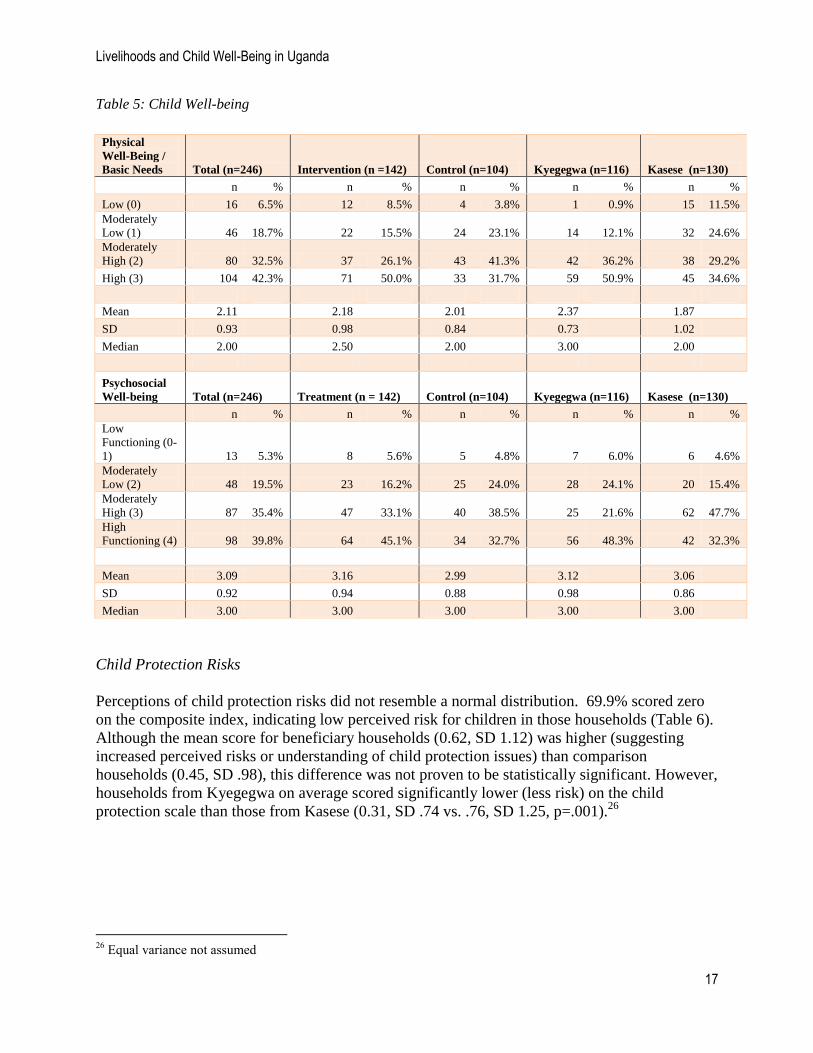
Physical Well-being and Basic Needs
The mean score on the 4-point composite scale (0-3) for physical well-being was 2.11 (SD .93),
reflecting that households on average scored moderately high on basic needs provision (see
Table 5). Fifty percent of beneficiary households scored a 3, indicating a high score for child
physical well-being compared to 33% of comparison households. Households from Kyegegwa
District on average scored significantly higher on physical well-being/basic needs than
households from Kasese (2.37. SD.73 vs. 1.87, SD 1.02, p<.001).25
Psychosocial Well-being
The mean score on the psychosocial well-being 5-point scale (0-4) was 3.09 (SD .92), indicating
that on average, caregivers‘ perceptions of their children‘s social and emotional well-being was
moderately high (Table 5). The difference in means between beneficiary households (3.16,
SD .94) and comparison households (2.99, SD .88) and between Kyegegwa (3.12, SD .98) and
Kasese (3.06, SD .86) were not significant.
25
Equal variance not assumed
Page 17
Livelihoods and Child Well-Being in Uganda
17
Table 5: Child Well-being
Physical
Well-Being /
Basic Needs Total (n=246) Intervention (n =142) Control (n=104) Kyegegwa (n=116) Kasese (n=130)
n % n % n % n % n %
Low (0) 16 6.5% 12 8.5% 4 3.8% 1 0.9% 15 11.5%
Moderately
Low (1) 46 18.7% 22 15.5% 24 23.1% 14 12.1% 32 24.6%
Moderately
High (2) 80 32.5% 37 26.1% 43 41.3% 42 36.2% 38 29.2%
High (3) 104 42.3% 71 50.0% 33 31.7% 59 50.9% 45 34.6%
Mean 2.11
2.18
2.01
2.37
1.87
SD 0.93
0.98
0.84
0.73
1.02
Median 2.00
2.50
2.00
3.00
2.00
Psychosocial
Well-being Total (n=246) Treatment (n = 142) Control (n=104) Kyegegwa (n=116) Kasese (n=130)
n % n % n % n % n %
Low
Functioning (0-
1) 13 5.3% 8 5.6% 5 4.8% 7 6.0% 6 4.6%
Moderately
Low (2) 48 19.5% 23 16.2% 25 24.0% 28 24.1% 20 15.4%
Moderately
High (3) 87 35.4% 47 33.1% 40 38.5% 25 21.6% 62 47.7%
High
Functioning (4) 98 39.8% 64 45.1% 34 32.7% 56 48.3% 42 32.3%
Mean 3.09
3.16
2.99
3.12
3.06
SD 0.92
0.94
0.88
0.98
0.86
Median 3.00
3.00
3.00
3.00
3.00
Child Protection Risks
Perceptions of child protection risks did not resemble a normal distribution. 69.9% scored zero
on the composite index, indicating low perceived risk for children in those households (Table 6).
Although the mean score for beneficiary households (0.62, SD 1.12) was higher (suggesting
increased perceived risks or understanding of child protection issues) than comparison
households (0.45, SD .98), this difference was not proven to be statistically significant. However,
households from Kyegegwa on average scored significantly lower (less risk) on the child
protection scale than those from Kasese (0.31, SD .74 vs. .76, SD 1.25, p=.001).26
26
Equal variance not assumed
Page 18
Livelihoods and Child Well-Being in Uganda
18
Table 6: Child Protection Risk
Child
Protection Risk Total (n=246) Intervention (n=142) Control (n=104) Kyegegwa (n=116) Kasese (n=130)
n % n % n % n % n %
Low Risk (0) 172 69.9% 95 66.9% 77 74.0% 94 81.0% 78 60.0%
Moderately Low
(1) 42 17.1% 25 17.6% 17 16.3% 12 10.3% 30 23.1%
Moderately High
(2-3) 23 9.3% 15 10.6% 8 7.7% 9 7.8% 14 10.8%
High Risk (4-6) 9 3.7% 7 4.9% 2 1.9% 1 0.9% 8 6.2%
Mean 0.55
0.62
0.45
0.31
0.76
SD 1.06
1.12
0.98
0.74
1.25
Median 0.00
0.00
0.00
0.00
0.00
Child Labor and School Enrollment
Of the 246 households sampled, 21 (8.5%) reported at least one child age 14 and below receiving
payment for work done outside the home (Table 7). Of the 689 children between 5 and 14 from
the sampled households, 34 (4.9%) worked for payment. Out of 790 school-aged children (ages
6-17), 89 (11.3%) were found to be not enrolled in school. 237 out of 246 total households had
children between the ages of 6-17 and 66 (27.8%) of those had at least one child out of school.
Table 7: Child Labor and School Enrollment Across Households
Child Labor Total (n=246) Intervention (n=142) Control (n=104) Kyegegwa (n=116) Kasese (n=130)
n % n % n % n % n %
Yes (at least 1
child) 21 8.5% 14 9.9% 7 6.7% 5 4.3% 16 12.3%
No 225 91.5% 128 90.1% 97 93.3% 111 95.7% 114 87.7%
School
Enrollment Total (n=237) Intervention (n=135) Control (n=102) Kyegegwa (n=113) Kasese (n=124)
School-age child
not enrolled 66 27.8% 38 28.1% 28 27.5% 33 29.2% 33 26.6%
All children
enrolled 171 72.2% 97 71.9% 74 72.5% 80 70.8% 91 73.4%
Bantwana Services
Table 8 summarizes the range of services provided by the CBOs, REDROC and TAPA. The
number of households receiving each intervention is recorded along with percentage out of 142
(the number of enrolled households sampled). The mean number of services received by
enrolled households was 4.54 (SD 1.39). Support to income-generating activities (IGAs) and
agricultural training were the two most common services provided, both reaching over 94% of
beneficiary households. Respondents from the 142 enrolled households identified 194 total
Page 19
Livelihoods and Child Well-Being in Uganda
19
IGAs received, indicating that some households had received support for more than one IGA.27
Receipt of livestock was the most common IGA followed by seed disbursement. Record keeping
and collective marketing trainings reached over two-thirds of all enrolled households. With
regard to psychosocial support services, 33.8 % of respondents were aware of a child from their
home being involved in a child rights club, and 78.9 % said they had received at least one
household visit from a psychosocial support volunteer.
Table 8: Bantwana Services Received
Intervention (n=142) # % IGAs (n=194) # %
IGAs 134 94.4% Seeds 75 38.7
Agricultural/Home garden
training 134 94.4% Livestock 114 58.8
Record Keeping Training 105 73.9% Other 5 2.6
Collective Marketing Training 104 73.2%
PSS Volunteer home visit 112 78.9%
PSS Referral 7 4.9%
Child Rights Club 48 33.8%
Mean per HH 4.54
SD 1.39
Primary Analysis
Bivariate correlation analysis performed using Spearman‘s Rho coefficient to control for non-
normality of certain variables indicated that income level was positively associated with
improved physical well-being (r=.287, p<.001) and negatively associated with increased child
protection risks (r=-.182, p=.004). No correlation was found between income level and
psychosocial well-being (r=.031, p=.633). Similar to income levels, bivariate analysis found a
positive relationship between a value of household combined assets and child physical well-
being (r=.408, p<.001). Although bivariate analysis does not control for other variables
potentially associated with the outcome of interest, this coefficient of .408 between physical
well-being and assets stands out as the strongest association found in the primary analysis of all
measures. Assets also were found to have a negative correlation with increased child protection
risks (r=-.182, p=.004).
Degree of livelihood activity showed a positive correlation with physical well-being (r=.372,
p<.001), but no association was found between livelihoods and psychosocial well-being or child
protection risks through this step of bivariate analysis. While initial analysis did not suggest a
relationship between livelihood activity and psychosocial or child protection outcomes, this
27
Respondents were asked specifically about items received within the past 12 months/since last summer’s harvest,
but it is possible that those households enrolled for two years in the WUBP reported on some services received in
their first year of enrollment.
Page 20
Livelihoods and Child Well-Being in Uganda
20
independent variable was still included in the subsequent multivariate analysis in order to
confirm that the influence of other factors was not obscuring such a relationship.
Finally, the degree of Bantwana services received was tested for associations with all three child
outcomes. A positive association was found between number of services received and physical
well-being (r=.299, p<.001). No association was found between services and child protection
outcomes. Results did show a positive correlation between receipt of services and improved
psychosocial well-being outcomes (r=.153, p=.017) at a .01 level of significance.
Table 9: Correlations Between Income, Assets, Livelihood Strategies, Receipt of Bantwana Services and
Child Outcomes
(N=246) Physical Well-Being /
Basic Needs
Psychosocial
Well-Being
Child Protection
Risks
r p-value r p-value r p-value
Income Level .287** <.001 0.031 0.633 -.182** 0.004
Asset Value .408** <.001 -.017 0.786 -.233** <.001
Livelihood Strategies .372** <.001 0.028 0.658 -0.084 0.192
Receipt of Bantwana
Services .299** <.001 .153* 0.017 0.039 0.538
**. Correlation is significant at the .01 level
*. Correlation is significant at the .05 level
Bivariate Analysis of Child Labor and School Enrollment
Bivariate correlation analysis revealed a negative relationship between more assets and the
prevalence of child labor within a household, when controlling for district, sample group
(beneficiary/comparison), number of children in the household, and livelihood strategies (r=-
.17,p=.008). Thus, households having fewer assets were associated with higher rates of working
children. Also, when comparing children on an individual basis rather than by household,
bivariate analysis found that being an orphan was positively associated with child labor (r=.096,
p=.003).
Initial analysis concerning school enrollment found a negative association between household
livelihood activity and having at least one school-aged child out of school (r=-.168, p=.008).
However, after controlling for district, sample group, asset level, and number of children in the
household, the relationship proved not significant (r=-.115, p=.073). But a higher number of
children living in the household was positively associated with at least one child being out of
school, when controlling for district, sample group, assets and livelihood activity (r=.209,
p<.001). Analysis of children at the individual level resulted in a positive association between
being an orphan and not being enrolled in school (r=.120, p<.001), controlling for age, sex and
work for pay outside the home.
Page 21
Livelihoods and Child Well-Being in Uganda
21
Regression Analyses
In order to ensure that none of the relationships identified through bivariate correlation analysis
were being obscured by confounding inputs or mediating demographic characteristics, a
secondary multivariate analysis was performed using a multiple linear regression model. A
stepwise selection procedure controlled for relevant factors entered on a theoretical basis (other
than the independent variables of interest – income, assets, livelihood activities) such as the
district in which a household resided, the sex of the survey respondent, the number of adults and
children living in the household, and the number of total services previously received via the
Bantwana program. Tables 10, 11 and 12 indicate coefficients and levels of significance for each
predictive variable. Also represented are model statistics for the ‗excluded variables‘, those
tested but not retained in the regression models due to not meeting the cut-off point for inclusion.
Physical Well-being and Basic Needs: Table 10 reports the linear regression analysis for child
physical well-being. The adjusted r-squared value indicates that almost 25% of the variance of
the physical well-being data can be predicted by the combination of variables: asset value,
livelihood strategies and number of children per household. These results help interpret trends
noted with regards to the bivariate analyses reported in Table 8. Both increased assets and
livelihood activity were confirmed to be significantly predictive of improved physical well-being.
However, although income level and level of exposure to Bantwana services showed significant
associations with well-being in the primary analysis, neither variable proved to be significantly
associated when controlling for other factors included in this model. Also, households with less
children reported significantly higher scores for physical well-being (albeit with a weak effect
size of -.081).
Table 10: Linear Regression Model Predicting Improved Child Physical Well-being
Variable
Unstandardized
Coefficient (β) Standard Error t-statistic p-value
(Constant) 1.137 0.166 6.847 <.001
# of children in household -.081 .024 -3.332 .001
Asset Value .336 .055 6.158 <.001
Livelihood Activity .120 .033 3.624 <.001
Excluded Variables
District (Kyeg./Kas.) 0.085
1.229 .220
Respondent Sex (F/M) 0.051
.909 .364
Intervention/Control Group -0.018
-.312 .756
# of adults in household 0.033
.587 .557
Income Level 0.034
.474 .636
Bantwana Services received 0.062
.985 .325
n=246, F-Statistic = 24.48 (p<.001), Adjusted R-squared = .245
Page 22
Livelihoods and Child Well-Being in Uganda
22
Perceived Child Protection Risks: Table 11 reports the linear regression analysis for child
protection risks. Results show that fewer assets, increased number of children, and more
Bantwana services received were significant in determining increased perceived child protection
risks. Although small, the coefficient for level of Bantwana services was positive at .028,
indicating that a larger number of services received (including both livelihood and psychosocial
interventions) predicted either an increase in perceived child protection risks or, alternatively
stated, greater caregiver awareness and reporting of the risks faced by children. Similar to
physical well-being, assets had the largest effect size on child outcomes (β=-.134, p<.001).
Table 11: Linear Regression Model Predicting Increased Reporting of Child Protection Risks
Variable
Unstandardized
Coefficient (β) Standard Error t-statistic P-value
(Constant) .391 .069 5.666 p<.001
Asset Value -.134 .026 -5.232 p<.001
Bantwana Services received .028 .012 2.399 .017
# of children in household .025 .012 2.170 .031
Excluded Variables
District (Kas./Kyeg.) -0.147
-1.945 .053
Respondent Sex (F/M) -0.094
-1.521 .130
Treatment/Control Group 0.053
.530 .596
# of adults in household -0.018
-.295 .768
Livelihood Activity -0.017
-.241 .810
Income Level -0.121
-1.624 .106
n = 246 F-Statistic =9.311 (p<.001) Adjusted R-squared = .092
Table 12: Linear Regression Model Predicting Improved Child Psychosocial Well-being
Variable
Unstandardized
Coefficient (β)
Standard
Error t-statistic P-value
(Constant) 1.459 .041 35.974 p<.001
# of children in household -.030 .007 -4.178 p<.001
Bantwana Services received .020 .007 2.776 .006
Excluded Variables
District (Kas./Kyeg.) 0.094
1.456 .147
Respondent Sex (F/M) 0.082
1.319 .188
Treatment/Control Group -0.141
-1.397 .164
# of adults in household -0.013
-.207 .836
Livelihood Activity 0.045
.674 .501
Asset value 0.042
.597 .551
Income level 0.019
.288 .774
n=246 F-Statistic =11.245 (p<.001 Adjusted R-squared = .077
Page 23
Livelihoods and Child Well-Being in Uganda
23
Psychosocial Well-being: Table 12 reports the linear regression analysis for psychosocial well-
being. The multivariate results are fully consistent with the bivariate results shown in Table 8.
The only independent variable found to be significantly predictive of improved psychosocial
functioning is the number of Bantwana services received. Although statistically significant, the
coefficient value (.02) is so low that despite the plausible causal pathway between increased
psychosocial support and improved psychosocial well-being scores, the model does not provide
even a moderate effect size. Again, the number of children living in the household showed a
significant (but weak) relationship (β=-.03) with the dependent variable, where having fewer
children in the same household was predictive of improved psychosocial well-being for those
children.
Discussion
Limitations
Child protection and well-being measures were captured through caregiver responses and not
triangulated or cross-referenced with other data. Without assessing the child directly, caregiver
expectations and perceptions may have resulted in insensitive or potentially biased judgments.
Further, caregiver responses may represent an aggregation of outcomes of all children in the
household, rather than reflecting the realities of individual children. Although this study aimed to
examine some of the correlates of child protection risks at the household and community levels,
it was not able to capture more systemic or structural predictors of risk, for example accessibility
and performance of law enforcement and social services.
Focusing data collection on villages with large numbers of beneficiary households was efficient
in terms of data collection, but potentially failed to capture issues faced by populations in more
sparsely populated areas.
The two districts surveyed are serviced by the same Bantwana program, but considerable
baseline differences were identified between Kasese and Kyegegwa in terms of economic status
and livelihood opportunities and activities. Differences between the two districts in terms of
child outcomes appear to be attributable to the substantial socio-economic disparity across the
two.
Interpretation of the Findings
Notwithstanding these limitations, survey findings suggest some important linkages between
household economic activity and child well-being. With regard to the provision of basic needs
and physical well-being of children, high household asset value, increased livelihood activity and
fewer children living within a household proved to be the most predictive factors. In particular,
the ownership of valuable assets had the largest effect (β=.336, p<.001) on the likelihood of
children‘s basic needs being met. Although a portion of asset wealth measured through this
survey includes household items like mattresses and furniture, the majority are productive assets
in the form of livestock. Whether households are generating more income in the short term
seems to matter less than holding assets when it comes to meeting the needs of their children.
Page 24
Livelihoods and Child Well-Being in Uganda
24
This is consistent with the focus of most economic strengthening initiatives on increasing skill
sets or providing access to capital in order for beneficiaries to increase income in a sustainable
manner that will bring about long-term outcomes. This is not to say that income has no bearing
on child well-being. Within the most vulnerable and impoverished populations, for example,
households will utilize short-term gains in wealth to meet the family‘s basic needs. As noted
above, households with more children scored lower on physical well-being of their children,
most likely reflecting a scarcity of resources within a household based on sheer number of
mouths to feed and bodies to clothe.
Multivariate analysis that controlled for potentially confounding variables demonstrated that the
higher value of household assets, the more likely a caregiver perceived risks to children in their
care to be lower. This finding is coherent with the established understanding that when basic
needs are unmet, children in poorer households will look outside the house for financial support,
which can lead to early marriage, exploitation or child labor. As one caregiver noted, ―I am
worried that my young girls will not complete school and will go and get married because we
don‘t have enough for them.‖28
Also, the number of children in the household proved to be a statistically significant factor in
predicting protection from harm. Although the data collected in this study does not indicate
levels of child neglect, the relationship between more children in a household and increased risks
warrants further examination into the issue of neglect.
Households who received more services from Bantwana were more likely to report child
protection risks. This weak but significant relationship may suggest that exposure to Bantwana
services made caregivers more aware of risks, or provided them with the vocabulary to answer
questions about child protection. As noted earlier, it is likely that households receiving Bantwana
services are more able to label and report certain practices as child protection concerns and are
therefore more aware of the risks faced by their children. This reporting or labeling effect is
often considered a positive effect of child protection programming; however, it does make it
difficult to distinguish between when risks have actually increased and when awareness has
increased the reporting of pre-existing child protection issues.
The receipt of more Bantwana services had a modest positive association with improved
psychosocial well-being. As mentioned above, the indicators for psychosocial well-being reflect
the perceptions of caregivers interviewed rather than the views of children themselves. A
statistically significant relationship (albeit also with a weak effect size) was found between
having fewer children in the household and improved psychosocial outcomes. It is plausible that
caregivers‘ attitudes about social and emotional well-being are linked to their concerns about the
number of children they are responsible for and the external support services they are receiving
related to child well-being.
Bantwana services are offered to households in a manner that creates opportunities for
households to improve their own levels of income, diversify livelihood strategies, and increase
their awareness of children‘s well-being and protection issues. The level of up-take of these
various strategies depends upon the household members involved in the program. Therefore, in
28
In-Depth Interview, Kasese.
Page 25
Livelihoods and Child Well-Being in Uganda
25
the analysis it is informative that it is not always the exposure to Bantwana services but access to
and up-take from families (as represented by increased income and assets associated with the
services) that are more predictive of improvements in child level outcomes. The change in child
level outcomes is through a change in income, assets and livelihood strategies, which are all
strongly associated to receiving Bantwana services but also depend on the household actions in
response to these services.
Programmatic Implications
IGA programs can increase both household income and assets
IGA programs in rural areas should focus not only on providing seeds and improving farming
skills, but also on the business and financial skills needed to develop alternative livelihood
strategies, improve access to credit, and increase savings and assets, which all can positively
affect the protection and well-being of children.
Increased assets within a household protects children
This finding on the importance of assets to child protection is particularly important in
considering livestock distribution as part of IGA programs. While it could be argued that
providing livestock as an IGA may only have a marginal impact on monthly income generation,
it appears that livestock do play a key role in increasing household assets, which impact both
physical well-being and protection outcomes. The most likely explanation is that households use
livestock as an insurance for bad times and are therefore able to provide for children‘s needs in
critical times that might otherwise push children and caregivers towards risky or harmful
practices, such as early marriage or child labor. A caregiver from Kyegegwa commented on the
value of his bananas and goats:
I am a farmer and I rear livestock too. When [I make] profit from this yield, I save some
and am able to meet my family’s needs. I have a banana plantation and goats to ensure
[I] always have money to pay children’s fees and meet their other needs. I have a
cassava garden so that I always have enough food.29
Findings from previous studies that suggest new financial and livelihood opportunities can lead
to an increase in demand for child labor were not replicated in this study. The protective
relationship found between increased assets and a lower prevalence of child labor suggests that
Bantwana‘s comprehensive approach that combines IGAs and child protection services can lead
to better child labor outcomes, even among extremely low income households.
Family planning remains a critical issue for child protection
The number of children living in a household affected all key variables in the study. It appears
that families with more children are less able to provide for their basic needs, care for their
psychosocial well-being and protect children from risks. Access to health services, addressing
domestic violence issues, and increased awareness about family planning services thus seem
particularly relevant to child protection programs in contexts similar to western Uganda.
29
In-depth interview, Kyegegwa.
Page 26
Livelihoods and Child Well-Being in Uganda
26
Additionally, the number of children in a household might appropriately be used to inform future
selection criteria of the most vulnerable households.
Improving access to education requires greater effort at the national policy level
In Uganda, a large percentage of children drop out of school before they reach the secondary
level, due to the high cost of school fees.30
The findings from this study found an initial
correlation between lower intensity of household livelihood activity and children out of school,
but secondary analyses proved that neither livelihoods nor income nor assets proved to have an
effect on school enrollment. It seems that families must earn above a certain threshold of income
in order to have an observable effect on school enrollment and thus IGA programs may only
contribute to improved access to education if policies at the national level focus on reducing the
cost of schooling and other barriers to education for vulnerable households.
Psychosocial support should be an explicit service offered within an integrated approach
This report‘s findings suggest that children‘s psychosocial well-being does not automatically
improve with financial gains or improvements to livelihoods, as appears the case regarding
physical well-being. As such, policies and programs must not overlook the importance of
directly addressing social and emotional well-being within groups of vulnerable children at the
household level.
Implications for further research
The household survey design included several 12-month recall questions. Although some of the
observed associations were consistent with the initial hypothesized relationships between
economic strengthening and child outcomes, a prospective longitudinal study design would be
better suited to measure the impact of a both economic strengthening programs and broad
changes in socio-economic status and livelihood strategies.
30
2010 Statistical Abstract. Uganda Bureau of Statistics, June 2010.
Page 27
Livelihoods and Child Well-Being in Uganda
27
References
Allendorf, K. Do women's land rights promote empowerment and child health in Nepal? World
Development, 35 (11),1975-1988, 2006.
Bower C. The Relationship Between Child Abuse and Poverty. Agenda, No. 56, Gendering
Childhood, 84-87, 2003.
Burns, John C. and Omeno W. Suji. Impact Assessment of the Chical Integrated Recovery
Action Project, Niger, Feinstein International Center, 2007.
Chowa, G., Ansong D. and Ibrahim H. Asset Outcomes for Women and Children. Center for
Social Development Working Paper 07-28, George Warren Brown School of Social Work,
Washington University, 2007.
CIDA. Impacts of Microfinance Initiatives on Children: Overview of the Study Report, 2007.
Corcoran M. and Chaudry A. The Dynamics of Childhood Poverty. The Future of Children Vol.
7 (2), Summer/Fall 1997.
CPC. The Impacts of Economic Strengthening Programs on Children. CPC Livelihoods and
Economic Strengthening Task Force, August, 2011.
Del Carpio, Ximena V. Does Child Labor Always Decrease with Income? An Evaluation in the
Context of a Development Program in Nicaragua, Policy Research Working Paper 4694, World
Bank, 2008.
DeLoach S. and Lamanna E. Measuring the Impact of Microfinance on Child Health Outcomes
in Indonesia. Elon University, Department of Economics Working Paper Series, 2009-03.
Glick P. and Sahn D. Schooling of Girls and Boys in a West African Country; the effects of
parental education, income, and household structure. Economics of Education Review 19, 63-87,
2000.
Jarrell, Lynne et al. Human Faces of Microfinance Impact. Freedom From Hunger International,
2011.
Kalibala S. and Elson L. Situation Analysis of Vulnerable Children in Uganda. The Population
Council, 2009.
Maldonano, Jorge H. and Claudio Gonzalez-Vega. Impact of Microfinance on Schooling:
Evidence from Poor Rural Households in Bolivia, 2008.
Page 28
Livelihoods and Child Well-Being in Uganda
28
Mensch B., Grant M. et al. The Effects of a Livelihoods Intervention in an Urban Slum in India.
Policy Research Division. Population Council, No. 194, 2004.
OVC Status Report. Ministry of Gender, Labour and Social Development, June 2010
PRB. Uganda: At the Beginning of the Demographic Transition. Population Reference Bureau,
Population Bulletin, July 2011.
Shanks T. The Impacts of Household Wealth on Child Development. Journal of Poverty, Vol.
11(2), 2007.
UBOS.2010 Statistical Abstract. Uganda Bureau of Statistics, June 2010.
UBOS. Uganda Census of Agriculture 2008/09 at a Glance, May 2011.
UBOS. Uganda National Household Survey 2005/2006.Report of the Socio-economic Module.
Kampala: Uganda Bureau of Statistics, 2006.
UNFPA. State of the World Population 2011.
WUBP Child Protection Case Study Results, October 2010.
Zhan, M. and Sherraden, M. Assets, expectations, and children's educational achievement in
female-headed households. Social Service Review, 77, 191–211, 2003.
Zuilkowski S. Western Uganda Bantwana Program Child Profiling Study Report. Bantwana,
February 2011.