30
ACKNOWLEDGEMENTS LIVELIHOODS IN THE TEKNAF - UKHIA PENINSULA BASELINE STUDY, 2017

ACKNOWLEDGEMENTS
LIVELIHOODS IN THE
TEKNAF - UKHIA PENINSULA
BASELINE STUDY, 2017
2
This research was commissioned by United Nations World Food Programme in Bangladesh, with
funding from ECHO.
Special thanks to the two field teams that conducted this research. The teams included the following
members.
Abdur Rouf (Team Leader) Manas Rudra (Team Leader) Fatema Begum Kafi Shahin Akter Faruk Uddin Sharmin Farzana Sume Rivel Chakma Mahabubul Alam Hillol Chakma Maksudul Kabir Azad Sudip Dewan Jotimoy Chakma
The two teams were supported by Ashraful Amin of WFP, the WFP field office in Cox’s Bazar and
various local partner organisations. The research and analysis was led by Gavriel Langford, also the
author of this report. All photographs in this report by Abdur Rouf and Manas Rudra.
Gavriel Langford
FEG Consulting

3
TABLE OF CONTENTS
4 INTRODUCTION
4 METHODOLOGY
SECTION ONE
DESCRIPTION OF LIVELIHOOD SYSTEM
8 Geographical aspects
10 Production – fishing, crops
11 Makeshift sites
12 Seasonality
13 Markets and trade
14 Socioeconomic breakdown
SECTION TWO
HOUSEHOLD ECONOMY ANALYSIS
18 Sources of food disaggregated by wealth group
21 Cash incomes disaggregated by wealth group
26 Expenditure patterns disaggregated by wealth group
30 Expansion and contractibility

4
INTRODUCTION
The southern peninsula of Cox’s Bazaar District in southeast Bangladesh is a predominantly rural
livelihood system, reliant mostly on sea fishing, shrimp cultivation and production and export of
betel nut, betel leaf and salt. The peninsula is host to hundreds of thousands of people seeking
refuge from long term conflict in Rakhine State, Myanmar, one of the world’s most protracted
complex emergencies.
The majority of these people are unregistered and do not have citizenship or travel documentation
of any type. They live without survival support from external actors, therefore being highly
dependant on the livelihood system of the host population. They live in various types of settlement
arrangements. These include villages hosted by local communities, several unofficial “makeshift”
sites with thousands of residents, as well as in the urban areas of Cox’s Bazaar and Chittagong. In
addition to the above settlement types there are official refugee camps in which residents are fully
registered and documented as refugees, and receive a full package of survival assistance from
external agencies and the government of Bangladesh.
This report presents the baseline findings from two separately conducted bodies of research. The
first is specific to the local host population and their livelihoods, and includes the livelihoods of some
of the unregistered, undocumented Myanmar nationals that have been living for extended periods
of time within the villages of the area. The second body of research is specific to the livelihoods of
two unofficial makeshift sites located within the southern peninsula, namely Kutupalong Makeshift
Site and Leda Makeshift Site. In this regard, this report differentiates those who are considered
“refugees” from those who remain unregistered and undocumented. The research does not cover
registered refugees living in the official refugee camps, nor those living in urban areas. It also does
not include those people that arrived very recently (since late 2016). The term “rohingya” is not used
in this document.
In an effort to develop a socioeconomic understanding of the host population, as well as those
seeking refuge, the United Nations World Food Programme (WFP) in Bangladesh commissioned this
research, the results of which are intended to inform programme design and to help align WFP’s
interventions with the Sustainable Development Goals.
METHODOLOGY
This baseline research was conducted using a methodology known as Household Economy Analysis (HEA). HEA is a livelihoods-based analysis framework that provides quantified results and qualitative detail related to household sources of food, cash income and expenditure patterns. Participatory methods are used to develop an analysis of a twelve month period, with all data disaggregated by several wealth categories. Based upon an understanding of baseline livelihoods it is then possible to know the ways in which households react and respond to constraints and changes in their economy or environment, as well as how they can better take up new opportunities. Results from HEA research can be used to inform programme development, guide humanitarian assistance and influence policy-making, with a validity of at least 5 years.
The first step in the sampling process was the delineation and definition of the livelihood zone, being
the area in which there are commonalities and similarities in overall livelihood production. The
research area was limited to Teknaf and Ukhia upazilas both of which have the same primary
livelihood system of fishing, betel production and salt production. Ramu upazila and other locations

5
beyond were excluded from the research area due to differences in means of production and the
primary livelihood methods.
Villages in the host community were selected based on information from discussions with local
partners in Cox’s Bazar. They included the locations listed below. The findings are considered
representative for all villages in the Teknaf Ukhia peninsula that have a similar livelihood system – a
mix of fishing, betel nuts and leaves, salt production, etc.
Shamlapur Chepotkhali Munderdeil Deilpara Jahazpura Katakhali Katabuniya Sonarpara Noyapara Moheshkhaliapara
In each village both formal and informal leaders of the village were requested to participate in a
focus group discussion to discuss the context and livelihood systems within the village. Matters of
asset ownership, wealth determinants, seasonality, production levels and commodity prices were
discussed in a systematic way in every location. One of the functions of this interview was the
formulation of four additional focus groups, representative of four different wealth groups; very
poor, poor, middle and better off ranked households. A fifth wealth group, the “non-local poor” was
identified with the facilitation of local partner NGOs that are knowledgeable of and experienced in
the particular villages. Each of these focus group discussions had four to six men and women from
four to six different households. HEA considers the household the base unit of analysis for purposes
of economics and does not investigate, nor draw conclusions, on intra-household matters. For this
reason separate interviews are not held with women and men. In each of these five wealth group
discussions a semi-structured but systematic investigation of food, cash income and expenditure was
completed. Fixed questionnaires were not used for this research, rather a semi-structured approach
to interviewing with responses recorded on a data capture form and entered into an Excel database.
Internal interview cross checks are a key feature of the HEA methodology where cash income and
expenditure need to roughly balance in the interview, while food calories must come to a total
considered reasonably close to the annual calorific requirements of the household. Additional cross-
checks are made across the five interviews, as well as between these interviews and the village
leader interviews. Discrepancies in production levels, prices, events, etc are investigated and
explained at the time of interview. At least 250 people were interviewed in the sixty focus groups
(leaders and wealth groups) in the host villages.
The same process was broadly followed for the research in Leda and Kutupalong makeshift sites, the
major difference being that there are no villages within the settlements. The settlements are divided
into blocks which were used as the sampling frame. Kutupalong has 5 blocks of which all were
sampled, with two sets of interviews with different sub-blocks of Block B. Leda has 6 blocks with all
blocks being sampled. In each block interviews were held with four different wealth groups; very
poor, poor, middle and better off. At least 250 people were interviewed in the sixty focus groups
(leaders and wealth groups) in the eleven blocks of the two makeshift sites. Fieldwork took place
between 22 January and 8 February, 2017.
An HEA methods and theory training was conducted in Dhaka from January 15 to 19, 2017. It was attended by 15 researchers who are from the area, as well as 5 participants from various NGOs. Fieldwork took place between 22 January and 8 February, 2017.
An intrinsic weakness of the HEA methodology is that it tends to miss the aspects of the livelihood
system that are present for a few individuals but not typical for the majority. For example, if only a
6
few households of the dozens of households considered very poor catch and sell fish, the data will
indicate that fishing is not a typical livelihood activity for this wealth group in that location. If
pregnant mothers are receiving a particular ration, it is possible that this will not reflect in the data
as pregnant mothers are not a majority in any of the wealth groups. In an effort to capture what is
the most normal and typical for a majority of the households in a wealth group, some outlier
information can appear to be missing. This report attempts to capture some of these “missing
elements” in a narrative form.
Further information on HEA is available at foodeconomy.com
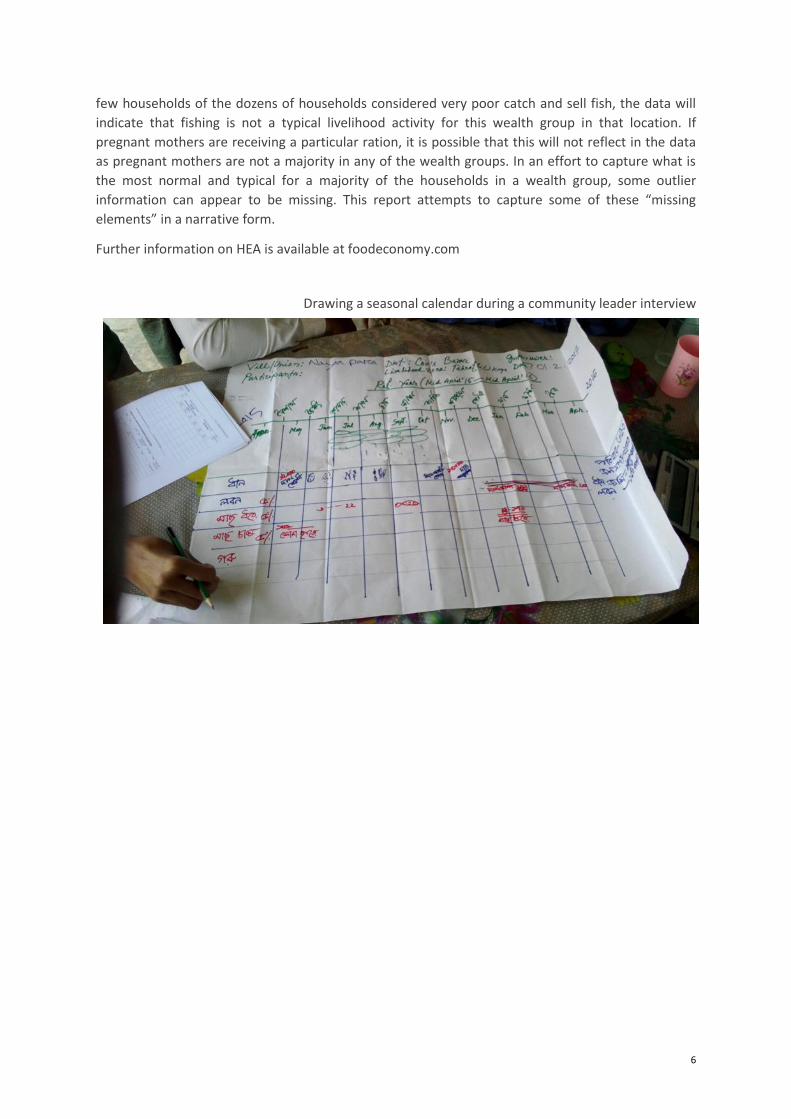
Drawing a seasonal calendar during a community leader interview

7
SECTION ONE

8
DESCRIPTION OF LIVELIHOOD SYSTEM
GEOGRAPHICAL ASPECTS
Cox’s Bazar, located in southeast Bangladesh, is a
coastal district that falls within the administrative
division of Chittagong. It is the most significant
domestic tourist destination, famous for its beaches.
The Bay of Bengal is located to the south and west of
the district, the district of Bandarban and the Myanmar
state of Rakhine to the east, and the industrial port city
of Chittagong to the north. The district has a total land
area of 2,492 square kilometres and represents just
over 1.5 per cent of Bangladesh’s total land area.
Located at the southern end of the district is a narrow
peninsula barely 15kms across at its widest point,
comprised of Ukhia and Teknaf upazilas (subdistricts).
This peninsula, called the Teknaf Peninsula, with its
distinct livelihood system, relative isolation, and high
caseload of people seeking refuge from Myanmar is the
subject of this report. For the purposes of inclusion of
both upazilas of interest, the term Teknaf-Ukhia
Peninsula Mixed Livelihood Zone will be used for the remainder of this report, or just “zone” for
short.
The peninsula is defined by the Naf River to the east (with Rakhine State of Myanmar across the
river), the Bay of Bengal to the south and west, and Ramu Upazila (also of Cox’s Bazar district) to the
north. The combined area of the two districts, Ukhia and Teknaf, that comprise the southern
peninsula is only 650 square kilometres, representing less than 0.5% of the total land area of
Bangladesh. This peninsula is sufficiently distinct from Ramu upazila to the north and other locations
beyond it. It has a microclimate heavily influenced by its proximity to the ocean. Vegetation is
sparse, ocean winds are strong for much of the year on the west side, soils are sandy and not
conducive to most agriculture. The Naf River is a tidal river causing regular inundation of land
adjacent to the river bank, land which is typically utilised for shrimp cultivation. A spine of low
elevation hills (<200 metres) run north-south down the middle of the peninsula. Small pockets of
soils suitable to rice and other food crop cultivation are present but these are the exception rather
than the norm. The peninsula has mangrove forests and sand dunes, as well as other sites of
ecological and livelihood interest.
The Google Earth Image A on the following page shows a typical view of the peninsula with the Naf
River on the right, the Bay of Bengal on the left, the range of hills in the middle. As can be seen
agricultural land is minimal. Image B is a closer view with Leda makeshift site visible.

9
A
B

10
PRODUCTION – FISHING, CROPS
The primary means of production in the zone are sea fishing and cultivation of betel nuts and betel
leaf (pan) with the majority of the households within the zone being involved with these activities in
one way or another. Fishing is done using both small to large size boats, as well as without boats on
the shore and in the Naf River. Betel trees, as a perennial crop, provide little in the way of labour
opportunities for poorer households. Betel leaf gardens require significant amounts of labour at all
stages of cultivation. Images below, clockwise from top left; salt drying, betel leaf garden, drying
fish, sorting through the fish catch.

11
Salt production and shrimp cultivation are also of importance in the zone. Only a small percentage of
better off households have such businesses, however they are a source of labour income for poorer
households. Food cropping is present, but makes only a minor contribution to the zone, and is found
in isolated pockets on the east side of the peninsula near the Naf river. Food crops cultivated include
rice, potato, beans and vegetables, garlic and ginger. Unlike most other parts of Bangladesh,
livestock ownership is scarce with limitations in land holding sizes restricting the availability of
grazing land and the lack of rice production means that straw or fodder is minimal.
Following the construction of a new road connecting Cox’s Bazar and Teknaf along the western side
of the peninsula, land prices are increasing in that area. Land is being sold by better off to external
investors seeking to construct hotels, resorts and restaurants aimed at domestic tourists. Most
households in the area do not have opportunities to engage economically with the increasing
tourism.
MAKESHIFT SITES
The term “makeshift site” is locally used to
distinguish Kutupalong and Leda makeshift
sites from the officially recognised, refugee
camps of Nayapara and Kutupalong. In fact
these locations are for all intents and
purposes as long term as the official refugee
camps, they are simply not recognised and
designated as such for political reasons.
Kutupalong Makeshift Site is the older of the
two makeshift sites, located in Ukhia Upazila
and established in 1995, with just under
36,000 residents (almost 7,000 households).
Leda Makeshift Site is located in Teknaf
Upazila and was established in 2008, with
more than 14,000 residents (just over 2,000
households). Living conditions in both
makeshift sites are extremely harsh. Families
live in mud/bamboo wall shacks with plastic

12
sheet roofs, which are around 3m x 3m. They are often referred to as “sheds”, an unfortunate
misnomer that implies solidity1. These shacks are typically unpartitioned with all 5 to 6 members of
the household sleeping on the earthen floor. Lighting is by crude kerosene lamps. A corner of the
dwelling is used for wood fire cooking, the smoke of which fills the small space. These dwellings are
so low that in most of them there is no room to stand up.
Access to and management of both makeshift sites is controlled by the government but they are
administered by Camp Management Committees (CMC) and Block Management Committees (BMC)
that were formed at the upazila level. A google search of either of these camps will provide many
more images of the living conditions.
SEASONALITY
Average annual temperatures range from a minimum of around 16˚C and a maximum of 34˚C.
Summers are hot and humid with heavy rainfalls and winter months are moderately cold and dry.
April is the warmest month with temperatures averaging between 33 and 36 ˚C while January is the
coolest. Average annual rainfall is just under 4300 millimetres, mostly falling between June and
September. The table below summarises the seasonality of different activities and events in the
reference year.
Bangla Season Grishmo Barsha Shorot Hemonto Sheet Boshonto
Bangla Month Baishakh Jaishto Ashar Srabon Vadro Ashin Kartik Agrahan Pous Mag Falgun Chittro
English Month Ap May Jun Jul Aug Sep Oct Nov Dec Jan Feb Mar A
Monsoon
Betel nut
Betel leaf
Vegetables
Amon
Fishing
Salt Harvest
Plant
(prep)
Weeding
Harvest
Plant & Harvest
Seasonal variations in labour are captured in detail in the income section of this report.
Strong sea winds are the only weather-related adversity on the peninsula, however these rarely affect production or cause damage. Cyclones are not a chronic threat in Teknaf and Ukhia upazilas as they are in neighbouring Moheshkhali and Kutubdia, and the area is not subject to flooding.
MARKETS AND TRADE
Due to the low levels of agricultural productivity in this zone, it is a net importer of rice and key sources of supply are Chittagong, Sylhet and occasionally India. Most other basic and luxury food types are also imported into the zone. Food prices are relatively higher in this zone than other parts of Bangladesh due both to the high reliance on imports and the popularity of Cox’s Bazar as a tourist
1 The ‘sheds’ in Leda camp were built by the organisations IOM and Muslim Aid and are thus comparatively
better than in Kutupalong, and slightly larger at 4m x 4m.

13
destination. The primary commodities for export out of the zone are fresh fish, dry fish, salt, betel nuts and betel leaf.
Export of labour to neighbouring areas
within Chittagong Division could be the
largest source of inflow of capital into the
zone. Although not easily verifiable, this
conclusion is based on the fact that huge
proportions of the local and non-local
population are reliant on sale of labour for
household income. The zone itself is not a
highly productive area, and only a
percentage of the labour being sold by
these households is within the zone itself.
Neighbouring areas north of the zone, such
as Ramu Upazila and beyond, follow
patterns of agriculture consistent with most parts of Bangladesh, providing seasonal labour
opportunities. Labour is required for the fishing industry described earlier in the report, as well as
the manual work in ports and the urban centres of Cox’s Bazar and Chittagong (construction,
loading, transporting, etc). Hotels and restaurants and other businesses in urban centres also
provide work opportunities.
There are two types of markets – larger haat markets at the upazila level, and bazar markets at the union level (lower administrative level). Haats are generally larger than union bazars and operate only twice a week. Similar commodities are sold at haats and bazars, although a larger variety of fish and livestock products are available at the former.
The Kutupalong Camp Bazar and Hinla Bazar are the two markets that are closest to the Kutupalong and Leda makeshift sites respectively. The markets are predominantly retail and sell a variety of food and non-food necessities, education supplies and medicine. Both markets are accessible by road and customers also include people from nearby villages.
There are over 200 shops in Kutupalong Bazar and nearly double that amount in Hinla Bazar. Most shops in the markets are permanent and retain the capacity to function during strikes and other political disruptions.
Cross border trade, mostly illegal, is also a source of capital inflow into the zone. Cattle are brought
from Myanmar, and traded to other parts of Bangladesh. Narcotics trafficking is prevalent, mostly
amphetamines manufactured in Myanmar. The peninsula is also infamous for kidnapping, trafficking
and the selling of people into slavery, with destinations being Thailand and Malaysia.
SOCIOECONOMIC BREAKDOWN
Cox’s Bazar District is home to approximately 1.5% of Bangladesh’s population but across decades, it
has also received several hundred thousand people seeking refuge from conflict in Rakhine State,
Myanmar. Refugees in the official camps, as well as those resident in host community villages and
the “makeshift” sites Leda and Kutupalong are highly reliant on the livelihood opportunities found in
the Teknaf-Ukhia Peninsula Mixed Livelihood Zone.
In community leader interviews conducted in the makeshift sites, respondents indicated that there
were four wealth groups – khubi gorib (“very poor”), gorib (“poor”), tar cheye bhalo (“better than
poor”) and kichhuta bhalo (“a little good”). These will be referred from here on as the very poor,
poor, middle and better off households. However it is important to note that this particular context

14
represents an economic anomaly. As a population they do not appear to represent a full spectrum of
wealth categories as would have been the case in their place of origin, Rakhine State, Myanmar.
Community leader interviews in host community villages revealed much more normal wealth
categories; ranging from very poor to better off, the latter of whom were actually relatively well off.
In addition to this breakdown of wealth for local Bangladeshi residents of the village, an additional
group was identified from amongst the non-Bangladeshi residents in the village, those considered to
be typical of the category of “non-local poor”. From a research perspective, this distinction was
necessary in order to assess whether variations exist in the socioeconomic conditions between local
communities and those seeking refuge. Needless to say there are non-local households that are both
poorer and better off than the category “poor” but resources did not permit a full exploration of all
wealth groups.
The Host Community
The percentages in the table on the next page indicate the proportion of the total population that falls within each wealth group. The proportion of non-local poor could not be estimated by village leaders due to sensitivity in asking to identify them.
Availability of cultivable land is very limited in the host villages of this zone. Only the middle and the
better off cultivate land and this is typically limited to between 1-3 kani of land, which is around one
acre (1 kani in this area equals 40 decimals, or 0.4 acre). Better off households own more land than
the land they cultivate, a minimum of 3 kani, up to 12 kani. The land that is not dedicated to
cultivation is rented out to people from outside the village for use as salt or shrimp farms, betel tree
and leaf gardens, construction of restaurants and hotels, as well as given for free to very poor
households to live on. The very poor do not own any land, often even including the land that their
home is on. Some live as squatters on government land while others rent or live on land owned by
the better off for free. The poor typically own around 10 decimals of homestead land, enough only
for their home.
Proportion the village
Land cultivated
Other Productive Assets
Household size
Very Poor 23-45% (~33%)
- - 5 – 7
Poor 27-50% (~36%)
- share small boat with
other poor HH nets
5 – 6
Non-local poor
- - - 5 – 7
Middle 18-36% (~25%)
1 – 3 kani betel nut trees 5 – 7

15
Better Off 4-10% (~6%)
1 – 3 kani
other land for rental betel nut trees, betel leaf
gardens large boats, nets
5 – 7
It is relatively normal for most homestead yards to have two or three fruit trees such as a papaya, mango or banana tree, as well as a few vegetables such as pumpkins and gourds, mostly for own consumption. Small numbers of chickens are owned by some households, but no other livestock are typical. The very poor and non-local poor do not own any productive assets, therefore rely exclusively on labour as their means of income. The poor wealth group typically share a small paddle boat and fishing nets with other households from the same wealth group. (upper image). The main productive asset of middle and better off households are their betel nut tree plantations. In addition, the better off also own large boats and fishing nets (lower image). From external appearances, it is difficult to distinguish between non-local poor households and very poor and poor households from the host community. Socioeconomic features such as household size, lack of cultivable land and no or minimal access to productive assets are common. Households from all wealth groups own mobile phones.
Families that have opted to live in host community villages typically have their homes closer to the beach than the host population. This relates mostly to the fact that they are residing on the more marginal land that is owned by government. Relationships between host communities and these non-local families are positive, functional and productive for the most part. There are cases of marriage between the two communities, co-operation for communal matters is common and better off members of the host population often employ people from these non-Bangladeshi families on boats and fields,
The Makeshift sites
The table below summarises characteristics of different wealth groups in the makeshift sites.
Proportion of
Makeshift Sites
Other Productive
Assets
Household size
Very Poor 48-60% (~52%)
- 6 – 7
Poor 20-28% (~25%)
- 6
Middle 13-21% (~18%)
- 6 – 7
Better Off 3-5% (~5%)
stall, shop, sewing machine
6 – 7

16
As indicated in the table above, very poor households represent a very high proportion of the resident population of the makeshift sites. They are considered by others to be the households that consume only one meal a day. Given this is not technically likely, this could be a perception that they only consume one desirable or ‘tasty’ meal a day, with other meals of the day consumed without items that are normally considered desirable (and also nutritionally balanced). An estimated 35% of households in this group consist of two parents with 5 or more small children who are not yet of an income earning age. Around 25% of this group two parents and 3 or 4 children, but they are just very poor in terms of assets. Around 25% of this wealth group are female-headed households. Around 10% of households in this wealth group are the elderly, which includes those who rely on either relatives or begging for survival. The remaining 5% includes households with a disabled adult family member, who mostly rely on begging.
Across both makeshift sites the percentage of households in each group decreases with wealth. Roughly 75% of the population of the two makeshift sites is very poor or poor. As will be described later in this report, there is not in fact a significant difference between these two groups in terms of the amount of income they earn. The differences are mostly in the source of the income, with the poor having more access to labour than the very poor who are heavily reliant on selling firewood to supplement their income from labour. In absolute terms they are all very poor.
There is no access to cultivable land and no ownership of livestock in any wealth group in either makeshift site. All households own mobile phones, but only the better off have some productive assets in the form of sewing machines, barber equipment, small stalls and shops, etc.
SECTION TWO
17
HOUSEHOLD ECONOMY ANALYSIS
This section comprises the main livelihood findings of this research. All findings related to the makeshift sites correspond to the 365 day period January 01, 2016 to December 31, 2016, henceforth referred to as the baseline reference year. All findings related to the host community villages correspond to the 365 day period July 01, 2015 to June 30, 2016, the baseline reference period for the host community. When an amount is presented, for example amount of rice purchased, or income earned from construction labour, it means the actual amount that was spent or earned in the reference period.
The section is divided into three main parts; sources of food, sources and amounts of cash income, and expenditure patterns. Each part will present the findings for the host community first, followed by the makeshift sites.
SOURCES OF FOOD DISAGGREGATED BY WEALTH GROUP
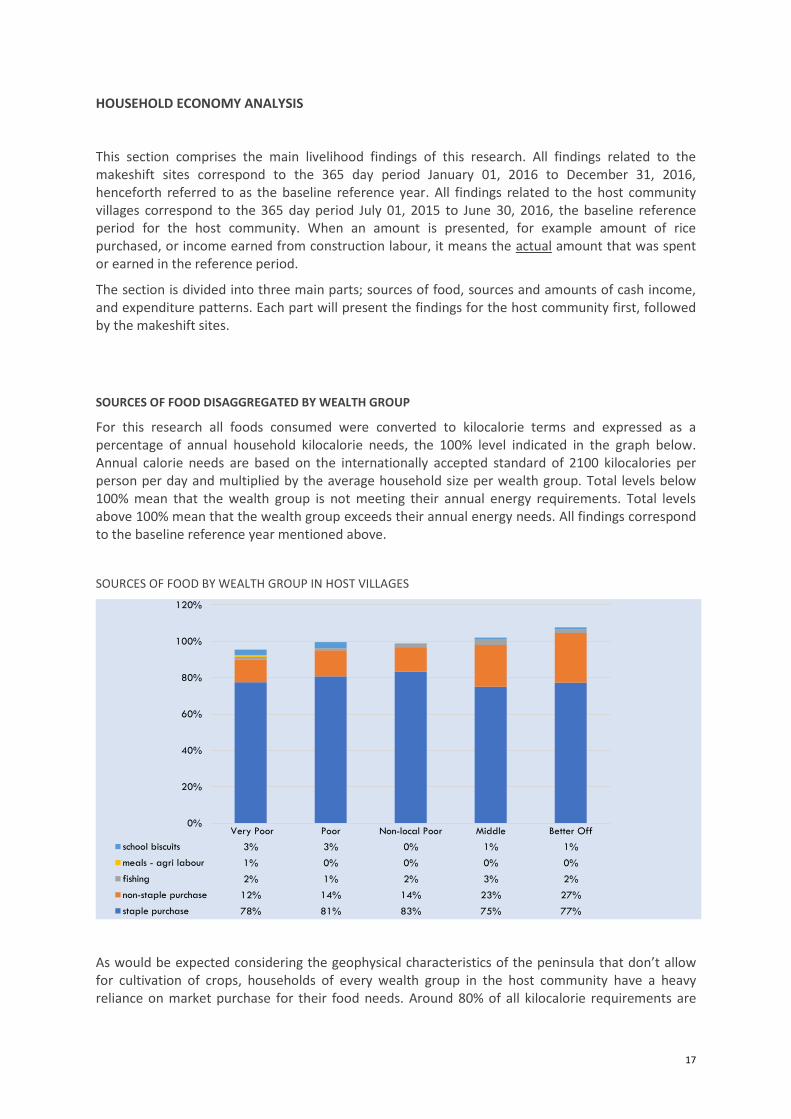
For this research all foods consumed were converted to kilocalorie terms and expressed as a percentage of annual household kilocalorie needs, the 100% level indicated in the graph below. Annual calorie needs are based on the internationally accepted standard of 2100 kilocalories per person per day and multiplied by the average household size per wealth group. Total levels below 100% mean that the wealth group is not meeting their annual energy requirements. Total levels above 100% mean that the wealth group exceeds their annual energy needs. All findings correspond to the baseline reference year mentioned above.
SOURCES OF FOOD BY WEALTH GROUP IN HOST VILLAGES
As would be expected considering the geophysical characteristics of the peninsula that don’t allow for cultivation of crops, households of every wealth group in the host community have a heavy reliance on market purchase for their food needs. Around 80% of all kilocalorie requirements are
Very Poor Poor Non-local Poor Middle Better Off
school biscuits 3% 3% 0% 1% 1%
meals - agri labour 1% 0% 0% 0% 0%
fishing 2% 1% 2% 3% 2%
non-staple purchase 12% 14% 14% 23% 27%
staple purchase 78% 81% 83% 75% 77%
0%
20%
40%
60%
80%
100%
120%

18
met through purchase of staples, mostly rice. The very poor purchased 5-10kgs of rice every few days throughout the year while the non-local poor purchased a lower quality of rice at 25 taka per kg compared to 28 taka per kg for the non-non-local poor. Non-staple purchases increased progressively by wealth group, the middle and better off spending more on the more expensive, desirable food types such as fish, meat, oil, sugar, eggs, etc. In total, the very poor get 90% of the annual food needs from purchase, the poor 95%, the non-local poor 97%, the middle 98% and the better off 104%.
Fishing was an additional source of food in these villages. There was not a significant variation in amounts consumed from own catch, however this is reflective of the ability of middle and better off households to not only purchase alternatives such as meat, eggs, pulses and vegetables than poorer categories below them, but also their preference for higher grades of fish. It is normal in the area to sell fish from their own catch and purchase other fish. By combining the fish consumed from purchase and own catch, there is a clearer progression of increase by wealth group. All three categories of poorer households get around 3% of calorie needs from fish (equivalent to around 1kg every 3 days), whilst middle and better off households just over 5% (equivalent to around 5-6kg per week).
School feeding in the form of fortified biscuits also contributed to kilocalories, with the very poor and poor receiving around 3% per group and the middle and better off receiving 1% each (ration size is the same, the difference relates to number of children in primary school). Children of non-Bangladeshi families are restricted by the government of Bangladesh from sending their children to local schools, therefore they do not access this source of calories. The very poor receive cooked meals while doing agricultural labour.
Production of rice is present in a few villages of the zone, dependent on the geographical location of the village. However it is not common in the majority of villages of this zone. In villages where rice is produced, the purchase of staples is far lower than the general average. As described earlier in the report livestock rearing is not typical in the zone.
Better off households in the host community tend to consume more bananas, whereas poorer households bought other fruits such as papaya, mango, jackfruit and watermelon because they are easier to cut and share.
19
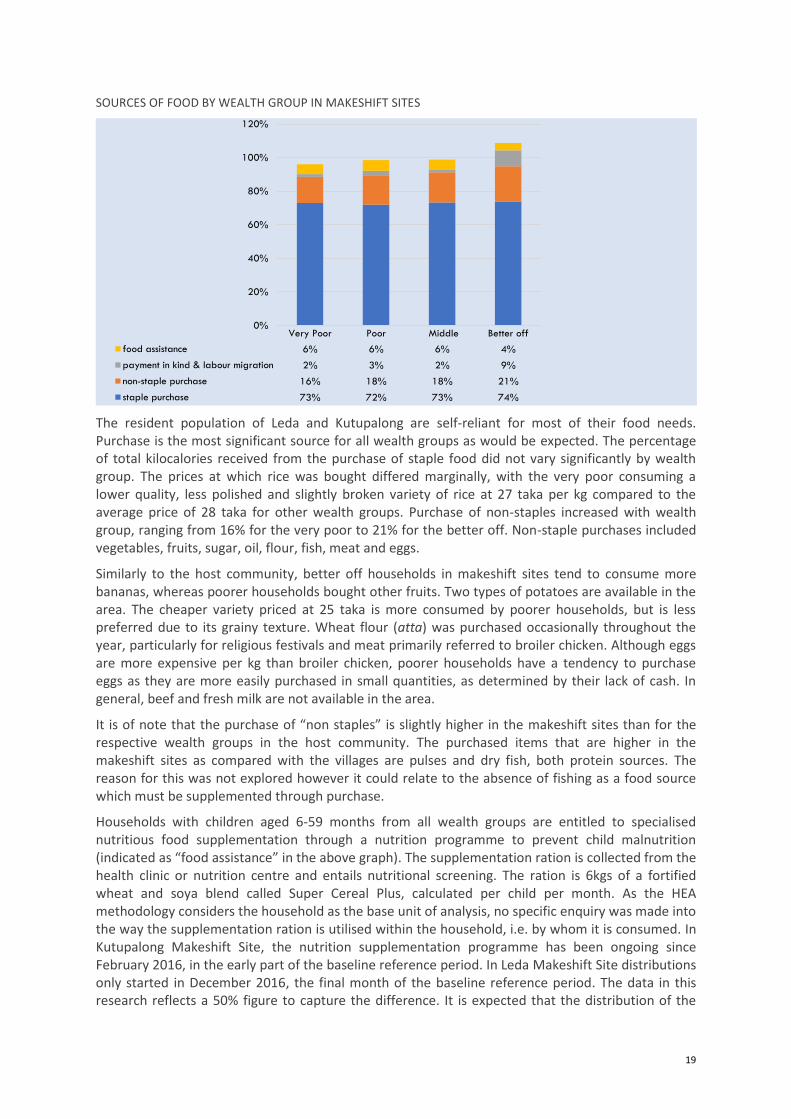
SOURCES OF FOOD BY WEALTH GROUP IN MAKESHIFT SITES
The resident population of Leda and Kutupalong are self-reliant for most of their food needs. Purchase is the most significant source for all wealth groups as would be expected. The percentage of total kilocalories received from the purchase of staple food did not vary significantly by wealth group. The prices at which rice was bought differed marginally, with the very poor consuming a lower quality, less polished and slightly broken variety of rice at 27 taka per kg compared to the average price of 28 taka for other wealth groups. Purchase of non-staples increased with wealth group, ranging from 16% for the very poor to 21% for the better off. Non-staple purchases included vegetables, fruits, sugar, oil, flour, fish, meat and eggs.
Similarly to the host community, better off households in makeshift sites tend to consume more bananas, whereas poorer households bought other fruits. Two types of potatoes are available in the area. The cheaper variety priced at 25 taka is more consumed by poorer households, but is less preferred due to its grainy texture. Wheat flour (atta) was purchased occasionally throughout the year, particularly for religious festivals and meat primarily referred to broiler chicken. Although eggs are more expensive per kg than broiler chicken, poorer households have a tendency to purchase eggs as they are more easily purchased in small quantities, as determined by their lack of cash. In general, beef and fresh milk are not available in the area.
It is of note that the purchase of “non staples” is slightly higher in the makeshift sites than for the respective wealth groups in the host community. The purchased items that are higher in the makeshift sites as compared with the villages are pulses and dry fish, both protein sources. The reason for this was not explored however it could relate to the absence of fishing as a food source which must be supplemented through purchase.
Households with children aged 6-59 months from all wealth groups are entitled to specialised nutritious food supplementation through a nutrition programme to prevent child malnutrition (indicated as “food assistance” in the above graph). The supplementation ration is collected from the health clinic or nutrition centre and entails nutritional screening. The ration is 6kgs of a fortified wheat and soya blend called Super Cereal Plus, calculated per child per month. As the HEA methodology considers the household as the base unit of analysis, no specific enquiry was made into the way the supplementation ration is utilised within the household, i.e. by whom it is consumed. In Kutupalong Makeshift Site, the nutrition supplementation programme has been ongoing since February 2016, in the early part of the baseline reference period. In Leda Makeshift Site distributions only started in December 2016, the final month of the baseline reference period. The data in this research reflects a 50% figure to capture the difference. It is expected that the distribution of the
Very Poor Poor Middle Better off
food assistance 6% 6% 6% 4%
payment in kind & labour migration 2% 3% 2% 9%
non-staple purchase 16% 18% 18% 21%
staple purchase 73% 72% 73% 74%
0%
20%
40%
60%
80%
100%
120%
20
ration will continue in both locations. Households with pregnant and lactating women received a food supplementation aimed at improving maternal nutrition. This includes 6.3kg of a different version of Super Cereal and 0.56 litres of cooking oil. As this supplementation programme is targeted specifically at households with pregnant and/or lactating women, only around 15% of households receive this supplement. The distribution of recipients does not follow wealth group patterns, instead is spread across all wealth groups. Failing to represent a majority in any particular wealth group means that this component of household diet is not not reflected in food assistance totals in the above graph.
All wealth groups in Kutupalong and Leda received approximately 2-3% of total annual kilocalorie needs from meals taken whilst doing agricultural labour. For the better off, a further 6% was earned from meals taken outside the home while migrating for work outside the makeshift sites.
21
CASH INCOME DISAGGREGATED BY WEALTH GROUP
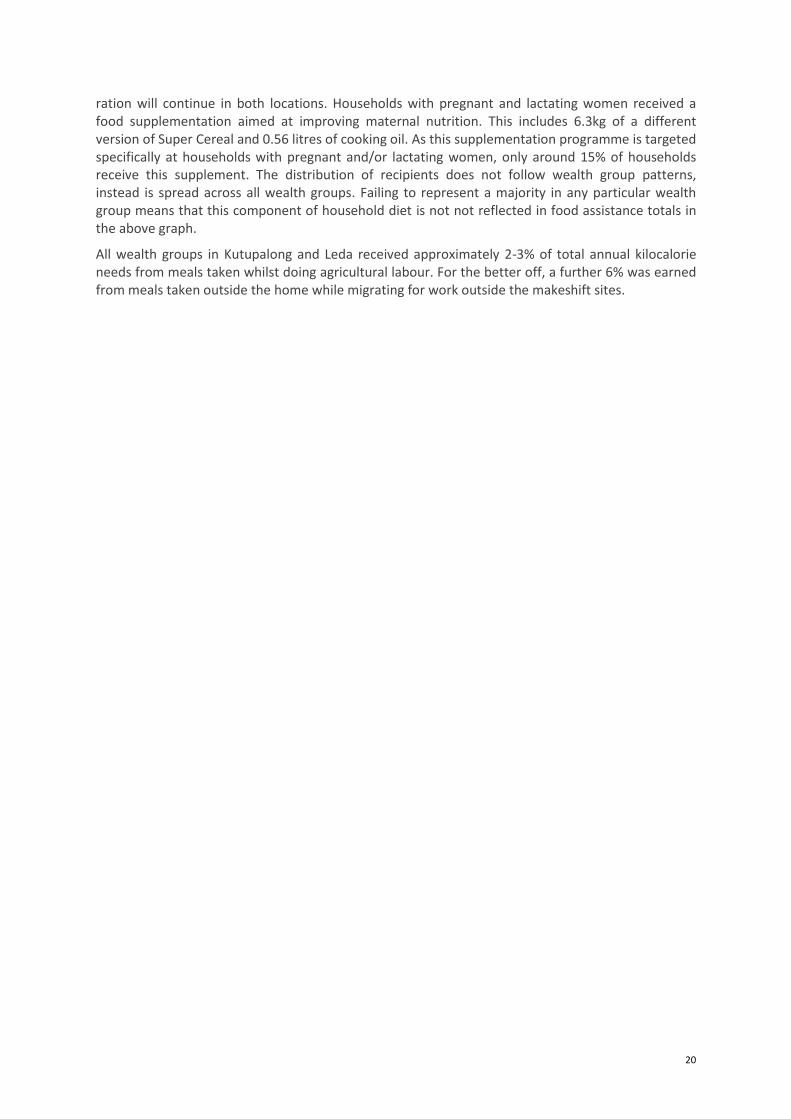
The graphs in this section present total income in absolute terms as Bangladesh taka, as well as in proportional terms as percentage of the total. The taka to US dollar rate at the time of research was around 78 to 79 per USD.
ANNUAL CASH INCOME IN HOST VILLAGES (Absolute value, taka)
ANNUAL CASH INCOMES IN HOST VILLAGES (Expressed as a percentage of total)
- 100.000 200.000 300.000 400.000 500.000 600.000 700.000
Very Poor
Poor
Non-Local Poor
Middle
Better Off
Very Poor Poor Non-Local Poor Middle Better Off
cash crop sales - - - 129.000 120.000
fishing 45.500 60.000 57.850 60.000 157.500
casual labour 45.900 38.400 28.800 - -
self-emplyment - 7.200 - 132.000 246.000
remittances - - - - 99.600
0% 10% 20% 30% 40% 50% 60% 70% 80% 90% 100%
Very Poor
Poor
Non-Local Poor
Middle
Better Off
Very Poor Poor Non-Local Poor Middle Better Off
cash crop sales 0% 0% 0% 40% 19%
fishing 50% 57% 67% 19% 25%
casual labour 50% 36% 33% 0% 0%
self-emplyment 0% 7% 0% 41% 39%
remittances 0% 0% 0% 0% 16%

22
Fishing accounts for a significant proportion of the economy of the zone, with all wealth groups earning income from this source. The very poor, poor and non-local poor earned 50 to 70% of their income from fishing in the baseline reference year. The patterns of generating income from fishing are highly complex in the zone. Not only do all three wealth groups engage in a combination of arrangements that include working as labourers on fishing boats, boat sharing, as well as direct fishing, but even individual households do a combination, sometimes all three. Fishing labour is the primary arrangement for the large boats owned by the better off, requiring 4 to 6 labouring crew. These crew are typically from local poor, non-local poor and very poor households. Even poor households who share-own their own small boat will do this work because the daily income is typically more reliable (the boats have engines so they can fish in more productive waters, even when weather conditions are not ideal).
Catch is sold to a trader, costs are removed from the sale amount, and the remaining profit typically shared 50% to the boat owner and the remaining 50% split amongst the crew. June through to August is the peak time for fishing labour opportunities. Poor households that jointly own fishing nets and a small paddling boat man these boats themselves, sometimes supplementing their labour requirements by hiring from very poor households.
For the very poor, casual labour contributed 50% of their annual income needs. In fact the
amount is higher than this as some of the income earned from fishing is actually earned as a labourer2. These households got around 1 to 2 days a week of casual labour doing tasks such as land cutting, fence building, construction and house repair for others, and working on salt farms. This work was both within their own villages, as well as outside. Meals were not typically provided for any of this work. They also did small amounts of agricultural labour, for 5 days a month for around half of the year, mostly in betel leaf gardens. Meals provided during this work accounted for roughly 1% of annual household kilocalorie needs (mentioned in the above section). Although the data was inconsistent and difficult to establish clear trends, it seems that from around half of these very poor households, the mother or other adult woman also did around ten days per month of salaried casual labour, paid at a rate of 150 taka per day (compared to men who earn around 400 taka per day). This included net repair, domestic service, manual carting of rocks and other such tasks,.
The non-agricultural casual work described in the paragraph above was also typical for poor households, as well as non-local poor households. The number of days worked per month was marginally higher than for the very poor. The small amount of self employment for the poor was mostly firewood collection and sales.
2 It was not possible to separate out the amounts due to the variation and complexity in the system.
Selling the catch of the day
23
It is important to note that the wealth category of households “non-local poor” earn just under the annual income of the very poor from the host community. However, there are other households from the non-local population that are both poorer, and those that are better off than the “non-local poor”. Various factors are likely to determine different outcomes for different households. The fishing skills so useful in the Teknaf Peninsula, for example, are not universal as most people displaced from the Rakhine area are from predominantly paddy rice producing, inland villages. Ability to network (social capital) is likely to influence access to economic opportunities.
Middle and better off households earned more income from the sale of betel nuts and betel leaf than the total income of the three poorer categories from all sources. In addition to this, as well as fishing which earned them the same or more than the three poorer households, they also earned significant income from self employment which includes shrimp cultivation and salt production, renting out of land and boats, shops and other businesses. In addition to this, the better off also received remittances, contributing around 100,000 taka per year.
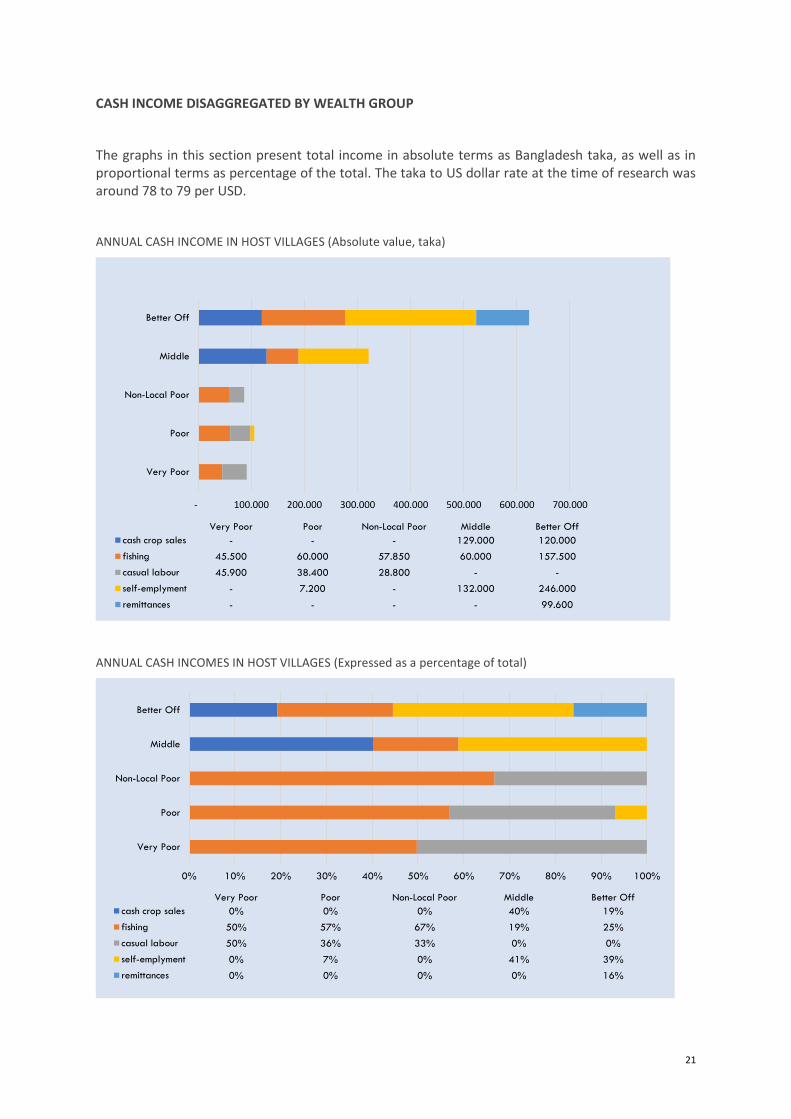
ANNUAL CASH INCOME IN MAKESHIFT SITES (Absolute value, taka)
- 20.000 40.000 60.000 80.000 100.000 120.000 140.000 160.000
Very Poor
Poor
Middle
Better Off
Very Poor Poor Middle Better Off
casual labour (local) 48.300 77.700 39.900 48.300
migrant labour - - - 39.000
self employment 19.200 - 66.000 46.200
24
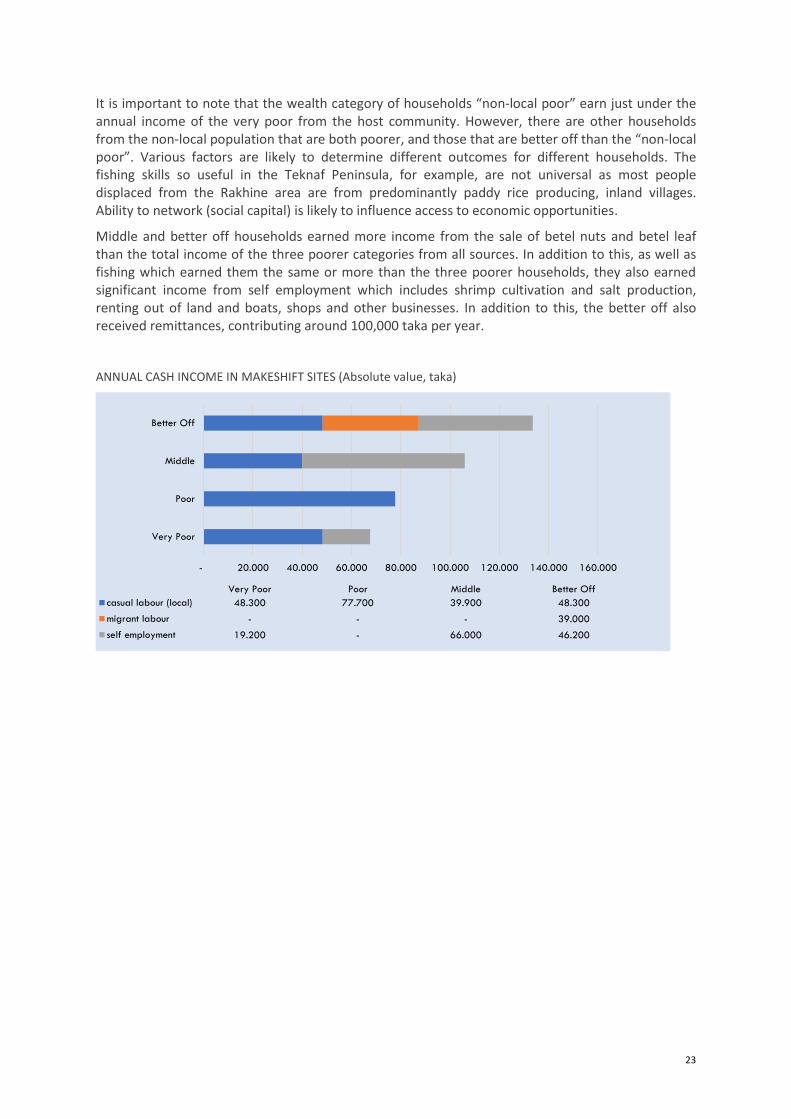
ANNUAL CASH INCOMES IN MAKESHIFT SITES (Expressed as a percentage of total)
Options for earning cash for households in the makeshift sites are very limited, as are total levels of incomes. Ownership of productive assets is low, supply of labourers outweighs availability of work in the not very productive context of the peninsula, and there are government imposed restrictions on the movement of people outside the makeshift sites. This is particularly true for Leda, where work opportunities are minimised further due to its location at the bottom of the peninsula, in between the Naf River and the hills. Travelling for work means crossing several border guard check points between Teknaf and Ukhia which reduces feasibility for legal reasons. In Leda, most day labour is in fishing and salt production, while in Kutupalong there is more scope for agricultural labour, domestic work and firewood collection.
Across both makeshift sites, the very poor relied predominantly on local labour which contributed over 70% of their annual revenue. However, unskilled day labour opportunities are unpredictable and uncertain, leading to high levels of income insecurity within this group. Households in this wealth group worked for an average of 2-3 days per week, except in the rainy season when it was slightly lower, and earned around BDT 300-350 per day. Approximately 30% of annual income was received from self-employment in the form of firewood sales. Firewood was generally collected for around 8 months every year (except the rainy season) and 2-3 bundles were sold per week for BDT 200 taka per bundle. During the interviews respondents indicated that it was not possible to increase the level of firewood sales beyond this average threshold because the collection is impeded by the distances they need to travel in order to reach the forest, often amounting to 10-15kms.
The poor relied strictly on day labour for annual household income which was in the BDT 65,000 range. Self-employment did not feature as a source of income in this group. While they did not need to collect firewood given their earnings, they also lacked the means to be engaged in other forms of self-employment.
The following graphs present approximate variation in total income by month in incomes for very poor and poor households based on interview data.
0% 10% 20% 30% 40% 50% 60% 70% 80% 90% 100%
Very Poor
Poor
Middle
Better Off
Very Poor Poor Middle Better Off
casual labour (local) 48.300 77.700 39.900 48.300
migrant labour - - - 39.000
self employment 19.200 - 66.000 46.200

25
The middle and better off were engaged in more diverse income-generating activities, with both groups receiving less than 40% from casual day labour. Petty trade, rickshaw pulling and small businesses (self employment) were the highest for the middle and accounted for approximately 66,000 of total earnings. There is a market directly opposite Kutupalong Makeshift Site which is run by local Bangladeshis. This reduces the need for shops within the makeshift site, although such shops still exist and generate nearly 45,000 in yearly revenue. In Leda, markets are not available in close proximity, increasing the scope for petty trade within the makeshift site itself. As an exception to the general trend, middle income households from Block C in Leda were more involved in port activities than in trade because they were able to leverage the network and connections that their block leader in the port. This is indicative of the importance of social capital in creating economic opportunities.
From the same sources of self-employment, the better off received around BDT 46,000 in the reference year. Households in this wealth group typically had two earning members, with one person managing a small business and another, usually an adult son, working outside as a migrant labourer. Migration, typically undertaken in Chittagong, contributed almost BDT 40,000 to total income and together with day labour and petty trade, this group had the strongest economic capacity in the makeshift sites.
Microfinance institutions do not operate in the makeshift sites and no formal sources of credit are available. Food is occasionally borrowed from small shops or grocers but paid for in following weeks or months depending on cash flow. The better off also, but less frequently, borrow small amounts of money for festivals at zero interest but this too is repaid in short timeframes.
-
1.000
2.000
3.000
4.000
5.000
6.000
7.000
8.000
Jan Feb Mar Apr May Jun Jul Aug Sep Oct Nov Dec
VP - non agri labour
VP - firewood sales
VP - monthly total
-
2.000
4.000
6.000
8.000
10.000
12.000
14.000
Jan Feb Mar Apr May Jun Jul Aug Sep Oct Nov Dec
P - agri labour
P - non agri labour
P - monthly total
26
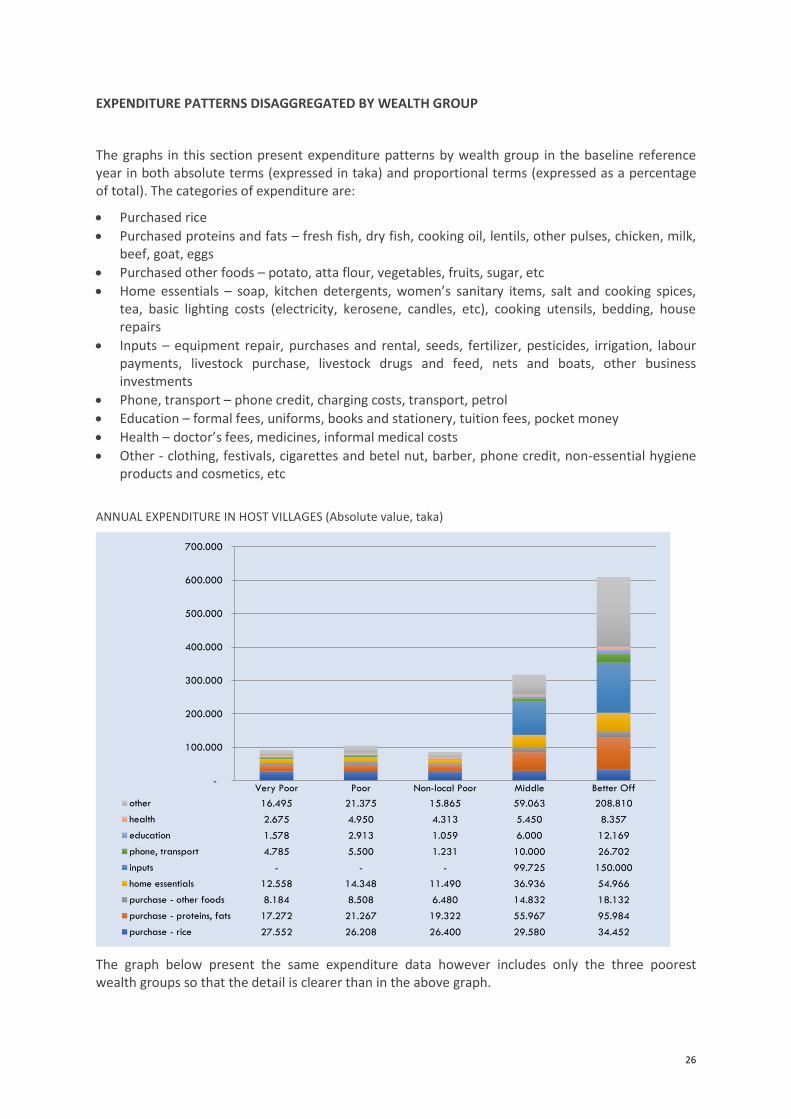
EXPENDITURE PATTERNS DISAGGREGATED BY WEALTH GROUP
The graphs in this section present expenditure patterns by wealth group in the baseline reference year in both absolute terms (expressed in taka) and proportional terms (expressed as a percentage of total). The categories of expenditure are:
• Purchased rice
• Purchased proteins and fats – fresh fish, dry fish, cooking oil, lentils, other pulses, chicken, milk, beef, goat, eggs
• Purchased other foods – potato, atta flour, vegetables, fruits, sugar, etc
• Home essentials – soap, kitchen detergents, women’s sanitary items, salt and cooking spices, tea, basic lighting costs (electricity, kerosene, candles, etc), cooking utensils, bedding, house repairs
• Inputs – equipment repair, purchases and rental, seeds, fertilizer, pesticides, irrigation, labour payments, livestock purchase, livestock drugs and feed, nets and boats, other business investments
• Phone, transport – phone credit, charging costs, transport, petrol
• Education – formal fees, uniforms, books and stationery, tuition fees, pocket money
• Health – doctor’s fees, medicines, informal medical costs
• Other - clothing, festivals, cigarettes and betel nut, barber, phone credit, non-essential hygiene products and cosmetics, etc
ANNUAL EXPENDITURE IN HOST VILLAGES (Absolute value, taka)
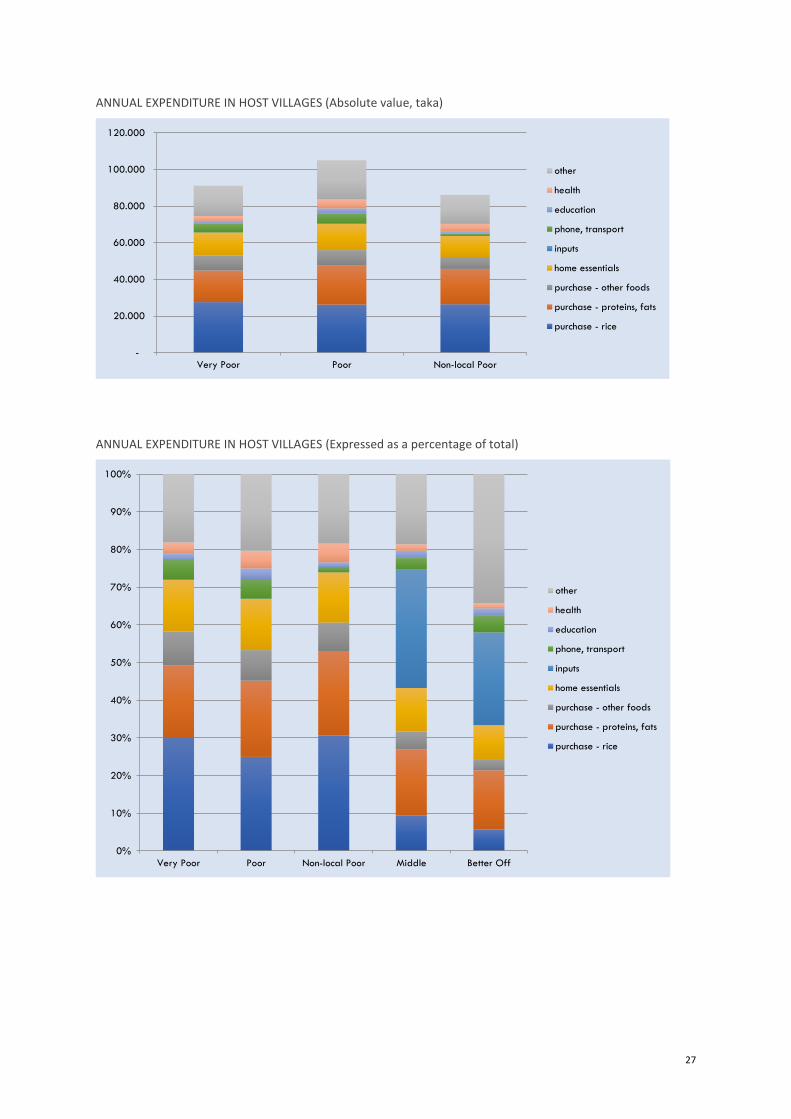
The graph below present the same expenditure data however includes only the three poorest wealth groups so that the detail is clearer than in the above graph.
Very Poor Poor Non-local Poor Middle Better Off
other 16.495 21.375 15.865 59.063 208.810
health 2.675 4.950 4.313 5.450 8.357
education 1.578 2.913 1.059 6.000 12.169
phone, transport 4.785 5.500 1.231 10.000 26.702
inputs - - - 99.725 150.000
home essentials 12.558 14.348 11.490 36.936 54.966
purchase - other foods 8.184 8.508 6.480 14.832 18.132
purchase - proteins, fats 17.272 21.267 19.322 55.967 95.984
purchase - rice 27.552 26.208 26.400 29.580 34.452
-
100.000
200.000
300.000
400.000
500.000
600.000
700.000
27
ANNUAL EXPENDITURE IN HOST VILLAGES (Absolute value, taka)
ANNUAL EXPENDITURE IN HOST VILLAGES (Expressed as a percentage of total)
-
20.000
40.000
60.000
80.000
100.000
120.000
Very Poor Poor Non-local Poor
other
health
education
phone, transport
inputs
home essentials
purchase - other foods
purchase - proteins, fats
purchase - rice
0%
10%
20%
30%
40%
50%
60%
70%
80%
90%
100%
Very Poor Poor Non-local Poor Middle Better Off
other
health
education
phone, transport
inputs
home essentials
purchase - other foods
purchase - proteins, fats
purchase - rice

28
ANNUAL EXPENDITURE IN MAKESHIFT SITES (Absolute value, taka)
ANNUAL EXPENDITURE IN MAKESHIFT SITES (Expressed as a percentage of total)
Very Poor Poor Middle Better Off
other 4.554 7.438 9.488 12.831
health 590 940 1.050 4.260
education - 268 648 486
phone, transport 824 2.652 2.576 5.832
inputs - - - -
home essentials 5.844 8.221 23.667 29.156
purchase - other foods 12.270 13.056 15.105 16.165
purchase - proteins, fats 16.168 19.285 24.833 36.103
purchase - rice 26.730 25.200 27.720 27.451
-
20.000
40.000
60.000
80.000
100.000
120.000
140.000
0%
10%
20%
30%
40%
50%
60%
70%
80%
90%
100%
Very Poor Poor Middle Better Off
other
health
education
phone, transport
inputs
home essentials
purchase - other foods
purchase - proteins, fats
purchase - rice

29
Expenditure on foods such as meat, fish, oil, lentils, eggs, etc (“purchase – proteins, fats”) was relatively similar for all the poorer wealth groups in both the host villages and makeshift sites, ranging from around 16,000 taka to 21,000 taka. The “middle” wealth group households in the makeshift sites purchased only marginally more than this at around 25,000. Better off households in the makeshift sites, as well as the middle and better off in the host villages spent significantly more on this category, up to 96,000 in the case of the better off in host villages. Expenditure on vegetables accounted for around half of the expenditure on the “purchase – other foods” category for all household types in the makeshift sites.
Expenditure on soap and essential hygiene products was far lower in Leda and Kutupalong than in host villages. Expenditure on these items was only 1,000 to 2,000 annually, whereas in the host villages the amount spent was around 2,000 taka for the poorer households ranging up to around 7,000 taka for the better off. Expenditure on lighting, electricity and firewood was significantly higher for better off households than for poorer households in both the host villages and the makeshift sites, indicating they have better lit homes, and have the luxury of not needing to spend time searching for firewood.
Expenditure on phones and transport can be considered as productive expenses, especially for the poorer wealth groups, who rely on these for gaining work opportunities. Some expenses that could be considered unnecessary are surprisingly high. Almost all categories of households in both the makeshift sites and host villages spend more on betel and cigarettes than on health and education combined. Pocket money for children to buy snacks on school days is also a major expenditure in the host villages.

30
EXPANSION AND CONTRACTIBILITY
Opportunities for expanding incomes and reducing expenditure are usually aspects of a household livelihood that are crucial to deal with shocks. Repeated probing in host villages revealed that there have not been any significant livelihood shocks that have taken place in the last five to ten years that required abnormal reduction of expenditures or increases in search for higher income. Individual households of course experience occasional crises, however on a community or zone level there have not been any weather, ocean or market shocks. It is too early to know if the recent influx of new arrivals will place a significant additional strain on the livelihood system on the peninsula (i.e. further increasing the supply of labour), suffice to say that interviewees did not express any such concerns at the time of the research.
Wide scale expandability of income sources for households living in Leda and Kutupalong is unlikely, as any realistic opportunities would have been already exploited. Reduction of expenditure for poorer households is also not feasible as can be seen in the table below. The very poor and poor are respectively spending 82% and 74% of their income on food, a situation which is not buying them any excesses or luxuries. The better off in the makeshift sites are spending 60% of their income on food, which is equivalent to the non-local poor in the host villages, and more than all other households in the host villages.
VP
makeshift
P
makeshift
M
makeshift
BO
makeshift
VP
host
P
host
Non-local Poor
(host)
M
host
BO
host
Spent on food
55k 58k 68k 80k 53k 56k 52k 100k 149k
As % 82% 74% 64% 60% 58% 53% 60% 31% 24%


