39
LIVING PLANET REPORT 2002

LIVING PLANET REPORT 2002

Published in June 2002 byWWF–World Wide Fund ForNature (also known as WorldWildlife Fund in the US andCanada), Gland, Switzerland.
Any reproduction in full or inpart of this publication mustmention the title and credit theabove-mentioned publisher asthe copyright owner.
© text and graphics 2002 WWFAll rights reserved
ISBN: 2-88085-255-2
A BANSON production27 Devonshire RoadCambridge CB1 2BH, UK
Design: Price WatkinsDiagrams and maps: David BurlesPrinted in the UK
Printed on recycled paper(including 50% post-consumerwaste) using vegetable-oilbased inks.
The material and thegeographical designations inthis report do not imply theexpression of any opinionwhatsoever on the part of WWFconcerning the legal status ofany country, territory, or area,or concerning the delimitationof its frontiers or boundaries.
AUTHORSEDITOR: Jonathan Loh1
LIVING PLANET INDEX:Martin Jenkins2
Janina Jakubowska2
Victoria Gaillard2
Brian Groombridge2
ECOLOGICAL FOOTPRINT:Mathis Wackernagel3
Chad Monfreda3
Diana Deumling3
Elie Gurarie3
Sara Friedman3
Alejandro Callejas Linares4
María Antonieta Vásquez Sánchez4
Ina Susana López Falfán4
SCENARIOS, PROJECTIONS AND POLICY
OPTIONS:Jonathan LohJørgen Randers5
Chad MonfredaMathis Wackernagel
1. WWF INTERNATIONALAvenue du Mont-BlancCH-1196 GlandSwitzerlandwww.panda.org
2. UNEP-WCMC219 Huntington RoadCambridge CB3 0DL, UKwww.unep-wcmc.org
3. REDEFINING PROGRESS1904 Franklin Street, 6th FloorOakland CA 94612, USAwww.rprogress.org
4. CENTRO DE ESTUDIOS PARALA SUSTENTABILIDAD Obreros Textiles 57 dep.6, col.Marco Antonio Muños91060 Xalapa, Mexicowww.edg.net.mx/~mathiswa
5. NORWEGIAN SCHOOL OFMANAGEMENTElias Smiths vei 15, Box 580N-1302 Sandvika, Norwaywww.bi.no
THE UNEP WORLDCONSERVATION MONITORING CENTREwas established in 2000 as theworld biodiversity informationand assessment centre of theUnited Nations EnvironmentProgramme (UNEP). UNEP-WCMC provides objective,scientifically rigorous andfocused information on globalbiodiversity.
REDEFINING PROGRESSis an Oakland, California basedthink-tank that works to exposethe inadequacy of equatingeconomic growth with progress;embrace’s nature’s limits as apath to true sustainability;promotes pricing systems thatincorporate social andenvironmental costs; andadvocates care-taking ofcommon assets.

LIVING PLANET REPORT 2002
ContentsForeword 2The Living Planet Index 3The Ecological Footprint 4
Cropland footprint 6Grazing land footprint 8Forest footprint 10Fishing ground footprint 12Energy footprint 14
Water withdrawals 16Scenarios and projections 18Policy options 20Tables 21Technical notes 30
Glossary 33References 34The WWF Network 36

At the Earth Summit in Rio de Janeiro, worldleaders committed themselves to the goal ofsustainable development. The term sustainabledevelopment has since entered into everydaylanguage, and yet it remains an elusive concept.Indeed, it is now used by governments,industry, and non-governmental organizationsto mean almost anything they want it to mean.However, in truth, it is a very simple idea. Beforethe Rio Summit, WWF, along with our partnerorganizations IUCN–The World ConservationUnion and UNEP, published Caring for the Earth,a report subtitled “A strategy for sustainableliving”. We defined sustainable development as“improving the quality of human life while livingwithin the carrying capacity of supportingecosystems”, and this definition remains as valid today as it was then.
The years after Rio have seen improvementsin the quality of life for people in many parts of the world, yet we continue to exact an unacceptable price from the Earth’secosystems at the same time. The past decadehas witnessed fires on an unprecedented scalein the tropical forests of Brazil and Indonesia,coral bleaching that has left vast areas of reef in the Caribbean, Indian, and Pacific Oceans as ghosts of their former selves, the collapse of commercially valuable fish stocks in theAtlantic, the ecological devastation of the BlackSea, the Aral Sea, and Lake Chad, and thecontinual loss of precious wetland andfreshwater ecosystems around the world.
What has this to do with sustainabledevelopment? We live on a bountiful planet,but not a limitless one. The Earth has a limited
capacity to yield its renewable resources.Provided that this capacity is not diminished,the Earth will continue to provide food,materials, energy, and freshwater each year, inperpetuity, for the benefit of all humanity.
Ensuring access to basic resources andimproving the health and livelihoods of theworld’s poorest people cannot be tackledseparately from maintaining the integrity ofnatural ecosystems. We rely on the livingbiosphere to provide food, materials, water, and, importantly, to absorb carbon dioxide. Bycontinuing to abuse the biosphere, and throughthe inequitable sharing of the Earth’s resources,we undermine the chances of eradicatingpoverty, and put the whole of humanity underthe threat of global climate change.
This report is about measuring human
pressure on the Earth, and how that pressureis distributed among countries and regions.The Living Planet Index is a measure of thestate of natural ecosystems, according to theabundance of animal species they support,while the ecological footprint comparescountries’ consumption of natural resourceswith the Earth’s biological capacity toregenerate them. These two measures do not take into account all of the conditionsnecessary to achieve sustainable development.But unless we recognize the ecological limitsof the biosphere, we cannot claim to besustainable.
Dr Claude MartinDirector General, WWF International
F O R E W O R D
LIVING PLANET REPORT 20022
Figure 1:LIVING PLANET INDEX,1970–2000
1.0
0.2
0.8
0.6
1.2
0.4
1.4
01970 197519651960 1980 1985 1990 1995 2000 1970 197519651960 1980 1985 1990 1995 2000
Figure 2:WORLD ECOLOGICAL FOOTPRINT,1961–99
Num
ber
of p
lane
ts
1.0
0.2
0.8
0.6
1.2
0.4
1.4
0
Ind
ex (1
970
= 1
.0)
Figure 1: The Living Planet Index is the average of three sub-indices measuring changes in forest, freshwater, andmarine ecosystems (see opposite). It fell by 37 per centbetween 1970 and 2000. The dotted line indicates the mostrecent period, for which fewer data are available.
Figure 2: The ecological footprint is a measure of humanity’suse of renewable natural resources. It grew by 80 per centbetween 1961 and 1999, to a level 20 per cent above the Earth’sbiological capacity. It is expressed as number of planets, whereone planet equals the total biologically productive capacity ofthe Earth in any one year. Natural resource consumption canexceed the planet’s productive capacity by depleting the Earth’snatural capital, but this cannot be sustained indefinitely.

3LIVING PLANET REPORT 2002
T H E L I V I N G P L A N E T I N D E XThe Living Planet Index is an indicator ofthe state of the world’s natural ecosystems.It is calculated as the average of threeseparate indices which relate to theabundance of forest, freshwater, and marinespecies. The index shows an overall declineof about 37 per cent between 1970 and2000 (see Figure 1).
The forest species population index is a measure of the trends in populations of282 bird, mammal, and reptile species livingin forest ecosystems around the world. Thefreshwater index comprises populations of195 species of birds, mammals, reptiles,amphibians, and fish from lakes, rivers, andwetland ecosystems. The marine index
includes 217 bird, mammal, reptile, and fish species found in marine and coastalecosystems.
All three indices declined over the 30year period: terrestrial species populationsfell by about 15 per cent on average, marinepopulations declined by about 35 per cent,and freshwater species populations fell byabout 54 per cent. Among the world’sbiogeographic regions, it appears thattropical and southern temperate regions are losing biodiversity the fastest, whereasnorthern temperate regions appear to bemore stable, or in slower decline since 1970. This does not necessarily imply thatnorthern ecosystems are in a better state
than southern or tropical ecosystems,merely that there has been relatively littlechange in northern ecosystems bycomparison over the past 30 years. Also, ananalysis of species suggests that birds aregenerally faring better than other groups.
Time-series population data used in theseindices were gathered from numerouspublished sources. It has not been possibleto ascribe confidence limits to the indexbecause of uncertainties within theunderlying population data.
Figure 3: The forest species populationindex shows a 15 per cent decline onaverage in 282 populations of species of
birds, mammals, and reptiles living in forestecosystems.
Figure 4: The freshwater species populationindex shows a decline of 54 per cent onaverage in 195 species of birds, mammals,reptiles, amphibians, and fish living in lakes,rivers, and wetland ecosystems.
Figure 5: The marine species populationindex shows a decline of 35 per cent onaverage in 217 species of birds, mammals,reptiles, and fish living in coastal and marineecosystems.
Figure 4:FRESHWATER SPECIESPOPULATION INDEX, 1970–2000
Figure 5:MARINE SPECIESPOPULATION INDEX, 1970–2000
Figure 3:FOREST SPECIESPOPULATION INDEX, 1970–2000
1.0
0.2
0.8
0.6
1.2
0.4
1.4
01970 1975 1980 1985 1990 1995 2000
1.0
0.2
0.8
0.6
1.2
0.4
1.4
01970 1975 1980 1985 1990 1995 2000
1.0
0.2
0.8
0.6
1.2
0.4
1.4
01970 1975 1980 1985 1990 1995 2000

Figure 6:ECOLOGICAL FOOTPRINT PER PERSON, by country, 1999
Figure 8:ECOLOGICAL FOOTPRINT, by region and income group, 1999
Figure 7:WORLD ECOLOGICAL FOOTPRINT, 1961–99
Glo
bal
hec
tare
s p
er p
erso
n
10
0
8
4
2
6
311 387 350 503 323 3 313Population (millions)
774
North AmericaWestern EuropeCentral and Eastern Europe
Middle East and Central AsiaLatin America and the Caribbean
Asia-PacificAfrica
Bill
ion
glob
al h
ecta
res
High incomecountries
Middle incomecountriesLow incomecountries
UN
ITE
D A
RA
B E
MIR
ATE
S
UN
ITE
D S
TATE
S O
F A
ME
RIC
A
CA
NA
DA
NE
W Z
EA
LAN
D
FIN
LAN
D
NO
RW
AY
KU
WA
IT
AU
STR
ALI
A
SW
ED
EN
BE
LGIU
M/L
UX
EM
BO
UR
G
DE
NM
AR
K
UN
ITE
D K
ING
DO
M
IRE
LAN
D
FRA
NC
E
GR
EE
CE
ES
TON
IA
CZ
EC
H R
EP
.
NE
THE
RLA
ND
S
JAP
AN
AU
STR
IA
GE
RM
AN
Y
SP
AIN
RU
SS
IAN
FE
DE
RA
TIO
N
PO
RTU
GA
L
ISR
AE
L
SW
ITZ
ER
LAN
D
SA
UD
I AR
AB
IA
SO
UTH
AFR
ICA
, RE
P.
ITA
LY
UR
UG
UA
Y
PO
LAN
D
KA
ZA
KH
STA
N
SLO
VE
NIA
SLO
VA
KIA
LATV
IA
UK
RA
INE
KO
RE
A, R
EP
.
TRIN
IDA
D A
ND
TO
BA
GO
LIB
YA
BE
LAR
US
MA
CE
DO
NIA
TUR
KM
EN
ISTA
N
MA
LAY
SIA
CH
ILE
HU
NG
AR
Y
LITH
UA
NIA
KO
RE
A, D
PR
AR
GE
NTI
NA
CR
OA
TIA
LEB
AN
ON
MO
NG
OLI
A
ME
XIC
O
RO
MA
NIA
PA
RA
GU
AY
BR
AZ
IL
BU
LGA
RIA
VE
NE
ZU
ELA
YU
GO
SLA
VIA
, FE
D. R
EP
.
GA
BO
N
JAM
AIC
A
TUR
KE
Y
IRA
N
CO
STA
RIC
A
UZ
BE
KIS
TAN
AZ
ER
BA
IJA
N
PA
NA
MA
TUN
ISIA
SY
RIA
ALG
ER
IA
JOR
DA
N
EC
UA
DO
R
CH
INA
0
4
2
8
10
6
Glo
bal
hec
tare
s p
er p
erso
n
1960 1965 1970 1975 1980 1985 1990 20001995
14
0
6
12
10
8
2
4
Built-up land
Energy
Fishing groundForest
Grazing land
Cropland
4
The ecological footprint compares renewablenatural resource consumption with nature’sbiologically productive capacity. A country’sfootprint is the total area required to producethe food and fibres that country consumes,sustain its energy consumption, and givespace for its infrastructure. People consumeresources from all over the world, so theirfootprint can be thought of as the sum ofthese areas, wherever they are on the planet.
The global ecological footprint covered13.7 billion hectares in 1999, or 2.3 globalhectares per person (a global hectare is 1 hectare of average biological productivity).
This demand on nature can be compared withthe Earth’s productive capacity. About 11.4billion hectares, slightly less than a quarter ofthe Earth’s surface, are biologically productive,harbouring the bulk of the planet’s biomassproduction. The remaining three-quarters,including deserts, ice caps, and deep oceans,support comparatively low concentrations of bioproductivity. The productive quarter of the biosphere corresponded to an average1.9 global hectares per person in 1999.Therefore human consumption of naturalresources that year overshot the Earth’sbiological capacity by about 20 per cent.
The global ecological footprint changeswith population size, average consumptionper person, and the kinds of productionsystems, or technologies, in use. The Earth’sbiological capacity changes with the size ofthe biologically productive area, and itsaverage productivity per hectare. Hencechanges in population, consumption, andtechnology can narrow or widen the gapbetween humanity’s footprint and theavailable biological capacity. It is apparentthat, since the 1980s, humanity has beenrunning an ecological deficit with the Earth(see Figure 2).
Figure 6: The ecological footprint per personfor all countries with populations over 1 million.
Figure 7: Humanity’s ecological footprint grewat an average rate of 1.6 per cent per year from1961 to 1999. (World population grew slightlyfaster at 1.8 per cent per year.)
Figure 8: The ecological footprints of sevenregions of the world in 1999. The footprint per person of high income countries was onaverage over six times that of low incomecountries, and over three times greater than the Earth’s biological capacity.
T H E E C O L O G I C A L F O O T P R I N T
LIVING PLANET REPORT 2002

Existing biologically productive area per person
NIC
AR
AG
UA
DO
MIN
ICA
N R
EP
.
THA
ILA
ND
MA
UR
ITIU
S
EG
YP
T
CU
BA
BO
TSW
AN
A
NA
MIB
IA
PA
PU
A N
EW
GU
INE
A
GU
ATE
MA
LA
MO
LDO
VA
, RE
P.
IRA
Q
CO
LOM
BIA
HO
ND
UR
AS
NIG
ER
IA
MA
UR
ITA
NIA
ZIM
BA
BW
E
SE
NE
GA
L
ZA
MB
IA
CE
NTR
AL
AFR
ICA
N R
EP
.
GU
INE
A
EL
SA
LVA
DO
R
BU
RK
INA
FA
SO
PH
ILIP
PIN
ES
PE
RU
NIG
ER
BE
NIN
MA
LI
KY
RG
YZ
STA
N, R
EP
.
IND
ON
ES
IA
CA
ME
RO
ON
MO
RO
CC
O
KE
NY
A
GH
AN
A
RW
AN
DA
SU
DA
N
UG
AN
DA
BO
SN
IA H
ER
ZE
GO
VIN
A
SO
MA
LIA
TAN
ZA
NIA
, UN
ITE
D R
EP
.
CH
AD
SR
I LA
NK
A
GA
MB
IA, T
HE
ALB
AN
IA
BO
LIV
IA
AFG
HA
NIS
TAN
CO
NG
O
CÔ
TE D
'IVO
IRE
LIB
ER
IA
GE
OR
GIA
AR
ME
NIA
MA
DA
GA
SC
AR
AN
GO
LA
MA
LAW
I
LES
OTH
O
TOG
O
NE
PA
L
CA
MB
OD
IA
HA
ITI
LAO
PD
R
CO
NG
O, D
EM
. RE
P.
ER
ITR
EA
ETH
IOP
IA
IND
IA
VIE
T N
AM
YE
ME
N
MY
AN
MA
R
GU
INE
A-B
ISS
AU
TAJI
KIS
TAN
PA
KIS
TAN
SIE
RR
A L
EO
NE
BA
NG
LAD
ES
H
BU
RU
ND
I
MO
ZA
MB
IQU
E
5LIVING PLANET REPORT 2002
Map 1:ECOLOGICAL FOOTPRINT BY COUNTRYGlobal hectares per person, 1999
5.0 and over
3.0 – 5.0
1.5 – 3.0
1.0 – 1.5
less than 1.0
insufficient data

Figure 9:CROPLAND FOOTPRINT PERPERSON, by country, 1999
Figure 11:CROPLAND FOOTPRINT, by region and income group, 1999
Figure 10:WORLD CROPLAND FOOTPRINT, 1961–99
Glo
bal
hec
tare
s p
er p
erso
n
1.6
0
1.2
0.8
0.4
311 387 350 503 323 3 313Population (millions)
774
North AmericaWestern EuropeCentral and Eastern Europe
Middle East and Central Asia
Latin America and the Caribbean
Asia-PacificAfrica
Bill
ion
glob
al h
ecta
res
High incomecountries
Middle incomecountriesLow incomecountries
NE
W Z
EA
LAN
D
CA
NA
DA
AU
STR
ALI
A
UN
ITE
D S
TATE
S O
F A
ME
RIC
A
LATV
IA
LITH
UA
NIA
IRE
LAN
D
ES
TON
IA
SW
ED
EN
DE
NM
AR
K
UN
ITE
D A
RA
B E
MIR
ATE
S
PA
RA
GU
AY
KA
ZA
KH
STA
N
RU
SS
IAN
FE
DE
RA
TIO
N
BE
LAR
US
SP
AIN
GR
EE
CE
FIN
LAN
D
FRA
NC
E
PO
LAN
D
NIC
AR
AG
UA
BU
LGA
RIA
SA
UD
I AR
AB
IA
PO
RTU
GA
L
CZ
EC
H R
EP
.
NO
RW
AY
CR
OA
TIA
LIB
YA
UK
RA
INE
HU
NG
AR
Y
TUR
KE
Y
BE
LGIU
M/L
UX
EM
BO
UR
G
ITA
LY
MA
CE
DO
NIA
ISR
AE
L
AR
GE
NTI
NA
NE
THE
RLA
ND
S
SLO
VA
KIA
YU
GO
SLA
VIA
, FE
D. R
EP
.
TUN
ISIA
SLO
VE
NIA
RO
MA
NIA
AU
STR
IA
ME
XIC
O
GA
BO
N
LEB
AN
ON
MO
LDO
VA
, RE
P.
GE
RM
AN
Y
UN
ITE
D K
ING
DO
M
MA
LAY
SIA
CE
NTR
AL
AFR
ICA
N R
EP
.
SO
UTH
AFR
ICA
, RE
P.
CA
ME
RO
ON
NA
MIB
IA
BR
AZ
IL
NIG
ER
CH
ILE
ZA
MB
IA
IRA
N
TUR
KM
EN
ISTA
N
ALG
ER
IA
SY
RIA
UR
UG
UA
Y
KY
RG
YZ
STA
N, R
EP
.
JOR
DA
N
ALB
AN
IA
CU
BA
SW
ITZ
ER
LAN
D
MA
UR
ITIU
S
MA
LI
NIG
ER
IA
KU
WA
IT
0
3.0
0.5
2.0
1.5
2.5
1.0
Glo
bal
hec
tare
s p
er p
erso
n
1960 1965 1970 1975 1980 1985 1990 20001995
4
3
0
2
1
6
A country’s cropland footprint is the area required to produce all the cropswhich that country consumes, includingcereals, fruits and vegetables, roots andtubers, pulses, nuts, tea, coffee, sugar, and vegetable oils, as well as tobacco,cotton, jute, and rubber. It also includescrops grown to feed animals whose meat, milk, or eggs are consumed in that country (meat from free-ranginganimals is accounted for in the grazingland footprint).
Within each country, the footprint
accounts distinguish between two types ofcropland: marginal cropland includes lowerquality land used for growing sorghum,millet, olives, and fodder grass, and standardcropland includes all other crops. Croplandthat is unharvested, temporarily grazed, orfallow land is also included as standardcropland. The cropland footprint does not take account of land lost each year to erosion,salinization, or degradation.
The cropland footprint of the averageNorth American was nearly three times theworld average, at 1.55 global hectares,
whereas the cropland footprint of an average African or Asian was less than 0.40 global hectares. Worldwide, there were approximately 0.53 global hectares of cropland available per person in 1999.
Figure 9: The cropland footprint per person,by country, compared with the globallyavailable area in 1999.
Figure 10: While population almost doubled,the world’s cropland footprint grew by lessthan 10 per cent between 1961 and 1999,
mainly because crop yields improved as aresult of increased irrigation and fertilizer use.
Figure 11: The cropland footprints of sevenregions of the world in 1999. There was a3.5-fold difference between high and lowincome countries, per person.
C R O P L A N D F O O T P R I N T
LIVING PLANET REPORT 2002

Existing cropland area per person
MO
RO
CC
O
HO
ND
UR
AS
SU
DA
N
CH
AD
PA
NA
MA
KO
RE
A, R
EP
.
UG
AN
DA
JAP
AN
TOG
O
BO
SN
IA H
ER
ZE
GO
VIN
A
GA
MB
IA, T
HE
DO
MIN
ICA
N R
EP
.
EG
YP
T
PE
RU
JAM
AIC
A
SE
NE
GA
L
AFG
HA
NIS
TAN
AR
ME
NIA
AZ
ER
BA
IJA
N
BU
RK
INA
FA
SO
VE
NE
ZU
ELA
CO
STA
RIC
A
BE
NIN
TRIN
IDA
D A
ND
TO
BA
GO
MA
UR
ITA
NIA
GE
OR
GIA
BO
TSW
AN
A
CÔ
TE D
'IVO
IRE
UZ
BE
KIS
TAN
MY
AN
MA
R
EC
UA
DO
R
GU
ATE
MA
LA
CH
INA
CA
MB
OD
IA
MO
NG
OLI
A
GH
AN
A
IRA
Q
EL
SA
LVA
DO
R
THA
ILA
ND
BO
LIV
IA
RW
AN
DA
GU
INE
A-B
ISS
AU
IND
ON
ES
IA
GU
INE
A
ZIM
BA
BW
E
CO
LOM
BIA
TAJI
KIS
TAN
IND
IA
YE
ME
N
AN
GO
LA
PA
KIS
TAN
PA
PU
A N
EW
GU
INE
A
SR
I LA
NK
A
MA
LAW
I
LES
OTH
O
PH
ILIP
PIN
ES
HA
ITI
VIE
T N
AM
KO
RE
A, D
PR
BU
RU
ND
I
MA
DA
GA
SC
AR
TAN
ZA
NIA
, UN
ITE
D R
EP
.
NE
PA
L
BA
NG
LAD
ES
H
ER
ITR
EA
ETH
IOP
IA
LAO
PD
R
CO
NG
O
SIE
RR
A L
EO
NE
LIB
ER
IA
MO
ZA
MB
IQU
E
KE
NY
A
CO
NG
O, D
EM
. RE
P.
SO
MA
LIA
7
Map 2: CROPLAND FOOTPRINT BY COUNTRYGlobal hectares per person, 1999
1.0 and over
0.7 – 1.0
0.5 – 0.7
0.3 – 0.5
less than 0.3
insufficient data
LIVING PLANET REPORT 2002

Figure 12:GRAZING LAND FOOTPRINT PERPERSON, by country, 1999
Figure 14:GRAZING LAND FOOTPRINT, by region and income group, 1999
Figure 13:WORLD GRAZING LAND FOOTPRINT, 1961–99
Glo
bal
hec
tare
s p
er p
erso
n
0.4
0
0.2
0.3
0.1
311 387 350 503 323 3 313Population (millions)
774
North AmericaWestern EuropeCentral and Eastern Europe
Middle East and Central AsiaLatin America and the Caribbean
Asia-PacificAfrica
Bill
ion
glob
al h
ecta
res
High incomecountries
Middle incomecountries
Low incomecountries
UR
UG
UA
Y
NE
W Z
EA
LAN
D
MO
NG
OLI
A
AR
GE
NTI
NA
AU
STR
ALI
A
PA
RA
GU
AY
BR
AZ
IL
KA
ZA
KH
STA
N
SW
ITZ
ER
LAN
D
TUR
KM
EN
ISTA
N
SO
MA
LIA
BO
TSW
AN
A
IRE
LAN
D
MA
UR
ITA
NIA
GR
EE
CE
UN
ITE
D K
ING
DO
M
CH
ILE
UN
ITE
D S
TATE
S O
F A
ME
RIC
A
CA
NA
DA
PA
NA
MA
CH
AD
SO
UTH
AFR
ICA
, RE
P.
AU
STR
IA
CO
LOM
BIA
CE
NTR
AL
AFR
ICA
N R
EP
.
AFG
HA
NIS
TAN
SU
DA
N
ME
XIC
O
SP
AIN
NA
MIB
IA
CO
STA
RIC
A
SLO
VE
NIA
VE
NE
ZU
ELA
KE
NY
A
KY
RG
YZ
STA
N, R
EP
.
FRA
NC
E
UN
ITE
D A
RA
B E
MIR
ATE
S
ITA
LY
SE
NE
GA
L
MA
DA
GA
SC
AR
PO
RTU
GA
L
MA
LI
LES
OTH
O
ALG
ER
IA
AR
ME
NIA
RU
SS
IAN
FE
DE
RA
TIO
N
EC
UA
DO
R
GE
OR
GIA
BE
LGIU
M/L
UX
EM
BO
UR
G
DO
MIN
ICA
N R
EP
.
BO
LIV
IA
NE
THE
RLA
ND
S
TAN
ZA
NIA
, UN
ITE
D R
EP
.
KU
WA
IT
BU
RK
INA
FA
SO
AN
GO
LA
ZIM
BA
BW
E
NIC
AR
AG
UA
MO
RO
CC
O
SW
ED
EN
UZ
BE
KIS
TAN
BO
SN
IA H
ER
ZE
GO
VIN
A
LIB
YA
ISR
AE
L
LATV
IA
BE
LAR
US
ER
ITR
EA
TUN
ISIA
MA
CE
DO
NIA
IRA
N
JAM
AIC
A
YE
ME
N
0
1.6
0.2
0.6
1.0
0.8
1.2
1.4
0.4
Glo
bal
hec
tare
s p
er p
erso
n
1960 1965 1970 1975 1980 1985 1990 20001995
0.8
0
0.4
0.6
0.2
8
A country’s grazing land footprintcorresponds to its consumption of meat,dairy products, hides, and wool that comefrom livestock which are not crop-fed, but occupy permanent pastures. The world’sgrazing livestock population comprisesmainly cattle, sheep, and goats, but alsoincludes horses, asses, and camels, which,though a small proportion worldwide, areimportant in some regions.
Humanity’s grazing land footprint grewfrom 0.41 billion global hectares in 1961 to0.73 billion global hectares in 1999. This
increase came largely at the expense offorest land.
In 1999, the world average grazing landfootprint was 0.12 global hectares perperson. In contrast, the grazing landcapacity may be as large as 0.27 globalhectares per person. The grazing landfootprint does not take account of land lostto over-grazing or erosion. Due to poor dataon grazing land productivities, the ratiobetween capacity and demand for grazingproducts is uncertain.
Figure 12: Some low income countries had acomparatively large grazing land footprintbecause a high proportion of their land wasless productive than the world average, andsuitable only for grazing.
Figure 13: Humanity’s demand for grazingland increased by 80 per cent between 1961and 1999.
Figure 14: There was an eight-fold disparitybetween the grazing land footprints perperson of high income and low income
countries in 1999, mainly due to the greateramount of meat and dairy products in thediets of the richer nations.
G R A Z I N G L A N D F O O T P R I N T
LIVING PLANET REPORT 2002

Existing grazing land area per person
MA
UR
ITIU
S
DE
NM
AR
K
GE
RM
AN
Y
PE
RU
CH
INA
HO
ND
UR
AS
ES
TON
IA
AZ
ER
BA
IJA
N
CR
OA
TIA
NIG
ER
BU
LGA
RIA
SA
UD
I AR
AB
IA
GU
ATE
MA
LA
SLO
VA
KIA
LAO
PD
R
NIG
ER
IA
SY
RIA
PA
PU
A N
EW
GU
INE
A
JAP
AN
ALB
AN
IA
LITH
UA
NIA
CZ
EC
H R
EP
.
EL
SA
LVA
DO
R
TRIN
IDA
D A
ND
TO
BA
GO
ZA
MB
IA
YU
GO
SLA
VIA
, FE
D R
EP
.
GA
MB
IA, T
HE
JOR
DA
N
MA
LAY
SIA
NO
RW
AY
RO
MA
NIA
CA
MB
OD
IA
LEB
AN
ON
GU
INE
A
CÔ
TE D
'IVO
IRE
TAJI
KIS
TAN
UK
RA
INE
CA
ME
RO
ON
GA
BO
N
RW
AN
DA
KO
RE
A, R
EP
.
FIN
LAN
D
TUR
KE
Y
GU
INE
A-B
ISS
AU
BU
RU
ND
I
CU
BA
SIE
RR
A L
EO
NE
UG
AN
DA
BE
NIN
PO
LAN
D
PH
ILIP
PIN
ES
TOG
O
MO
ZA
MB
IQU
E
CO
NG
O
ETH
IOP
IA
GH
AN
A
EG
YP
T
HU
NG
AR
Y
IND
ON
ES
IA
MA
LAW
I
MO
LDO
VA
, RE
P.
NE
PA
L
SR
I LA
NK
A
LIB
ER
IA
CO
NG
O, D
EM
. RE
P.
PA
KIS
TAN
HA
ITI
IRA
Q
THA
ILA
ND
VIE
T N
AM
MY
AN
MA
R
BA
NG
LAD
ES
H
KO
RE
A, D
PR
IND
IA
9LIVING PLANET REPORT 2002
Map 3:GRAZING LAND FOOTPRINT BY COUNTRYGlobal hectares per person, 1999
0.30 and over
0.15 – 0.30
0.08 – 0.15
0.04 – 0.08
less than 0.04
insufficient data

Existing forest areaper person
Figure 15:FOREST FOOTPRINT PERPERSON, by country, 1999
Figure 17:FOREST FOOTPRINT, by region and income group, 1999
Figure 16:WORLD FOREST FOOTPRINT, 1961–99
Glo
bal
hec
tare
s p
er p
erso
n
1.4
0
1.0
0.6
0.2
0.8
1.2
0.4
311 387 350 503 323 3 313Population (millions)
774
North AmericaWestern EuropeCentral and Eastern Europe
Middle East and Central AsiaLatin America and the Caribbean
Asia-PacificAfrica
Bill
ion
glob
al h
ecta
res
High incomecountries
Middle incomecountries
Low incomecountries
FIN
LAN
D
SW
ED
EN
UN
ITE
D S
TATE
S O
F A
ME
RIC
A
CA
NA
DA
DE
NM
AR
K
NE
W Z
EA
LAN
D
NO
RW
AY
AU
STR
IA
CO
STA
RIC
A
CH
ILE
UR
UG
UA
Y
AU
STR
ALI
A
LATV
IA
IRE
LAN
D
NE
THE
RLA
ND
S
BE
LAR
US
SP
AIN
CZ
EC
H R
EP
.
PA
PU
A N
EW
GU
INE
A
BE
LGIU
M/L
UX
EM
BO
UR
G
SW
ITZ
ER
LAN
D
FRA
NC
E
GU
INE
A
BR
AZ
IL
EC
UA
DO
R
BO
TSW
AN
A
GU
ATE
MA
LA
PO
RTU
GA
L
RW
AN
DA
GE
RM
AN
Y
KE
NY
A
ES
TON
IA
UN
ITE
D A
RA
B E
MIR
ATE
S
BU
RK
INA
FA
SO
LIB
ER
IA
BE
NIN
NIG
ER
IA
NE
PA
L
EL
SA
LVA
DO
R
CO
NG
O, D
EM
. RE
P.
UN
ITE
D K
ING
DO
M
UG
AN
DA
LAO
PD
R
SLO
VE
NIA
ETH
IOP
IA
SO
MA
LIA
SO
UTH
AFR
ICA
, RE
P.
MA
LAW
I
ITA
LY
TAN
ZA
NIA
, UN
ITE
D R
EP
.
HA
ITI
ZA
MB
IA
LITH
UA
NIA
GR
EE
CE
JAP
AN
CR
OA
TIA
PO
LAN
D
LES
OTH
O
GA
BO
N
HO
ND
UR
AS
ISR
AE
L
ZIM
BA
BW
E
NIG
ER
GH
AN
A
PA
RA
GU
AY
ER
ITR
EA
MA
LI
PH
ILIP
PIN
ES
CA
MB
OD
IA
CH
INA
SE
NE
GA
L
SR
I LA
NK
A
0
2.5
0.5
1.0
1.5
2.0
Glo
bal
hec
tare
s p
er p
erso
n
1960 1965 1970 1975 1980 1985 1990 20001995
2.0
0
1.0
1.5
0.5
10
A nation’s forest footprint is the arearequired to produce the forest productswhich that nation consumes. This includesall timber products, whether in the form of sawnwood, wood-based panels, orfibreboard, as well as pulp, paper, andpaperboard. It does not include non-timberforest products such as wild fruit, nuts,fibres, or bushmeat. Wood or charcoal burntas fuel are included in the energy footprint.
To calculate the national forest footprint,the national consumption of forest products is converted into the forest area required to
produce them. The forest footprint does not reflect the quality of forests or thesustainability of forestry activities in eachcountry. It only compares each country’srecorded consumption.
The world average forest footprint in1999 was about 0.3 global hectares perperson. According to the Food andAgriculture Organization of the UnitedNations, there were approximately 3.8 billion hectares of forest in 1999. With a biological productivity 35 per cent higher than average land, these
3.8 billion hectares correspond to 5.1 billionglobal hectares of biocapacity, or 0.9 globalhectares per person.
The fact that the average forest footprintis well within the Earth’s biological capacitysuggests that the world’s forests could meetthe demand for wood products, as long as forestry activities worldwide maintain the highest standards of sustainablemanagement. However, this would notaddress the loss of tropical forests due to the large scale conversion of forested land to cropland or grazing land.
Figure 15: Countries with high consumption ofwood products per person tend to be thosewith extensive forests. This is potentiallysustainable, and makes good ecological senseas long as their consumption remains withintheir forests’ biological capacity.
Figure 16: The world’s forest footprint grew byabout 50 per cent between 1961 and 1999.
Figure 17: There was a four-fold gap betweenthe forest footprints per person of high and lowincome countries.
F O R E S T F O O T P R I N T
LIVING PLANET REPORT 2002

LEB
AN
ON
MA
DA
GA
SC
AR
MA
CE
DO
NIA
MA
LAY
SIA
AN
GO
LA
RU
SS
IAN
FE
DE
RA
TIO
N
HU
NG
AR
Y
VIE
T N
AM
SLO
VA
KIA
GU
INE
A-B
ISS
AU
THA
ILA
ND
PA
NA
MA
GA
MB
IA, T
HE
TUN
ISIA
TUR
KE
Y
AFG
HA
NIS
TAN
CO
LOM
BIA
KO
RE
A, R
EP
.
IND
ON
ES
IA
SU
DA
N
ME
XIC
O
BU
LGA
RIA
CÔ
TE D
'IVO
IRE
PE
RU
RO
MA
NIA
JAM
AIC
A
MA
UR
ITIU
S
CH
AD
IND
IA
KU
WA
IT
KO
RE
A, D
PR
TRIN
IDA
D A
ND
TO
BA
GO
TOG
O
BU
RU
ND
I
YU
GO
SLA
VIA
, FE
D. R
EP
.
MO
NG
OLI
A
BA
NG
LAD
ES
H
AR
GE
NTI
NA
UK
RA
INE
DO
MIN
ICA
N R
EP
.
BO
LIV
IA
MY
AN
MA
R
PA
KIS
TAN
CE
NTR
AL
AFR
ICA
N R
EP
.
ALB
AN
IA
SA
UD
I AR
AB
IA
ALG
ER
IA
CA
ME
RO
ON
EG
YP
T
CU
BA
VE
NE
ZU
ELA
CO
NG
O
LIB
YA
JOR
DA
N
MO
RO
CC
O
MO
LDO
VA
, RE
P.
AZ
ER
BA
IJA
N
SY
RIA
MO
ZA
MB
IQU
E
KA
ZA
KH
STA
N
NIC
AR
AG
UA
KY
RG
YZ
STA
N, R
EP
.
IRA
N
UZ
BE
KIS
TAN
YE
ME
N
BO
SN
IA H
ER
ZE
GO
VIN
A
TAJI
KIS
TAN
MA
UR
ITA
NIA
TUR
KM
EN
ISTA
N
IRA
Q
SIE
RR
A L
EO
NE
GE
OR
GIA
AR
ME
NIA
NA
MIB
IA
11LIVING PLANET REPORT 2002
Map 4:FOREST FOOTPRINT BY COUNTRYGlobal hectares per person, 1999
0.5 and over
0.3 – 0.5
0.2 – 0.3
0.1 – 0.2
less than 0.1
insufficient data

Figure 18:FISHING GROUND FOOTPRINT PERPERSON, by country, 1999
Figure 20:FISHING GROUND FOOTPRINT, by region and income group, 1999
Figure 19:WORLD FISHING GROUND FOOTPRINT, 1961–99
Glo
bal
hec
tare
s p
er p
erso
n
0.4
0
0.3
0.2
0.1
311 387 350 503 323 3 313Population (millions)
774
North AmericaWestern EuropeCentral and Eastern Europe
Middle East and Central AsiaLatin America and the Caribbean
Asia-PacificAfrica
Bill
ion
glob
al h
ecta
res
High incomecountries
Middle incomecountries
Low incomecountries
NO
RW
AY
PO
RTU
GA
L
JAP
AN
NE
W Z
EA
LAN
D
MA
CE
DO
NIA
KO
RE
A, R
EP
.
SP
AIN
UN
ITE
D A
RA
B E
MIR
ATE
S
MA
LAY
SIA
ISR
AE
L
RU
SS
IAN
FE
DE
RA
TIO
N
UN
ITE
D K
ING
DO
M
DE
NM
AR
K
FIN
LAN
D
CH
ILE
FRA
NC
E
SW
ED
EN
UN
ITE
D S
TATE
S O
F A
ME
RIC
A
GA
BO
N
BE
LGIU
M/L
UX
EM
BO
UR
G
NE
THE
RLA
ND
S
PH
ILIP
PIN
ES
MA
UR
ITIU
S
GR
EE
CE
ITA
LY
THA
ILA
ND
ES
TON
IA
AU
STR
ALI
A
PA
PU
A N
EW
GU
INE
A
TRIN
IDA
D A
ND
TO
BA
GO
IRE
LAN
D
LITH
UA
NIA
JAM
AIC
A
NA
MIB
IA
PE
RU
SO
UTH
AFR
ICA
, RE
P.
SR
I LA
NK
A
SE
NE
GA
L
AR
GE
NTI
NA
CA
NA
DA
GE
RM
AN
Y
IND
ON
ES
IA
PO
LAN
D
AU
STR
IA
CO
NG
O
DO
MIN
ICA
N R
EP
.
PA
NA
MA
SW
ITZ
ER
LAN
D
VE
NE
ZU
ELA
UR
UG
UA
Y
KO
RE
A, D
PR
GH
AN
A
CR
OA
TIA
MA
UR
ITA
NIA
CU
BA
GA
MB
IA, T
HE
SLO
VA
KIA
GU
INE
A
HU
NG
AR
Y
LATV
IA
YU
GO
SLA
VIA
, FE
D. R
EP
.
CZ
EC
H R
EP
.
CH
INA
SLO
VE
NIA
CO
LOM
BIA
ME
XIC
O
LEB
AN
ON
MO
RO
CC
O
EC
UA
DO
R
IRA
N
TOG
O
SA
UD
I AR
AB
IA
0
1.8
0.4
0.2
0.8
1.2
1.0
1.4
1.6
0.6
Glo
bal
hec
tare
s p
er p
erso
n
1960 1965 1970 1975 1980 1985 1990 20001995
1.0
0
0.4
0.6
0.8
0.2
12
The fishing ground footprint of a country isthe area required to produce the fish andseafood products that country consumes.This includes all the marine and freshwaterfish, crustaceans (such as shrimp), andcephalopods (such as squid), as well as allfishmeal and oils that are fed to animals andfarmed fish. It also includes an additionalcomponent in most countries – roughly 40 per cent – to allow for bycatch, which is generally discarded back to the sea.
Not all fish species are equal in terms of their requirements for biological
productivity. A kilogram of fish which liveshigh up the food chain, such as cod, ontrophic level four, will have a footprint tentimes larger than a kilogram of fish one levelbelow, such as herring, on trophic levelthree, because the production of a kilogramof cod requires ten times as much of theocean’s primary production. Consequently, acountry’s fishing ground footprint takesaccount of the kinds of fish, as well as thequantity, it consumes.
World average fish consumption in 1999was about 22 kilograms per person per year,
which equates to a footprint of 0.14 globalhectares per person. The average biologicalproductive capacity of the seas, which wasalso about 0.14 global hectares per person, iscalculated by dividing the world’s estimatedsustainable yield of fish by the productivesea area, which primarily consists of thecontinental shelves.
Figure 18: The fishing ground footprint perperson for all countries with populationsabove 1 million: many island nations withsmall populations would show large fishing
ground footprints per person, but are notincluded here.
Figure 19: The global fishing ground footprintgrew rapidly, by 2.6 per cent per year onaverage, between 1961 and 1999.
Figure 20: While seafood provides theprimary source of protein for many peopleliving in the world’s poorest coastal regions,there is, on average, a 14-fold difference infish and seafood consumption per personbetween high and low income countries.
F I S H I N G G R O U N D F O O T P R I N T
LIVING PLANET REPORT 2002

Existing fishing ground area per person
TUN
ISIA
LIB
YA
KU
WA
IT
MY
AN
MA
R
YE
ME
N
BR
AZ
IL
CÔ
TE D
'IVO
IRE
TUR
KE
Y
SIE
RR
A L
EO
NE
VIE
T N
AM
MA
DA
GA
SC
AR
CO
STA
RIC
A
UK
RA
INE
BE
NIN
EG
YP
T
CA
ME
RO
ON
TAN
ZA
NIA
, UN
ITE
D R
EP
.
AN
GO
LA
CH
AD
BA
NG
LAD
ES
H
NIG
ER
IA
LIB
ER
IA
CO
NG
O, D
EM
. RE
P.
HO
ND
UR
AS
RO
MA
NIA
BO
TSW
AN
A
GU
INE
A-B
ISS
AU
CA
MB
OD
IA
JOR
DA
N
BU
LGA
RIA
IND
IA
ZA
MB
IA
PA
KIS
TAN
LAO
PD
R
MA
LI
PA
RA
GU
AY
EL
SA
LVA
DO
R
IRA
Q
UG
AN
DA
MO
ZA
MB
IQU
E
SY
RIA
ALG
ER
IA
MA
LAW
I
HA
ITI
BO
LIV
IA
ZIM
BA
BW
E
GU
ATE
MA
LA
ALB
AN
IA
BO
SN
IA H
ER
ZE
GO
VIN
A
CE
NTR
AL
AFR
ICA
N R
EP
.
KE
NY
A
BU
RU
ND
I
GE
OR
GIA
NIC
AR
AG
UA
BE
LAR
US
KA
ZA
KH
STA
N
TUR
KM
EN
ISTA
N
BU
RK
INA
FA
SO
SO
MA
LIA
SU
DA
N
MO
LDO
VA
, RE
P.
ER
ITR
EA
AZ
ER
BA
IJA
N
NIG
ER
KY
RG
YZ
STA
N, R
EP
.
NE
PA
L
RW
AN
DA
AR
ME
NIA
UZ
BE
KIS
TAN
MO
NG
OLI
A
TAJI
KIS
TAN
ETH
IOP
IA
LES
OTH
O
AFG
HA
NIS
TAN
LIVING PLANET REPORT 2002
Map 5:FISHING GROUND FOOTPRINT BY COUNTRYGlobal hectares per person, 1999
0.30 and over
0.20 – 0.30
0.10 – 0.20
0.03 – 0.10
less than 0.03
insufficient data
13

Figure 21:ENERGY FOOTPRINT PERPERSON, by country, 1999
Figure 23:ENERGY FOOTPRINT, by region and income group, 1999
Figure 22:WORLD ENERGY FOOTPRINT, 1961–99
Glo
bal
hec
tare
s p
er p
erso
n
6
0
5
3
2
4
1
311 387 350 503 323 3 313Population (millions)
774
North AmericaWestern EuropeCentral and Eastern Europe
Middle East and Central AsiaLatin America and the Caribbean
Asia-PacificAfrica
Bill
ion
glob
al h
ecta
res
High incomecountries
Middle incomecountriesLow incomecountries
UN
ITE
D A
RA
B E
MIR
ATE
S
KU
WA
IT
UN
ITE
D S
TATE
S O
F A
ME
RIC
A
CA
NA
DA
BE
LGIU
M/L
UX
EM
BO
UR
G
AU
STR
ALI
A
FIN
LAN
D
DE
NM
AR
K
UN
ITE
D K
ING
DO
M
SW
ED
EN
NO
RW
AY
CZ
EC
H R
EP
.
GE
RM
AN
Y
JAP
AN
FRA
NC
E
GR
EE
CE
ES
TON
IA
NE
THE
RLA
ND
S
SA
UD
I AR
AB
IA
AU
STR
IA
IRE
LAN
D
ISR
AE
L
RU
SS
IAN
FE
DE
RA
TIO
N
KO
RE
A, D
PR
SO
UTH
AFR
ICA
, RE
P.
TRIN
IDA
D A
ND
TO
BA
GO
UK
RA
INE
SW
ITZ
ER
LAN
D
SLO
VA
KIA
ITA
LY
SP
AIN
PO
LAN
D
SLO
VE
NIA
LIB
YA
TUR
KM
EN
ISTA
N
NE
W Z
EA
LAN
D
KO
RE
A, R
EP
.
KA
ZA
KH
STA
N
HU
NG
AR
Y
PO
RTU
GA
L
MA
LAY
SIA
RO
MA
NIA
BE
LAR
US
MA
CE
DO
NIA
VE
NE
ZU
ELA
LEB
AN
ON
UZ
BE
KIS
TAN
ME
XIC
O
CR
OA
TIA
AZ
ER
BA
IJA
N
BU
LGA
RIA
JAM
AIC
A
LATV
IA
IRA
N
YU
GO
SLA
VIA
, FE
D. R
EP
.
LITH
UA
NIA
IRA
Q
AR
GE
NTI
NA
CH
ILE
SY
RIA
BO
TSW
AN
A
MO
NG
OLI
A
JOR
DA
N
TUR
KE
Y
GA
BO
N
THA
ILA
ND
UR
UG
UA
Y
CH
INA
CU
BA
ALG
ER
IA
ZIM
BA
BW
E
DO
MIN
ICA
N R
EP
.0
8
2
1
3
5
4
6
7
Glo
bal
hec
tare
s p
er p
erso
n
1960 1965 1970 1975 1980 1985 1990 20001995
7
0
3
6
5
4
1
2
14
A country’s energy footprint represents the area required to sustain its energyconsumption. It encompasses four types ofenergy: fossil fuels (coal, oil, and naturalgas), biomass (fuelwood and charcoal),nuclear, and hydro.
The footprint of fossil fuel combustion is calculated as the area of forest that wouldbe required to absorb the resulting carbondioxide (CO2) emissions, excluding theproportion that is absorbed by the oceans.The footprint of biomass fuel is calculated as the area of forest needed to grow the
biomass. These two calculations result inapproximately the same area requirement perunit of energy consumed.
Nuclear power is included in the energyfootprint, and counted as being equivalent tofossil fuel per unit of energy, even thoughnuclear power stations do not produce CO2.Excluding nuclear power would reduce theworld energy footprint by less than 4 percent. The footprint of hydropower is the area occupied by hydroelectric dams andreservoirs.
National and regional energy footprints
are adjusted for the energy embodied intraded goods. This means that the energyused to make a product manufactured in one country but consumed in another issubtracted from the footprint of theproducer-country and added to that of theconsumer-country.
Figure 21: National energy footprint perperson (see Table 2 for the four separateelements).
Figure 22: The energy footprint was the
fastest growing component of the globalecological footprint between 1961 and 1999,increasing at an average rate of more than 2.6per cent per year.
Figure 23: Of all the components of theecological footprint, the energy footprint perperson shows the greatest disparity betweenrich and poor, with a 16-fold differencebetween high and low income countries.
E N E R G Y F O O T P R I N T
LIVING PLANET REPORT 2002

BR
AZ
IL
MO
LDO
VA
, RE
P.
TUN
ISIA
PA
NA
MA
EG
YP
T
GU
ATE
MA
LA
CO
STA
RIC
A
EC
UA
DO
R
CO
LOM
BIA
IND
ON
ES
IA
BO
SN
IA H
ER
ZE
GO
VIN
A
HO
ND
UR
AS
EL
SA
LVA
DO
R
CO
NG
O
MA
UR
ITIU
S
BO
LIV
IA
PH
ILIP
PIN
ES
PA
RA
GU
AY
MA
UR
ITA
NIA
NIC
AR
AG
UA
PA
PU
A N
EW
GU
INE
A
GE
OR
GIA
KY
RG
YZ
STA
N, R
EP
.
IND
IA
MO
RO
CC
O
TAJI
KIS
TAN
AR
ME
NIA
NIG
ER
IA
GU
INE
A
SR
I LA
NK
A
GH
AN
A
NA
MIB
IA
BE
NIN
KE
NY
A
TAN
ZA
NIA
, UN
ITE
D R
EP
.
ZA
MB
IA
RW
AN
DA
LIB
ER
IA
PA
KIS
TAN
HA
ITI
CA
ME
RO
ON
NE
PA
L
AN
GO
LA
CÔ
TE D
'IVO
IRE
BU
RK
INA
FA
SO
VIE
T N
AM
PE
RU
ALB
AN
IA
SE
NE
GA
L
CO
NG
O, D
EM
. RE
P.
MA
LAW
I
MO
ZA
MB
IQU
E
SIE
RR
A L
EO
NE
ER
ITR
EA
YE
ME
N
ETH
IOP
IA
LAO
PD
R
CE
NTR
AL
AFR
ICA
N R
EP
.
SO
MA
LIA
GA
MB
IA, T
HE
NIG
ER
MA
DA
GA
SC
AR
CA
MB
OD
IA
LES
OTH
O
MY
AN
MA
R
UG
AN
DA
MA
LI
GU
INE
A-B
ISS
AU
BA
NG
LAD
ES
H
TOG
O
SU
DA
N
AFG
HA
NIS
TAN
BU
RU
ND
I
CH
AD
LIVING PLANET REPORT 2002
Map 6: ENERGY FOOTPRINT BY COUNTRYGlobal hectares per person, 1999
3.0 and over
2.0 – 3.0
1.0 – 2.0
0.3 – 1.0
less than 0.3
insufficient data
15

Figure 24:WATER WITHDRAWALS PERPERSON, by country, 2000 (estimate)
Figure 26:WATER WITHDRAWALS, by region and income group, 2000 (estimate)
Figure 25:WORLD WATER WITHDRAWALS, 1960–2000 (estimate)
Thou
sand
m3
per
per
son
per
yea
r
1.8
0
1.4
1.0
0.4
311 387 350 503 323 3 313Population (millions)
774
North AmericaWestern EuropeCentral and Eastern Europe
Middle East and Central AsiaLatin America and the Caribbean
Asia/PacificAfrica
High incomecountries
Middle incomecountriesLow incomecountries
TUR
KM
EN
ISTA
N
UZ
BE
KIS
TAN
KY
RG
YZ
STA
N, R
EP
.
AZ
ER
BA
IJA
N
KA
ZA
KH
STA
N
TAJI
KIS
TAN
IRA
Q
UN
ITE
D S
TATE
S O
F A
ME
RIC
A
BU
LGA
RIA
CO
STA
RIC
A
CA
NA
DA
EC
UA
DO
R
CH
ILE
NE
PA
L
RO
MA
NIA
AFG
HA
NIS
TAN
PA
KIS
TAN
ITA
LY
DO
MIN
ICA
N R
EP
.
AU
STR
ALI
A
MA
DA
GA
SC
AR
IRA
N
SY
RIA
UN
ITE
D A
RA
B E
MIR
ATE
S
BE
LGIU
M/L
UX
EM
BO
UR
G
SP
AIN
EG
YP
T
AR
ME
NIA
ME
XIC
O
SA
UD
I AR
AB
IA
AR
GE
NTI
NA
PO
RTU
GA
L
PE
RU
PH
ILIP
PIN
ES
JAP
AN
LIB
YA
GE
RM
AN
Y
HU
NG
AR
Y
VIE
T N
AM
MO
LDO
VA
, RE
P.
GE
OR
GIA
MA
UR
ITA
NIA
SU
DA
N
KO
RE
A, D
PR
FRA
NC
E
PA
NA
MA
MA
LAY
SIA
GR
EE
CE
THA
ILA
ND
NE
W Z
EA
LAN
D
RU
SS
IAN
FE
DE
RA
TIO
N
MA
UR
ITIU
S
SR
I LA
NK
A
UK
RA
INE
KO
RE
A, R
EP
.
IND
IA
NE
THE
RLA
ND
S
TUR
KE
Y
FIN
LAN
D
CU
BA
NO
RW
AY
CH
INA
LEB
AN
ON
MO
RO
CC
O
YU
GO
SLA
VIA
, FE
D. R
EP
.
SW
ITZ
ER
LAN
D
IND
ON
ES
IA
JAM
AIC
A
IRE
LAN
D
SW
ED
EN
SLO
VA
KIA
BR
AZ
IL
0
3.0
5 30
9
5.0
1.5
1.0
2.5
2.0
Thou
sand
m3
per
per
son
per
yea
r
1960 1965 1970 1975 1980 1985 1990 20001995
4
0
2
3
1
Thou
sand
km
3 p
er y
ear
0.2
0.6
0.8
1.2
1.6
16
Only 2.5 per cent of the world’s 1.4 billioncubic kilometres of water is freshwater, and70 per cent of it is locked up in polar icecaps.The Earth’s hydrological cycle constantlyreplenishes the freshwater supply, but lessthan 1 per cent of the world’s freshwater isavailable as a renewable resource. Sincemuch of that is geographically inaccessible,or not accessible throughout the year, it isestimated that more than half of what isactually available is used by humanity.
Natural ecosystems, especially wetlandsand forests, capture water and stabilize
seasonal flows, while recharginggroundwater and improving water quality.Conserving these ecosystems is vital tomaintaining the supply of renewablefreshwater, yet half the world’s wetlandswere lost to development over the lastcentury. Pollution from agriculture,industrial and municipal sewage, andsalinization from irrigation have alsoreduced the availability of clean freshwater.About 1.2 billion people, a fifth of theworld’s population, do not have access toclean drinking water.
Water withdrawal measures the quantityof water taken from a source such as a riveror lake, and used for agricultural, industrial,or domestic purposes. The water is notnecessarily consumed, as it may be returnedafter it has been used, although with areduction in its quality. Withdrawal does notinclude the use of rainfall in agriculture.
Figure 24: The high level of water use inCentral Asian countries, where freshwaterresources are scarce, is mainly due to large-scale irrigation of crops, particularly cotton.
Figure 25: Global water use doubled between1960 and 2000, in line with world population.
Figure 26: World average water use is about550 cubic metres per person per year,including water used in agriculture andindustry, which compares with over 1 000cubic metres per person per year in theMiddle East and Central Asia and over 1 600cubic metres per person per year in NorthAmerica. High income countries used twice as much water per person as low incomecountries, on average.
W A T E R W I T H D R A W A L S
LIVING PLANET REPORT 2002

PO
LAN
D
TUN
ISIA
AU
STR
IA
SO
UTH
AFR
ICA
, RE
P.
ISR
AE
L
NIC
AR
AG
UA
KU
WA
IT
CZ
EC
H R
EP
.
BE
LAR
US
HO
ND
UR
AS
CO
LOM
BIA
TRIN
IDA
D A
ND
TO
BA
GO
UN
ITE
D K
ING
DO
M
UR
UG
UA
Y
DE
NM
AR
K
ZA
MB
IA
LAO
PD
R
VE
NE
ZU
ELA
YE
ME
N
MO
NG
OLI
A
JOR
DA
N
BO
LIV
IA
NA
MIB
IA
SE
NE
GA
L
ALG
ER
IA
HA
ITI
LATV
IA
EL
SA
LVA
DO
R
BA
NG
LAD
ES
H
ES
TON
IA
MA
LI
RW
AN
DA
ZIM
BA
BW
E
GU
ATE
MA
LA
GU
INE
A
MA
LAW
I
MY
AN
MA
R
PA
RA
GU
AY
SIE
RR
A L
EO
NE
SO
MA
LIA
BO
TSW
AN
A
LITH
UA
NIA
KE
NY
A
ALB
AN
IA
GA
BO
N
CÔ
TE D
'IVO
IRE
CA
MB
OD
IA
NIG
ER
LIB
ER
IA
AN
GO
LA
TAN
ZA
NIA
, UN
ITE
D R
EP
.
ETH
IOP
IA
BU
RK
INA
FA
SO
MO
ZA
MB
IQU
E
NIG
ER
IA
CA
ME
RO
ON
CH
AD
BE
NIN
LES
OTH
O
PA
PU
A N
EW
GU
INE
A
TOG
O
CE
NTR
AL
AFR
ICA
N R
EP
.
GA
MB
IA, T
HE
GH
AN
A
BU
RU
ND
I
GU
INE
A-B
ISS
AU
CO
NG
O
UG
AN
DA
CO
NG
O, D
EM
. RE
P.
SLO
VE
NIA
Bos
nia
Her
zego
vina
Cro
atia
Mac
edon
ia
Erit
rea
incl
uded
in Y
ugos
lavi
a, F
R
incl
uded
in Y
ugos
lavi
a, F
R
incl
uded
in Y
ugos
lavi
a, F
R
incl
uded
in E
thio
pia
LIVING PLANET REPORT 2002
Map 7:FRESHWATER WITHDRAWALS BY COUNTRY Cubic metres per person per year, 2000 (estimate)
800 and over
500 – 800
200 – 500
50 – 200
less than 50
insufficient data
Source: National and regional water withdrawals estimates come from Gleick, P.H.2002. The World's Water 2002-2003. Island Press, Washington, DC.
17
18
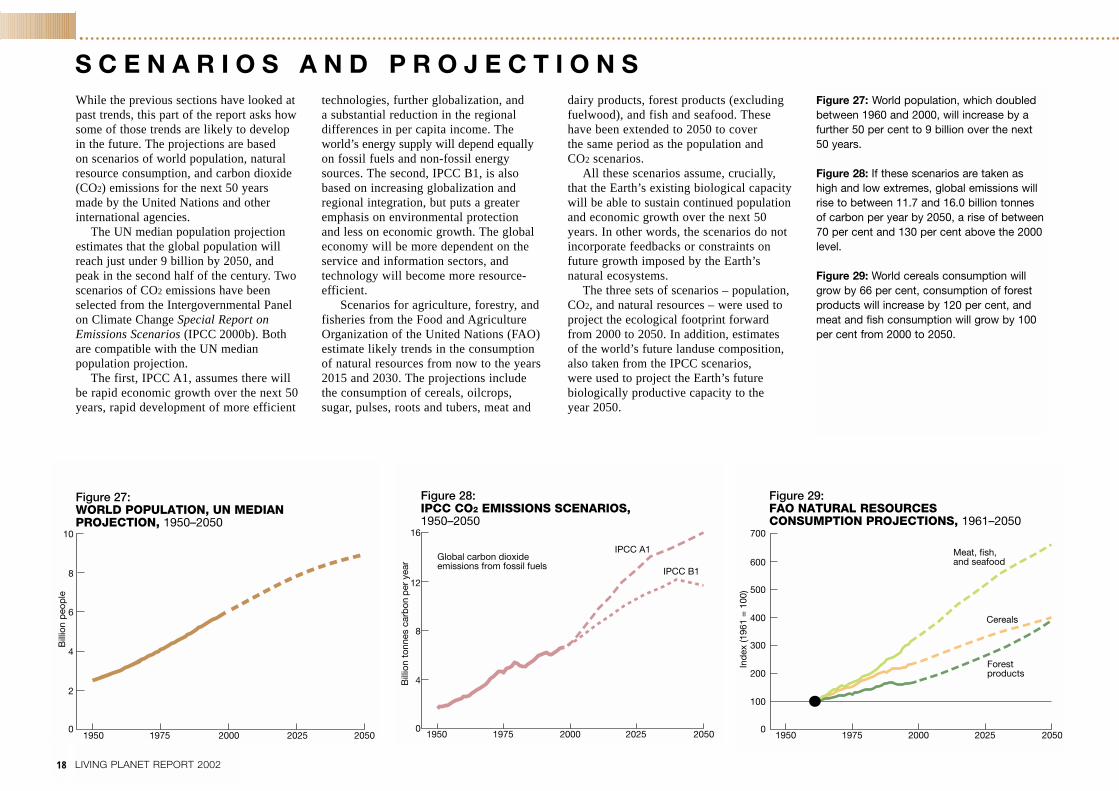
While the previous sections have looked atpast trends, this part of the report asks howsome of those trends are likely to develop in the future. The projections are based on scenarios of world population, naturalresource consumption, and carbon dioxide(CO2) emissions for the next 50 years made by the United Nations and otherinternational agencies.
The UN median population projectionestimates that the global population willreach just under 9 billion by 2050, and peak in the second half of the century. Twoscenarios of CO2 emissions have beenselected from the Intergovernmental Panelon Climate Change Special Report onEmissions Scenarios (IPCC 2000b). Both are compatible with the UN medianpopulation projection.
The first, IPCC A1, assumes there will be rapid economic growth over the next 50years, rapid development of more efficient
technologies, further globalization, and a substantial reduction in the regionaldifferences in per capita income. The world’s energy supply will depend equallyon fossil fuels and non-fossil energysources. The second, IPCC B1, is alsobased on increasing globalization andregional integration, but puts a greateremphasis on environmental protection and less on economic growth. The globaleconomy will be more dependent on theservice and information sectors, andtechnology will become more resource-efficient.
Scenarios for agriculture, forestry, andfisheries from the Food and AgricultureOrganization of the United Nations (FAO)estimate likely trends in the consumption of natural resources from now to the years2015 and 2030. The projections includethe consumption of cereals, oilcrops,sugar, pulses, roots and tubers, meat and
dairy products, forest products (excludingfuelwood), and fish and seafood. These have been extended to 2050 to cover the same period as the population and CO2 scenarios.
All these scenarios assume, crucially, that the Earth’s existing biological capacitywill be able to sustain continued populationand economic growth over the next 50years. In other words, the scenarios do notincorporate feedbacks or constraints onfuture growth imposed by the Earth’snatural ecosystems.
The three sets of scenarios – population,CO2, and natural resources – were used toproject the ecological footprint forwardfrom 2000 to 2050. In addition, estimatesof the world’s future landuse composition,also taken from the IPCC scenarios, were used to project the Earth’s futurebiologically productive capacity to the year 2050.
Figure 27: World population, which doubledbetween 1960 and 2000, will increase by afurther 50 per cent to 9 billion over the next50 years.
Figure 28: If these scenarios are taken ashigh and low extremes, global emissions willrise to between 11.7 and 16.0 billion tonnesof carbon per year by 2050, a rise of between70 per cent and 130 per cent above the 2000level.
Figure 29: World cereals consumption willgrow by 66 per cent, consumption of forestproducts will increase by 120 per cent, andmeat and fish consumption will grow by 100per cent from 2000 to 2050.
S C E N A R I O S A N D P R O J E C T I O N S
LIVING PLANET REPORT 2002
1975 2000 2025 20501950
Figure 27:WORLD POPULATION, UN MEDIAN PROJECTION, 1950–2050
2
4
8
10
6
0
Bill
ion
peo
ple
1975 2000 2025 20501950
Figure 28:IPCC CO2 EMISSIONS SCENARIOS,1950–2050
4
12
16
8
0
Global carbon dioxide emissions from fossil fuels
IPCC A1
IPCC B1
Bill
ion
tonn
es c
arb
on p
er y
ear
1975 2000 2025 20501950
Figure 29:FAO NATURAL RESOURCESCONSUMPTION PROJECTIONS, 1961–2050
100
400
200
600
500
700
300
0
Meat, fish,and seafood
Cereals
Forestproducts
Ind
ex (1
961
= 1
00)

19LIVING PLANET REPORT 2002
Ecological footprint and human welfareBased on the UN, IPCC, and FAO referencescenarios, which assume slowed populationgrowth, steady economic development, andmore resource-efficient technologies, theworld’s ecological footprint will continue togrow between 2000 and 2050 from a level 20 per cent above the Earth’s biologicalcapacity to a level between 80 and 120 percent above it (Figure 30). In these scenarios, 9 billion people in 2050 would requirebetween 1.8 and 2.2 Earth-sized planets inorder to sustain their consumption of crops,meat, fish, and wood, and to hold CO2 levelsconstant in the atmosphere.
For this projection to become reality, thelimited capacity of global ecosystems mustprove capable of supporting the additionalload. The ecological footprint projection,however, merely documents the demands of human consumption in comparison withthe biologically productive capacity of the
planet; it does not imply whether such afuture is possible.
The World3 computer model wasdeveloped to explore what may happen whenthe human footprint exceeds global capacity(see Meadows et al. 1992). World3 simulatestrends using over 350 variables whichdescribe the global system, and incorporatesfeedbacks between ecosystems, population,and economic growth. In order to simplifycomparison of the model results with thereference scenarios, the results weresummarized as two indicators: the humanecological footprint (HEF) and an index ofhuman welfare (HWI). The model variableHEF is an approximation of the ecologicalfootprint based on three components:agricultural land, urban-industrial land, andCO2 absorption land. The model variableHWI is an approximation of the UN’s humandevelopment index, based on three measuresof development: average life expectancy,
educational level, and world economicproduct.
Two World3 scenarios were chosen: astandard scenario, which assumes no policychanges over the next 50 years; and anaccelerated technology scenario, whichassumes significant improvements in resourceefficiency. In the standard scenario, the HEFgrows and peaks around 2040 at about 150per cent above the Earth’s biological capacity,while the HWI climbs to around 20 per centabove the 2000 level in 2030 but then fallsaway rapidly, as the Earth’s productiveecosystems are no longer able to sustain high levels of human consumption. In theaccelerated technology scenario the HEFreaches a maximum of 60 per cent abovebiological capacity in 2020 and then declinesback to the 2000 level by 2050, as moreresource-efficient technologies reduce thefootprint, while the HWI climbs and remainsat almost 20 per cent above 2000 levels.
These scenarios are not intended to beforecasts, but maps of possible futures to guidepolicy choices.
Figure 30: Humanity’s use of biologicalresources is projected to increase from 20 percent above the Earth’s biological capacity in2000 to between 80 and 120 per cent abovebiocapacity in 2050.
Figure 31: The HEF increases between 2000and 2050 to around 150 per cent above theEarth’s biological capacity in the standardscenario, whereas it returns to about 20 per centabove biological capacity by 2050 in theaccelerated technology scenario.
Figure 32: The HWI grows to about 20 per centabove the 2000 level in both scenarios, butwhile it remains there in the acceleratedtechnology scenario it falls below the 2000 levelby 2050 in the standard scenario.
Num
ber
of p
lane
ts
UN/FAO/IPCC A1
UN/FAO/IPCC A2
1975 2000 2025 20501950
Figure 30:GLOBAL ECOLOGICAL FOOTPRINT, 1961–2050
0.5
1.0
2.0
2.5
1.5
0
Standardscenario
Acceleratedtechnologyscenario
Figure 31:WORLD3 HEF (HUMAN ECOLOGICALFOOTPRINT), 1950–2050
Num
ber
of p
lane
ts
0.5
1.0
2.5
1.5
2.0
01975 2000 2025 20501950 1975 2000 2025 20501950
Figure 32:WORLD3 HWI (HUMAN WELFAREINDEX), 1950–2050
0.2
0.4
0.6
1.2
1.0
1.4
0.8
0
Standardscenario
Acceleratedtechnology
scenario
Ind
ex (2
000
= 1
)

20
The scenarios show that, to be sustainable,humanity’s consumption of renewablenatural resources must stay within the limitsof the Earth’s biological capacity over thelong term. Ecological footprint analysisindicates the level of ecological deficitreduction that is needed, but not whatactions to take.
Three factors determine the size of the ecological footprint: the efficiency of the production systems used to harvestrenewable resources and deliver goods and services to consumers, the level ofconsumption per person, and the number of consumers. In addition, the Earth’sbiological capacity is determined by thehealth of ecosystems, which can beimproved and maintained through goodmanagement and conservation.
Using the range of economic andregulatory instruments available, governmentpolicies can reduce the ecological deficit byaddressing four issues (see Figure 33):
1. Production: improve the resource-efficiency with which goods and services areproduced.
2. Consumption: consume resources moreefficiently and redress the disparity inconsumption per person between high andlow income countries.3. Population: control population size. 4. Ecosystems: protect, conserve, and restorenatural ecosystems and biodiversity tomaintain biological productivity andecological services.
1. Promote resource-efficient productionsystems• rapidly move energy supply away from
fossil fuels towards renewable sources andpromote energy-efficient technologies,buildings, cities, and transport systems
• switch subsidies from production-basedincentives that support wasteful ordestructive agricultural, forestry, fishery, orenergy systems to incentives thatencourage long-term sustainability
• use the tax system to internalize theenvironmental costs of production andrecycle the revenues into subsidies thatencourage sustainable production systems
• transfer technology and build capacity toenable developing countries to leapfrog
directly to resource-efficient andsustainable production systems.
2. Encourage equitable and sustainableconsumption• promote markets for sustainably produced
goods and services by implementingstringent environmental standards andcertification for food, materials, andenergy
• ensure the polluter pays the fullenvironmental costs of food, materials,water, and energy, whilst ensuring accessto basic resources for all
• establish international trade agreementsthat give fair access to markets in high income countries and discourage low income countries from externalizingtheir environmental production costs
• minimize consumer waste and recyclerecoverable resources from the wastestream.
3. Promote education and health care tocontrol human population • provide universal primary education for
boys and girls
• create better access to secondaryeducation and economic opportunitiesfor women
• reduce child mortality and prevalence ofwidespread communicable diseases
• provide adequate health care and birthcontrol facilities for all, particularly in lowincome countries.
4. Conserve natural and managedecosystems and maintain ecologicalservices• establish and maintain networks of
protected areas covering all terrestrial,freshwater, and marine ecosystem types,including no-fishing zones, and restoredegraded ecosystems
• protect soil from erosion and degradationcaused by intensive agriculture orovergrazing, and preserve existingcropland for agriculture rather than urbanand industrial development
• protect river basins, wetlands, andwatershed ecosystems to sustainfreshwater supply
• eliminate the use of toxic chemicals thatdegrade ecosystem functioning.
P O L I C Y O P T I O N S
ELIMINATE
ECOLOGICAL
DEFICIT
REDUCE
ECOLOGICAL
FOOTPRINT
MAINTAIN
BIOLOGICAL
CAPACITY
Figure 33: POLICIES FOR ELIMINATING THE ECOLOGICAL DEFICIT
LIVING PLANET REPORT 2002
• Protect,manage, and
restore ecosystems
• Improve production systems
• Changeconsumption
patterns
• Control population

21LIVING PLANET REPORT 2002
Table 1: T H E L I V I N G P L A N E T T H R O U G H T I M E
Global Total Cropland Grazing Forest Fishing Total Built-up Biocapacity World Water* Living Forest Freshwater Marinepopulation ecological footprint land footprint ground energy land ecological withdrawals Planet species species species
See notes footprint footprint (ex. fuelwood) footprint footprint footprint Index population population populationon pages (billion (billion (billion (billion (billion (billion (billion (billion (number (thousand index index index28/29 (billion) global ha) global ha) global ha) global ha) global ha) global ha) global ha) global ha) of planets) km3/year)
1960 1.991961 3.08 7.47 2.89 0.41 1.03 0.31 2.51 0.32 10.90 0.69 2.041962 3.14 7.62 2.90 0.43 1.04 0.33 2.60 0.32 10.91 0.70 2.091963 3.20 7.81 2.91 0.44 1.06 0.35 2.74 0.33 10.92 0.72 2.151964 3.27 8.04 2.92 0.45 1.10 0.36 2.88 0.33 10.93 0.74 2.201965 3.34 8.24 2.92 0.46 1.12 0.39 3.01 0.34 10.94 0.75 2.261966 3.41 8.47 2.93 0.47 1.15 0.41 3.16 0.35 10.95 0.77 2.321967 3.48 8.65 2.93 0.49 1.17 0.45 3.25 0.36 10.97 0.79 2.381968 3.55 8.92 2.96 0.51 1.18 0.50 3.41 0.36 10.98 0.81 2.441969 3.62 9.19 2.98 0.52 1.20 0.52 3.60 0.37 11.00 0.84 2.511970 3.70 9.50 2.99 0.52 1.23 0.54 3.84 0.38 11.00 0.86 2.57 1.00 1.00 1.00 1.001971 3.77 9.70 2.98 0.52 1.25 0.56 3.99 0.39 11.01 0.88 2.631972 3.85 9.94 2.99 0.53 1.26 0.62 4.15 0.39 11.02 0.90 2.691973 3.92 10.24 3.00 0.53 1.30 0.63 4.38 0.40 11.04 0.93 2.751974 4.00 10.32 3.01 0.55 1.31 0.63 4.40 0.41 11.05 0.93 2.811975 4.07 10.32 3.02 0.57 1.28 0.64 4.40 0.42 11.06 0.93 2.87 0.97 0.97 0.98 0.951976 4.15 10.66 3.03 0.60 1.33 0.64 4.65 0.42 11.05 0.97 2.931977 4.22 10.82 3.04 0.60 1.34 0.62 4.79 0.43 11.05 0.98 3.001978 4.29 10.96 3.05 0.61 1.38 0.62 4.86 0.44 11.06 0.99 3.061979 4.37 11.28 3.07 0.60 1.42 0.62 5.12 0.45 11.07 1.02 3.131980 4.44 11.25 3.08 0.60 1.43 0.61 5.08 0.46 11.13 1.01 3.20 0.96 1.06 0.90 0.941981 4.52 11.14 3.09 0.60 1.42 0.62 4.96 0.46 11.13 1.00 3.241982 4.59 11.16 3.10 0.61 1.41 0.64 4.94 0.47 11.14 1.00 3.271983 4.67 11.27 3.11 0.62 1.46 0.64 4.95 0.48 11.15 1.01 3.311984 4.75 11.61 3.13 0.63 1.52 0.69 5.15 0.48 11.18 1.04 3.351985 4.84 11.87 3.12 0.65 1.54 0.71 5.36 0.49 11.21 1.06 3.38 0.86 0.97 0.77 0.861986 4.92 12.15 3.14 0.67 1.59 0.73 5.53 0.50 11.27 1.08 3.421987 5.01 12.39 3.15 0.67 1.63 0.76 5.67 0.51 11.29 1.10 3.461988 5.10 12.68 3.16 0.67 1.65 0.77 5.91 0.52 11.32 1.12 3.501989 5.18 12.86 3.17 0.68 1.68 0.79 6.02 0.53 11.34 1.14 3.541990 5.27 12.93 3.18 0.69 1.68 0.77 6.08 0.54 11.38 1.14 3.58 0.81 0.98 0.71 0.761991 5.35 12.93 3.17 0.69 1.59 0.75 6.19 0.55 11.37 1.14 3.621992 5.43 12.84 3.15 0.68 1.55 0.75 6.16 0.55 11.38 1.13 3.651993 5.51 12.84 3.15 0.69 1.54 0.73 6.17 0.55 11.40 1.13 3.691994 5.59 13.03 3.16 0.70 1.56 0.75 6.30 0.56 11.40 1.14 3.721995 5.67 13.26 3.16 0.70 1.58 0.79 6.46 0.57 11.39 1.16 3.76 0.71 0.90 0.57 0.691996 5.74 13.44 3.16 0.71 1.58 0.80 6.61 0.58 11.39 1.18 3.801997 5.82 13.59 3.16 0.72 1.62 0.80 6.70 0.58 11.38 1.19 3.831998 5.90 13.59 3.16 0.72 1.60 0.83 6.69 0.59 11.38 1.20 3.871999 5.98 13.65 3.14 0.73 1.63 0.82 6.72 0.60 11.36 1.20 3.902000 3.94 0.63 0.85 0.46 0.65

Table 2: E C O L O G I C A L F O O T P R I N T A N D B I O C A PA C I T Y
WORLD 5 978.7 2.28 0.53 0.12 0.27 0.14 1.12 0.99 0.06 0.08 0.00 0.10
High income countries 906.5 6.48 1.04 0.23 0.70 0.41 3.86 3.40 0.03 0.42 0.01 0.25 Middle income countries 2 941.0 1.99 0.49 0.13 0.20 0.13 0.94 0.86 0.06 0.02 0.00 0.09 Low income countries 2 114.2 0.83 0.30 0.03 0.16 0.03 0.25 0.17 0.08 0.00 0.00 0.06
AFRICA 774.3 1.36 0.40 0.17 0.23 0.05 0.39 0.27 0.11 0.01 0.00 0.12 Algeria 29.8 1.55 0.60 0.16 0.07 0.02 0.65 0.63 0.01 0.00 0.00 0.06 Angola 12.8 0.87 0.27 0.13 0.20 0.04 0.20 0.11 0.08 0.00 0.00 0.03 Benin 6.1 1.15 0.39 0.03 0.35 0.05 0.24 0.06 0.17 0.00 0.00 0.09 Botswana 1.5 1.48 0.39 0.41 0.41 0.03 0.18 .id 0.18 0.00 0.00 0.07 Burkina Faso 11.2 1.18 0.40 0.13 0.35 0.01 0.19 0.03 0.16 0.00 0.00 0.11 Burundi 6.3 0.48 0.23 0.03 0.10 0.01 0.05 0.01 0.04 0.00 0.00 0.05 Cameroon 14.6 1.11 0.66 0.04 0.06 0.04 0.20 0.05 0.15 0.00 0.00 0.10 Central African Rep. 3.6 1.25 0.67 0.26 0.08 0.01 0.15 0.02 0.14 0.00 0.00 0.08 Chad 7.6 1.02 0.49 0.27 0.11 0.04 0.03 0.01 0.03 0.00 0.00 0.07 Congo 2.9 0.92 0.21 0.02 0.06 0.18 0.35 0.19 0.16 0.00 0.00 0.10 Congo, Dem. Rep. 49.6 0.80 0.17 0.01 0.33 0.04 0.18 0.02 0.17 0.00 0.00 0.07 Côte d'Ivoire 15.7 0.92 0.38 0.04 0.12 0.07 0.19 0.07 0.13 0.00 0.00 0.10 Egypt 66.7 1.49 0.43 0.02 0.06 0.05 0.48 0.47 0.01 0.00 0.00 0.46 Eritrea 3.5 0.79 0.22 0.10 0.22 0.00 0.16 0.05 0.11 0.00 0.00 0.08 Ethiopia 64.9 0.78 0.22 0.02 0.31 0.00 0.16 0.01 0.14 0.00 0.00 0.08 Gabon 1.2 2.12 0.69 0.04 0.25 0.31 0.76 0.37 0.39 0.00 0.00 0.06 Gambia, The 1.3 1.00 0.44 0.05 0.16 0.12 0.15 0.07 0.07 0.00 0.00 0.08 Ghana 18.9 1.07 0.32 0.02 0.23 0.15 0.24 0.05 0.19 0.00 0.00 0.10 Guinea 8.0 1.21 0.29 0.05 0.43 0.11 0.25 0.05 0.19 0.00 0.00 0.09 Guinea-Bissau 1.2 0.70 0.30 0.03 0.17 0.03 0.11 0.05 0.06 0.00 0.00 0.05 Kenya 30.0 1.09 0.19 0.21 0.37 0.01 0.24 0.07 0.17 0.00 0.00 0.07 Lesotho 2.0 0.86 0.24 0.16 0.27 0.00 0.14 .id 0.14 0.00 0.00 0.05 Liberia 2.7 0.91 0.20 0.01 0.35 0.04 0.21 0.04 0.16 0.00 0.00 0.11 Libya 5.2 3.28 0.86 0.11 0.06 0.08 2.10 2.08 0.02 0.00 0.00 0.07 Madagascar 15.5 0.88 0.23 0.17 0.21 0.05 0.14 0.02 0.12 0.00 0.00 0.08 Malawi 11.0 0.87 0.25 0.02 0.30 0.02 0.18 0.02 0.16 0.00 0.00 0.11 Mali 11.0 1.14 0.53 0.16 0.22 0.02 0.12 0.02 0.10 0.00 0.00 0.09 Mauritania 2.6 1.33 0.39 0.39 0.01 0.14 0.33 0.33 0.00 0.00 0.00 0.07 Mauritius 1.2 1.50 0.54 0.09 0.12 0.29 0.35 0.34 0.00 0.01 0.00 0.12 Morocco 29.3 1.10 0.51 0.12 0.04 0.09 0.29 0.28 0.00 0.00 0.00 0.06 Mozambique 17.9 0.47 0.20 0.02 0.03 0.02 0.17 0.02 0.16 0.00 0.00 0.02 Namibia 1.7 1.47 0.65 0.25 .id 0.23 0.24 0.24 .id 0.00 0.00 0.10 Niger 10.5 1.15 0.61 0.08 0.24 0.00 0.14 0.03 0.11 0.00 0.00 0.08
LIVING PLANET REPORT 200222
1999 data unless Population Total Cropland Grazing Forest Fishing Total Included in total energy Built-upotherwise specified ecological footprint land footprint ground energy CO2 from Fuelwood Nuclear Hydro land
footprint footprint (ex. fuelwood) footprint footprint fossil fuelsSee notes on (global (global (global (global (global (global (global (global (global (global (globalpages 28/29 (millions) ha/person) ha/person) ha/person) ha/person) ha/person) ha/person) ha/person) ha/person) ha/person) ha/person) ha/person)

23
WORLD 1.90 0.53 0.27 0.86 0.14 0.38 2.39 1.98 0.55 8.89
High income countries 3.55 1.13 0.71 1.10 0.37 2.93 6.49 3.66 0.98 9.65 Middle income countries 1.89 0.47 0.35 0.84 0.12 0.10 2.11 1.93 0.52 11.10 Low income countries 0.95 0.30 0.08 0.44 0.06 -0.11 0.89 0.98 0.42 5.55
AFRICA 1.55 0.36 0.26 0.71 0.10 -0.18 1.36 1.68 0.19 6.64 Algeria 0.54 0.24 0.15 0.08 0.01 1.01 1.92 0.68 0.14 0.45 Angola 5.88 0.21 1.65 3.53 0.46 -5.01 1.04 6.44 0.04 14.38 Benin 1.05 0.41 0.03 0.46 0.05 0.10 1.07 1.09 0.02 4.16 Botswana 3.92 0.18 0.95 2.39 0.33 -2.43 2.01 4.25 0.07 9.07 Burkina Faso 0.94 0.38 0.13 0.33 0.00 0.24 1.16 0.98 0.03 1.45 Burundi 0.53 0.23 0.09 0.14 0.01 -0.05 0.53 0.61 0.01 0.52 Cameroon 3.92 0.70 0.04 2.99 0.09 -2.81 1.26 4.30 0.03 17.71 Central African Rep. 6.20 0.65 0.28 5.19 0.00 -4.95 1.49 6.63 0.02 38.74 Chad 1.68 0.45 0.34 0.69 0.12 -0.65 1.04 1.85 0.02 5.91 Congo 9.05 0.11 1.31 7.37 0.16 -8.13 1.09 9.77 0.01 279.19 Congo, Dem. Rep. 3.36 0.16 0.11 2.92 0.09 -2.56 0.65 3.66 0.01 19.69 Côte d'Ivoire 2.00 0.73 0.44 0.68 0.05 -1.08 1.15 2.10 0.05 5.13 Egypt 0.78 0.29 .id 0.00 0.02 0.71 1.56 0.78 0.81 1.27 Eritrea 0.75 0.15 0.10 0.30 0.12 0.03 0.77 0.71 ..✝ 0.13 Ethiopia 0.46 0.21 0.02 0.09 0.06 0.32 0.81 0.52 0.03 28.87 Gabon 28.70 0.55 1.30 24.52 2.26 -26.57 2.92 31.02 0.05 132.79 Gambia, The 0.93 0.31 0.05 0.18 0.32 0.07 0.90 0.85 0.02 6.43 Ghana 0.89 0.40 0.10 0.21 0.09 0.18 1.08 0.97 0.02 2.66 Guinea 2.01 0.25 0.22 1.07 0.39 -0.80 1.19 2.02 0.09 28.75 Guinea-Bissau 4.19 0.34 0.03 1.56 2.20 -3.49 0.78 4.51 0.01 22.88 Kenya 1.05 0.16 0.29 0.52 0.00 0.04 1.18 1.15 0.07 1.00 Lesotho 0.71 0.12 0.46 0.08 0.00 0.15 0.90 0.73 0.02 2.27 Liberia 3.26 0.17 0.27 2.12 0.59 -2.34 1.15 4.39 0.04 71.25 Libya 0.93 0.40 0.08 0.08 0.31 2.34 3.53 1.07 0.72 0.09 Madagascar 1.86 0.23 0.42 0.90 0.23 -0.99 0.95 2.04 0.94 19.37 Malawi 0.82 0.28 0.07 0.28 0.08 0.05 0.87 0.83 0.09 1.70 Mali 1.42 0.56 0.17 0.55 0.06 -0.28 1.21 1.53 0.11 7.96 Mauritania 2.65 0.16 0.83 0.10 1.48 -1.32 1.22 2.93 0.63 4.42 Mauritius 1.28 0.17 0.01 0.14 0.84 0.22 1.66 1.39 0.52 1.87 Morocco 0.87 0.28 0.13 0.12 0.29 0.24 1.26 1.22 0.38 1.04 Mozambique 1.87 0.19 1.14 0.49 0.03 -1.40 0.79 1.96 0.03 11.04 Namibia 5.04 0.51 1.26 1.17 2.00 -3.57 1.33 5.89 0.14 26.26 Niger 0.91 0.66 0.09 0.09 0.00 0.24 1.08 0.77 0.05 3.01
LIVING PLANET REPORT 2002
1999 data unless Biocapacity Cropland Grazing Forest Fishing Ecological Ecological Biocapacity Water* Water*otherwise specified biocapacity land biocapacity ground deficit footprint 1996 withdrawals resources
biocapacity biocapacity 1996 2000 est. 2000 est.See notes on (global (global (global (global (global (global (global (global (thousand m3/ (thousand m3/pages 28/29 ha/person) ha/person) ha/person) ha/person) ha/person) ha/person) ha/person) ha/person) person/year) person/year)

Nigeria 110.8 1.33 0.52 0.07 0.34 0.04 0.25 0.10 0.15 0.00 0.00 0.11 Rwanda 7.1 1.06 0.30 0.04 0.40 0.00 0.21 0.02 0.19 0.00 0.00 0.12 Senegal 9.2 1.31 0.42 0.18 0.22 0.22 0.18 0.10 0.08 0.00 0.00 0.09 Sierra Leone 4.3 0.54 0.21 0.03 0.00 0.06 0.16 0.04 0.12 0.00 0.00 0.08 Somalia 8.4 1.05 0.11 0.42 0.31 0.01 0.15 .id 0.15 0.00 0.00 0.06 South Africa, Rep. 42.8 4.02 0.66 0.27 0.30 0.22 2.45 2.33 0.05 0.07 0.00 0.11 Sudan 30.4 1.06 0.50 0.25 0.14 0.00 0.10 0.05 0.05 0.00 0.00 0.07 Tanzania, United Rep. 34.3 1.03 0.23 0.13 0.30 0.04 0.22 0.02 0.20 0.00 0.00 0.11 Togo 4.4 0.86 0.46 0.03 0.11 0.08 0.11 0.07 0.04 0.00 0.00 0.07 Tunisia 9.4 1.69 0.72 0.10 0.16 0.08 0.55 0.50 0.05 0.00 0.00 0.08 Uganda 22.6 1.06 0.47 0.03 0.31 0.02 0.13 0.01 0.12 0.00 0.00 0.10 Zambia 10.2 1.26 0.61 0.06 0.29 0.03 0.21 0.06 0.14 0.00 0.01 0.07 Zimbabwe 12.4 1.32 0.28 0.12 0.24 0.02 0.61 0.47 0.13 0.02 0.00 0.04
MIDDLE EAST AND 323.3 2.07 0.62 0.12 0.06 0.06 1.12 1.11 0.01 0.00 0.00 0.09 CENTRAL ASIAAfghanistan 21.2 0.95 0.41 0.25 0.15 0.00 0.07 0.02 0.05 0.00 0.00 0.06 Armenia 3.8 0.88 0.40 0.16 0.00 0.00 0.26 0.25 .id 0.00 0.00 0.06 Azerbaijan 8.0 1.73 0.40 0.08 0.04 0.00 1.17 1.16 .id 0.00 0.00 0.04 Georgia 5.3 0.91 0.39 0.15 .id 0.01 0.31 0.30 .id 0.00 0.01 0.05 Iran 69.2 1.98 0.61 0.10 0.01 0.08 1.08 1.08 0.00 0.00 0.00 0.10 Iraq 22.3 1.38 0.32 0.01 0.00 0.02 0.99 0.99 0.00 0.00 0.00 0.03 Israel 5.9 4.44 0.79 0.11 0.24 0.50 2.58 2.57 0.00 0.01 0.00 0.22 Jordan 4.8 1.55 0.56 0.05 0.06 0.03 0.80 0.79 0.00 0.00 0.00 0.05 Kazakhstan 16.3 3.58 1.12 0.53 0.02 0.01 1.87 1.87 0.00 0.00 0.00 0.03 Kuwait 1.8 7.75 0.52 0.13 0.11 0.08 6.67 6.66 .id 0.01 0.00 0.24 Kyrgyzstan, Rep. 4.8 1.14 0.56 0.20 0.02 0.00 0.30 0.28 0.00 0.00 0.02 0.05 Lebanon 3.4 2.61 0.69 0.05 0.21 0.09 1.38 1.35 0.02 0.01 0.00 0.19 Saudi Arabia 19.6 4.07 0.92 0.08 0.07 0.08 2.74 2.71 0.00 0.03 0.00 0.18 Syria 15.8 1.62 0.58 0.06 0.03 0.02 0.84 0.84 0.00 0.00 0.00 0.08 Tajikistan 6.0 0.66 0.28 0.04 0.01 0.00 0.28 0.26 0.00 0.00 0.02 0.05 Turkey 65.7 1.98 0.83 0.03 0.15 0.07 0.77 0.75 0.02 0.00 0.00 0.11 Turkmenistan 4.6 3.18 0.60 0.43 0.01 0.01 2.07 2.07 .id 0.00 0.00 0.06 United Arab Emirates 2.6 10.13 1.15 0.19 0.36 0.54 7.74 7.72 .id 0.02 0.00 0.16 Uzbekistan 24.5 1.91 0.37 0.12 0.01 0.00 1.33 1.33 0.00 0.00 0.00 0.08 Yemen 17.6 0.71 0.27 0.10 0.01 0.08 0.16 0.16 .id 0.00 0.00 0.10
ASIA-PACIFIC 3 312.7 1.37 0.32 0.05 0.17 0.12 0.63 0.55 0.06 0.02 0.00 0.08 Australia 18.9 7.58 1.64 0.62 0.60 0.25 4.35 4.31 0.02 0.00 0.01 0.11 Bangladesh 134.6 0.53 0.22 0.00 0.10 0.04 0.11 0.06 0.05 0.00 0.00 0.06 Cambodia 12.8 0.83 0.34 0.05 0.22 0.03 0.14 0.02 0.12 0.00 0.00 0.05 China 1 272.0 1.54 0.35 0.09 0.22 0.10 0.69 0.64 0.05 0.00 0.00 0.09 India 992.7 0.77 0.28 0.00 0.11 0.03 0.30 0.24 0.05 0.00 0.00 0.05 Indonesia 209.3 1.13 0.29 0.02 0.14 0.18 0.44 0.30 0.14 0.00 0.00 0.06
1999 data unless Population Total Cropland Grazing Forest Fishing Total Included in total energy Built-upotherwise specified ecological footprint land footprint ground energy CO2 from Fuelwood Nuclear Hydro land
footprint footprint (ex. fuelwood) footprint footprint fossil fuels(global (global (global (global (global (global (global (global (global (global (global
(millions) ha/person) ha/person) ha/person) ha/person) ha/person) ha/person) ha/person) ha/person) ha/person) ha/person) ha/person)
24 LIVING PLANET REPORT 2002

1999 data unless Biocapacity Cropland Grazing Forest Fishing Ecological Ecological Biocapacity Water Waterotherwise specified biocapacity land biocapacity ground deficit footprint 1996 withdrawals resources
biocapacity biocapacity 1996 2000 est. 2000 est.(global (global (global (global (global (global (global (global (thousand m3/ (thousand m3/
ha/person) ha/person) ha/person) ha/person) ha/person) ha/person) ha/person) ha/person) person/year) person/year)
25
Nigeria 0.88 0.51 0.13 0.10 0.03 0.45 1.50 0.88 0.03 2.17 Rwanda 0.92 0.26 0.04 0.50 0.01 0.14 1.16 1.15 0.10 0.82 Senegal 1.49 0.30 0.25 0.70 0.16 -0.18 1.22 1.55 0.14 4.15 Sierra Leone 1.07 0.14 0.14 0.43 0.29 -0.52 0.88 1.28 0.08 32.88 Somalia 1.06 0.08 0.46 0.43 0.04 -0.02 1.07 1.17 0.07 1.37 South Africa, Rep. 2.42 0.60 0.93 0.56 0.23 1.60 3.81 2.72 0.29 1.08 Sudan 2.04 0.47 0.26 1.20 0.03 -0.98 1.15 2.32 0.60 5.16 Tanzania, United Rep. 1.29 0.22 0.31 0.64 0.02 -0.26 1.18 1.40 0.03 2.64 Togo 0.81 0.47 0.09 0.14 0.04 0.05 0.89 0.88 0.02 2.57 Tunisia 1.00 0.55 0.11 0.06 0.21 0.69 1.64 1.11 0.31 0.42 Uganda 0.89 0.48 0.03 0.21 0.07 0.18 1.10 0.96 0.01 2.94 Zambia 2.67 0.56 0.83 1.17 0.04 -1.41 1.51 3.08 0.19 12.70 Zimbabwe 1.42 0.26 0.45 0.66 0.01 -0.11 1.41 1.43 0.10 1.61
MIDDLE EAST AND 0.97 0.51 0.14 0.13 0.09 1.10 2.33 1.01 1.08 2.57 CENTRAL ASIAAfghanistan 0.78 0.39 0.27 0.06 0.00 0.16 0.97 0.83 1.02 2.54 Armenia 0.50 0.23 0.14 0.05 0.02 0.38 0.88 0.53 0.80 2.87 Azerbaijan 0.90 0.32 0.08 0.11 0.36 0.82 1.69 0.91 2.11 3.87 Georgia 0.92 0.29 0.15 0.40 0.01 -0.01 0.86 0.93 0.64 11.68 Iran 0.89 0.47 0.10 0.14 0.09 1.08 2.12 0.91 0.92 1.80 Iraq 0.23 0.14 0.01 0.04 0.00 1.15 1.43 0.35 1.85 4.17 Israel 0.57 0.27 0.03 0.03 0.02 3.86 5.02 0.58 0.28 0.35 Jordan 0.16 0.07 0.01 0.03 0.00 1.39 1.96 0.25 0.16 0.14 Kazakhstan 3.33 1.60 1.10 0.25 0.36 0.25 3.75 2.58 1.99 6.47 Kuwait 0.40 0.01 0.02 0.00 0.12 7.35 9.38 0.46 0.27 0.01 Kyrgyzstan, Rep. 0.99 0.53 0.22 0.11 0.06 0.15 1.24 0.96 2.22 4.53 Lebanon 0.50 0.28 0.00 0.02 0.01 2.11 2.56 0.57 0.39 1.47 Saudi Arabia 0.98 0.49 0.07 0.07 0.16 3.09 5.52 1.07 0.79 0.11 Syria 0.61 0.43 0.06 0.04 0.00 1.00 1.83 0.90 0.89 2.86 Tajikistan 0.31 0.21 0.02 0.01 0.01 0.35 0.75 0.37 1.86 2.50 Turkey 1.23 0.77 0.03 0.28 0.02 0.75 2.30 1.43 0.48 3.05 Turkmenistan 2.02 0.62 0.59 0.01 0.73 1.16 2.89 1.63 5.31 5.51 United Arab Emirates 1.26 0.15 0.00 0.19 0.76 8.88 11.87 1.32 0.86 0.06 Uzbekistan 0.68 0.38 0.08 0.04 0.09 1.23 1.88 0.70 2.32 2.01 Yemen 0.52 0.14 0.13 0.02 0.13 0.19 0.87 0.55 0.16 0.23
ASIA-PACIFIC 1.04 0.32 0.22 0.35 0.08 0.32 1.45 1.05 0.49 4.78 Australia 14.61 4.38 4.94 2.30 2.86 -7.03 8.57 16.21 0.94 21.13 Bangladesh 0.30 0.18 0.00 0.04 0.02 0.23 0.53 0.28 0.11 9.43 Cambodia 1.36 0.34 0.05 0.82 0.10 -0.54 0.71 1.46 0.05 42.48 China 1.04 0.33 0.44 0.14 0.03 0.51 1.62 0.98 0.43 2.22 India 0.68 0.28 0.00 0.31 0.04 0.09 0.83 0.67 0.50 1.89 Indonesia 1.82 0.29 0.03 1.17 0.27 -0.69 1.22 1.93 0.35 13.35
LIVING PLANET REPORT 2002

LIVING PLANET REPORT 200226
Japan 126.8 4.77 0.47 0.06 0.28 0.76 3.04 2.53 0.00 0.51 0.01 0.16 Korea, DPR 22.1 3.04 0.23 0.00 0.11 0.16 2.48 2.43 0.04 0.00 0.01 0.07 Korea, Rep. 46.4 3.31 0.47 0.04 0.14 0.59 1.94 1.70 0.00 0.23 0.00 0.13 Lao PDR 5.2 0.82 0.21 0.07 0.31 0.03 0.15 0.02 0.14 0.00 0.00 0.04 Malaysia 21.8 3.16 0.68 0.05 0.21 0.53 1.63 1.49 0.06 0.07 0.00 0.07 Mongolia 2.5 2.58 0.33 1.34 0.10 0.00 0.80 0.79 0.01 0.00 0.00 0.01 Myanmar 47.1 0.70 0.36 0.00 0.08 0.08 0.13 0.05 0.08 0.00 0.00 0.05 Nepal 22.5 0.83 0.23 0.02 0.34 0.00 0.20 0.03 0.16 0.00 0.00 0.05 New Zealand 3.7 8.68 3.03 1.60 1.09 0.71 2.03 1.92 .id 0.06 0.05 0.22 Pakistan 137.6 0.64 0.27 0.01 0.08 0.03 0.20 0.16 0.04 0.00 0.00 0.05 Papua New Guinea 4.7 1.42 0.25 0.06 0.47 0.25 0.31 0.10 0.21 0.00 0.00 0.07 Philippines 74.2 1.17 0.24 0.03 0.22 0.29 0.35 0.25 0.10 0.00 0.00 0.05 Sri Lanka 18.7 1.00 0.25 0.01 0.21 0.22 0.25 0.15 0.09 0.00 0.00 0.06 Thailand 62.0 1.53 0.31 0.00 0.16 0.26 0.74 0.64 0.10 0.00 0.00 0.05 Viet Nam 77.1 0.76 0.24 0.00 0.18 0.05 0.19 0.11 0.07 0.00 0.00 0.10
LATIN AMERICA AND 503.2 2.17 0.58 0.38 0.26 0.11 0.75 0.65 0.08 0.01 0.01 0.10 THE CARIBBEANArgentina 36.6 3.03 0.78 0.86 0.09 0.19 0.97 0.92 0.01 0.04 0.01 0.14 Bolivia 8.1 0.96 0.31 0.13 0.09 0.02 0.35 0.32 0.03 0.00 0.00 0.06 Brazil 168.2 2.38 0.64 0.55 0.43 0.07 0.59 0.46 0.12 0.00 0.01 0.09 Chile 15.0 3.11 0.61 0.32 0.62 0.45 0.96 0.83 0.12 0.00 0.01 0.15 Colombia 41.4 1.34 0.28 0.26 0.15 0.09 0.44 0.36 0.07 0.00 0.01 0.11 Costa Rica 3.9 1.95 0.40 0.24 0.63 0.05 0.46 0.28 0.17 0.00 0.01 0.17 Cuba 11.2 1.49 0.55 0.03 0.06 0.13 0.66 0.64 0.02 0.00 0.00 0.05 Dominican Rep. 8.2 1.53 0.44 0.14 0.09 0.17 0.61 0.59 0.01 0.00 0.00 0.08 Ecuador 12.4 1.54 0.35 0.15 0.42 0.09 0.45 0.37 0.08 0.00 0.00 0.08 El Salvador 6.2 1.19 0.31 0.06 0.34 0.02 0.36 0.22 0.13 0.00 0.00 0.11 Guatemala 11.1 1.42 0.35 0.07 0.40 0.01 0.47 0.25 0.21 0.02 0.00 0.10 Haiti 8.0 0.82 0.24 0.01 0.30 0.02 0.20 0.06 0.14 0.00 0.00 0.06 Honduras 6.3 1.34 0.51 0.09 0.25 0.04 0.37 0.18 0.19 0.00 0.00 0.08 Jamaica 2.6 2.07 0.42 0.10 0.12 0.23 1.11 1.09 0.02 0.00 0.00 0.10 Mexico 97.4 2.52 0.70 0.25 0.13 0.09 1.26 1.18 0.03 0.05 0.00 0.08 Nicaragua 4.9 1.53 0.97 0.12 0.02 0.01 0.33 0.18 0.15 0.00 0.00 0.08 Panama 2.8 1.72 0.48 0.30 0.16 0.17 0.52 0.45 0.06 0.00 0.01 0.08 Paraguay 5.4 2.51 1.14 0.56 0.23 0.02 0.35 0.14 0.14 0.00 0.06 0.21 Peru 25.2 1.15 0.42 0.09 0.12 0.23 0.19 0.13 0.05 0.00 0.00 0.10 Trinidad and Tobago 1.3 3.30 0.39 0.06 0.11 0.25 2.42 2.37 0.00 0.06 0.00 0.07 Uruguay 3.3 3.79 0.57 1.64 0.61 0.16 0.71 0.46 0.23 0.00 0.02 0.10 Venezuela 23.7 2.34 0.40 0.22 0.06 0.16 1.40 1.37 0.01 0.00 0.02 0.09
NORTH AMERICA 310.9 9.61 1.55 0.32 1.26 0.30 5.82 5.26 0.05 0.49 0.02 0.37 Canada 30.5 8.84 2.18 0.31 1.12 0.19 4.74 4.19 0.03 0.45 0.08 0.31 United States of America 280.4 9.70 1.48 0.32 1.28 0.31 5.94 5.38 0.06 0.50 0.01 0.37
1999 data unless Population Total Cropland Grazing Forest Fishing Total Included in total energy Built-upotherwise specified ecological footprint land footprint ground energy CO2 from Fuelwood Nuclear Hydro land
footprint footprint (ex. fuelwood) footprint footprint fossil fuels(global (global (global (global (global (global (global (global (global (global (global
(millions) ha/person) ha/person) ha/person) ha/person) ha/person) ha/person) ha/person) ha/person) ha/person) ha/person) ha/person)

1999 data unless Biocapacity Cropland Grazing Forest Fishing Ecological Ecological Biocapacity Water Waterotherwise specified biocapacity land biocapacity ground deficit footprint 1996 withdrawals resources
biocapacity biocapacity 1996 2000 est. 2000 est.(global (global (global (global (global (global (global (global (thousand m3/ (thousand m3/
ha/person) ha/person) ha/person) ha/person) ha/person) ha/person) ha/person) ha/person) person/year) person/year)
27LIVING PLANET REPORT 2002
Japan 0.71 0.13 0.01 0.28 0.13 4.06 4.68 0.74 0.72 3.40 Korea, DPR 0.81 0.19 0.00 0.47 0.08 2.23 3.57 0.80 0.59 3.22 Korea, Rep. 0.73 0.15 0.00 0.18 0.27 2.58 3.36 0.75 0.50 1.49 Lao PDR 4.49 0.26 0.07 4.08 0.04 -3.68 0.69 4.82 0.17 58.25 Malaysia 3.39 0.83 0.01 2.03 0.44 -0.24 3.90 3.72 0.57 26.01 Mongolia 6.43 0.25 2.77 3.40 0.00 -3.85 2.70 7.79 0.16 12.72 Myanmar 1.62 0.38 0.00 1.00 0.18 -0.92 0.71 1.72 0.08 21.19 Nepal 0.58 0.22 0.02 0.28 0.01 0.25 0.85 0.63 1.19 8.63 New Zealand 22.95 3.05 13.68 5.51 0.44 -14.28 8.08 23.34 0.53 105.59 Pakistan 0.39 0.24 0.01 0.06 0.03 0.25 0.68 0.40 1.00 2.75 Papua New Guinea 14.00 0.35 0.01 12.51 1.07 -12.58 1.43 15.07 0.02 166.49 Philippines 0.56 0.21 0.02 0.20 0.10 0.61 1.32 0.65 0.74 6.38 Sri Lanka 0.51 0.19 0.01 0.21 0.04 0.50 0.99 0.50 0.52 2.66 Thailand 1.37 0.48 0.00 0.75 0.09 0.15 2.08 1.44 0.55 6.78 Viet Nam 0.84 0.30 0.00 0.31 0.13 -0.08 0.76 0.80 0.67 11.06
LATIN AMERICA AND 4.02 0.64 0.66 2.38 0.23 -1.84 2.30 4.17 0.52 36.18 THE CARIBBEANArgentina 6.66 2.01 2.93 1.01 0.57 -3.63 3.51 6.66 0.77 21.98 Bolivia 6.39 0.33 0.14 5.80 0.06 -5.43 1.08 6.90 0.15 74.74 Brazil 6.03 0.73 0.65 4.44 0.10 -3.65 2.47 6.23 0.32 48.66 Chile 4.23 0.46 0.83 0.98 1.80 -1.13 3.95 4.71 1.33 60.61 Colombia 2.53 0.24 0.50 1.65 0.02 -1.19 1.55 2.64 0.23 54.80 Costa Rica 2.31 0.44 0.54 1.12 0.03 -0.36 2.12 2.55 1.52 29.59 Cuba 1.10 0.44 0.02 0.55 0.03 0.39 1.46 1.03 0.47 3.40 Dominican Rep. 0.74 0.31 0.14 0.18 0.03 0.78 1.27 0.72 0.98 2.47 Ecuador 2.61 0.37 0.18 1.61 0.37 -1.07 1.76 2.80 1.34 34.16 El Salvador 0.53 0.27 0.08 0.05 0.02 0.67 1.25 0.53 0.12 4.00 Guatemala 1.20 0.35 0.09 0.64 0.01 0.21 1.39 1.27 0.09 9.10 Haiti 0.26 0.14 0.00 0.03 0.03 0.56 0.82 0.27 0.13 1.79 Honduras 1.56 0.48 0.09 0.84 0.06 -0.22 1.67 1.74 0.23 14.79 Jamaica 0.59 0.21 0.06 0.14 0.08 1.49 2.19 0.61 0.35 3.64 Mexico 1.69 0.51 0.31 0.51 0.27 0.83 2.42 1.80 0.79 4.62 Nicaragua 3.09 0.93 0.51 1.46 0.11 -1.56 1.67 3.32 0.27 41.90 Panama 3.09 0.37 0.39 2.13 0.11 -1.37 2.20 3.31 0.58 51.81 Paraguay 6.67 1.71 1.95 2.68 0.06 -4.16 2.61 7.03 0.08 61.14 Peru 5.31 0.33 0.55 3.91 0.43 -4.16 1.43 5.58 0.74 74.55 Trinidad and Tobago 0.81 0.13 0.00 0.36 0.24 2.49 4.05 0.83 0.22 2.86 Uruguay 4.57 0.82 2.73 0.39 0.52 -0.78 3.27 4.28 0.20 42.46 Venezuela 3.28 0.28 0.23 2.62 0.04 -0.95 2.66 3.40 0.17 51.02
NORTH AMERICA 6.15 1.94 1.26 1.99 0.59 3.46 9.44 6.28 1.66 17.44 Canada 14.24 3.46 1.25 7.24 1.91 -5.40 7.81 14.59 1.43 94.56 United States of America 5.27 1.77 1.26 1.42 0.44 4.43 9.62 5.35 1.69 8.92

NOTES
High income countries: Australia; Austria; Belgium; Canada; Denmark;Finland; France; Germany; Greece; Ireland; Israel; Italy; Japan; Korea,Rep.; Kuwait; Netherlands; New Zealand; Norway; Portugal; Slovenia;Spain; Sweden; Switzerland; United Arab Emirates; United Kingdom;United States of America
Middle income countries: Algeria; Argentina; Belarus; Bolivia; Botswana;Brazil; Bulgaria; Chile; China; Colombia; Costa Rica; Croatia; Cuba; CzechRep.; Dominican Rep.; Ecuador; Egypt; El Salvador; Estonia; Gabon;Georgia; Guatemala; Hungary; Indonesia; Iran; Iraq; Jamaica; Jordan;Kazakhstan; Korea, Dem. Rep.; Latvia; Lebanon; Libya; Lithuania;Macedonia; Malaysia; Mauritius; Mexico; Morocco; Namibia; Panama;Papua New Guinea; Paraguay; Peru; Philippines; Poland; Romania;
Russian Federation; Saudi Arabia; Slovakia; South Africa, Rep.; Sri Lanka;Syria; Thailand; Trinidad and Tobago; Tunisia; Turkey; Ukraine; Uruguay;Uzbekistan; Venezuela; Yugoslavia, Fed. Rep.
Low income countries: Afghanistan; Albania; Angola; Armenia;Azerbaijan; Bangladesh; Benin; Bosnia Herzegovina; Burkina Faso;Burundi; Cambodia; Cameroon; Central African Rep.; Chad; Congo;
28 LIVING PLANET REPORT 2002
WESTERN EUROPE 387.4 4.97 0.84 0.20 0.46 0.38 2.88 2.45 0.02 0.41 0.01 0.21 Austria 8.1 4.73 0.71 0.26 0.80 0.18 2.64 2.37 0.08 0.16 0.03 0.14 Belgium/Luxembourg 10.2 6.72 0.83 0.14 0.46 0.31 4.68 3.83 0.01 0.84 0.00 0.30 Denmark 5.3 6.58 1.21 0.09 1.11 0.45 3.45 3.24 0.02 0.19 0.00 0.26Finland 5.2 8.42 1.05 0.04 2.36 0.45 4.07 3.04 0.17 0.84 0.02 0.45 France 59.0 5.26 0.98 0.19 0.45 0.37 3.04 2.09 0.01 0.93 0.01 0.23 Germany 82.0 4.71 0.68 0.09 0.37 0.19 3.08 2.69 0.01 0.38 0.00 0.29 Greece 10.6 5.09 1.06 0.38 0.28 0.27 3.03 2.89 0.02 0.12 0.00 0.07 Ireland 3.8 5.33 1.37 0.40 0.54 0.25 2.62 2.61 0.00 0.01 0.00 0.15 Italy 57.5 3.84 0.81 0.18 0.30 0.27 2.21 2.10 0.02 0.08 0.01 0.07 Netherlands 15.8 4.81 0.77 0.13 0.54 0.29 2.89 2.82 0.00 0.07 0.00 0.19 Norway 4.4 7.92 0.89 0.05 0.97 2.62 3.18 2.68 0.03 0.26 0.20 0.22 Portugal 10.0 4.47 0.91 0.17 0.40 1.01 1.78 1.75 0.01 0.01 0.01 0.21 Spain 39.9 4.66 1.08 0.25 0.48 0.56 2.19 1.88 0.01 0.29 0.00 0.09 Sweden 8.9 6.73 1.21 0.12 1.37 0.34 3.21 1.49 0.13 1.53 0.05 0.48 Switzerland 7.2 4.12 0.55 0.45 0.45 0.16 2.27 1.51 0.03 0.69 0.04 0.25 United Kingdom 59.5 5.35 0.68 0.33 0.32 0.47 3.33 2.99 0.00 0.34 0.00 0.21
CENTRAL AND 349.9 3.68 0.96 0.09 0.19 0.26 2.11 1.96 0.02 0.12 0.00 0.07 EASTERN EUROPEAlbania 3.1 0.96 0.55 0.06 0.07 0.01 0.19 0.15 0.02 0.00 0.01 0.08 Belarus 10.2 3.27 1.09 0.11 0.50 0.01 1.51 1.50 0.01 0.00 0.00 0.06 Bosnia Herzegovina 3.8 1.05 0.45 0.11 0.01 0.01 0.41 0.40 .id 0.00 0.00 0.06 Bulgaria 8.0 2.36 0.92 0.08 0.13 0.03 1.13 0.89 0.03 0.21 0.00 0.07 Croatia 4.7 2.69 0.89 0.08 0.28 0.14 1.21 1.16 0.04 0.00 0.00 0.09 Czech Rep. 10.3 4.82 0.90 0.06 0.48 0.10 3.15 2.88 0.01 0.25 0.00 0.13 Estonia 1.4 4.94 1.27 0.08 0.37 0.26 2.91 2.81 0.09 0.01 0.00 0.05 Hungary 10.0 3.08 0.84 0.02 0.19 0.11 1.81 1.51 0.03 0.26 0.00 0.11 Latvia 2.4 3.43 1.43 0.11 0.60 0.11 1.11 0.93 0.13 0.04 0.01 0.07 Lithuania 3.7 3.07 1.39 0.06 0.29 0.24 1.02 0.96 0.05 0.00 0.00 0.07 Macedonia 2.0 3.26 0.80 0.10 0.21 0.63 1.44 1.38 0.06 0.00 0.00 0.09 Moldova, Rep. 4.3 1.38 0.69 0.02 0.04 0.00 0.58 0.58 0.00 0.00 0.00 0.05 Poland 38.6 3.70 0.98 0.03 0.27 0.18 2.14 2.13 0.01 0.00 0.00 0.10 Romania 22.5 2.52 0.71 0.05 0.12 0.04 1.53 1.42 0.02 0.08 0.01 0.07 Russian Federation 146.2 4.49 1.09 0.15 0.19 0.48 2.52 2.36 0.02 0.13 0.01 0.05 Slovakia 5.4 3.44 0.75 0.07 0.17 0.12 2.21 1.93 0.01 0.27 0.01 0.11 Slovenia 2.0 3.58 0.72 0.24 0.31 0.10 2.11 2.07 0.02 0.01 0.01 0.11 Ukraine 50.0 3.37 0.84 0.04 0.09 0.05 2.29 1.99 0.01 0.29 0.00 0.06 Yugoslavia, Fed. Rep. 21.1 2.14 0.74 0.05 0.10 0.10 1.06 1.06 0.00 0.00 0.00 0.09
1999 data unless Population Total Cropland Grazing Forest Fishing Total Included in total energy Built-upotherwise specified ecological footprint land footprint ground energy CO2 from Fuelwood Nuclear Hydro land
footprint footprint (ex. fuelwood) footprint footprint fossil fuels(global (global (global (global (global (global (global (global (global (global (global
(millions) ha/person) ha/person) ha/person) ha/person) ha/person) ha/person) ha/person) ha/person) ha/person) ha/person) ha/person)

1999 data unless Biocapacity Cropland Grazing Forest Fishing Ecological Ecological Biocapacity Water Waterotherwise specified biocapacity land biocapacity ground deficit footprint 1996 withdrawals resources
biocapacity biocapacity 1996 2000 est. 2000 est.(global (global (global (global (global (global (global (global (thousand m3/ (thousand m3/
ha/person) ha/person) ha/person) ha/person) ha/person) ha/person) ha/person) ha/person) person/year) person/year)
29LIVING PLANET REPORT 2002
Congo, Dem. Rep.; Côte d'Ivoire; Eritrea; Ethiopia; Gambia, The; Ghana;Guinea; Guinea-Bissau; Haiti; Honduras; India; Kenya; Kyrgyzstan, Rep.;Lao PDR; Lesotho; Liberia; Madagascar; Malawi; Mali; Mauritania;Moldova, Rep.; Mongolia; Mozambique; Myanmar; Nepal; Nicaragua;Niger; Nigeria; Pakistan; Rwanda; Senegal; Sierra Leone; Somalia; Sudan;Tajikistan; Tanzania, United Rep.; Togo; Turkmenistan; Uganda; Viet Nam;Yemen; Zambia; Zimbabwe
Table includes all countries with populations greater than 1 million, exceptBhutan, Oman, and Singapore, for which insufficient data were available tocalculate the ecological footprint and biocapacity figures.id = insufficient data 0.00 = less than 0.005Totals may not add up due to rounding
* Water withdrawals and resources estimates come from Gleick, P.H.2002. The World's Water 2002-2003. Island Press, Washington, DC.
✝ Withdrawals and resources data for Bosnia Herzegovina, Croatia, andMacedonia are included in the figures for Yugoslavia, Fed. Rep.;withdrawals data for Eritrea are included in the figures for Ethiopia.
WESTERN EUROPE 2.13 0.79 0.28 0.69 0.16 2.84 5.03 2.22 0.62 5.35 Austria 2.78 0.68 0.35 1.57 0.00 1.95 4.79 2.78 0.30 10.89 Belgium/Luxembourg 1.13 0.40 0.14 0.27 0.01 5.59 6.38 1.24 0.85 1.64 Denmark 3.24 1.78 0.07 0.35 0.78 3.33 7.18 3.42 0.19 2.46 Finland 8.61 0.96 0.03 7.00 0.16 -0.19 8.01 9.17 0.47 21.82 France 2.88 1.43 0.34 0.78 0.10 2.38 5.50 2.91 0.59 3.35 Germany 1.74 0.70 0.11 0.62 0.03 2.96 4.76 1.70 0.71 2.20 Greece 2.34 0.99 0.85 0.18 0.24 2.76 5.12 2.46 0.57 5.53 Ireland 6.14 1.57 2.22 0.53 1.66 -0.81 5.84 6.54 0.34 13.99 Italy 1.18 0.59 0.16 0.29 0.05 2.67 3.72 1.16 0.98 2.92 Netherlands 0.79 0.24 0.10 0.07 0.18 4.02 5.43 1.00 0.49 5.67 Norway 5.94 0.60 0.06 2.72 2.13 1.98 8.08 6.12 0.46 88.95 Portugal 1.60 0.46 0.14 0.71 0.08 2.88 4.45 1.57 0.74 7.11 Spain 1.79 0.89 0.37 0.39 0.04 2.86 4.52 2.06 0.84 2.80 Sweden 7.34 1.13 0.15 5.37 0.15 -0.61 6.54 7.65 0.33 20.23 Switzerland 1.82 0.27 0.66 0.60 0.01 2.30 4.30 2.07 0.35 6.75 United Kingdom 1.64 0.52 0.41 0.13 0.36 3.70 5.46 1.81 0.20 2.06
CENTRAL AND 3.00 0.92 0.15 1.68 0.19 0.67 3.90 3.14 0.53 16.82 EASTERN EUROPEAlbania 0.75 0.39 0.06 0.16 0.06 0.21 1.14 0.74 0.06 6.10 Belarus 2.57 0.96 0.22 1.33 0.00 0.71 3.85 2.85 0.27 5.64 Bosnia Herzegovina 1.11 0.27 0.11 0.67 0.00 -0.06 1.07 1.23 ..✝ ..✝Bulgaria 1.84 0.94 0.07 0.72 0.04 0.52 2.43 1.60 1.67 24.68 Croatia 2.13 0.80 0.14 0.82 0.27 0.56 2.78 2.07 ..✝ ..✝Czech Rep. 2.32 0.97 0.12 1.09 0.01 2.50 4.78 2.38 0.27 5.71 Estonia 4.15 1.01 0.18 2.71 0.19 0.79 5.51 4.18 0.11 9.03 Hungary 1.75 1.06 0.04 0.54 0.00 1.33 3.30 1.83 0.69 12.23 Latvia 4.56 1.38 0.23 2.79 0.09 -1.14 3.22 4.34 0.12 14.77 Lithuania 3.02 1.43 0.14 1.37 0.01 0.05 3.88 3.29 0.07 6.75 Macedonia 1.46 0.67 0.08 0.62 0.00 1.79 2.92 1.43 ..✝ ..✝Moldova, Rep. 0.82 0.68 0.04 0.04 0.01 0.56 1.53 0.84 0.66 2.62 Poland 1.63 0.93 0.05 0.54 0.01 2.07 3.90 1.71 0.32 1.45 Romania 1.37 0.75 0.10 0.40 0.03 1.15 2.99 1.27 1.16 9.24 Russian Federation 4.84 0.97 0.22 3.17 0.41 -0.35 4.57 4.95 0.53 30.77 Slovakia 2.35 0.74 0.14 1.35 0.01 1.08 3.61 2.48 0.33 5.73 Slovenia 2.24 0.27 0.25 1.60 0.01 1.34 3.99 2.37 .id .id Ukraine 1.47 0.96 0.09 0.30 0.05 1.90 3.61 1.59 0.51 2.75 Yugoslavia, Fed. Rep. 1.21 0.71 0.07 0.33 0.01 0.93 2.36 1.26 0.37 11.13

30 LIVING PLANET REPORT 2002
T E C H N I C A L N O T E SLIVING PLANET INDEX
The Living Planet Index is generated by averagingthree separate indices for forest, freshwater, andmarine species populations. Each is set at 1.00 in1970 and given an equal weighting. The populationdata for all species used in the index were gathered by UNEP-WCMC.
Forest species population index
The forest species population index is the averageof two indices relating to temperate and tropicalforests respectively. The temperate forestcomponent of the index is calculated from thechange over time in the populations of 231temperate forest species. The tropical forestcomponent is based on the change over time inpopulations of 51 tropical forest species. Thespecies in the index are predominantly birds andmammals. The bias in the data towards temperateforests and birds and mammals reflects theconcentration of research effort over the past 30 years. In many cases the data are not for anentire species, but just one sub-population of that species.
The last five years of the index, 1995-2000, arebased on fewer population datasets than the part ofthe index covering 1970-95. The reliability of thisrecent part of the index is therefore much lower.This will improve as new data become available infuture years.
Freshwater species population index
The freshwater species population index is theaverage of six regional indices relating to Africa,Asia-Pacific, Australasia, Europe, Latin America andthe Caribbean, and North America respectively. Thesix indices between them contain time-series dataon 195 species populations, comprising 8 Africanspecies, 31 Asia-Pacific species, 8 Australasianspecies, 56 European species, 11 Latin Americanand Caribbean species, and 81 North Americanspecies. In many cases the data are not for anentire species, but just one sub-population of thatspecies. More data are available from Europe and
North America than any other region of the world,which is a reflection of research effort over the past30 years. The index is the average of all six regionalsub-indices, with equal weight given to each region.The last five years of the index, 1995-2000, arebased on fewer population datasets than the part of the index relating to the years 1970-95. The reliability of this part of the index is thereforemuch lower.
Marine species population index
The marine species population index is the averageof six sub-indices which relate to the North Pacific,North Atlantic, Indian, South Pacific, South Atlantic,and Southern Oceans respectively. The six indicesbetween them contain time-series data on 217 species populations, comprising 72 NorthPacific species, 65 North Atlantic species, 16 IndianOcean species, 17 South Atlantic species, 35South Pacific species, and 12 Southern Oceanspecies. In many cases, the data are not for anentire species, but just one sub-population of that species. Inevitably, the index is dominated by those species which people have an interest inmonitoring. More data are available on populationsfrom the northern hemisphere and temperatewaters than from the southern hemisphere ortropical waters. To give equal weight to data fromdifferent oceans, the marine species populationindex is the average of all six ocean sub-indices.The last five years of the index, 1995-2000, arebased on fewer population datasets than the part of the index relating to the years 1970-95. The reliability of this part of the index is thereforemuch lower.
ECOLOGICAL FOOTPRINT
The ecological footprint is a measure of the amountof the Earth’s biological productivity that a humanpopulation – the global population, a country, anindividual – occupies in a given year. The analysis isbased primarily on data published by the Food andAgriculture Organization of the United Nations(FAO), the International Energy Agency (IEA), and
the Intergovernmental Panel on Climate Change(IPCC). Other data sources include studies in peer-reviewed science journals or thematic collections.
The ecological footprint represents thebiologically productive land and water areasrequired to produce the resources consumed andassimilate the wastes generated by a givenpopulation using prevailing technology. The globalecological footprint represents the fraction of theproductive biosphere required to maintain thematerial throughput of the human economy, undercurrent management and production practices.
Ecological footprint calculations are based on seven assumptions:
1. It is possible to keep track of most of theresources people consume and the wastes they generate.
2. Most of these resource and waste flows can bemeasured in terms of the biologically productivearea necessary to maintain these flows (thoseresource and waste flows that cannot bemeasured are excluded from the assessment).
3. By weighting each area in proportion to itsusable biomass productivity (that is, its annualproduction of usable biomass), the different areascan be expressed in terms of a standardizedaverage productive hectare. These standardizedhectares, called “global hectares”, representhectares with usable biomass productivity equalto the world’s average that year. Usable refers to the portion of biomass used by humans,reflecting the anthropocentric assumptions of the footprint measurement.
4. Since these areas stand for mutually exclusiveuses, and each global hectare represents thesame amount of biomass production potential for a given year, they can be added up to a total representing the aggregate humandemand.
5. Nature’s supply of usable bioproductivity can alsobe expressed in global hectares of biologicallyproductive space.
6. Human demand expressed in ecologicalfootprints and nature’s supply expressed inglobal hectares of biological capacity (orbiocapacity) can be directly compared to eachother.
7. Area demand can exceed area supply. Forexample, a forest harvested at twice itsregeneration rate appears in footprint accountsat twice its area. This phenomenon is called“ecological overshoot".
The results underestimate human demand onnature and overestimate the available biologicalcapacity by: • choosing the more conservative footprint
estimates when in doubt• leaving out human activities for which there are
insufficient data• excluding those activities that systematically
erode nature’s capacity to regenerate. Theyconsist of:• uses of materials for which the biosphere hasno significant assimilation capacity (e.g.plutonium, polychlorinated biphenyls (PCBs),chlorofluorocarbons (CFCs)) • processes that irreversibly damage thebiosphere (e.g. species extinction, aquiferdepletion, deforestation, desertification).
For consistency and to keep the accountscumulative, each area is only counted once on both the footprint side and the biocapacity side,even if an area provides two or more ecologicalservices at once. As mentioned, the accountsinclude the productivity of cropland at the level of current yields, with no deduction for possibledegradation. The energy use for agriculture,including fertilizers, is included in the energyfootprint.

The ecological footprint methodology is inconstant development, adding detail and better dataas they become available. In this report we use themost current national accounts methodology.
A nation’s consumption is calculated by addingimports to, and subtracting exports from, domesticproduction (net consumption = domestic production+ imports – exports). Domestic production isadjusted for production waste and, in the case ofcrops, the amount of seeds necessary for growingthe crops in the first place.
This balance is computed for more than 200 categories, such as cereals, timber, fishmeal,and cotton. These resource uses are translated into global hectares by dividing the total amountconsumed in each category by its global averageproductivity, or yield. Biomass yields, measured indry weight, are taken from FAO statistics. To relatethe productivity of sea space to the productivity ofland space, the ability of fisheries to provide foodenergy is compared with that of pastures. CO2
emissions from fossil fuel, minus the percentageabsorbed by oceans, are divided by the carbonassimilation capacity of forests. Some of theresource categories are primary resources (such asraw timber or milk), while others are manufacturedproducts derived from primary resources (such aspaper or cheese). For example, if 1 tonne of pork is exported, the amount of cereals and energyrequired to produce this tonne of pork is translatedinto a corresponding biologically productive areaand then subtracted from the exporting country’sfootprint. This amount is added to the importingcountry’s footprint.
Despite these adjustments for trade, someconsumption activities, such as tourism, areattributed to the country where they occur ratherthan to the travellers’ countries of origin. Thisdistorts the relative size of some countries’footprints, but does not affect the global result.
Cropland, forest, and grasslands vary in bioproductivity. In order to produce footprintresults in a single measure – the “global hectare” orgha – the calculations normalize bioproductive
areas across nations and area types to account fordifferences in land and sea productivity.
“Equivalence factors” relate the average primarybiomass productivities of the different types of landto the global average primary biomass productivityfor a given year. A hectare of land with world-average productivity has an equivalence factor of 1.For example, every hectare of pasture is assignedan equivalence factor of 0.47, since, on average,pasture is about half as productive as the averagebioproductive hectare of the Earth’s surface.
“Yield factors” account for the difference inproductivity of a given type of land across differentnations. For example, a hectare of pasture in NewZealand will produce more meat on average than ahectare of pasture in Jordan, therefore the yieldfactor for New Zealand pasture is higher than thatfor Jordanian pasture.
To calculate the biocapacity of a nation, each of the six different types of bioproductive areawithin that nation’s borders is multiplied by theequivalence factor for that type (constant for every country) and the yield factor for that type(specific for each country). Every year has its ownset of equivalence factors and yield factors sincebiological productivities change over time. The sixtypes of bioproductive area are described below.
Area types of the ecological footprint
The accounts include six bioproductive area typesfor human activities: • cropland for growing crops for food, animal feed,
fibre, oil crops, and rubber• grazing land for grazing animals for meat, hides,
wool, and milk• forest area for harvesting timber or wood fibre
for paper• fishing grounds for catching fish • built-up land for accommodating infrastructure for
housing, transportation, and industrial production • energy land for sequestering the excess CO2 from
burning fossil fuel, or to replace it with biomass,for harvesting fuelwood, and for nuclear energyand hydropower.
Once the human impacts are expressed in global hectares, these footprint components areadded up.
Growing crops occupies arable land, the mostproductive land type. FAO estimates that there areabout 1.5 billion hectares of cropland worldwide.Using FAO harvest and yield data for 74 majorcrops, we traced the use of arable land for cropproduction (FAO 2001). These accounts areunderestimates, since other impacts from currentagricultural practices, such as long-term damagefrom topsoil erosion, salinization, and contaminationof aquifers with agro-chemicals, are not includeddue to lack of consistent datasets.
Grazing animals requires grassland and pasturearea. Worldwide, there are 3.5 billion hectares ofnatural and semi-natural grassland and pasture. Wecalculated the demand for pasture using FAO data(FAO 2001).
Harvesting timber for lumber and paper andgathering fuelwood require natural or plantationforests. Worldwide there are 3.8 billion hectares offorests according to FAO’s most recent survey, theForest Resource Assessment 2000. We estimatedforest areas and productivities using a variety ofsources (FAO 2000a, FAO/UNECE 2000, IPCC1997). Consumption figures for timber andfuelwood come from FAO (2001). The footprint of fuelwood is calculated using timber growth ratesthat are adjusted upward to reflect the fact thatmore forest biomass than merely roundwood isused for fuel, and that less mature forests can beused for fuelwood production.
Fishing requires productive fishing grounds. Mostof the ocean’s productivity is located on continentalshelves. Excluding inaccessible or unproductivewaters, these comprise 2.0 billion hectares.Although a mere fraction of the ocean’s 36.3 billionhectares, these 2.0 billion hectares provide over 95 per cent of the marine fish catch. Inland waters
consist of an additional 0.3 billion hectares, makingfor 2.3 billion hectares of potential fisheries out ofthe 36.6 billion hectares of ocean and inland waterthat exist on the planet. We used FAO fish catchfigures (FAO 2001, FAO 2000b), and comparedthem with FAO’s “sustainable yield” figure of 93 million tonnes per year (FAO 1997a). Theaccounts include both fish catch for fishmeal andfish for direct human consumption. Also, weassumed an additional bycatch according to thespecies composition of national fish catches,except for Norway, where fishing vessels arerequired to land their bycatch.
Accommodating infrastructure for housing,transportation, industrial production, and capturinghydroelectric power occupies built-up land. Thisspace is the least documented, since low-resolutionsatellite images are not able to capture dispersedinfrastructure and roads. Using data from TellusPOLSTAR (SEI 1998) and Eurostat (2000), we useda global total of 0.3 billion hectares of built-up land.We assume that built-up land replaces arable land,as human settlements are predominantly located inthe most fertile areas of a country.
Burning fossil fuel can be translated into abioproductive area through either CO2
sequestration or biomass energy replacement.Burning fossil fuel adds formerly locked awaycarbon to the atmosphere. We calculate the fossilfuel footprint by estimating the biologicallyproductive area needed to sequester enoughcarbon emissions to avoid an increase inatmospheric CO2. Since the world’s oceans absorbabout 35 per cent of the CO2 emissions from fossilfuel combustion (IPCC 2001), we account only forthe remaining 65 per cent, based on each year’scapacity of world-average forests to sequestercarbon. This capacity is estimated by taking aweighted average across 26 main forest biomes(IPCC 2001, IPCC 1997, FAO 1997b, Dixon et al.1994). Sequestration capacity may change as theatmospheric CO2 level and global temperature
31LIVING PLANET REPORT 2002

LIVING PLANET REPORT 200232
increase over the next century. Alternatively, thefossil fuel footprint can be calculated by determiningthe amount of biologically productive area that, left alone, is able to replace the consumed energy.This approach, using fuelwood as nature’s energy currency, leads to roughly the same arearequirements.
Nuclear power is also included in the energyfootprint, with each thermal unit of energy countedat par with one from fossil energy. We chose thisparity because of inconclusive data about the long-
term area demand of nuclear power. Excludingnuclear power would reduce the global energyfootprint by less than 4 per cent.
The hydropower footprint is the area occupied byhydroelectric dams and reservoirs, and is calculatedfor each country using the US average ratio of areato power output, for lack of better data.
The net embodied energy in trade (which bydefinition balances out at zero for the globe as awhole) is calculated using trade statistics broken
down into 109 categories. The energy intensitiesused for each category stem from a variety ofsources (IVEM 1999, Hofstetter 1992).
To illustrate, Table 3 shows the results of theseaccounts for the world in more detail. On the left, itlists the average ecological footprint per personworldwide, and on the right the biologicallyproductive areas in both true hectares and globalhectares.
WATER WITHDRAWALS
The ecological footprint methodology does not takethe use of water resources into account. For thisreason, we have included separate data on waterwithdrawals per person. Withdrawals include theuse of water from sources such as rivers and lakesfor agricultural, industrial, and domestic purposes.The use of rainwater for agriculture is not included.Just as the ecological footprint may be comparedwith available biocapacity, a country’s waterwithdrawals can be compared with the size of itsannual renewable water resource. These data aregiven, per person, in Table 2. Water withdrawals arenot exactly analogous to ecological footprints,however. Whereas footprints measure consumptionof resources by the final end-user, waterwithdrawals may be an input to the production of acommodity which is exported and consumed inanother country. Some products of this sort, suchas cotton, have a very large demand for water. Thedata on water withdrawals and resource availabilityare taken from Gleick (2002).
ACKNOWLEDGEMENTS
The authors would like to thank the followingpeople for their helpful comments: Kyla Evans,Biksham Gujja, Chris Hails, Jean-Paul Jeanrenaud,Tom Loh, Tony Long, Sally Nicholson, Sian Pullen,Markus Radday, Will Reidhead, Gordon Shepherd,Magnus Sylvén, Sakiko Takada, Alex Yau. Anyerrors, however, remain the responsibility of theauthors.
We would like to thank Aeon Foundation (Japan),Columbia Foundation, Mr Andrew Fergusson,Merck Family Fund, Union Bancaire Privée, WWF-Netherlands and anonymous donors for theirgenerous support of the ecological footprintanalysis.
We gratefully acknowledge Dr Peter Gleick for theuse of data from The World’s Water 2002-2003.
T E C H N I C A L N O T E S c o n t i n u e d
Table 3: THE WORLD’S ECOLOGICAL FOOTPRINT AND BIOCAPACITY, 1999
DEMAND SUPPLYGlobal footprint per person Global biocapacity per person
Footprint Bioproductive Equivalence Biocapacity(gha/person) area (ha/person) factor (gha/ha) (gha/person)
Growing0.53 Cropland 0.25 2.11 0.53crops
Grazing 0.12 Grazing land 0.58 0.47 0.27animals
Harvesting 0.27 Forest 0.64 1.35 0.86timber
Fisheries 0.14 Fishing grounds 0.39 0.35 0.14
CO20.99
Land set aside for 0.00 1.35 0.00emissions CO2 absorption
Fuelwood 0.06 Included as forest
Nuclear0.08 not applicablepower
Hydropower 0.003 not applicable
Settlements and 0.10 Built-up area 0.05 2.11 0.10infrastructure
Total2.28
Total1.90 1.00 1.90demand supply

33LIVING PLANET REPORT 2002
biological capacity or biocapacity: The totalbiological production capacity per year of abiologically productive space, for example inside acountry. It can be expressed in “global hectares”.
biologically productive space: The land and waterarea that is biologically productive. It is land or waterwith significant photosynthetic activity. Marginal areaswith patchy vegetation and non-productive areas areexcluded.
ecological deficit: The amount by which theecological footprint of a population (e.g. a country orregion) exceeds the biological capacity of the spaceavailable to that population.
ecological footprint: A measure of how muchproductive land and water an individual, a city, acountry, or humanity requires to produce theresources it consumes and to absorb the waste itgenerates, using prevailing technology. This land could be anywhere in the world. Theecological footprint is measured in “global hectares”.
ecological overshoot: The situation when humandemand exceeds nature’s supply at the local,national, or global scale.
equivalence factor: A factor which translates aspecific land-use area (e.g., hectares of world-average cropland) into global hectares, representingbiologically productive hectares with world averageproductivity. Each year has its own set of equivalencefactors since the relative productivity of variousecosystem or land-use types varies. In a given year,all countries have the same set of equivalencefactors, since they are scaled to global productivity.See also “yield factor”.
global hectare or gha: 1 hectare of biologicallyproductive space with world-average productivity. In2002 the biosphere has 11.4 billion hectares ofbiologically productive space corresponding toroughly one quarter of the planet’s surface. These
11.4 billion hectares of biologically productive spaceinclude 2.0 billion hectares of ocean and 9.4 billionhectares of land. The land space is composed of 1.5billion hectares of cropland, 3.5 billion hectares ofgrazing land, 3.8 billion hectares of forest land, 0.3billion hectares of inland waters, and 0.3 billionhectares of built-up land. 1 global hectare is hence ahectare representing the average capacity of one ofthese 11.4 billion hectares. Thus a hectare of highlyproductive land represents more “global hectares” than the same surface of less productive land. Global hectares allow the meaningfulcomparison of the ecological footprints of differentcountries, which use different qualities and mixes ofcropland, grazing land, and forest.
trophic level: The level in the food-chain at which anorganism feeds. Primary producers such asphytoplankton or grass, using photosynthesis toconvert sunlight into biomass, are on the first trophiclevel. An antelope feeding on grass would be on thesecond trophic level; a lion would be on the third.
yield factor: A factor which describes the extent towhich a land-use category of a given country (e.g.German cropland) is more productive than the worldaverage in that same category (i.e. world averagecropland). Each country has its own set of yieldfactors. See also “equivalence factor”.
G L O S S A R Y
34 LIVING PLANET REPORT 2002
R E F E R E N C E SLPI DATA SOURCES
WWF and UNEP-WCMC gratefully acknowledgethe invaluable assistance of many researchers whocontributed species population data for the LPI.The list is too long to mention each individually, buta full list is provided at www.unep-wcmc.org
Bohn, U. and Katenina, G.D. 1994. Map of
Natural Vegetation. Scale 1:2 500 000. KomarovBotanical Institute, St Petersburg, RussianFederation.
Carnahan, J.A. n.d. Australia – Natural Vegetation.
1:5 million scale. Australian Surveying and LandInformation Group, Department of AdministrativeServices.
Crick, H.Q.P., Baillie, S.R., Balmer, D.E.,
Bashford, R.I., Dudley, C., Glue, D.E., Gregory,
R.D., Marchant, J.H., Peach, W.J., and Wilson,
A.M. 1997. Breeding Birds in the Wider
Countryside: Their Conservation Status
(1971–1995). BTO Research Report No. 187.British Trust for Ornithology, Norfolk, UK.
Crocodile Specialist Group. 1996. Status Survey
and Conservation Action Plan: Revised Action Plan
for Crocodiles 1996. J.P. Ross (ed). World WideWeb Edition. IUCN-The World Conservation Union,Gland, Switzerland.
Dinerstein, E., Olson, D.M., Graham, D.J.,
Webster, A.L., Primm, S.A., Bookbinder, M.P.,
and Ledec, G. 1995. A Conservation Assessment
of the Terrestrial Ecoregions of Latin America and
the Caribbean. Published in association with theWorld Wildlife Fund. The World Bank, Washington,DC, USA.
European Commission. 1995. Europe’s
Environment: Statistical Compendium to the Dobris
Assessment. Office for Official Publications of theEuropean Communities.
Food and Agriculture Organization of the United
Nations (FAO). 1997. State of the World's Forests
1997. FAO, Rome, Italy.
Food and Agriculture Organization of the United
Nations (FAO). 1995. Forest Resources
Assessment 1990; Global Synthesis. FAO ForestryPaper 124. FAO, Rome, Italy.
Gaston, K.J. (ed).1996. Biodiversity: A Biology
of Numbers and Difference. Blackwell Science,Oxford, UK.
Groombridge, B. 1987. The distribution and statusof world crocodilians. In: Webb, G.J.W., Manolis,S.C., and Whitehead, P.J. (eds). 1987. Wildlife
Management: Crocodiles and Alligators. SurreyBeatty & Sons Pty Limited, New South Wales,Australia.
Groombridge, B. (ed). 1982. The IUCN Amphibia-
Reptilia Red Data Book Part 1: Testudines,
Crocodylia and Rhynchocephalia. IUCN, Gland,Switzerland.
Houlahan, J.E., Findlay, C.S., Schmidt, B.R.,
Meyer, A.H., and Kuzmin, S.L. 2000. Quantitativeevidence for global amphibian population declines.Nature 404: 752-755.
Kool, K.M. 1992. The status of endangered primatesin Gunung Halimun Reserve, Indonesia. Oryx 26: 29.
Kuusela, K. 1994. Forest Resources in Europe,
1950-1990. European Forest Research InstituteResearch Report 1. Cambridge University Press,Cambridge, UK.
Marquéz, R., et al. 1999. Results of the Kemp'sridley nesting beach conservation efforts in Mexico.Marine Turtle Newsletter 85: 2-4.
Milanova, E.V. and Kushlin, A.V. (eds). 1993. World Map of Present-Day Landscapes. An
Explanatory Note. Prepared by Moscow StateUniversity and the United Nations EnvironmentProgramme.
Nijman, V. and van Balen, S. 1998. A faunalsurvey of the Dieng Mountains, Central Java,Indonesia: Distribution and conservation ofendemic primate taxa. Oryx 32: 145.
Nowak, R.M. and Paradiso, J.L. 1983. Walker's
Mammals of the World. Vols. 1 and 2. 4th edition.Johns Hopkins University Press, Baltimore, MD,USA.
Ransom Myers fish population database online(http://www.mscs.dal.ca/~myers/about_site.html).
Scott, D.A. and Rose, P.M. 1996. Atlas of
Anatidae Populations in Africa and Western
Eurasia. Wetlands International Publication No. 41,Wetlands International, Wageningen, Netherlands.
Singh, K.D. and Marzoli, A. 1995. Deforestation
Trends in the Tropics: A Time Series Analysis.Paper presented at WWF Conference on thePotential Impacts of Climate Change on TropicalForests, Puerto Rico, April 1995.
Spalding, M.D., Blasco, F., and Field, C.D. (eds).1997. World Mangrove Atlas. The InternationalSociety for Mangrove Ecosystems, Okinawa, Japan.
Thorbjarnson, J. 1992. Crocodiles. An Action Plan
for their Conservation. Messel, H., King, F.W., andRoss, J.P. (eds). IUCN-The World ConservationUnion, Gland, Switzerland.
White, F. 1983. The Vegetation of Africa.
UNESCO, Paris, France.
World Conservation Monitoring Centre. 2000.Global Biodiversity: Earth’s Living Resources in the
21st Century. Groombridge, B. and Jenkins, M.D.World Conservation Press, Cambridge, UK.
World Conservation Monitoring Centre. 1992.Global Biodiversity: Status of the Earth’s Living
Resources. Chapman and Hall, London, UK.
ECOLOGICAL FOOTPRINT DATA SOURCES
British Petroleum. 2001. Statistical Review of
World Energy 2001. See www.bp.com/centres/energy/world_stat_rev/index.asp
Council for Agricultural Science and Technology
(CAST). 1999. Animal Agriculture and Global Food
Supply. Ames, Iowa, USA.
Dixon, R.K. et al. 1994. Carbon pools and flux of global forest ecosystems. Science 263: 185-190.
Ecosystems of the World. 1988. Fish Populationsand Fisheries. Vol. 27(6). Elsevier SciencePublishing Company Inc., New York, USA.
Eurostat. 2000. Towards Environmental
Pressure Indicators for the EU. EuropeanCommission.
Food and Agriculture Organization of the
United Nations (FAO). 2001. FAOSTAT 2001 CD-
ROM (FAO Statistical Databases). FAO, Rome, Italy,or see http://apps.fao.org
Food and Agriculture Organization of the
United Nations (FAO). 2000a. Forest Resource
Assessment 2000. FAO Forestry Department,Rome, Italy.
Food and Agriculture Organization of the
United Nations (FAO). 2000b. FISHSTAT Plus. FAO Fisheries Department, Rome, Italy.
Food and Agriculture Organization of the
United Nations (FAO). 2000c. Agriculture:
Towards 2015/2030, Technical Interim Report.
FAO, Rome, Italy.

35LIVING PLANET REPORT 2002
Food and Agriculture Organization of the United
Nations (FAO). 1997a. State of the World's
Fisheries and Aquaculture (SOFIA) 1996. FAOFisheries Department, Rome, Italy.
Food and Agriculture Organization of the United
Nations (FAO). 1997b. State of the World’s
Forests 1997. FAO, Rome, Italy.
Food and Agriculture Organization of the United
Nations (FAO). 1995. World Livestock Production
Systems: Current status, issues and trends. FAO,Rome, Italy.
Food and Agriculture Organization of the United
Nations (FAO)/International Institute for Applied
Systems Analysis (IIASA). 2000. Global Agro-
Ecological Zones (GAEZ) CD-ROM, or seewww.fao.org/ag/agl/agll/gaez/index.htm
Food and Agriculture Organization of the United
Nations (FAO)/United Nations Economic
Commission for Europe (UNECE). 2000.Temperate and Boreal Forest Resource Assessment
2000. UNECE/FAO, Geneva, Switzerland.
Food and Agriculture Organization of the
United Nations (FAO), United States Agency
for International Development (USAID), and
World Bank. 1996. Livestock Environment
Interactions: Environmental Impact Assessment of
Livestock Production in Grassland and Mixed
Farming Systems in Temperate Zones and
Grassland and Mixed Farming Systems in Humid
and Sub-humid Tropic and Sub-tropic Zones. FAO,Rome, Italy.
Gleick, P.H. 2002. The World’s Water 2002-2003.Island Press, Washington, DC, USA.
Hofstetter, P. 1992. Personliche Energie und CO2
Bilanz. (Personal Energy and CO2 Balance).Second draft. Büro für Analyse und Okologie,Zurich, Switzerland.
Intergovernmental Panel on Climate Change
(IPCC). 2001. Climate Change 2001: The Scientific
Basis. Cambridge University Press, Cambridge, UK.
Intergovernmental Panel on Climate Change
(IPCC). 2000a. Land Use, Land-use Change,
and Forestry. Cambridge University Press,Cambridge, UK.
Intergovernmental Panel on Climate Change
(IPCC). 2000b. Special Report on Emissions
Scenarios. Cambridge University Press, Cambridge,UK.
Intergovernmental Panel on Climate Change
(IPCC). 1997. Revised 1996 IPCC Guidelines for
National Greenhouse Gas Inventories: Workbook.
Vol. 2. UK Meteorological Office: IPCC/Organisation for Economic Co-operation andDevelopment (OECD)/International Energy Agency (IEA).
International Energy Agency (IEA). 2001. CO2
Emissions from Fuel Combustion. OECD-IEA, Paris,France.
IUCN/UNEP/WWF. 1991. Caring for the Earth. A
Strategy for Sustainable Living. Gland, Switzerland.
IVEM (Interfacultaire Vakgroep Energie en
Milieukunde, Center for Energy and EnvironmentalStudies). 1999. Groningen, Netherlands.
Meadows, D.H., Meadows, D.L., and Randers, J.
1992. Beyond the Limits. Chelsea Green PublishingCompany, Post Mills, Vermont.
Pauly, D. and Christensen, V. 1995. Primaryproduction required to sustain global fisheries. Nature
374: 255-257.
Regional Wood Energy Development Program in
Asia (RWEDPA). 2000. Wood Energy Database.
FAO-RWEDP, see www.rwedp.org
Scarnecchia, D. 1985. The animal unit and animal-unit-equivalent concepts in range science. Journal of
Range Management 38(4): 346-349.
Stockholm Environment Institute (SEI). 1998.Conventional Worlds: Technical Description of
Bending the Curve Scenarios (Tellus POLSTAR).Boston, USA.
United Nations. 1998. 1996 International Trade
Statistics Yearbook. Vol. 1. Department for Economicand Social Information and Policy Analysis, StatisticalDivision, New York, USA.
World Resources Institute (WRI). 2000. World
Resources 2000-2001 – People and Ecosystems:
The Fraying Web of Life. Washington DC, USA.

T H E W W F N E T W O R K
AUSTRALIAGPO Box 528, SydneyNSW 2001Tel: +61 2 9281 5515
AUSTRIAPostfach 1, 1162 ViennaTel: +43 1 488 170
BELGIUMBd Emile Jacqmain 901000 BrusselsTel: +32 2 340 09 99
BHUTANPost Box 210, Chubachu, ThimphuTel: +975 2 323 528
BOLIVIAPO Box 1633, Santa CruzTel: +591 3 311 5041
BRAZILSHIS EQ QL 6/8Conjunto E – 2˚ andar71620-430 BrasiliaTel: +55 61 364 7400
CAMEROONBastos BP 6776, Yaounde Tel: +237 221 70 83
CANADA245 Eglinton Avenue EastSuite 410, TorontoOntario M4P 3J1Tel: +1 416 489 8800
CENTRAL AFRICABP 9144, Libreville, GabonTel: +241 73 00 28
CENTRAL AMERICATurrialba7170 Catie, Costa RicaTel: +506 556 1383
CHINARoom 901, The Gateway10 Yabao RoadChaoyang DistrictBeijing 100020Tel: +86 10 6595 9891
COLOMBIACarrera 35 No 4A-25San Fernando, Cali, ValleTel: +57 2 558 2577
DANUBE/CARPATHIANMariahilfer Strasse 88a/3/9 C A-1070 Vienna, AustriaTel: +431 52 45 470
DENMARKRyesgade 3 F 2200 Copenhagen NTel: +45 35 36 36 35
EASTERN AFRICAPO Box 62440, NairobiKenyaTel: +254 2 577 355
EUROPEAN POLICY36, Avenue de Tervuren - B121040 Brussels, BelgiumTel: +32 2 743 88 00
FINLANDLintulahdenkatu 10 00500 Helsinki 50Tel: +358 9 774 0100
FRANCE188 rue de la Roquette75011 ParisTel: +33 1 55 25 84 84
GERMANYPO Box 190 44060326 Frankfurt/MainTel: +49 69 79 1440
GREECE26 Filellinon St10558 AthensTel: +30 10 331 4893
HONG KONGGPO Box 12721, Hong KongTel: +852 2526 1011
HUNGARYNémetvölgyi út 78/b 1124 BudapestTel: +36 1 214 5554
INDIA172-B Lodi RoadNew Delhi 110 003Tel: +91 11 469 1760
INDOCHINAInternational PO Box 151Hanoi, VietnamTel: +84 4 733 8387
INDONESIAPO Box 5020JKTM 12700, JakartaTel: +62 21 576 1070
ITALYVia Po 25/c, 00198 RomeTel: +39 06 844 971
JAPANNihonseimei Akabanebashi Building3-1-14 ShibaMinato-ku Tokyo 105-0014Tel: +81 3 3769 1711
MACROECONOMICS FOR SUSTAINABLEDEVELOPMENT1250 24th Street, NWWashington, DC 20037-1175, USATel: +1 202 778 9752
MADAGASCARBP 738, Antananarivo 101Tel: +261 20 22 34 885
MALAYSIA49 Jalan SS23/1547400 Petaling JayaTel: +60 3 7803 3772
MEDITERRANEANVia Po 25/c00198 Rome, Italy Tel: +39 06 844 97227
MEXICOAve Mexico No 51Col Hipodromo Condesa06170 Mexico, DFTel: +525 286 5631
NEPALPost Box 7660, KathmanduTel: +977 1 41 0942
NETHERLANDSPostbus 7, 3700 AA ZeistTel: +31 30 6937 333
NEW ZEALANDPO Box 6237, WellingtonTel: +64 4 499 2930
NORWAYPostboks 6784St Olavs plass0130 OsloTel: +47 22 03 65 00
PAKISTANPO Box 5180Lahore 54600 Tel: +92 42 586 2360
PERUCasilla Postal 11-0205Lima 11Tel: +51 1 261 5300
PHILIPPINESNo 69 Masikap Extension Cor Marunong Street, Diliman1101 Quezon City Tel: +632 433 3220
RUSSIAFrom Europe:Account No WWF 232PO Box 289WeybridgeSurrey KT 13 8WJ United KingdomFrom the USA:Account No WWF 232208 East 51st StreetSuite 295New York, NY 10022, USATel: +7 095 727 0939
SOUTH AFRICAPrivate Bag X2Die BoordStellenbosch 7613Tel: +27 21 888 2800
SOUTHERN AFRICAPO Box CY 1409Causeway, Harare, ZimbabweTel: +263 4 252 533
SOUTH PACIFICPrivate Mail Bag, GPO Suva, FijiTel: +679 331 55 33
SPAINGran Via de San Francisco 8 28005 MadridTel: +34 91 354 0578
SWEDENUlriksdals Slott, 170 81 SolnaTel: +46 8 624 74 00
SWITZERLANDPostfach8010 ZürichTel: +41 1 297 21 21
TANZANIAPO Box 63117, Dar es SalaamTel: +255 22 27 00077
THAILANDPO Box 4, Klong Luang 12120Tel: +66 2 524 6129
TURKEYPK 971, Sirkeci 34436IstanbulTel: +90 212 528 2030
UNITED KINGDOMPanda HouseWeyside ParkGodalming Surrey GU7 1XRTel: +44 1483 426 444
UNITED STATES1250 24th Street NWWashington, DC 20037-1175Tel: +1 202 293 4800
WESTERN AFRICA08 BP 1776Abidjan 08 Côte d’IvoireTel: +225 22 44 87 86
ASSOCIATES
ARGENTINAFUNDACION VIDA SILVESTREDefensa 251, 6 PisoC1065 Buenos AiresTel: +54 11 4343 4086
ECUADORFUNDACION NATURACasilla 17-01-253, QuitoTel: +593 2 2503 385
NIGERIANIGERIAN CONSERVATION FOUNDATIONPO Box 74638Victoria Island, LagosTel: +234 1 2642 498
VENEZUELA FUDENAApartado Postal 70376Caracas 1071-ATel: +58 212 238 2930
WWF INTERNATIONALAvenue du Mont-BlancCH-1196 Gland, SwitzerlandTel: +41 22 364 9111Fax: +41 22 364 8836Website: www.panda.org

WWF (also known as World Wildlife Fund in the US and Canada) is one of the world’slargest and most experienced independent conservation organizations, with almost 5 million supporters and a global network active in 90 countries.
WWF’s mission is to stop the degradation of the planet’s natural environment and to build a future in which humans live in harmony with nature by: – conserving the world’s biological diversity– ensuring that the use of renewable natural resources is sustainable – promoting the reduction of pollution and wasteful consumption.
10/US$9
WWF InternationalAvenue du Mont-Blanc 1196 GlandSwitzerland
Tel: +41 22 364 9111Fax: +41 22 364 8836


