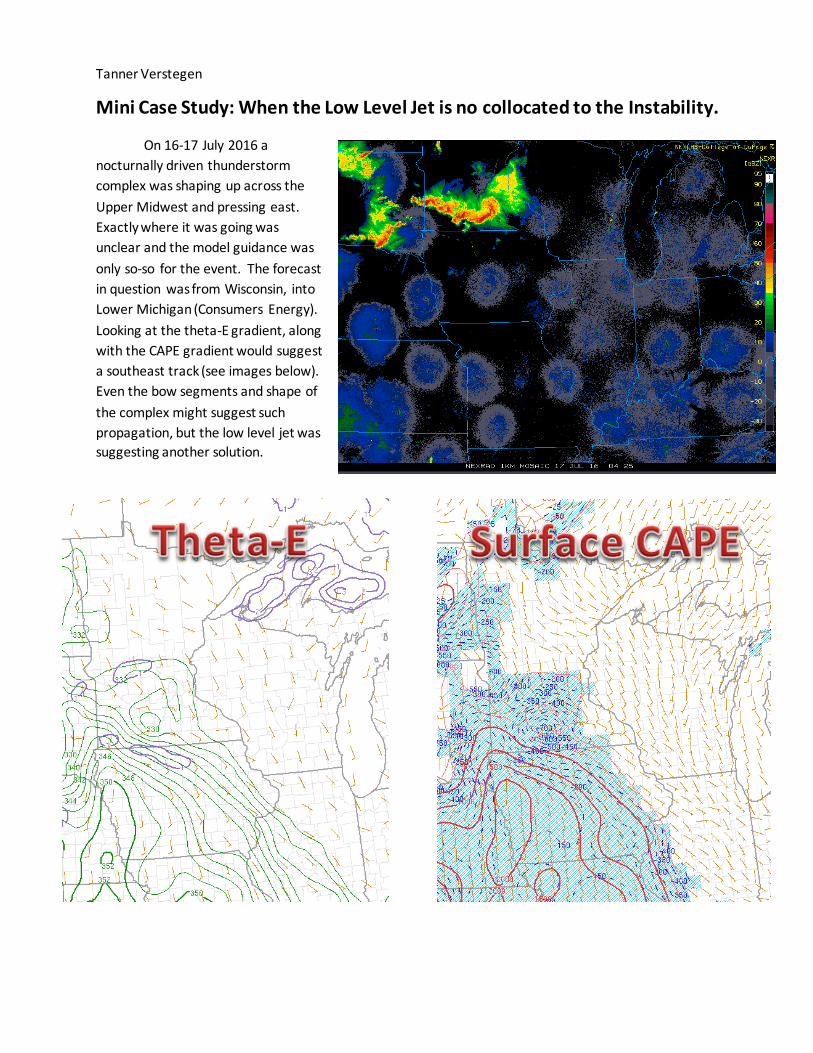
Tanner Verstegen Mini Case Study: When the Low Level Jet is no collocated to the Instability. On 16-17 July 2016 a nocturnally driven thunderstorm complex was shaping up across the Upper Midwest and pressing east. Exactly where it was going was unclear and the model guidance was only so-so for the event. The forecast in question was from Wisconsin, into Lower Michigan (Consumers Energy). Looking at the theta-E gradient, along with the CAPE gradient would suggest a southeast track (see images below). Even the bow segments and shape of the complex might suggest such propagation, but the low level jet was suggesting another solution.
Transcript
Tanner Verstegen
Mini Case Study: When the Low Level Jet is no collocated to the Instability.
On 16-17 July 2016 a
nocturnally driven thunderstorm
complex was shaping up across the
Upper Midwest and pressing east.
Exactly where it was going was
unclear and the model guidance was
only so-so for the event. The forecast
in question was from Wisconsin, into
Lower Michigan (Consumers Energy).
Looking at the theta-E gradient, along
with the CAPE gradient would suggest
a southeast track (see images below).
Even the bow segments and shape of
the complex might suggest such
propagation, but the low level jet was
suggesting another solution.
Tanner Verstegen
Models in general, did handle initialize the cluster okay, but lacked several differences. The run to run
consistency was not evident between various model runs and other models. Global models had QPF
spread vastly through the Midwest and Great Lakes and it was not clear where thunderstorms or any
strong thunderstorms would line up. See below for HRRR and HRRRx (which had been running in unison
at the time)
Tanner Verstegen
The issue with the forecast was that the nose of the low level jet (where force lift would occur) did not
align with the local maximum for instability. Based on the LLJ, the forecast for Lower Michigan had been
going EEI-2/EEI-3 wind gusts possible with thunderstorms rolling through late in the overnight hours. For
the purpose of aesthetics, the HRRR forecasted 850mb winds are attached below, along with the Storm
Prediction Center analysis at 850mb as the thunderstorms were near the Mississippi River.
Tanner Verstegen
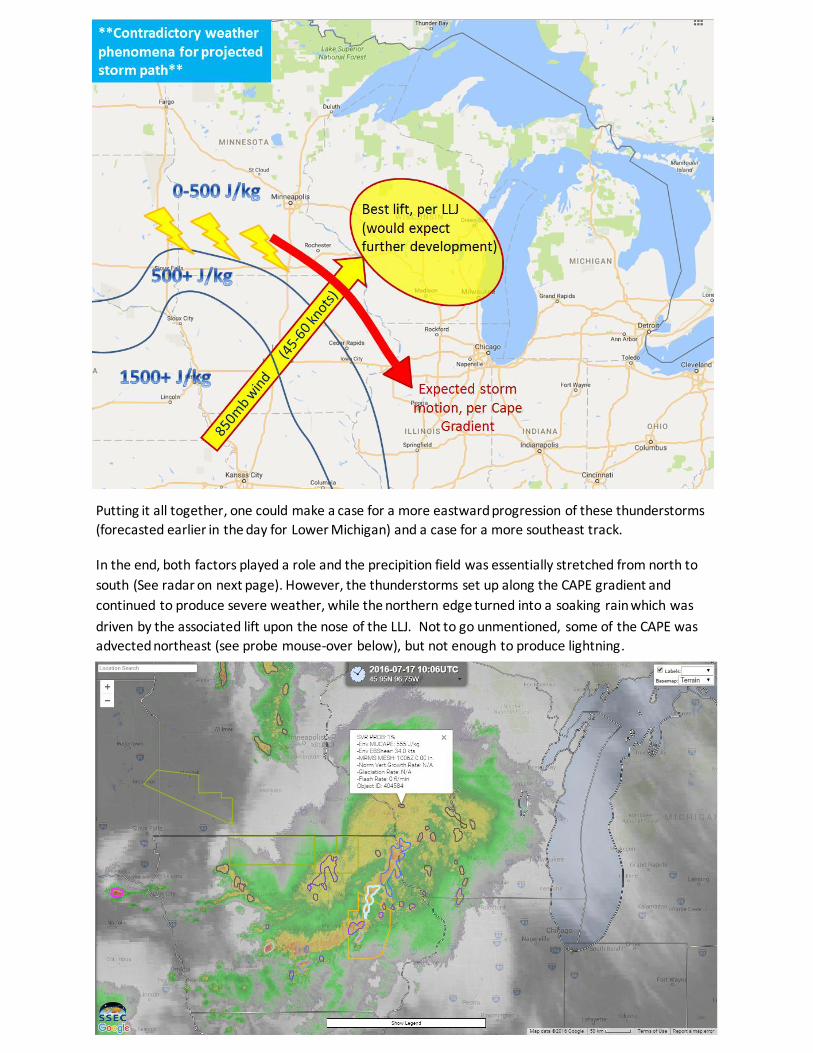
Putting it all together, one could make a case for a more eastward progression of these thunderstorms
(forecasted earlier in the day for Lower Michigan) and a case for a more southeast track.
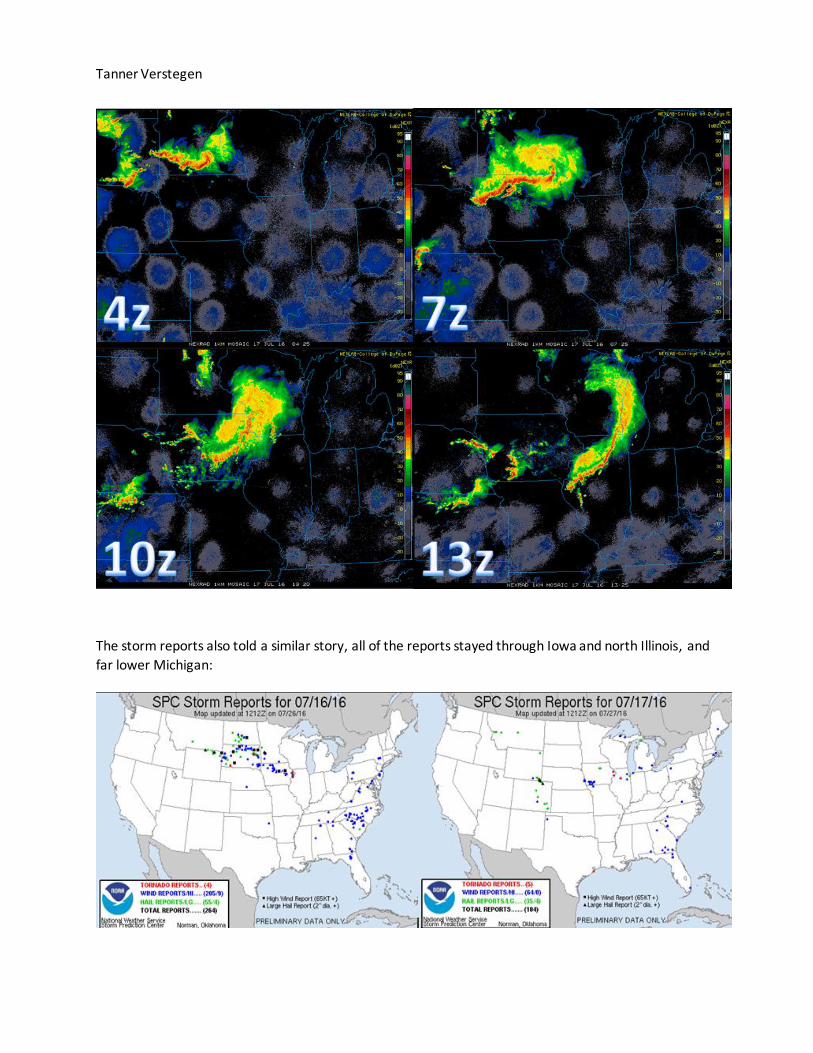
In the end, both factors played a role and the precipition field was essentially stretched from north to
south (See radar on next page). However, the thunderstorms set up along the CAPE gradient and
continued to produce severe weather, while the northern edge turned into a soaking rain which was
driven by the associated lift upon the nose of the LLJ. Not to go unmentioned, some of the CAPE was
advected northeast (see probe mouse-over below), but not enough to produce lightning.
Tanner Verstegen
The storm reports also told a similar story, all of the reports stayed through Iowa and north Illinois, and
far lower Michigan:
Tanner Verstegen
Summary:
While it may seem like a subtle difference, the location of these two factors led to a more challanging
forecast by meteorologists and computer models. The take away from this study is that the
thunderstorm complex DID follow the CAPE and Theta-E gradient, NOT the location of the LLJ, but new
development on the nose of the LLJ DID occur, yet in the form of moderate rain. While the convergence
caused by the deceleration of the flow did cause ascent to create rain in Wisconsin, the lact of instability
did not allow for additional thunderstorm development in this case.
These are just findings of one case, but maybe/hopefully they can be used as a proxy or analog of a
future forecast in the future. Based on these results, a simple forecast flow chart goes as follows:


![CD o O a (-0 a a LLJ o O o CD 00 LU > U] LLJ I-LI a- o ... · CD o O a (-0 a a LLJ o O o CD 00 LU > U] LLJ I-LI a- o < LLJ —J o a U] ... c: so O to o O o o](https://static.documents.pub/doc/80x56/5ba3e7c509d3f21e368c5faa/cd-o-o-a-0-a-a-llj-o-o-o-cd-00-lu-u-llj-i-li-a-o-cd-o-o-a-0-a-a.jpg)
![~[J®® ~(]DommD Gifford D[llJ[llJ01JrnD~QJj([)rn ...indianriver.floridahealth.gov/programs-and... · ~[J®® ~(]DommD D[llJ[llJ01JrnD~QJj([)rn~ We offer free school immunizations](https://static.documents.pub/doc/80x56/5ec82a7e3d01be4e0950924f/j-dommd-gifford-dlljllj01jrndqjjrn-j-dommd-dlljllj01jrndqjjrn.jpg)


