LLNL Experimental Test Site 300 Compliance Monitoring Report for Waste Discharge Requirements 96-248 Annual/Fourth Quarter Report 2004 Richard Brown Water Guidance and Monitoring Group Operations and Regulatory Affairs Division Environmental Protection Department Lawrence Livermore National Laboratory University of California, Livermore, California 94551 UCRL-AR-125915-04-4
Lawrence Livermore National LaboratoryUniversity of California, Livermore, California 94551
UCRL-AR-125915-04-4
This work was performed under the auspices of the U.S. Department of Energy by the University of California, Lawrence Livermore National Laboratory under contract
No. W-7405-Eng-48.
UCRL-AR-125915-04-4 LLNL Experimental Test Site 300 Annual/Fourth Quarter Report 2004 Compliance Monitoring Report for WDR 96-248
WGMG05:030:ER:RB:cc i
Contents List of Abbreviations and Acronyms ................................................................................iv Executive Summary ........................................................................................................ 1 1.0 Introduction ............................................................................................................. 3 2.0 Class II Surface Water Impoundments.................................................................... 3 2.1 Compliance Monitoring Program............................................................. 3 2.2 Process Wastewater Monitoring Network ............................................... 5 2.2.1 Photographic Process Rinsewater Discharges ....................................... 5 2.2.2 Chemistry Area Wastewater Discharges................................................. 6 2.2.3 Explosives Process Area Wastewater Discharges.................................. 6 2.3 Leak Detection Monitoring Network ........................................................ 6 2.3.1 Leachate Collection and Removal Systems Monitoring .......................... 6 2.3.2 Ground Water Monitoring........................................................................ 6 3.0 Sewage Evaporation and Percolation Ponds .......................................................... 8 3.1 Compliance Monitoring Program............................................................. 8 3.2 Wastewater Monitoring ........................................................................... 9 3.3 Ground Water Monitoring........................................................................ 9 4.0 Percolation Pits ..................................................................................................... 10 References.................................................................................................................... 11
Figures 1. Location of Class II surface water impoundments and sewage evaporation and percolation ponds. ........................................................................ 4 2. Site 300 Explosives Process Area ground water compliance monitoring locations.................................................................................................................. 5 3. Site 300 sewage pond ground water and surface water compliance
UCRL-AR-125915-04-4 LLNL Experimental Test Site 300 Annual/Fourth Quarter Report 2004 Compliance Monitoring Report for WDR 96-248
WGMG05:030:ER:RB:cc ii
Appendices
Appendix A Annual Summary Plots and Tables of Surface Impoundments Process Water Monitoring Data...............................A-1
Appendix B Annual Summary Plots and Tables of Surface
Impoundments Ground Water Monitoring Data................................B-1 Appendix C Annual Summary Plots and Tables of Sewage Evaporation
and Percolation Ponds Wastewater Monitoring Data .......................C-1 Appendix D Annual Summary Plots and Tables of Sewage Evaporation
and Percolation Ponds Ground Water Monitoring Data....................D-1 Appendix E Statistical Analyses for Ground Water Data .....................................E-1 Appendix F Fourth Quarter Quality Assurance/Quality Control
Monitoring Data Discussion, Surface Impoundments Monitoring Networks .......................................................................F-1
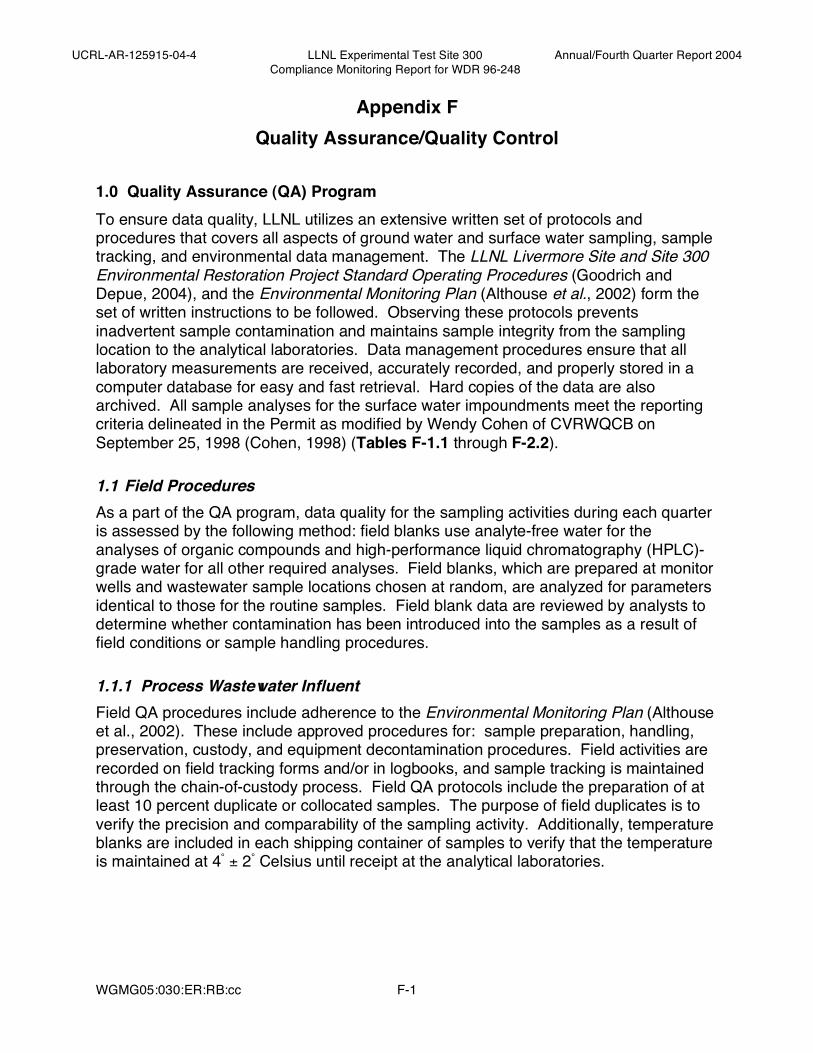
1.0 Quality Assurance (QA) Program ...................................................................F-1 1.1 Field Procedures..............................................................................F-1 1.1.1 Process Wastewater Influent ..........................................................F-1 1.1.2 Ground Water Monitoring................................................................F-2 1.2 Analytical Laboratories ...................................................................F-2
2.0 Quality Assurance and Quality Control Results ..............................................F-3 2.1 Process Wastewater Influent ...........................................................F-3 2.2 Ground Water Monitoring.................................................................F-3
UCRL-AR-125915-04-4 LLNL Experimental Test Site 300 Annual/Fourth Quarter Report 2004 Compliance Monitoring Report for WDR 96-248
WGMG05:030:ER:RB:cc iii
Appendices Tables A-1.1 Photographic process rinsewater monitoring, Building 801,
constituents of concern required by WDR 96-248.........................................A-96 A-1.2 Photographic process rinsewater monitoring, Building 823, constituents of concern required by WDR 96-248.........................................A-97 A-1.3 Photographic process rinsewater monitoring, Building 851, constituents of concern required by WDR 96-248.........................................A-98 A-2.1 Chemistry Area process wastewater monitoring, Building 827C/D,
constituents of concern required by WDR 96-248.........................................A-99 A-2.2 Chemistry Area process wastewater monitoring, Building 827E,
constituents of concern required by WDR 96-248.......................................A-100 A-2.3 Chemistry Area process wastewater monitoring, Building 827C/D,
other constituents .......................................................................................A-101 A-2.4 Chemistry Area process wastewater monitoring, Building 827E, other
constituents.................................................................................................A-102 A-3.1 Explosives Process Area wastewater monitoring, Building 806/807
constituents of concern...............................................................................A-103 A-3.2 Explosives Process Area wastewater monitoring, Building 817
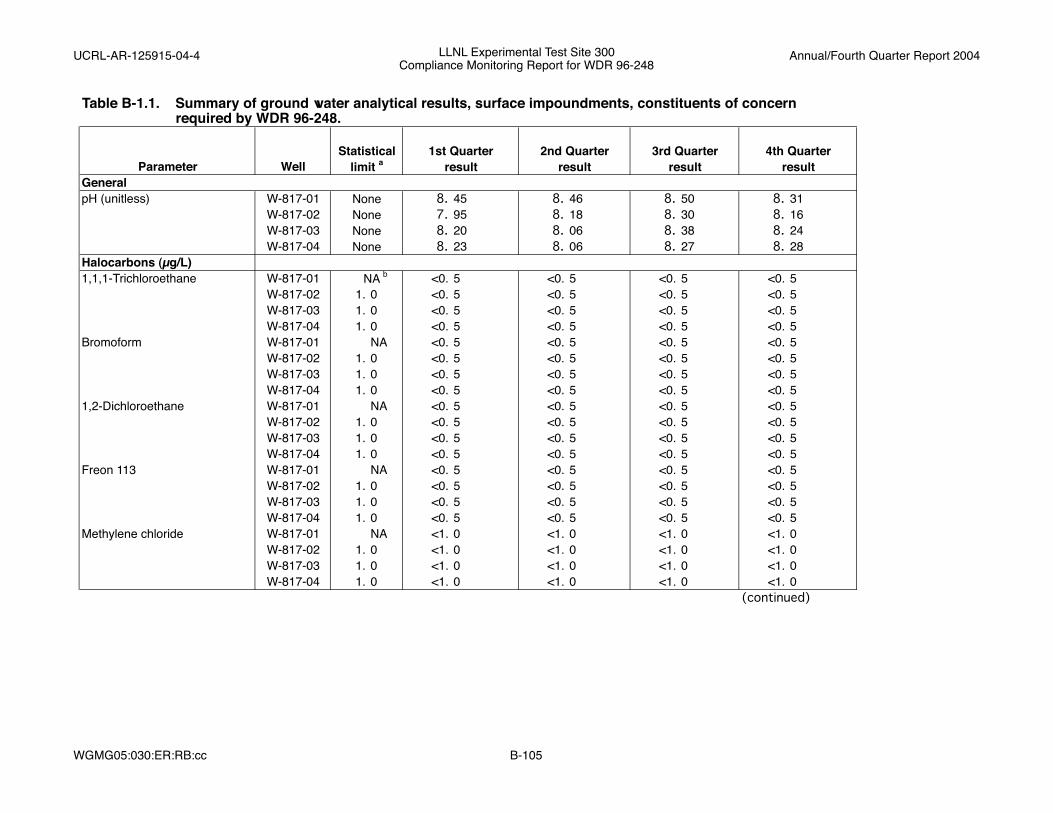
constituents of concern...............................................................................A-105 B-1.1 Summary of ground water analytical results, surface impoundments,
constituents of concern required by WDR 96-248.......................................B-105 B-1.2 Fourth quarter ground water analytical results, surface impoundments,
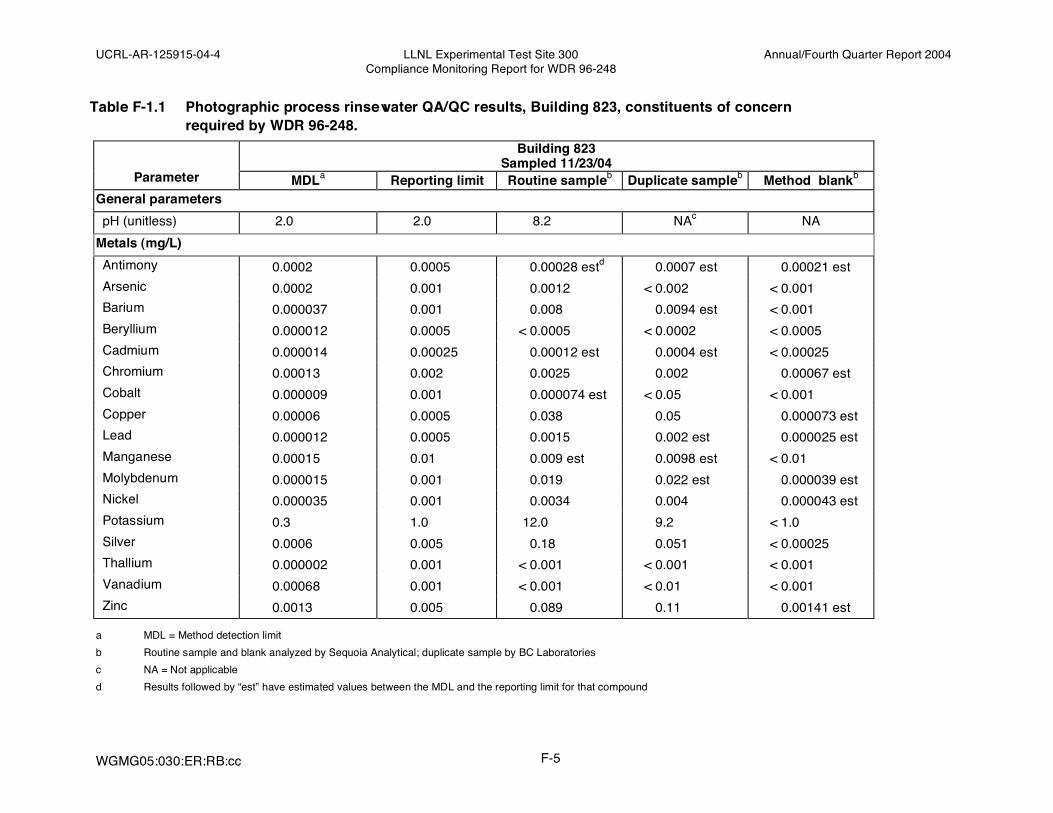
constituents of concern required by WDR 96-248.......................................B-113 B-2 Summary of ground water analytical results, surface impoundments, other constituents .......................................................................................B-121 C-1 2004 summary of sewage pond observations...............................................C-18 C-2 2004 wastewater influent monitoring results (Location ISWP) ......................C-18 C-3 2004 evaporation pond monitoring results (Location ESWP)........................C-19 C-4 2004 sewage percolation pond discharge location (Location DSWP)...........C-19 D-1 Ground water analytical results, sewage ponds, constituents of concern required by WDR 96-248 and additional constituents .................D-33 E-1 Reported COCs showing statistical evidence of release.................................E-1 F-1.1 Photographic process rinsewater QA/QC results, Building 823, constituents of concern required by WDR 96-248...........................................F-5 F-2.1 Ground water field QA/QC results, constituents of concern required by WDR 96-248 ...................................................................................................F-6 F-2.2 Ground water field QA/QC results, other constituents ....................................F-9
UCRL-AR-125915-04-4 LLNL Experimental Test Site 300 Annual/Fourth Quarter Report 2004 Compliance Monitoring Report for WDR 96-248
WGMG05:030:ER:RB:cc iv
List of Abbreviations and Acronyms BOD biochemical oxygen demand CCR California Code of Regulations CERCLA Comprehensive Environmental Response Compensation and Liability Act COC constituent of concern CVRWQCB Central Valley Regional Water Quality Control Board DMSO dimethyl sulfoxide DO dissolved oxygen DSWP sewage percolation pond influent sampling location EC electrical conductivity or specific conductance est estimated (concentration) ESWP sampling location within sewage evaporation pond HDPE high-density polyethylene HMX octahydro-1, 3, 5, 7-tetranitro-1, 3, 5, 7-tetrazocine
(also cyclo-tetramethylene-tetranitramine) HPLC high-performance liquid chromatography ISWP sewage pond influent sampling location LCRS leachate collection and removal system LCS laboratory control sample LLNL Lawrence Livermore National Laboratory m meters MDL method detection limit MPN most probable number (of bacteria) MRP Monitoring and Reporting Program MS matrix spike MSD matrix spike duplicate NA not applicable NAFL not available from laboratory ND not detected NL no limit
UCRL-AR-125915-04-4 LLNL Experimental Test Site 300 Annual/Fourth Quarter Report 2004 Compliance Monitoring Report for WDR 96-248
WGMG05:030:ER:RB:cc v
List of Abbreviations and Acronyms (concluded) NR analysis not required by permit NS not sampled PCE tetrachloroethene (tetrachloroethylene, perchloroethylene) PETN pentaerythritol tetranitrate QA quality assurance Qal Quaternary Age alluvium QC quality control RDX hexahydro-1, 3, 5-trinitro-1, 3, 5-triazine
UCRL-AR-125915-04-4 LLNL Experimental Test Site 300 Annual/Fourth Quarter Report 2004 Compliance Monitoring Report for WDR 96-248
WGMG05:030:ER:RB:cc 1
Executive Summary This report contains the elements required by Waste Discharge Requirements (WDR) 96-248 (Permit) for Site 300 for the combined 2004 fourth quarter and annual report. This is the ninth annual report prepared under this Permit. Compliance monitoring networks discussed in the report include:
• Process wastewater discharged into the Class II surface water impoundments (surface impoundment) (Section 2.2)
• Leak detection monitoring (including leachate collection and removal system monitoring, and ground water monitoring) for the surface impoundments (Section 2.3)
• Wastewater monitoring for the sewage evaporation and percolation ponds (Section 3.2)
• Ground water monitoring for the sewage evaporation and percolation ponds (Section 3.3)
• Observations at the percolation pits (Section 4.0).
The annual report elements are incorporated into this annual/fourth quarter report. Brief narrative summaries of each compliance network lead each section. These narrative summaries discuss compliance and significant incidents that occurred during 2004. Annual summaries of monitoring data are presented in graphical and tabular form in Appendices A, B, C, and D. Methods used to determine statistical test limits (SLs) for ground water constituents of concern (COCs) are summarized in Appendix E. Fourth quarter quality assurance and quality control (QA/QC) data are summarized in Appendix F.
All discharges into the surface impoundments were in compliance with the Permit during 2004.
The following damage to the surface impoundment’s high-density polyethylene (HDPE) liner was reported during 2004. The event was reported to Susan Timm of the Central Valley Regional Water Quality Control Board (CVRWQCB) in a phone call on October 14, 2004:
• On October 13, a split in the HDPE liner of the upper surface impoundment was discovered. The split was approximately 6 to 8 inches long and more than three feet above the water line. Several other weak places, or striations, in the liner were noted at the same time. During an inspection on October 25, the damaged areas were observed by Susan Timm of the CVRWQCB. Repairs to all of those locations were completed on November 30, 2004.
UCRL-AR-125915-04-4 LLNL Experimental Test Site 300 Annual/Fourth Quarter Report 2004 Compliance Monitoring Report for WDR 96-248
WGMG05:030:ER:RB:cc 2
LLNL does not expect this occurrence to adversely impact either surface or ground water at Site 300 since the cracks are located above the freeboard line and are unlikely to have contacted wastewater contained in the surface impoundment.
No liquids were discovered in the leachate collection and removal systems (LCRS) during weekly monitoring.
Required ground water monitoring parameters for the surface impoundments were below the specified SLs throughout 2004, except as identified in Table 1. Table 1. COC concentrations exceeding their SLs in 2004.
Down gradient Wells COC exceeding SL (confirmed by retest) W-817-02 W-817-03 W-817-04 Ammonia Did not exceed
SL 4th quartera
(1/27/2005)b Did not exceed SL
Bicarbonate alkalinity Did not exceed SL
Did not exceed SL
1st, 2nd, 3rd quarter (7/2/2001)b
Bis(2-ethylhexyl) phthalate
3rd quarter (10/20/2004)b
Did not exceed SL
Did not exceed SL
a Ammonia was also detected in the method blank sample. See Appendix F. b Date of original letter report to the CVRWQCB. Because sporadic detections of ammonia had occurred in ground water samples collected from up gradient well W-817-01 and from the three down gradient wells since 2001, LLNL had proposed a new SL of 0.080 mg/L for the down gradient monitor wells in 2002 (Brown 2002). The Regional Board has not yet acted to incorporate the SLs LLNL proposed in 2002. Concentrations of ammonia have remained below that proposed SL, except for occasional spikes. Concentrations of bicarbonate alkalinity have been observed sporadically above the SL of 277 mg/L in down gradient monitor well W-817-04 since the second quarter of 2001. The concentrations of bicarbonate alkalinity are consistent with the SL that LLNL proposed in 2002 (Brown 2002) and remain below that SL. Sporadic detections of the plasticizer compound bis(2-ethylhexyl)phthalate have occurred since 2000. Since the compound is a common laboratory contaminant, most of the detections have been accompanied by detections in method blank samples, and sometimes, in the ground water samples from the up gradient monitor well W-817-01. In the third quarter, bis(2-ethylhexyl)phthalate was detected in the ground water sample from the up gradient monitor well W-817-01, and is unlikely to have originated from the surface impoundments. Monitoring data indicated compliance with the limits for the ground water and wastewater at the sewage evaporation and percolation ponds. None of the permitted mechanical equipment percolation pits overflowed during 2004.
UCRL-AR-125915-04-4 LLNL Experimental Test Site 300 Annual/Fourth Quarter Report 2004 Compliance Monitoring Report for WDR 96-248
WGMG05:030:ER:RB:cc 3
1.0 Introduction This report satisfies the Site 300 Experimental Test Site (Site 300) 2004 fourth quarter and annual monitoring and reporting requirements of the Central Valley Regional Water Quality Control Board’s (CVRWQCB’s) Waste Discharge Requirements 96-248 (the Permit). It details the results of compliance monitoring networks in the Explosives Process Area and the General Services Area and visual observations at a third percolation pit system at Site 300.
The High Explosive Process Area compliance network analyzes samples of ground water beneath, and process wastewater influent discharged into, two connected Class II surface impoundments where the process wastewater is evaporated. The General Services Area network analyzes samples of ground water beneath, and wastewater discharged into, the sewage evaporation and percolation ponds (sewage ponds) where sanitary waste is treated. The percolation pit network entails visual monitoring of five percolation pits that receive mechanical equipment wastewater.
Site 300, operated by LLNL, is located in the Altamont Hills approximately 13 kilometers (8 miles) southwest of the city of Tracy, California. Figure 1 shows the locations of the surface impoundments within the Explosives Process Area and of the sewage ponds in the General Services Area of Site 300.
2.0 Class II Surface Water Impoundments 2.1 Compliance Monitoring Program The Monitoring and Reporting Program in the Permit as modified in 1998 (MRP 96-248, Revision 1) specifies the required environmental monitoring for operation of the surface impoundments (Cohen 1998). These specifications include monitoring of process wastewater discharges to the surface impoundments and leak detection systems.
Process wastewater discharged to the surface impoundments is monitored for constituents found (or likely to be found) in materials used in operations conducted at buildings discharging to the surface impoundments. The monitoring program includes collecting and analyzing samples from: photographic process rinsewater from Buildings 801, 823, and 851 (Tables A-1.1, A-1.2, and A-1.3); Chemistry wastewater from Buildings 825, 826, and the Building 827 Complex (827A, 827C/D, and 827E) (Tables A-2.1 through A-2.4); and Explosives Process wastewater from Buildings 806/807, 809, and 817 (Tables A-3.1, and A-3.2). Discharges to the surface impoundments from Buildings 801 and 851 were discontinued after the first quarter of 2004; photographic rinsewater from those processes is now evaporated.
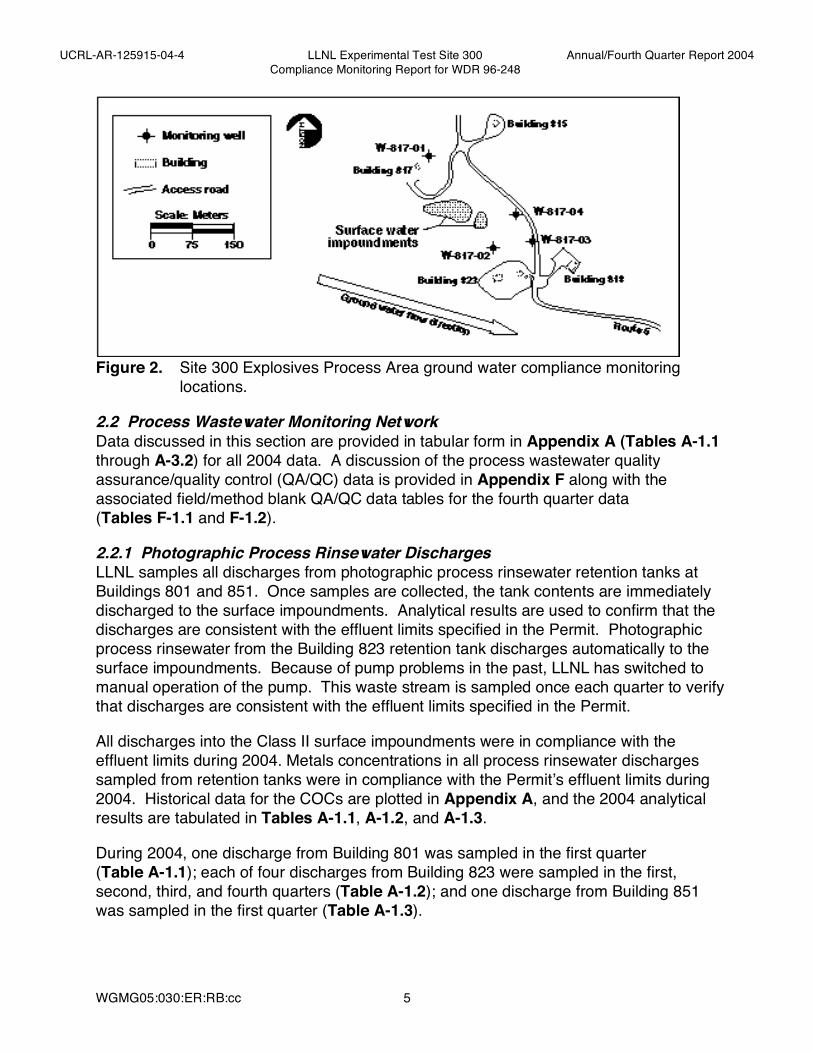
Leak detection system monitoring includes monitoring of the leachate collection and removal systems (LCRSs) and ground water. LCRSs installed between the clay liners of the surface impoundments are inspected weekly for the presence of moisture that might indicate a leak in the HDPE liner. Ground water samples are collected quarterly from monitor wells located up gradient and down gradient of the surface impoundments (Figure 2).
UCRL-AR-125915-04-4 LLNL Experimental Test Site 300 Annual/Fourth Quarter Report 2004 Compliance Monitoring Report for WDR 96-248
WGMG05:030:ER:RB:cc 4
Figure 1. Location of Class II surface water impoundments and sewage
evaporation and percolation ponds.
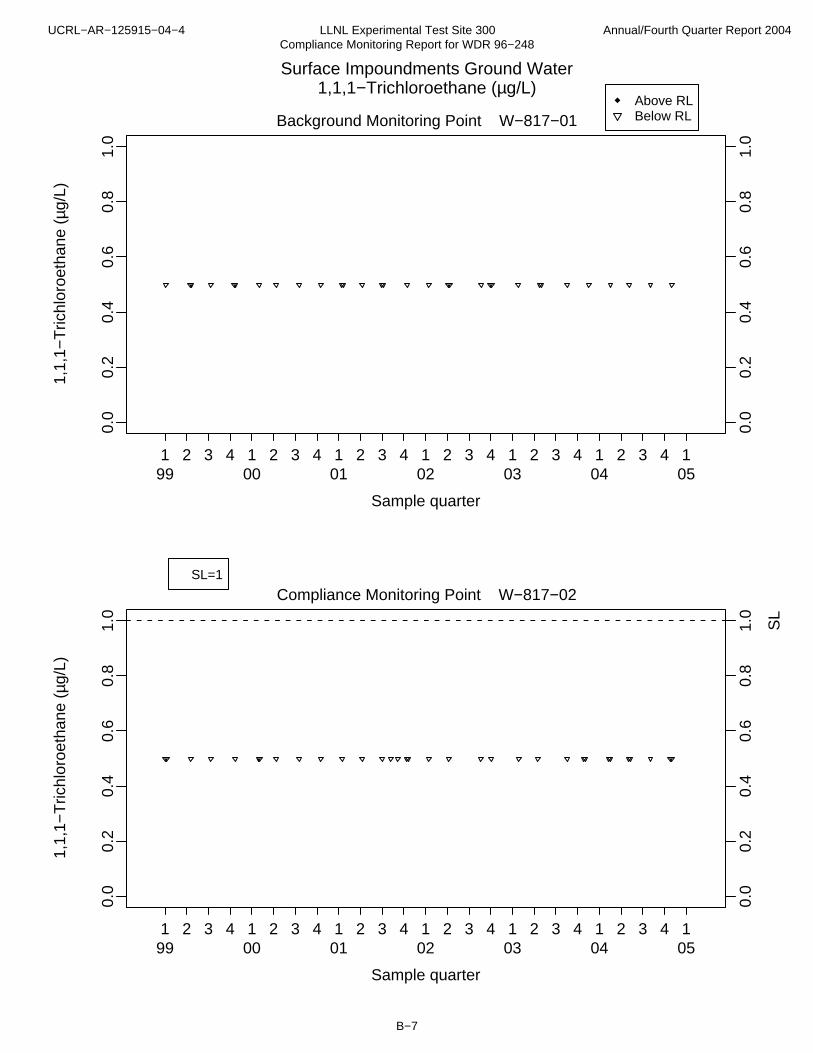
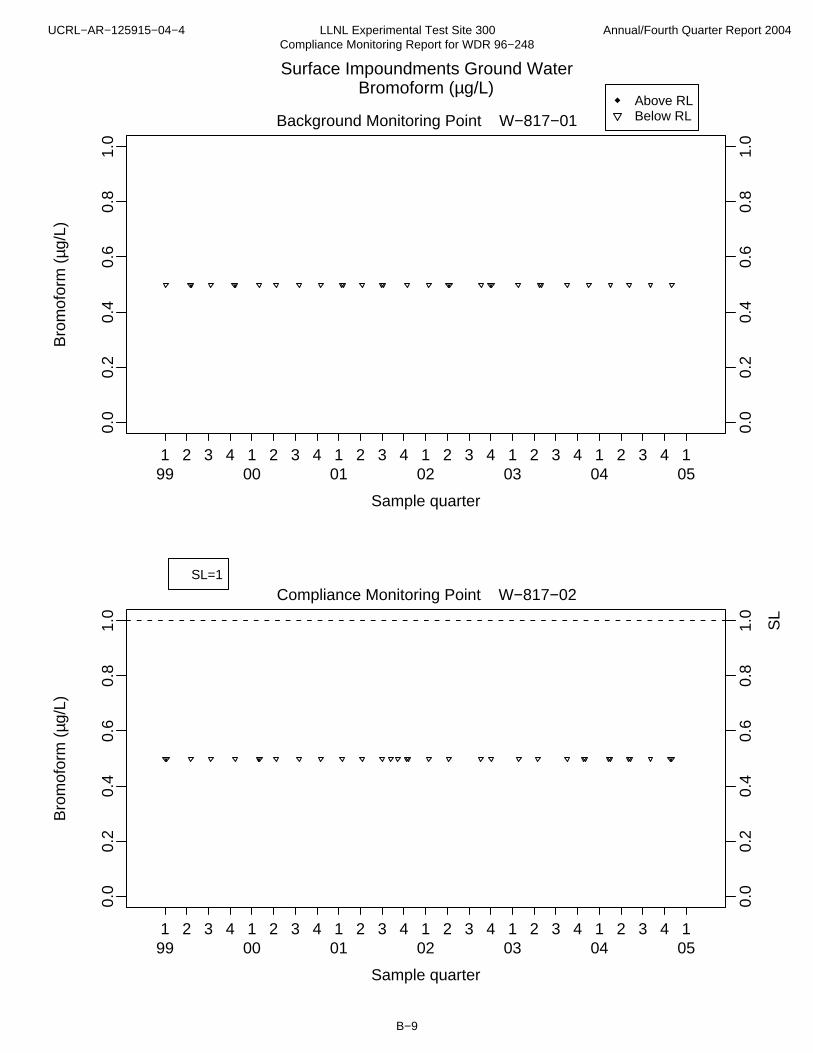
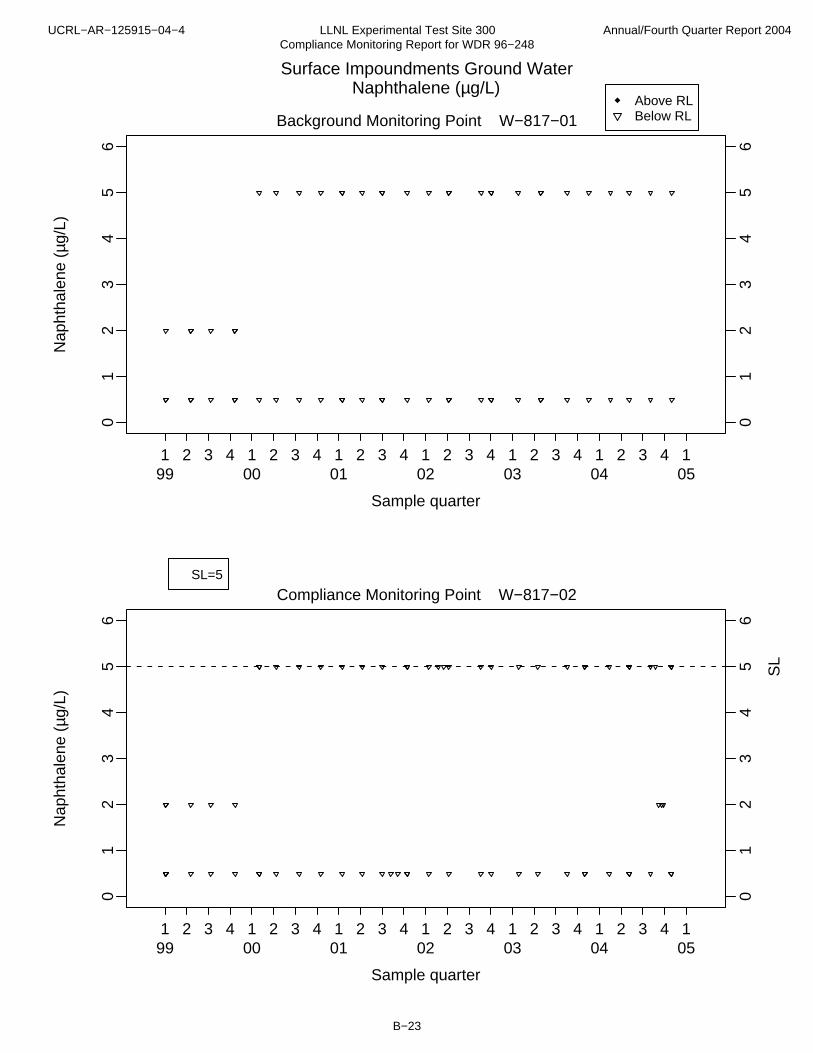
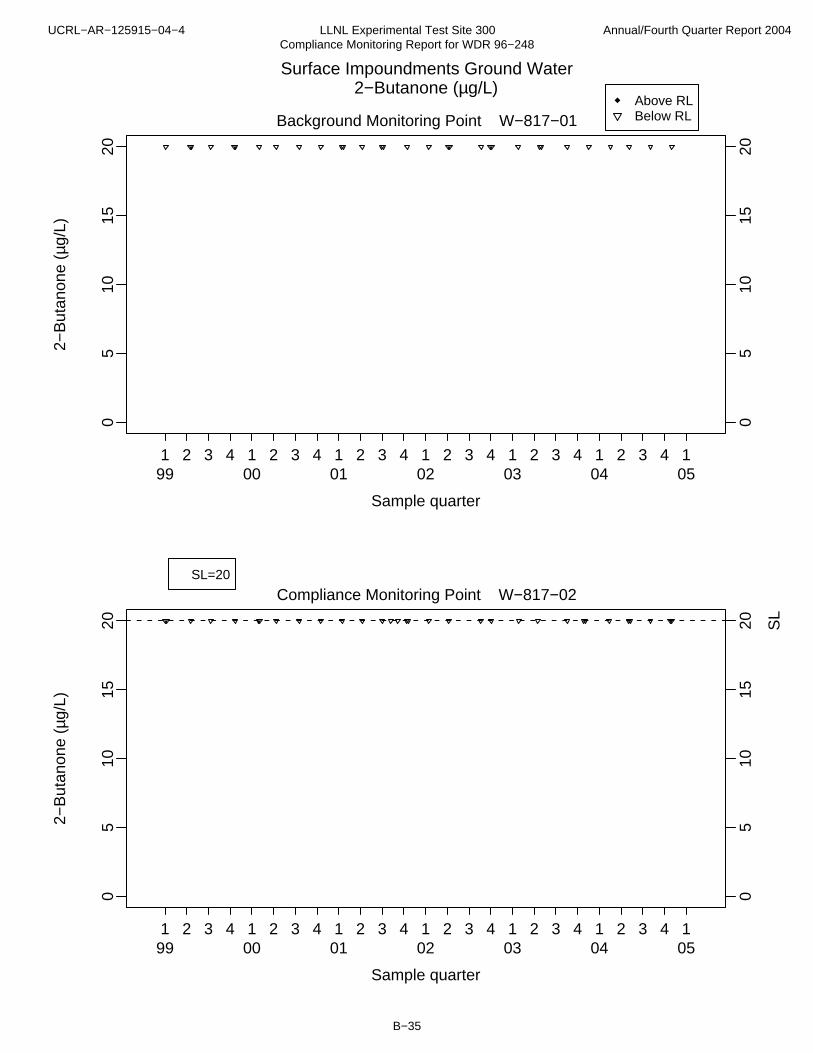
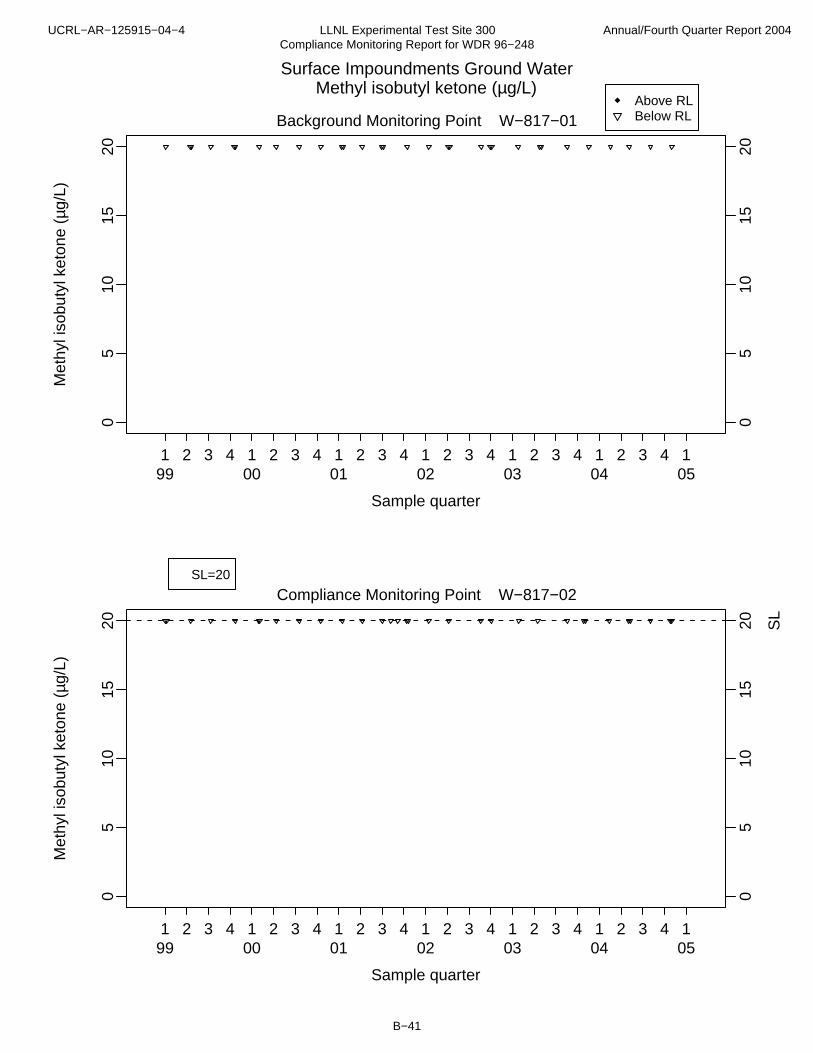
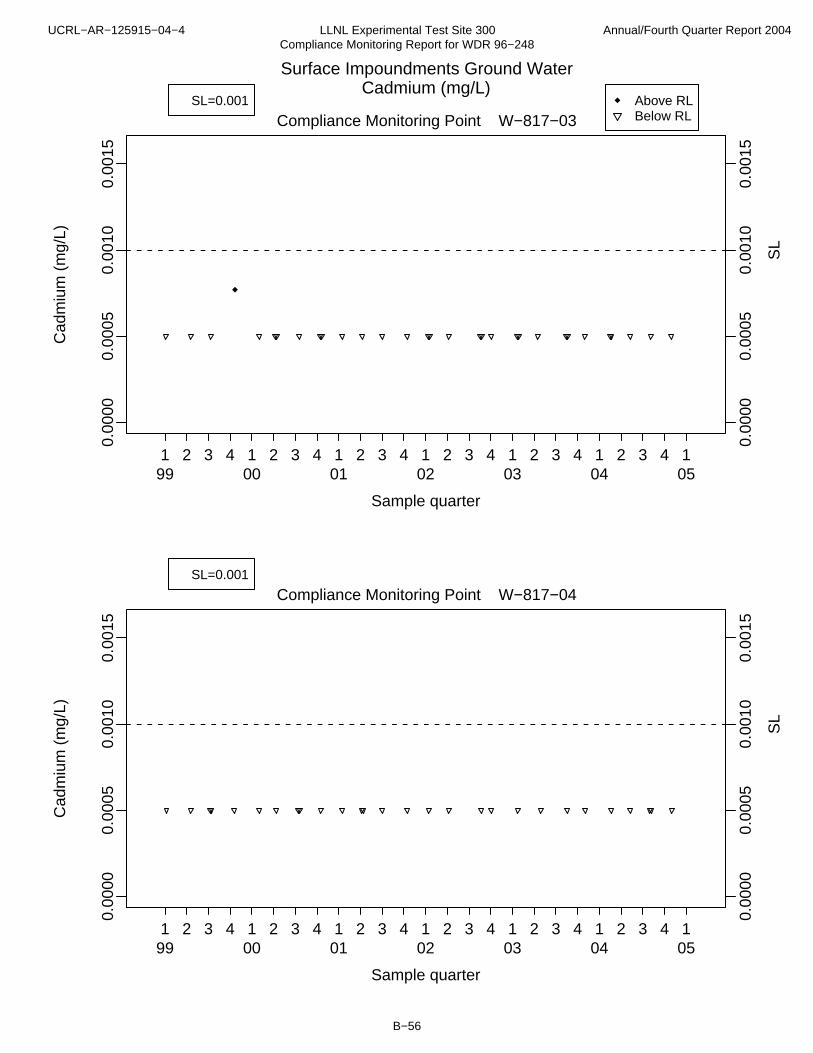
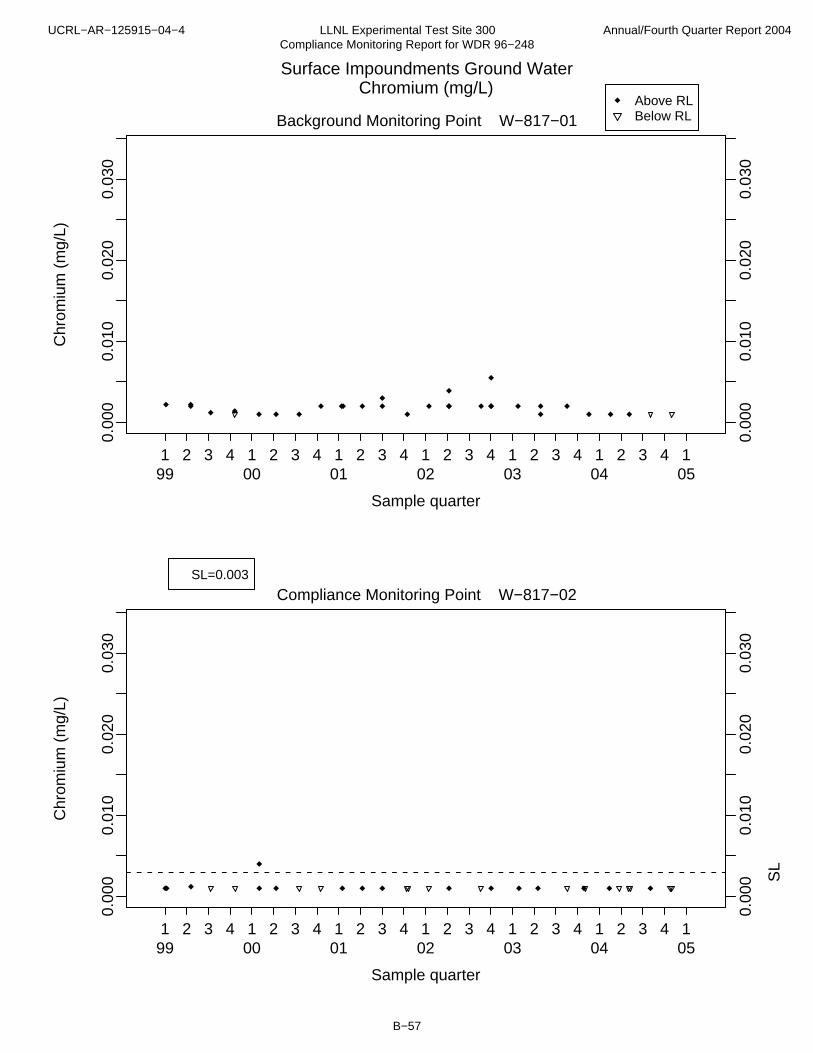
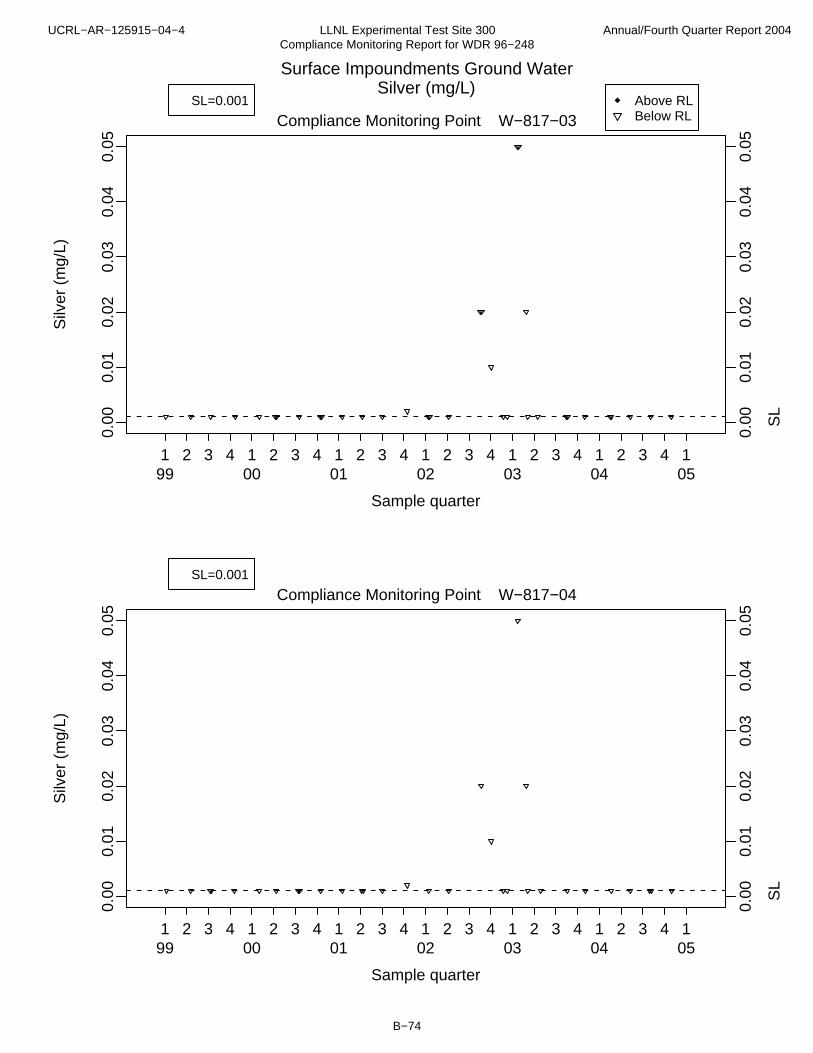
Ground water analytical results are compared with statistical test limits (SLs) to identify statistical evidence of a release of chemicals into the ground water from the surface impoundments.
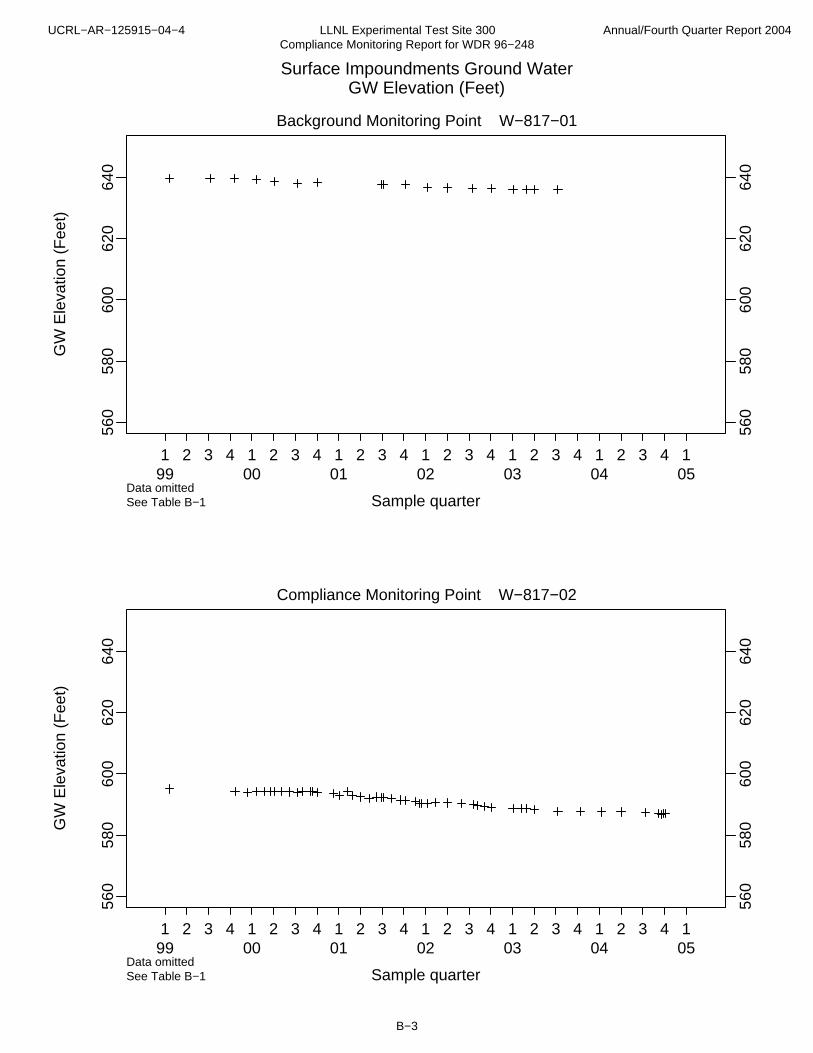
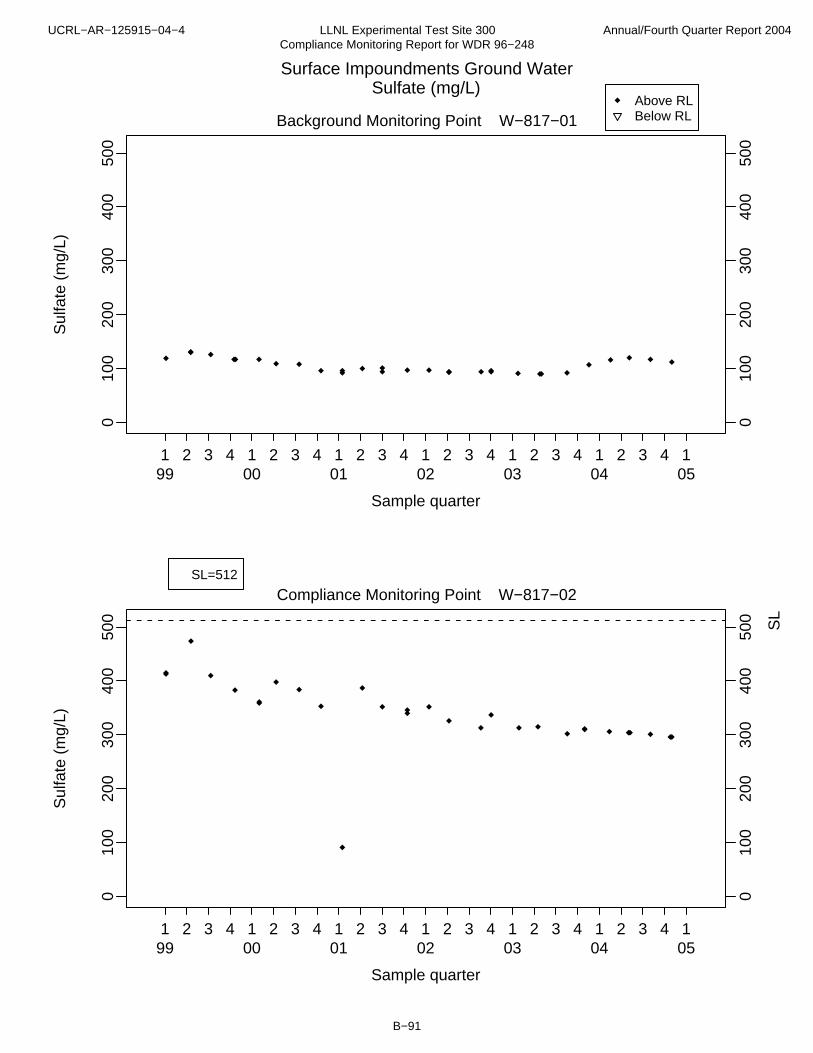
The four ground water monitor wells are screened in the Tertiary Age, Neroly Formation Upper Blue Sandstone (Tnbs2). The direction of ground water flow is approximately southeasterly. Monitor well W-817-01 is hydrologically up gradient of the surface impoundments, and monitor wells W-817-02, W-817-03, and W-817-04 are down gradient. LLNL collects ground water samples quarterly from these monitor wells and analyzes them for the COCs specified in MRP 96-248, Revision 1 (Cohen 1998).
UCRL-AR-125915-04-4 LLNL Experimental Test Site 300 Annual/Fourth Quarter Report 2004 Compliance Monitoring Report for WDR 96-248
WGMG05:030:ER:RB:cc 5
Figure 2. Site 300 Explosives Process Area ground water compliance monitoring locations.
2.2 Process Wastewater Monitoring Network Data discussed in this section are provided in tabular form in Appendix A (Tables A-1.1 through A-3.2) for all 2004 data. A discussion of the process wastewater quality assurance/quality control (QA/QC) data is provided in Appendix F along with the associated field/method blank QA/QC data tables for the fourth quarter data (Tables F-1.1 and F-1.2).
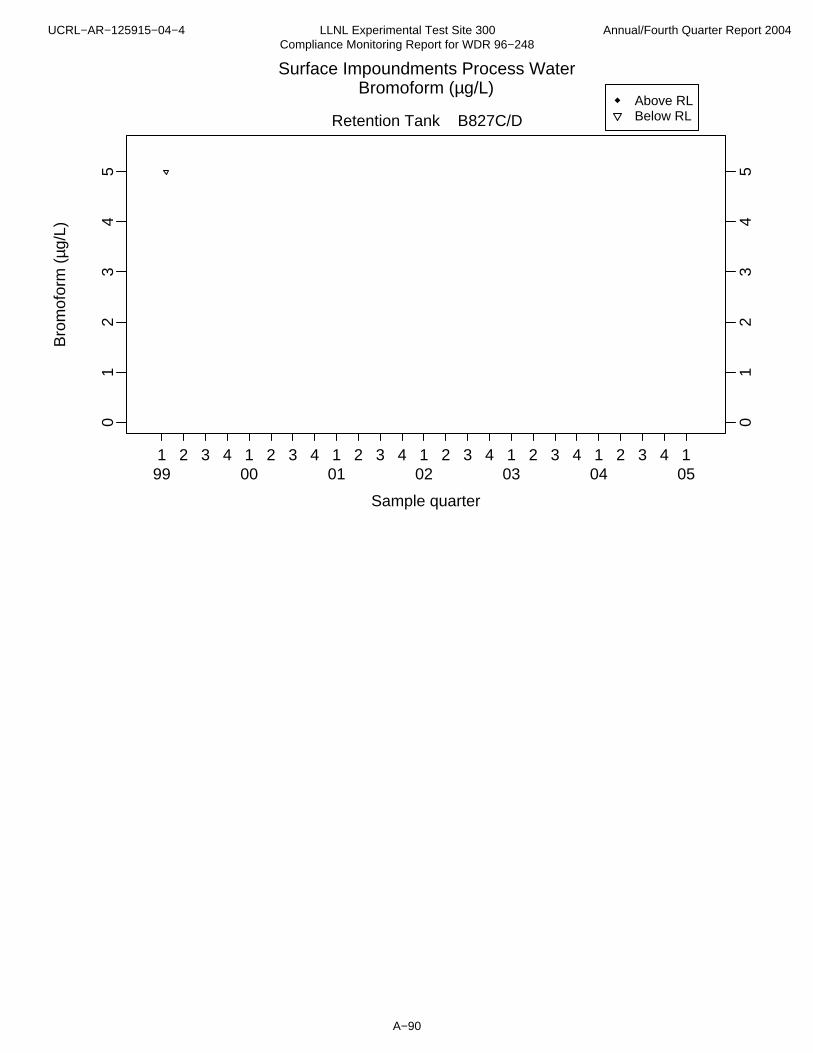
2.2.1 Photographic Process Rinsewater Discharges LLNL samples all discharges from photographic process rinsewater retention tanks at Buildings 801 and 851. Once samples are collected, the tank contents are immediately discharged to the surface impoundments. Analytical results are used to confirm that the discharges are consistent with the effluent limits specified in the Permit. Photographic process rinsewater from the Building 823 retention tank discharges automatically to the surface impoundments. Because of pump problems in the past, LLNL has switched to manual operation of the pump. This waste stream is sampled once each quarter to verify that discharges are consistent with the effluent limits specified in the Permit.
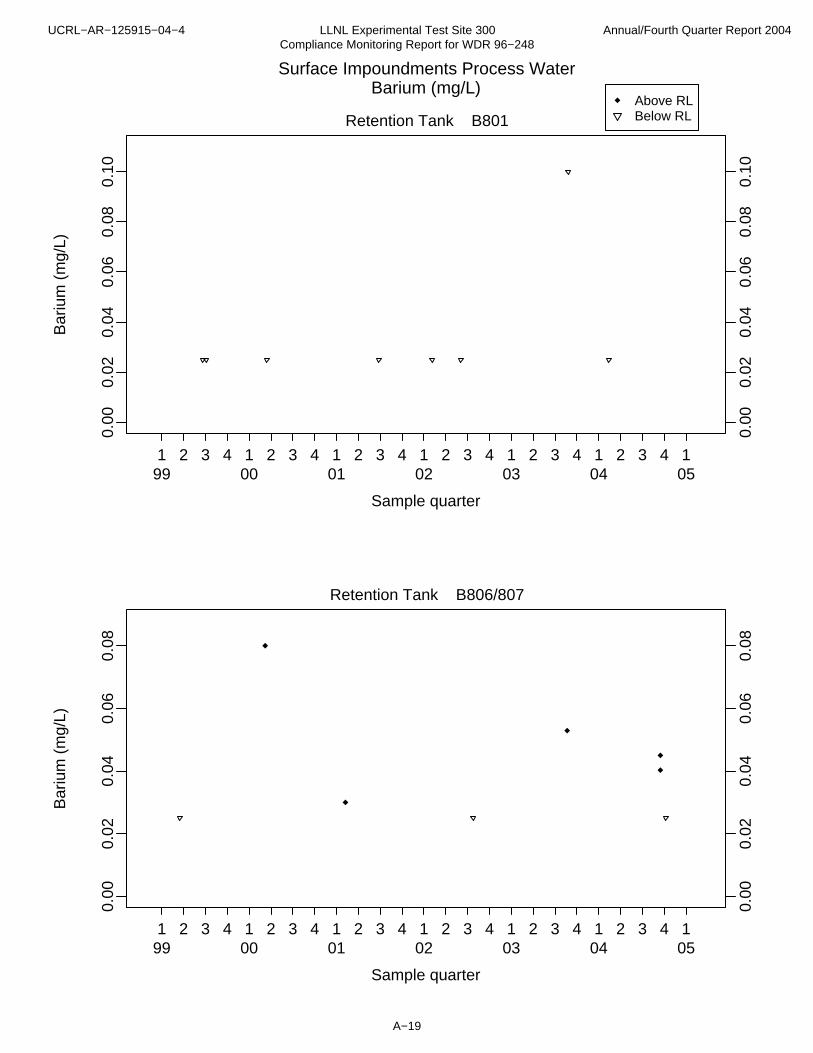
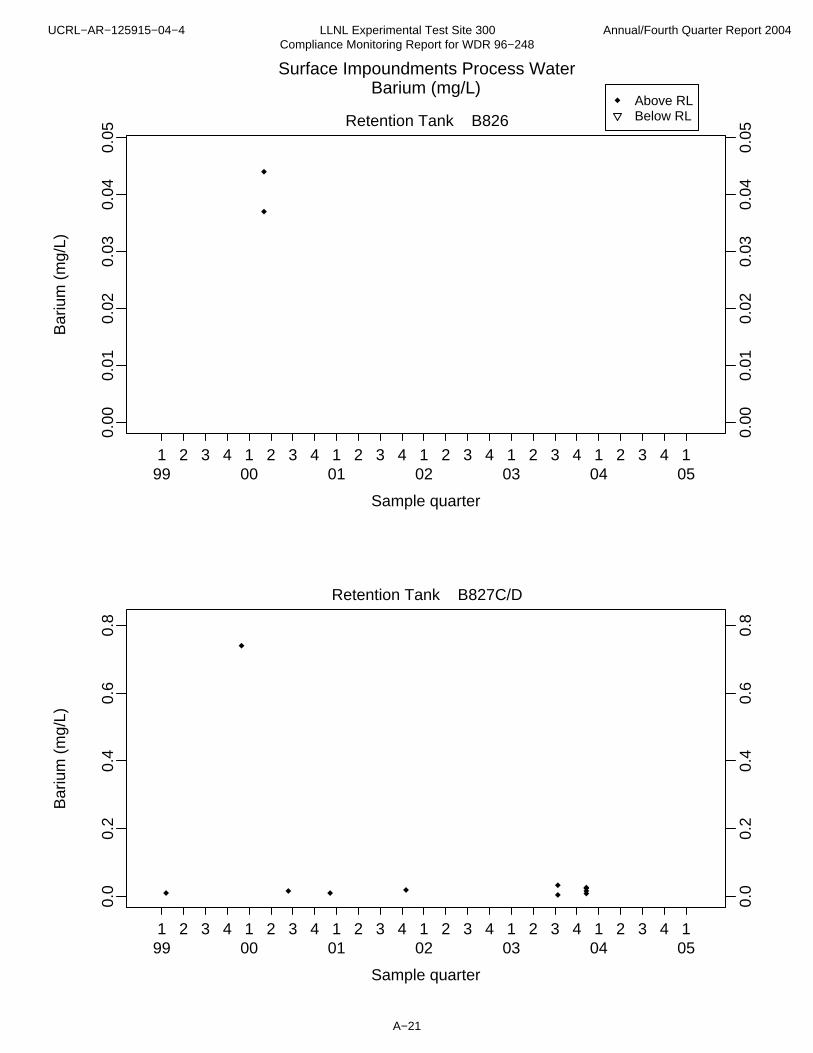
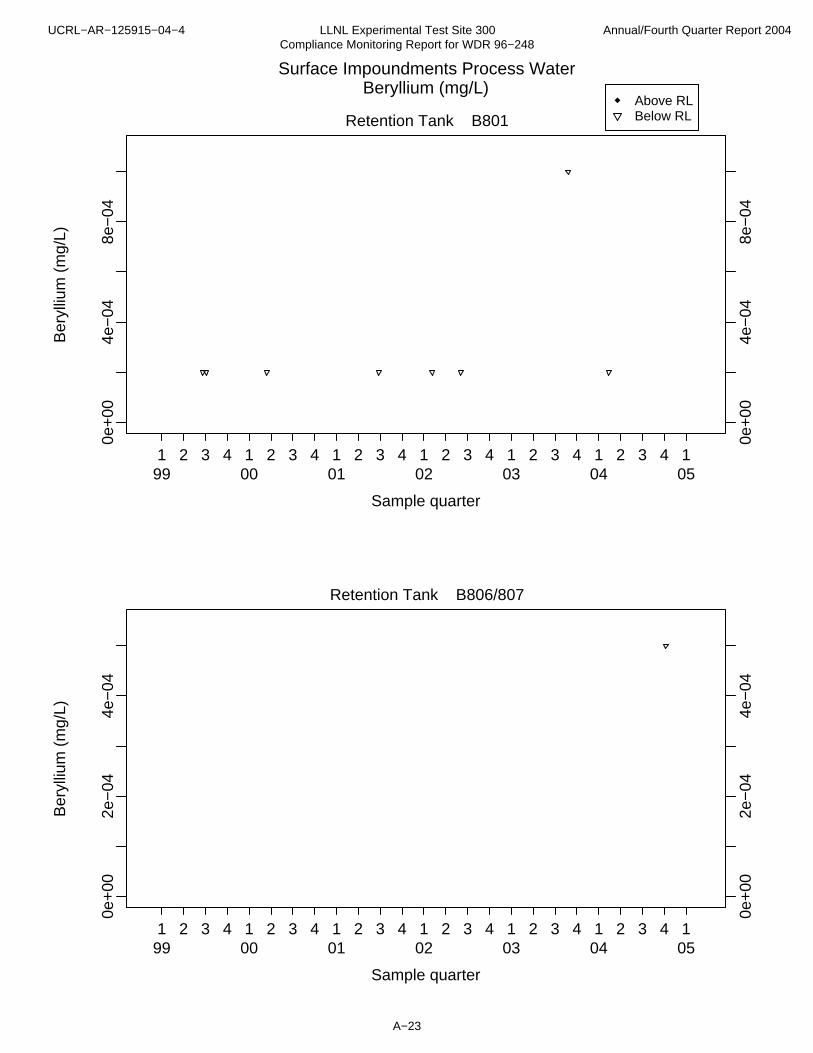
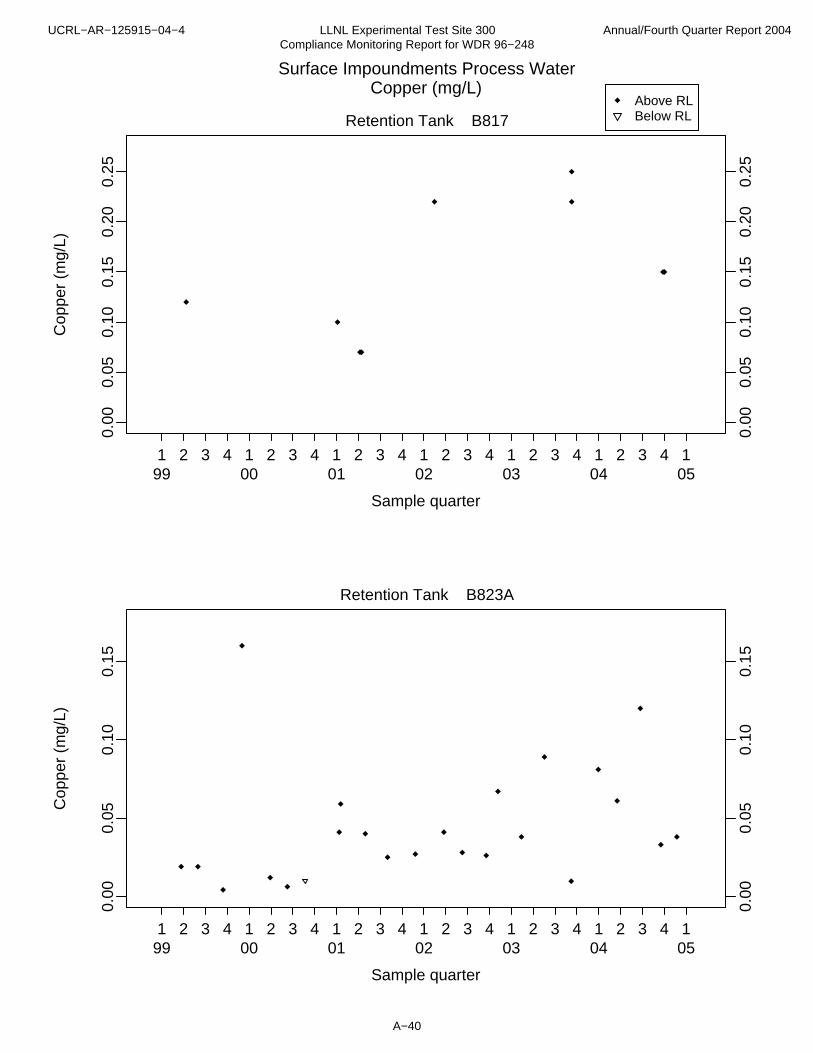
All discharges into the Class II surface impoundments were in compliance with the effluent limits during 2004. Metals concentrations in all process rinsewater discharges sampled from retention tanks were in compliance with the Permit’s effluent limits during 2004. Historical data for the COCs are plotted in Appendix A, and the 2004 analytical results are tabulated in Tables A-1.1, A-1.2, and A-1.3.
During 2004, one discharge from Building 801 was sampled in the first quarter (Table A-1.1); each of four discharges from Building 823 were sampled in the first, second, third, and fourth quarters (Table A-1.2); and one discharge from Building 851 was sampled in the first quarter (Table A-1.3).
UCRL-AR-125915-04-4 LLNL Experimental Test Site 300 Annual/Fourth Quarter Report 2004 Compliance Monitoring Report for WDR 96-248
WGMG05:030:ER:RB:cc 6
2.2.2 Chemistry Area Wastewater Discharges Process wastewater generated from the Chemistry Area (Buildings 825, 826, and the Building 827 Complex) is held in retention tanks until evaluation of the analytical results from the samples collected indicates compliance with the Permit’s effluent limits. Data are reported for the quarter when the discharge to the surface impoundments occurs, although wastewater samples may actually be collected in an earlier quarter.
Constituent concentrations in all process wastewater discharges that occurred during 2004 from the Building 827 Complex were in compliance with the effluent limits. No discharges occurred from the retention tanks at Buildings 825, 826, or 827A during the year. Analytical results for the Chemistry Area wastewater samples including COCs and additional analytes are presented in Tables A-2.1 through A-2.4. Historical data plots are included in Appendix A. 2.2.3 Explosives Process Area Wastewater Discharges Wastewater generated from the Explosives Process Area (Buildings 806/807, 809, and 817) is sampled annually in accordance with MRP 96-248, Revision 1 (Cohen 1998).
The concentrations of COCs in process wastewater discharges sampled during 2004 from the Explosives Process Area were in compliance with the effluent limits. Process discharges associated with Buildings 806/807 were sampled once during the third quarter, and discharges associated with Building 817 were also sampled once during the third quarter. There were no discharges associated with Building 809; there have been no processes operating at Building 809 since construction activities began there in May 2001. Although construction has been completed, Building 809 will be offline until the final certification for the new isostatic press and ovens is complete. Annual analytical results of Explosives Process Area wastewater discharge samples are presented in Tables A-3.1 and A-3.2. Historical data plots are included in Appendix A.
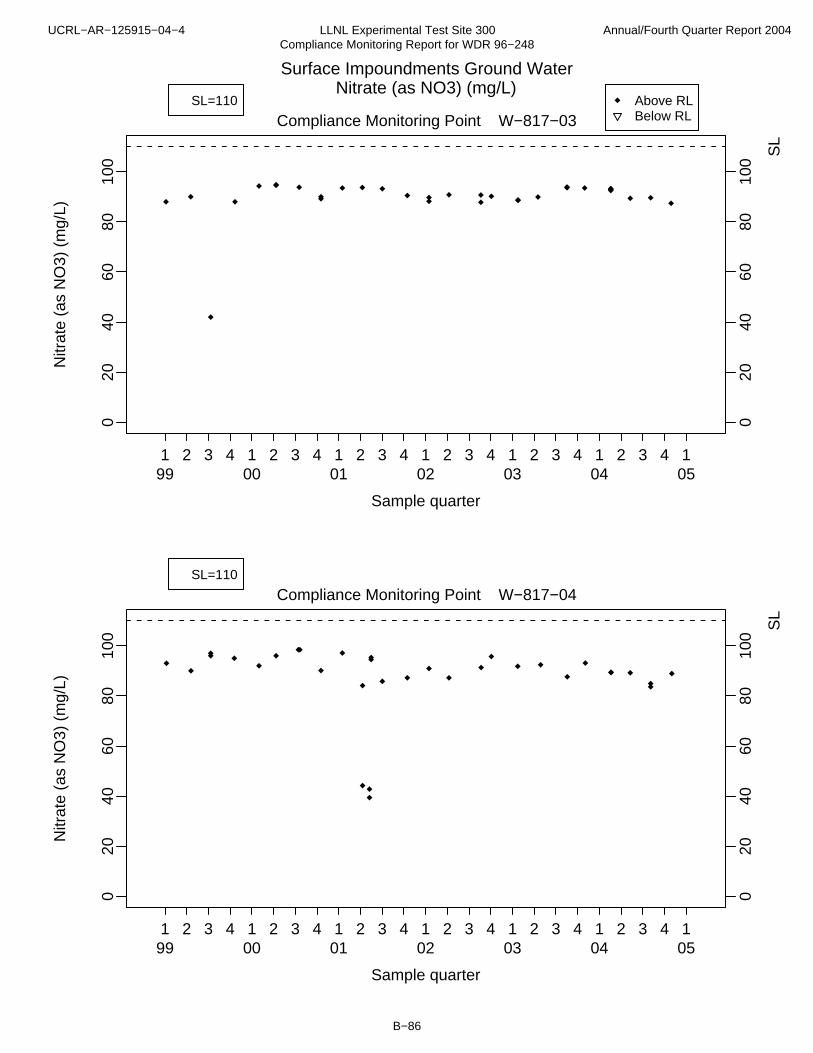
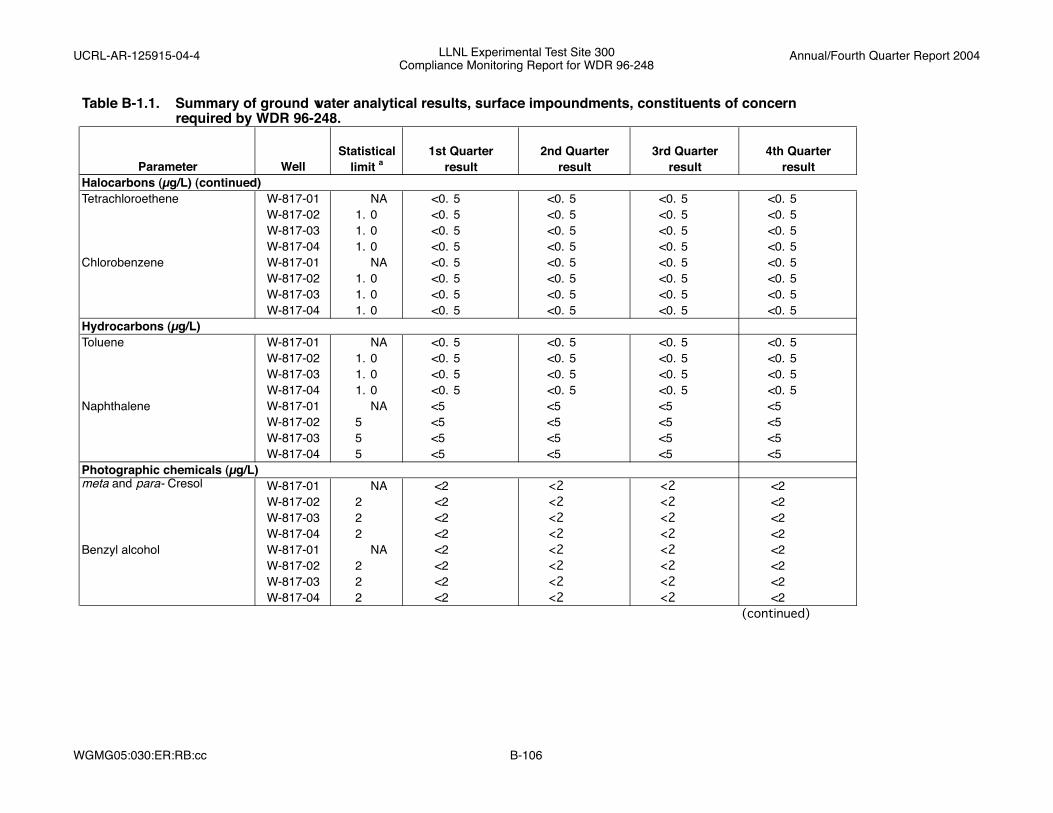
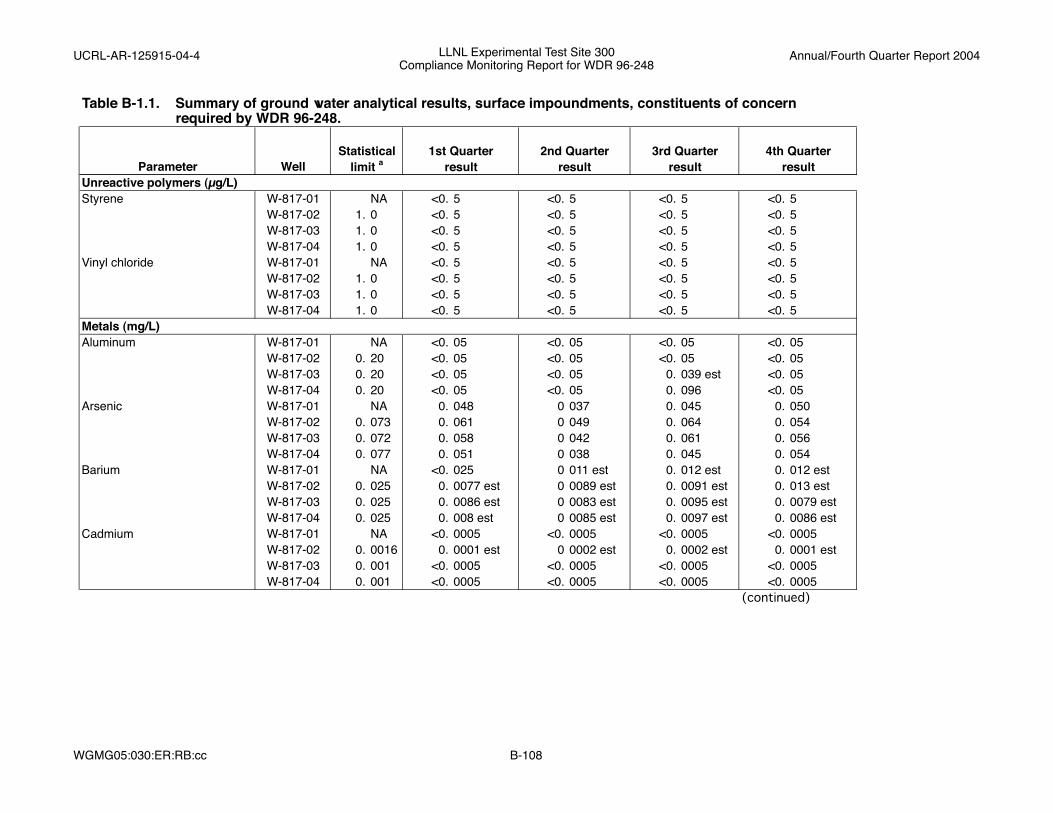
2.3 Leak Detection Monitoring Network On October 13, a split in the HDPE liner of the upper surface impoundment was discovered. The split was approximately 6 to 8 inches long and more than three feet above the present water line. Several other weak places, or striations, in the liner were noted at the same time. Repairs to all of those locations were completed November 30, 2004. 2.3.1 Leachate Collection and Removal Systems Monitoring The two LCRSs were monitored weekly for the presence of liquids that would indicate a leak in a surface impoundment liner. No liquid was discovered in this system during 2004. 2.3.2 Ground Water Monitoring In 2004, three COCs (ammonia in samples from well W-817-03 during the fourth quarter; bicarbonate alkalinity in samples from well W-817-04 during the first, second, and third quarters; and bis(2-ethylhexyl)phthalate in samples from well W-817-02 during the third quarter) exceeded the respective SLs. Although concentrations exceeding the SLs were
UCRL-AR-125915-04-4 LLNL Experimental Test Site 300 Annual/Fourth Quarter Report 2004 Compliance Monitoring Report for WDR 96-248
WGMG05:030:ER:RB:cc 7
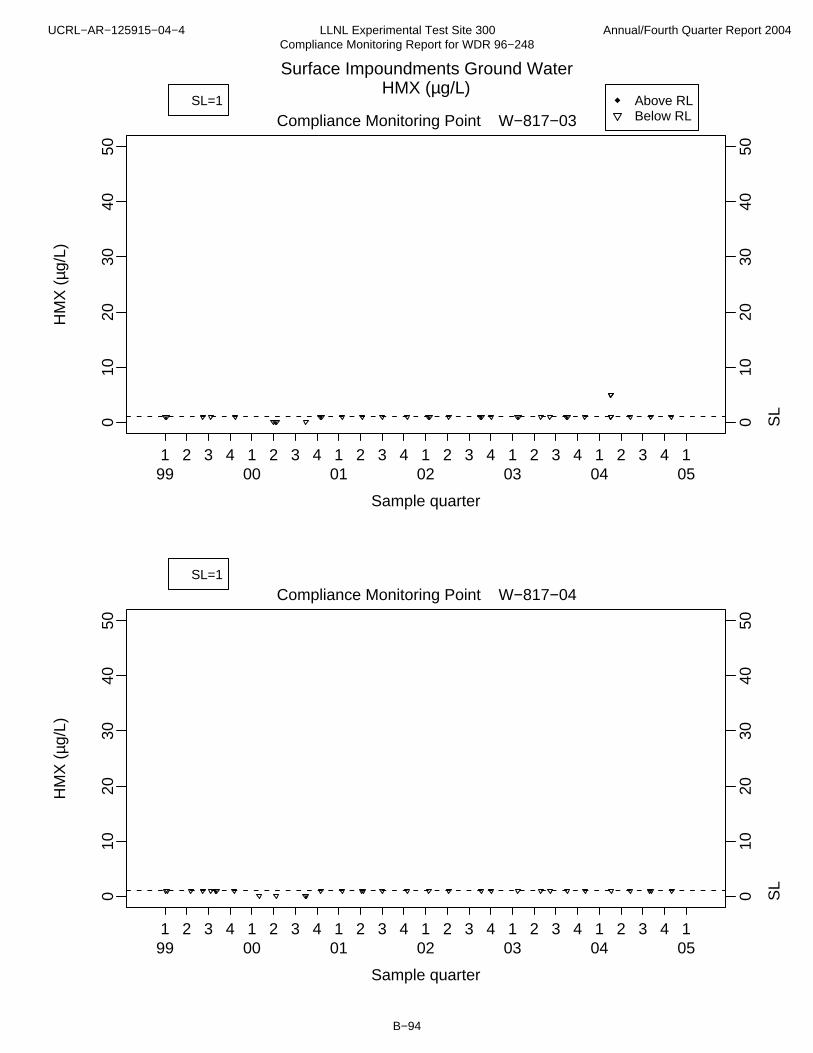
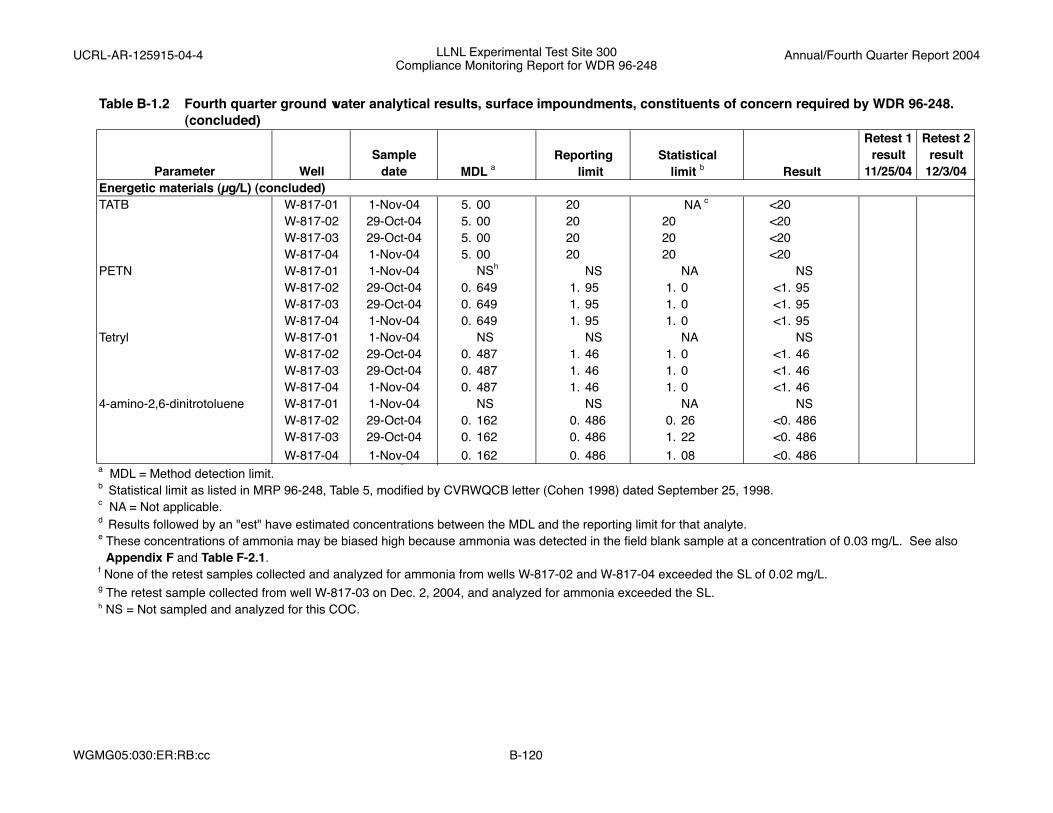
confirmed by at least one retest sample from each well, LLNL does not believe these elevated concentrations of any COC (Table B-1.1) originated from the surface impoundments. Table B-1.2 lists all ground water analytical results, including retest sample results, for the fourth quarter of 2004 for COCs under MRP 96-248, Revision 1 (Cohen 1998). Analytical results from other parameters analyzed in water samples from these wells, which are not required by MRP 96-248, Revision 1, but are part of the analytical laboratory suites, are listed in Table B-2.1. Appendix E provides a brief description of all statistical methods used to evaluate compliance with the limits established in MRP 96-248, Revision 1 (Cohen 1998). A discussion of the fourth quarter ground water QA/QC data is provided in Appendix F, along with the field QA/QC data tables (Tables F-2.1 and F-2.2). The concentrations of ammonia analyzed in ground water samples collected on October 29 and November 1, 2004, were 0.05 mg/L from down gradient well W-817-02, 0.06 mg/L from down gradient well W-817-03, and 0.07 mg/L from down gradient well W-817-04. All of these concentrations exceeded the SL of 0.02 mg/L (Tables B-1.1 and B-1.2). This exceedance was confirmed by results of the retest samples collected from well W-817-03 only on December 2, 2004, and the statistically significant evidence was reported to the CVRWQCB (Raber 2005). No concentration of ammonia analyzed in any of those wells exceeded the SL of 0.080 mg/L proposed by LLNL in 2002 (Brown 2002). See also Table F-2.1 and Appendix F for a discussion of ammonia detected in the field blank sample and how that might bias these results. Concentrations of bicarbonate alkalinity were confirmed as exceeding the current SL of 277 mg/L in samples collected from down gradient well W-817-04 during first, second, and third quarter monitoring (Table B-1.1) and were previously reported to the CVRWQCB at the end of the second quarter of 2001 (Raber 2001). Although the concentrations of bicarbonates from well W-817-04 exceed the current SL, they remain lower than the SL of 305 mg/L that LLNL proposed for that well in 2002 (Brown 2002). Concentrations of the plasticizer compound bis(2-ethylhexyl)phthalate in ground water samples collected from down gradient well W-817-02 in the third quarter were confirmed as exceeding the SL of 5 µg/L. Although this statistical exceedance was reported to the CVRWQCB (Raber 2004) according to the Permit, LLNL does not believe this compound originated from the surface impoundments. This common laboratory contaminant was also detected, at an estimated concentration <5 µg/L, in the up gradient well W-817-01 in the third quarter (Table B-1.1 and Brown 2004). The energetic compound pentaerythritol tetranitrate (PETN) was detected the first time ever in ground water samples collected from down gradient monitor well W-817-02 in the second and third quarters (2.69 µg/L and 15.4 µg/L, respectively). Although this statistical exceedance was reported to the CVRWQCB (Raber 2004) according to the Permit, these statistical exceedances were not confirmed by retest samples. Likewise, concentrations of the energetic compounds hexahydro-1, 3, 5-trinitro-1, 3, 5-triazine (RDX) and 4-amino-2,6-dinitrotoluene exceeded the SLs in samples from one or more
UCRL-AR-125915-04-4 LLNL Experimental Test Site 300 Annual/Fourth Quarter Report 2004 Compliance Monitoring Report for WDR 96-248
WGMG05:030:ER:RB:cc 8
down gradient monitor wells during the third quarter and were reported to the CVRWQCB (Raber 2004), but the concentrations of these compounds were not confirmed as exceeding their SLs. Plots of all COC data over time and tabular annual summaries of the ground water analytical data are included in Appendix B.
3.0 Sewage Evaporation and Percolation Ponds
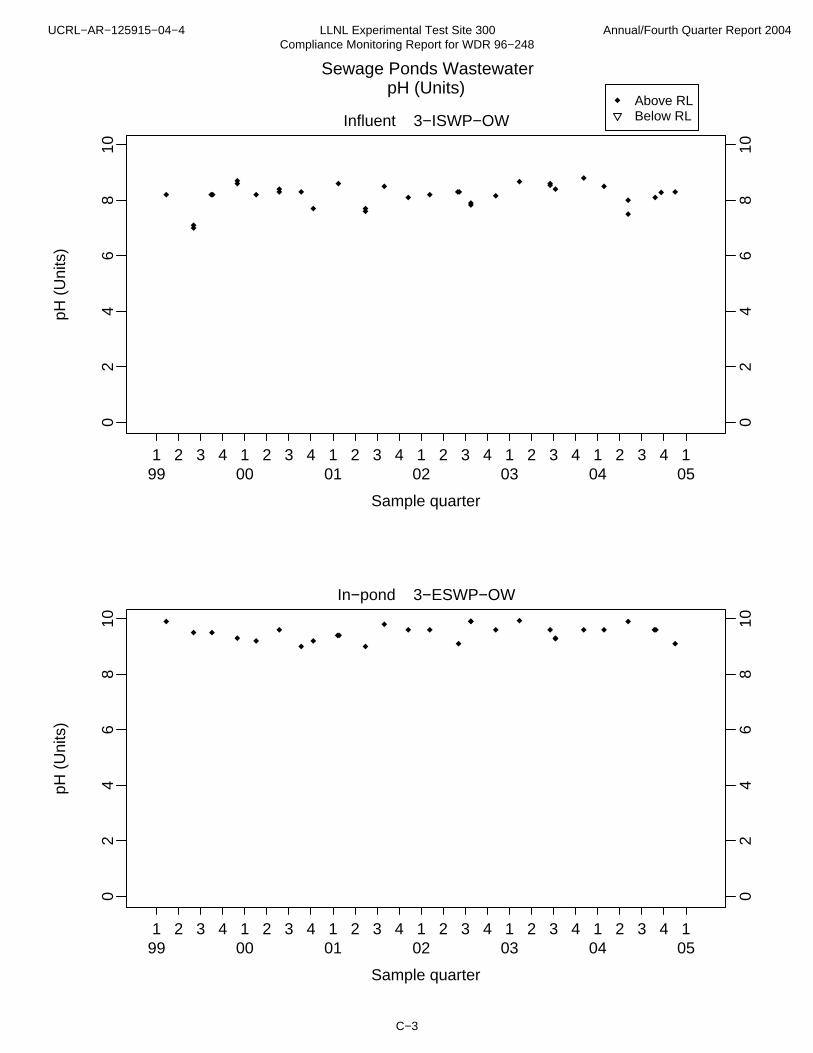
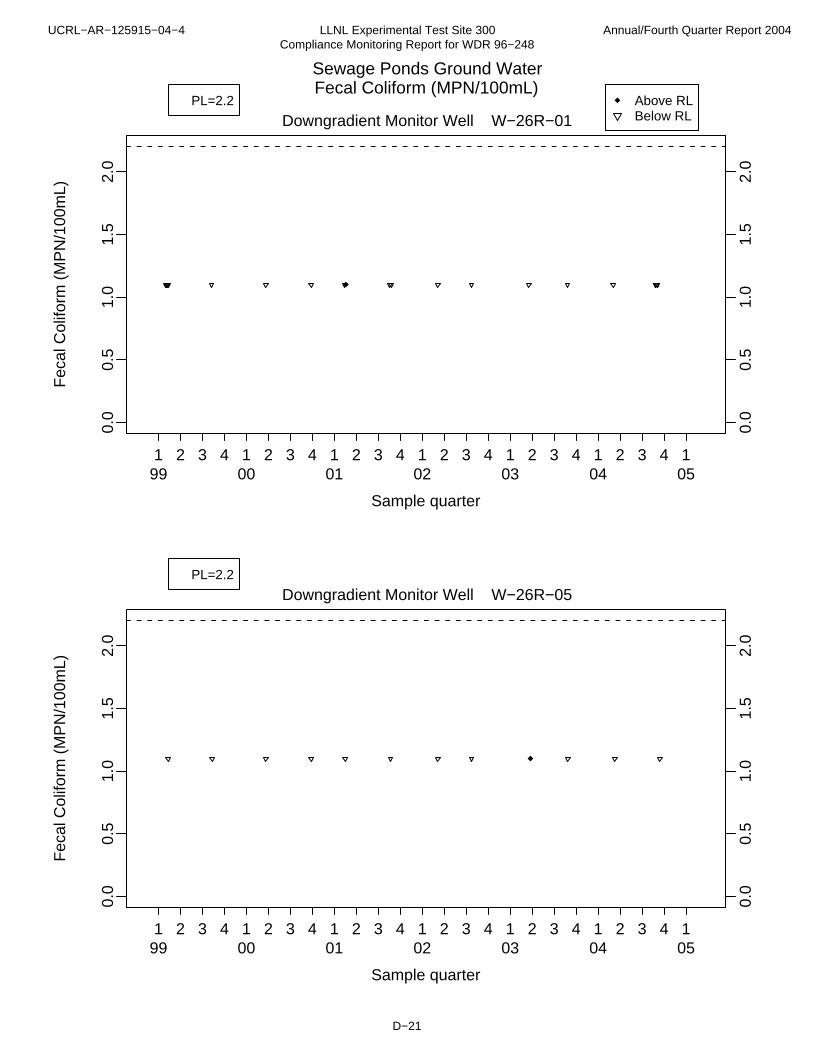
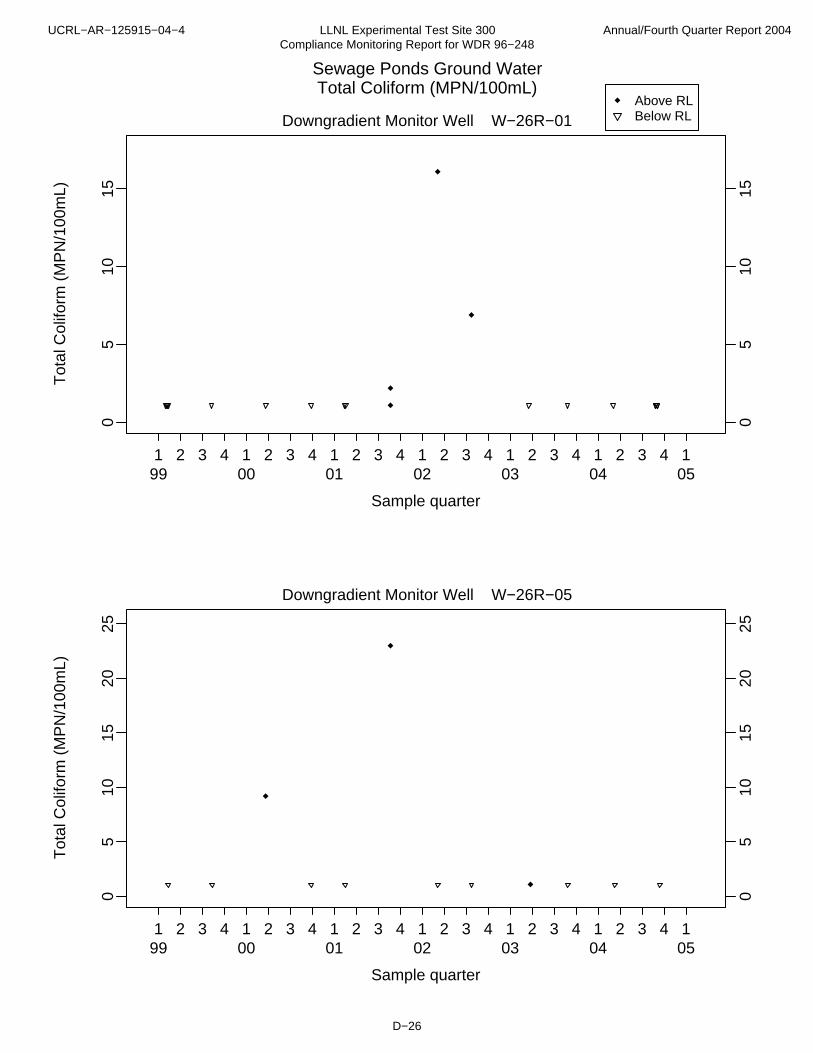
3.1 Compliance Monitoring Program Monitoring at the sewage evaporation pond (evaporation pond) and the sewage percolation pond (percolation pond) (Figure 3) is also specified in the MRP 96-248, Revision 1 (Cohen 1998). Applicable reporting requirements are detailed in the Permit (CVRWQCB 1996). Quarterly samples of wastewater flowing into the evaporation pond are collected for analysis from a location west of the pond (sampling location ISWP in Figure 3). ISWP is a manhole that captures all waste streams before they flow into the pond. The samples are analyzed for electrical conductivity (EC), pH, and biochemical oxygen demand (BOD). Quarterly wastewater samples are collected from the evaporation pond (sampling location ESWP) and analyzed for pH, EC, and dissolved oxygen (DO). Observations of the pond are made at least monthly for freeboard, color, odor, and levee condition. Any discharge from the evaporation pond to the percolation pond (sampling location DSWP) is sampled and analyzed for BOD, EC, total and fecal coliform, and pH. Leak detection monitoring at the sewage ponds is accomplished by monitoring the shallow ground water, including the regional aquifer (Tnbs1) beneath and adjacent to the ponds. Ground water monitoring includes semiannual sampling and analysis of the collected samples. Table 2 lists each monitor well; and whether it is up gradient, down gradient, or cross gradient of the sewage ponds; and the geological interval(s) over which it is screened. Figure 3 shows the location of each of the wells.
UCRL-AR-125915-04-4 LLNL Experimental Test Site 300 Annual/Fourth Quarter Report 2004 Compliance Monitoring Report for WDR 96-248
WGMG05:030:ER:RB:cc 9
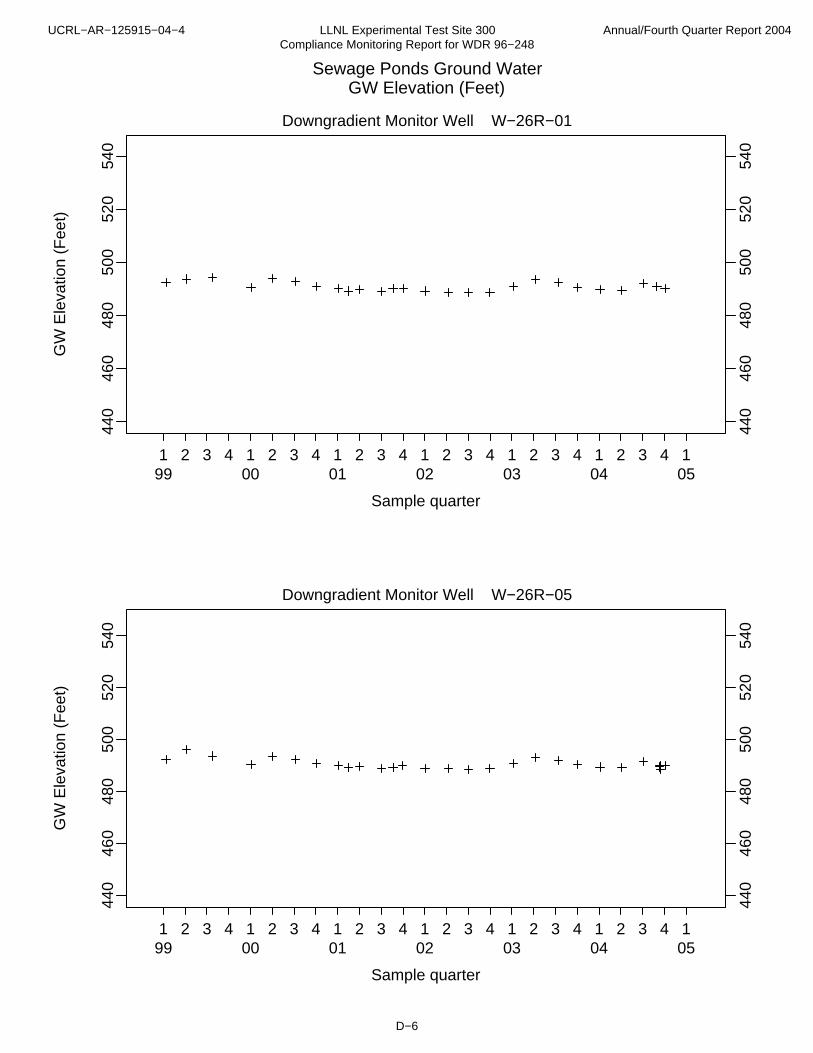
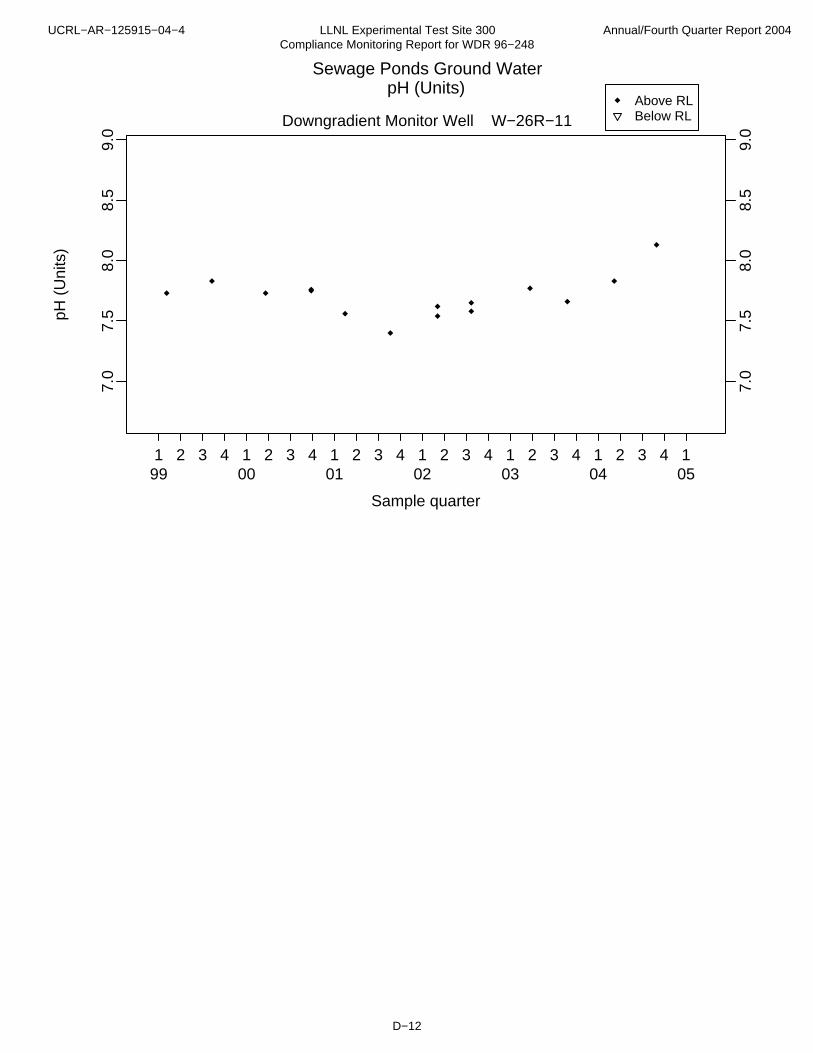
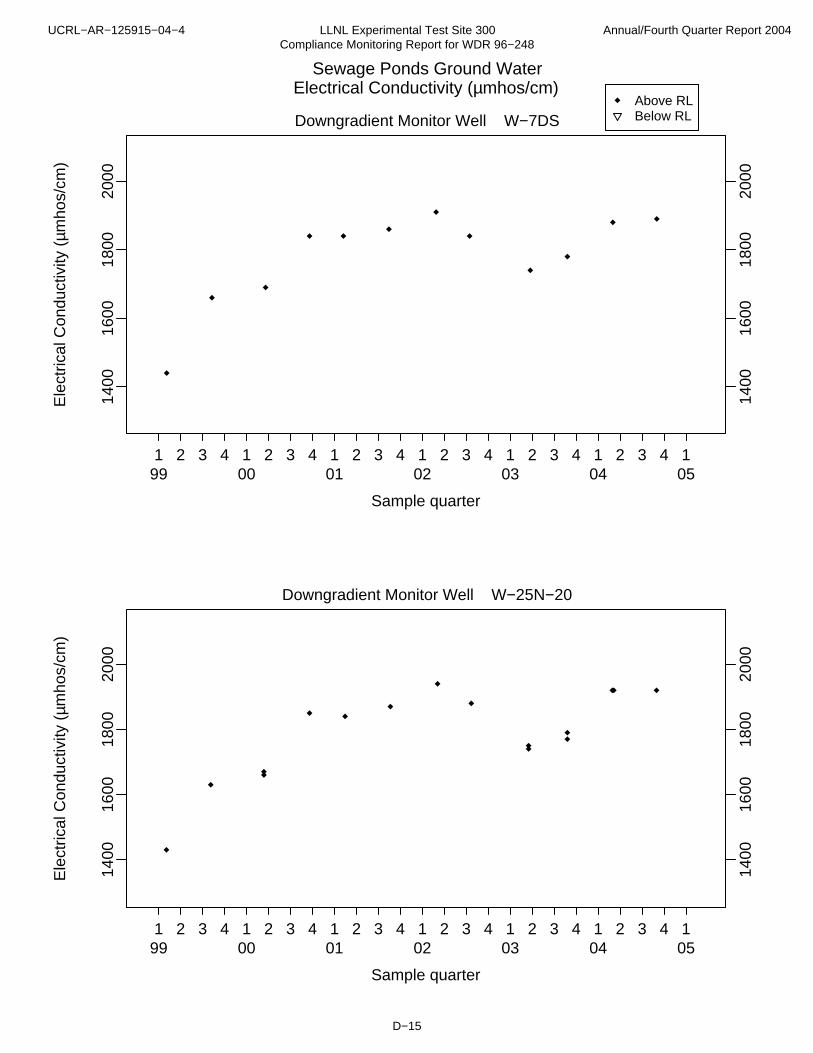
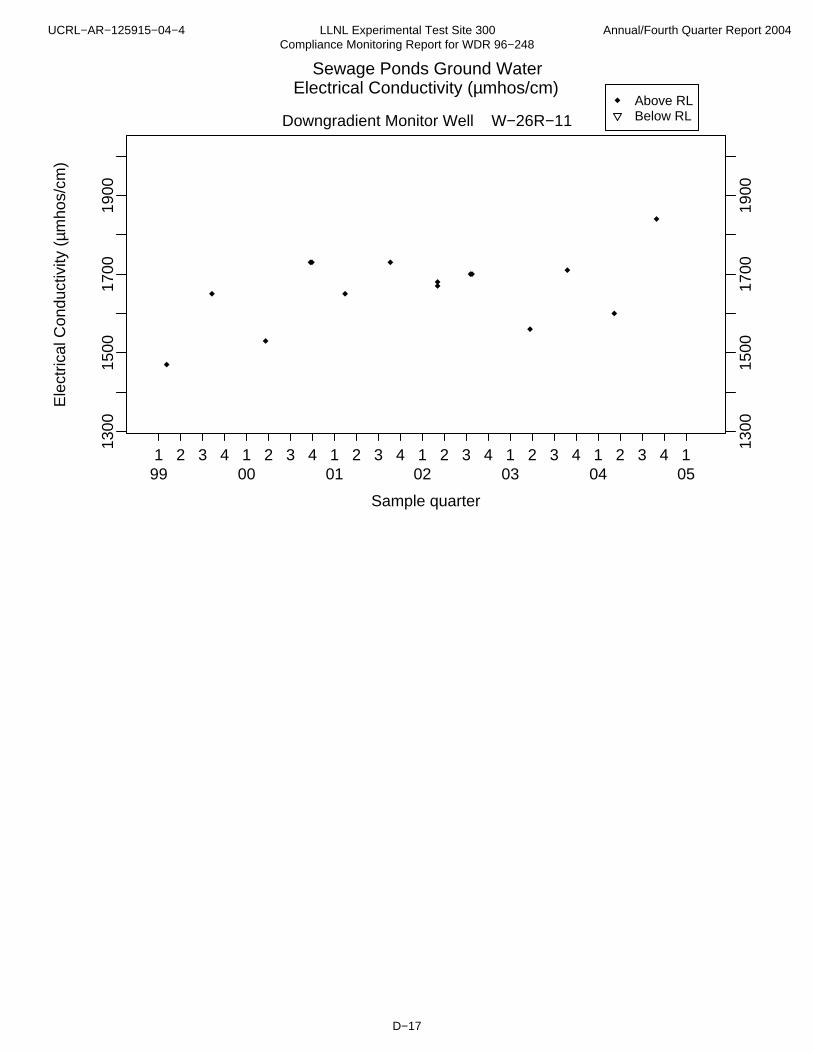
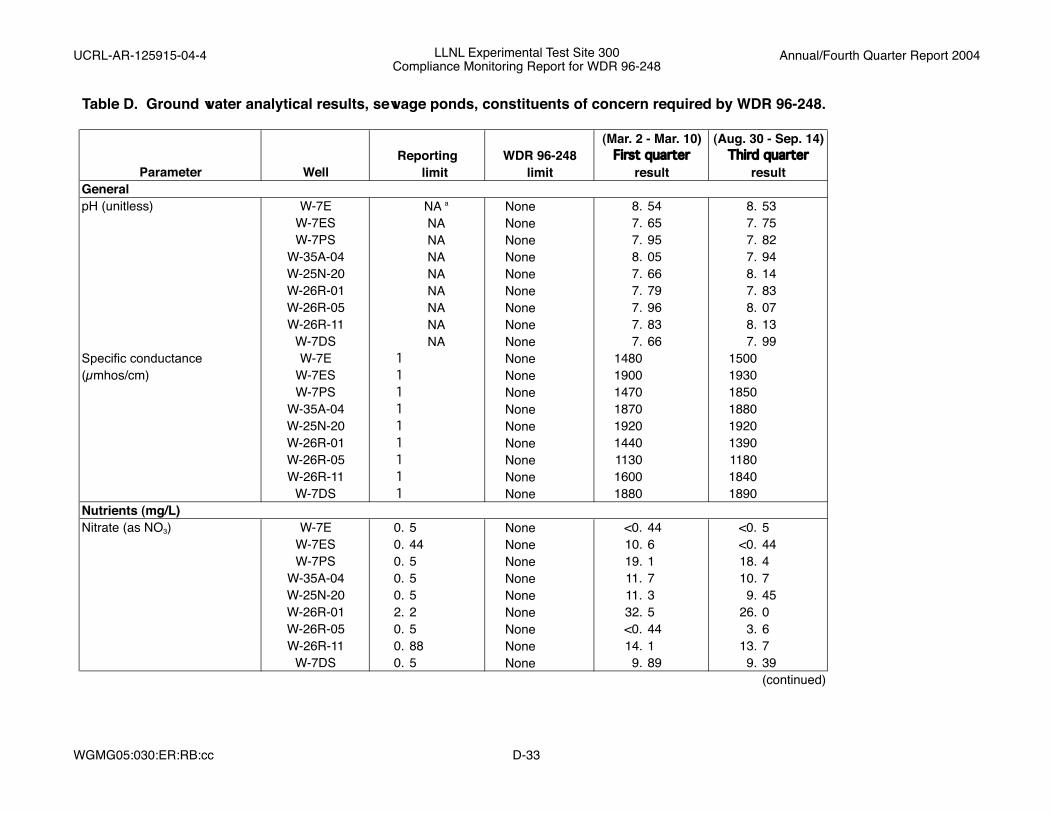
Table 2. Monitor well location relative to sewage ponds and aquifer monitored. Monitor well Location Screening interval W-7E Up gradient Tnsc1/Tnbs1 W-7ES Up gradient Qal/Tnsc1 W-7PS Up gradient Qal W-35A-04 Cross gradient Qal W-26R-01 Down gradient Tnbs1 W-26R-11 Down gradient Qal W-26R-05 Down gradient Qal/Tnbs1 W-25N-20 Down gradient Qal/Tnbs1 W-7DS Down gradient Qal/Tnbs1
Note: Tnbs1 is the regional aquifer.
Figure 3. Site 300 sewage pond ground water and surface water compliance
monitoring locations
3.2 Wastewater Monitoring All required wastewater monitoring parameters for the sewage ponds were in compliance with the Permit’s provisions and specifications throughout 2004. Continuous discharge occurred during the first quarter (Table C-4) from the evaporation pond to the percolation pond (Brown 2004a). Historical plots and tabular summaries of the 2004 data are included in Appendix C.
3.3 Ground Water Monitoring All required monitoring parameters for the sewage pond ground water network were in compliance with specified ground water receiving limits throughout 2004. Semiannual ground water samples were collected and analyzed during the first and third quarters of
UCRL-AR-125915-04-4 LLNL Experimental Test Site 300 Annual/Fourth Quarter Report 2004 Compliance Monitoring Report for WDR 96-248
WGMG05:030:ER:RB:cc 10
2004. Historical data plots and tabular annual summaries of the analytical data are included in Appendix D.
4.0 Percolation Pits MRP 96-248, Revision 1, requires monthly inspections of the percolation pits at Buildings 806A, 827A, 827C, 827D, and 827E. Sampling and analysis for metals is required whenever an overflow occurs.
During 2004, the percolation pits at Buildings 806A, 827A, 827C, 827D, and 827E operated normally, and no overflows occurred. The percolation pits at both Buildings 827C and 827D contained standing water throughout the fourth quarter.
UCRL-AR-125915-04-4 LLNL Experimental Test Site 300 Annual/Fourth Quarter Report 2004 Compliance Monitoring Report for WDR 96-248
WGMG05:030:ER:RB:cc 11
References Althouse, P., et al. (2002), Environmental Monitoring Plan (EMP), Lawrence Livermore National Laboratory, Livermore, CA (UCRL-ID-106132, Rev. 3). Brown, R. (2002), LLNL Experimental Test Site 300 Compliance Monitoring Report for Waste Discharge Requirements 96-248, Annual/Fourth Quarter Report 2001, Lawrence Livermore National Laboratory, Livermore, CA (UCRL-AR-125915-01-4). Brown, R. (2004), LLNL Experimental Test Site 300 Compliance Monitoring Report for Waste Discharge Requirements 96-248, Third Quarter 2004, Lawrence Livermore National Laboratory, Livermore, CA (UCRL-AR-125915-04-3). California Code of Regulations, Title 23, Chapter 3, Subchapter 15. Cohen, W. (1998), Letter from the Central Valley Regional Water Quality Control Board to Harry Galles re: Revised Monitoring and Reporting Programs No. 93-100 and 96-248, Lawrence Livermore National Laboratory Site 300, San Joaquin County, September 25, 1998. CVRWQCB (1993), Standard Provisions and Reporting Requirements for Waste Discharge Requirements for Discharges Regulated by Chapter 15, and/or Part 258 (23 CCR 2510 et seq. And 40 CFR 258 et seq.), Central Valley Regional Water Quality Control Board, September 1993. CVRWQCB (1996), Order No. 96-248, Waste Discharge Requirements for University of California Lawrence Livermore National Laboratory Experimental Test Site (Site 300) and US Department of Energy Evaporation and Percolation Ponds and Class II Surface Impoundments, San Joaquin and Alameda Counties, September 20, 1996. Fisher, Dennis K. (1995), Amended Report of Waste Discharge, Waste Discharges Permit Number 85-188, Lawrence Livermore National Laboratory Experimental Test Site (Site 300), Alameda and San Joaquin Counties, November 13, 1995. Goodrich, R., and R. Depue (2004), LLNL Livermore Site and Site 300 Environmental RestorationProject Standard Operating Procedures (SOPs), Lawrence Livermore National Laboratory, Livermore, CA (UCRL-MA-109115, Rev. 11). Raber, E., and D. W. Carpenter (Eds.) (1983), An Evaluation of the Hydrogeology and Ground Water Chemistry Associated with Landfills at LLNL’s Site 300, Lawrence Livermore National Laboratory, Livermore, CA (UCRL-53416).
UCRL-AR-125915-04-4 LLNL Experimental Test Site 300 Annual/Fourth Quarter Report 2004 Compliance Monitoring Report for WDR 96-248
WGMG05:030:ER:RB:cc 12
References (concluded) Raber, E. (2001), Letter to S. Timm: Statistically Significant Evidence for a Release of Bicarbonate Alkalinity and Dissolved Manganese from Lawrence Livermore National Laboratory Experimental Test Site (Site 300) Class II Surface Impoundments, July 2, 2001. Raber, Ellen (2004), Statistically Significant Evidence for a Release of Bis(2-ethylhexyl)phthalate, RDX, PETN, and 4-amino-2,6-dinnitrotoluene from Lawrence Livermore National Laboratory Experimental Test Site (Site 300) Class II Surface Impoundments, October 20, 2004. Raber, Ellen (2005), Statistically Significant Evidence for a Release of Ammonia as N from Lawrence Livermore National Laboratory Experimental Test Site (Site 300) Class II Surface Impoundments, January 27, 2005. U.S. Environmental Protection Agency, Office of Emergency and Remedial Response (1994a), USEPA Contract Laboratory Program National Functional Guidelines for Organic Data Review (PB94-963501, EPA540/R-94/012). U.S. Environmental Protection Agency, Office of Emergency and Remedial Response (1994b), USEPA Contract Laboratory Program National Functional Guidelines for Inorganic Data Review (EPA 540/R-94/013). Webster-Scholten, C. P. (Ed.) (1994), Final Site-Wide Remedial Investigation Report, Lawrence Livermore National Laboratory Site 300, Lawrence Livermore National Laboratory, Livermore, CA (UCRL-AR-108131).
UCRL-AR-125915-04-4 LLNL Experimental Test Site 300 Annual/Fourth Quarter Report 2004 Compliance Monitoring Report for WDR 96-248
WGMG05:030:ER:RB:cc
Appendix A
Annual Summary Plots and Tables of Surface Impoundments Process Water
Monitoring Data
UCRL-AR-125915-04-4 LLNL Experimental Test Site 300 Annual/Fourth Quarter Report 2004 Compliance Monitoring Report for WDR 96-248
WGMG05:030:ER:RB:cc A-1
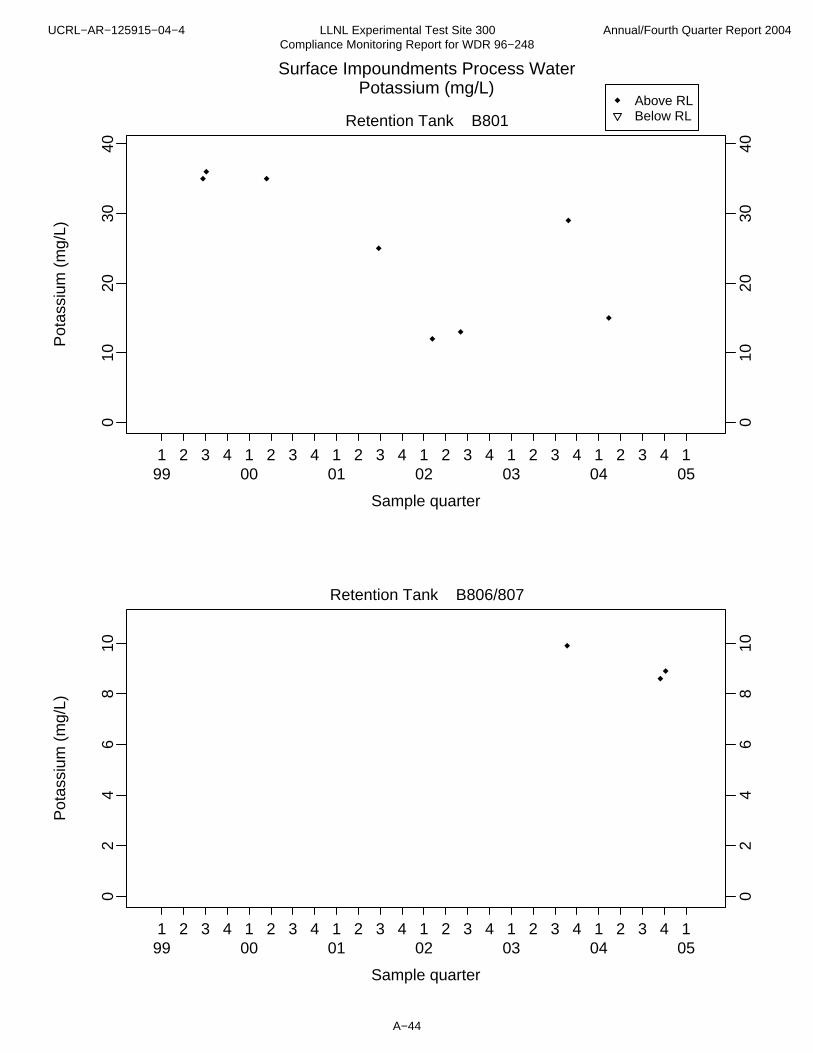
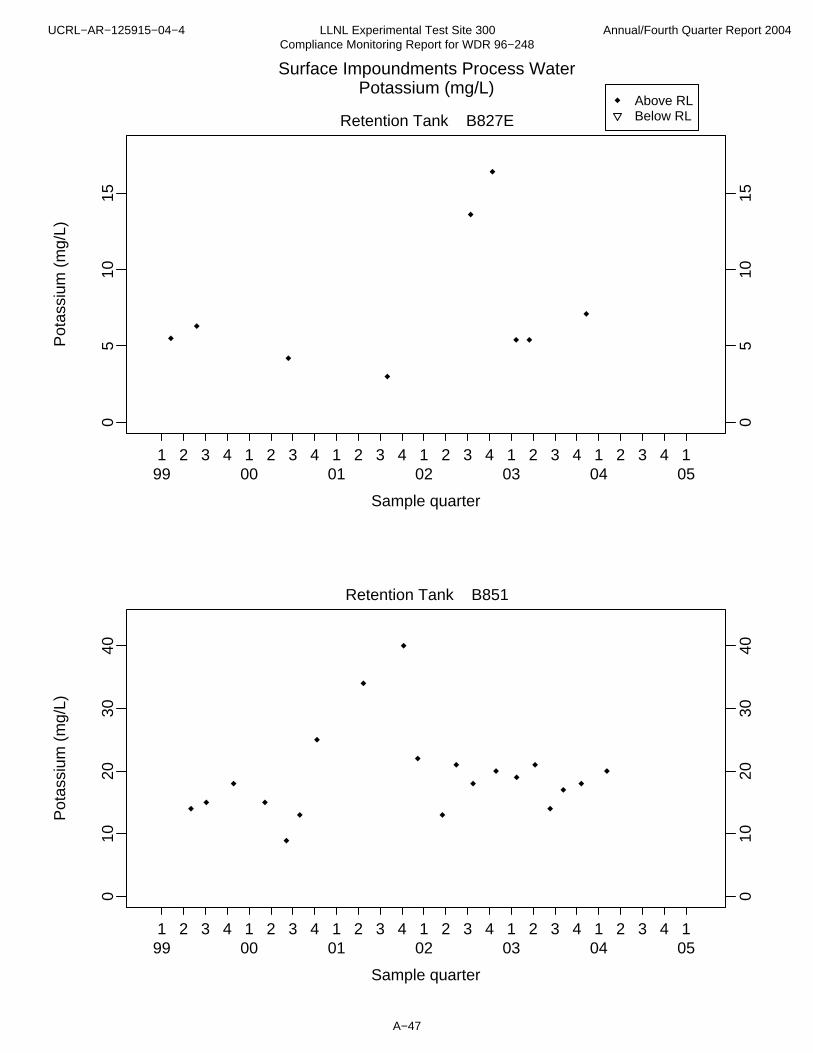
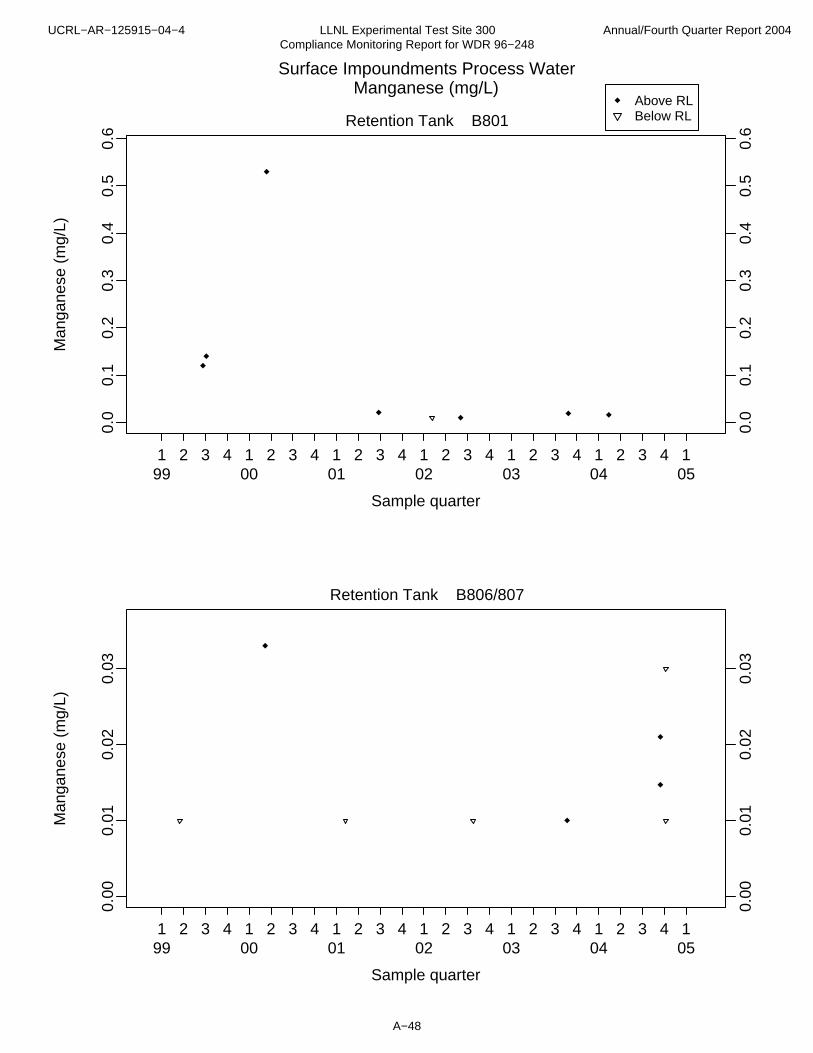
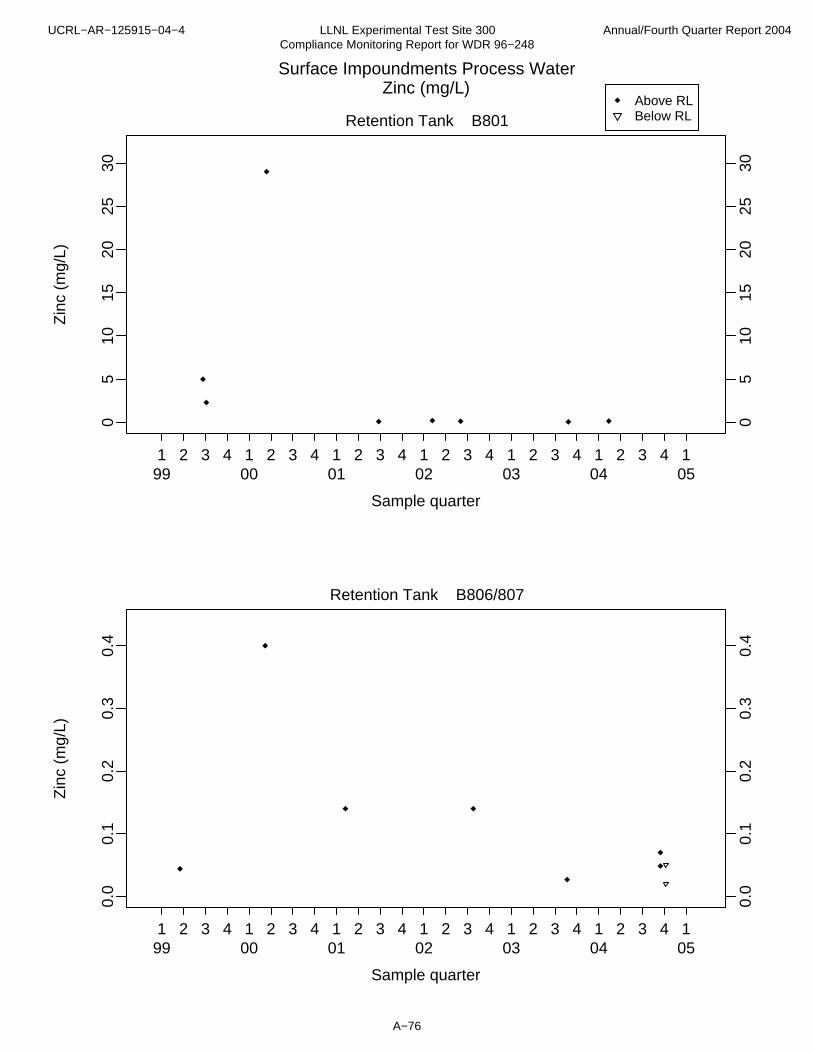
Appendix A This appendix contains graphical and tabular summaries of the 2004 surface water impoundments influent monitoring. The monitoring requirements of WDR 96-248 began in the fourth quarter of 1996.
Wastewater influent monitoring includes photographic process water from Buildings 801, 823, and 851; the Chemistry Area (Buildings 825, 826, and 827 Complex); and discharges from the Explosives Process Area (Buildings 806, 807, 809, and 817).
Retention tank designations for the photographic process and Chemistry Areas are as follows: 801-R3O1 (old), 801-R3O2 (new), 823-R1U1, 851-R1A1 (photographic process area); and 825-R1A1, 826-R1A1, 827A-R1A1, 827C-R1A1, and 827A-R2A1 (Chemistry Area). Process discharges from the Explosives Process Area are generated from Buildings 806/807 and 817 and are designated as B806/807 and B817, respectively. The plots contain all monitoring data available since LLNL began storing sample results from these retention tanks in 1992. There are no 2004 data for B809 because there have been no operations there since May 2001.
The plots display the pH parameter and concentrations of trace metals, volatile organic compounds, and semi-volatile organic compounds in wastewater influent to the surface water impoundments. The plots begin with the retention tank associated with the lowest building number for each detected analyte always plotted first. Only analytes detected in each retention tank are plotted.
Each two-dimensional graph plots concentration on the vertical axis versus time (years divided into four quarterly sampling periods) on the horizontal axis. Units of measure are given on the vertical axis label and in the header at the top of each page. Values above the analytical reporting limit for each analyte are plotted as solid diamonds, values below the reporting limit are plotted as open inverted triangles, and the estimated values between the reporting limit and method detection limit are plotted as crosses.
UCRL-AR-125915-04-4 LLNL Experimental Test Site 300 Annual/Fourth Quarter Report 2004 Compliance Monitoring Report for WDR 96-248
WGMG05:030:ER:RB:cc A-2
This Page Intentionally Left Blank
UCRL-AR-125915-04-4 LLNL Experimental Test Site 300 Annual/Fourth Quarter Report 2004 Compliance Monitoring Report for WDR 96-248
WGMG05:030:ER:RB:cc
Annual Plots of Surface Impoundments
Process Water Monitoring Data
Sample quarter
Vol
ume
of D
isch
arge
(Li
ters
)
1000
030
000
5000
0
1000
030
000
5000
0
199
100
101
102
103
104
105
3 3 3 3 3 32 2 2 2 2 24 4 4 4 4 4
Retention Tank B801
Surface Impoundments Process WaterVolume of Discharge (Liters)
UCRL−AR−125915−04−4 LLNL Experimental Test Site 300Compliance Monitoring Report for WDR 96−248
Annual/Fourth Quarter Report 2004
A−3
Sample quarter
Vol
ume
of D
isch
arge
(Li
ters
)
2100
2200
2300
2400
2500
2100
2200
2300
2400
2500
199
100
101
102
103
104
105
3 3 3 3 3 32 2 2 2 2 24 4 4 4 4 4
Retention Tank B826
Sample quarter
Vol
ume
of D
isch
arge
(Li
ters
)
5000
1000
015
000
5000
1000
015
000
199
100
101
102
103
104
105
3 3 3 3 3 32 2 2 2 2 24 4 4 4 4 4
Retention Tank B827C/D
Surface Impoundments Process WaterVolume of Discharge (Liters)
UCRL−AR−125915−04−4 LLNL Experimental Test Site 300Compliance Monitoring Report for WDR 96−248
Annual/Fourth Quarter Report 2004
A−4
Sample quarter
Vol
ume
of D
isch
arge
(Li
ters
)
5000
1000
015
000
2000
0
5000
1000
015
000
2000
0
199
100
101
102
103
104
105
3 3 3 3 3 32 2 2 2 2 24 4 4 4 4 4
Retention Tank B827E
Sample quarter
pH (
Uni
ts)
6.0
6.5
7.0
7.5
8.0
8.5
6.0
6.5
7.0
7.5
8.0
8.5
199
100
101
102
103
104
105
3 3 3 3 3 32 2 2 2 2 24 4 4 4 4 4
Retention Tank B801
Surface Impoundments Process WaterpH (Units)
UCRL−AR−125915−04−4 LLNL Experimental Test Site 300Compliance Monitoring Report for WDR 96−248
Annual/Fourth Quarter Report 2004
A−5
Above RLBelow RL
Sample quarter
pH (
Uni
ts)
7.5
8.0
8.5
9.0
7.5
8.0
8.5
9.0
199
100
101
102
103
104
105
3 3 3 3 3 32 2 2 2 2 24 4 4 4 4 4
Retention Tank B806/807
Sample quarter
pH (
Uni
ts)
67
89
10
67
89
10
199
100
101
102
103
104
105
3 3 3 3 3 32 2 2 2 2 24 4 4 4 4 4
Retention Tank B823A
Surface Impoundments Process WaterpH (Units)
UCRL−AR−125915−04−4 LLNL Experimental Test Site 300Compliance Monitoring Report for WDR 96−248
Annual/Fourth Quarter Report 2004
A−6
Above RLBelow RL
Sample quarter
pH (
Uni
ts)
7.0
7.5
8.0
8.5
9.0
7.0
7.5
8.0
8.5
9.0
199
100
101
102
103
104
105
3 3 3 3 3 32 2 2 2 2 24 4 4 4 4 4
Retention Tank B826
Sample quarter
pH (
Uni
ts)
89
1011
89
1011
199
100
101
102
103
104
105
3 3 3 3 3 32 2 2 2 2 24 4 4 4 4 4
Retention Tank B827C/D
Surface Impoundments Process WaterpH (Units)
UCRL−AR−125915−04−4 LLNL Experimental Test Site 300Compliance Monitoring Report for WDR 96−248
Annual/Fourth Quarter Report 2004
A−7
Above RLBelow RL
Sample quarter
pH (
Uni
ts)
78
910
11
78
910
11
199
100
101
102
103
104
105
3 3 3 3 3 32 2 2 2 2 24 4 4 4 4 4
Retention Tank B827E
Sample quarter
pH (
Uni
ts)
56
78
9
56
78
9
199
100
101
102
103
104
105
3 3 3 3 3 32 2 2 2 2 24 4 4 4 4 4
Retention Tank B851
Surface Impoundments Process WaterpH (Units)
UCRL−AR−125915−04−4 LLNL Experimental Test Site 300Compliance Monitoring Report for WDR 96−248
Annual/Fourth Quarter Report 2004
A−8
Above RLBelow RL
Sample quarter
Silv
er (
mg/
L)
0.00
0.02
0.04
0.06
0.08
0.00
0.02
0.04
0.06
0.08
199
100
101
102
103
104
105
3 3 3 3 3 32 2 2 2 2 24 4 4 4 4 4
Retention Tank B801
Surface Impoundments Process WaterSilver (mg/L)
UCRL−AR−125915−04−4 LLNL Experimental Test Site 300Compliance Monitoring Report for WDR 96−248
Annual/Fourth Quarter Report 2004
A−9
Above RLBelow RL
Sample quarter
Silv
er (
mg/
L)
0.00
00.
004
0.00
80.
012
0.00
00.
004
0.00
80.
012
199
100
101
102
103
104
105
3 3 3 3 3 32 2 2 2 2 24 4 4 4 4 4
Retention Tank B806/807
Sample quarter
Silv
er (
mg/
L)
0.00
000.
0010
0.00
20
0.00
000.
0010
0.00
20
199
100
101
102
103
104
105
3 3 3 3 3 32 2 2 2 2 24 4 4 4 4 4
Retention Tank B817
Surface Impoundments Process WaterSilver (mg/L)
UCRL−AR−125915−04−4 LLNL Experimental Test Site 300Compliance Monitoring Report for WDR 96−248
Annual/Fourth Quarter Report 2004
A−10
Above RLBelow RL
Sample quarter
Silv
er (
mg/
L)
0.0
0.5
1.0
1.5
2.0
2.5
3.0
0.0
0.5
1.0
1.5
2.0
2.5
3.0
199
100
101
102
103
104
105
3 3 3 3 3 32 2 2 2 2 24 4 4 4 4 4
Retention Tank B823A
Sample quarter
Silv
er (
mg/
L)
0.00
000.
0010
0.00
200.
0030
0.00
000.
0010
0.00
200.
0030
199
100
101
102
103
104
105
3 3 3 3 3 32 2 2 2 2 24 4 4 4 4 4
Retention Tank B826
Surface Impoundments Process WaterSilver (mg/L)
UCRL−AR−125915−04−4 LLNL Experimental Test Site 300Compliance Monitoring Report for WDR 96−248
Annual/Fourth Quarter Report 2004
A−11
Above RLBelow RL
Sample quarter
Silv
er (
mg/
L)
0.00
00.
005
0.01
00.
015
0.02
0
0.00
00.
005
0.01
00.
015
0.02
0
199
100
101
102
103
104
105
3 3 3 3 3 32 2 2 2 2 24 4 4 4 4 4
Retention Tank B827C/D
Sample quarter
Silv
er (
mg/
L)
0.00
0.01
0.02
0.03
0.04
0.05
0.00
0.01
0.02
0.03
0.04
0.05
199
100
101
102
103
104
105
3 3 3 3 3 32 2 2 2 2 24 4 4 4 4 4
Retention Tank B827E
Surface Impoundments Process WaterSilver (mg/L)
UCRL−AR−125915−04−4 LLNL Experimental Test Site 300Compliance Monitoring Report for WDR 96−248
Annual/Fourth Quarter Report 2004
A−12
Above RLBelow RL
Sample quarter
Silv
er (
mg/
L)
0.0
0.2
0.4
0.6
0.8
0.0
0.2
0.4
0.6
0.8
199
100
101
102
103
104
105
3 3 3 3 3 32 2 2 2 2 24 4 4 4 4 4
Retention Tank B851
Sample quarter
Alu
min
um (
mg/
L)
0.0
0.2
0.4
0.6
0.8
1.0
0.0
0.2
0.4
0.6
0.8
1.0
199
100
101
102
103
104
105
3 3 3 3 3 32 2 2 2 2 24 4 4 4 4 4
Retention Tank B806/807
Surface Impoundments Process WaterAluminum (mg/L)
UCRL−AR−125915−04−4 LLNL Experimental Test Site 300Compliance Monitoring Report for WDR 96−248
Annual/Fourth Quarter Report 2004
A−13
Above RLBelow RL
Sample quarter
Alu
min
um (
mg/
L)
02
46
810
02
46
810
199
100
101
102
103
104
105
3 3 3 3 3 32 2 2 2 2 24 4 4 4 4 4
Retention Tank B817
Sample quarter
Ars
enic
(m
g/L)
0.00
00.
002
0.00
4
0.00
00.
002
0.00
4
199
100
101
102
103
104
105
3 3 3 3 3 32 2 2 2 2 24 4 4 4 4 4
Retention Tank B801
Surface Impoundments Process WaterArsenic (mg/L)
UCRL−AR−125915−04−4 LLNL Experimental Test Site 300Compliance Monitoring Report for WDR 96−248
Annual/Fourth Quarter Report 2004
A−14
Above RLBelow RL
Sample quarter
Ars
enic
(m
g/L)
0.00
000.
0005
0.00
100.
0015
0.00
20
0.00
000.
0005
0.00
100.
0015
0.00
20
199
100
101
102
103
104
105
3 3 3 3 3 32 2 2 2 2 24 4 4 4 4 4
Retention Tank B806/807
Sample quarter
Ars
enic
(m
g/L)
0.00
00.
001
0.00
20.
003
0.00
40.
005
0.00
00.
001
0.00
20.
003
0.00
40.
005
199
100
101
102
103
104
105
3 3 3 3 3 32 2 2 2 2 24 4 4 4 4 4
Retention Tank B817
Surface Impoundments Process WaterArsenic (mg/L)
UCRL−AR−125915−04−4 LLNL Experimental Test Site 300Compliance Monitoring Report for WDR 96−248
Annual/Fourth Quarter Report 2004
A−15
Above RLBelow RL
Sample quarter
Ars
enic
(m
g/L)
0.00
00.
002
0.00
4
0.00
00.
002
0.00
4
199
100
101
102
103
104
105
3 3 3 3 3 32 2 2 2 2 24 4 4 4 4 4
Retention Tank B823A
Sample quarter
Ars
enic
(m
g/L)
0.00
0.02
0.04
0.06
0.00
0.02
0.04
0.06
199
100
101
102
103
104
105
3 3 3 3 3 32 2 2 2 2 24 4 4 4 4 4
Retention Tank B826
Surface Impoundments Process WaterArsenic (mg/L)
UCRL−AR−125915−04−4 LLNL Experimental Test Site 300Compliance Monitoring Report for WDR 96−248
Annual/Fourth Quarter Report 2004
A−16
Above RLBelow RL
Sample quarter
Ars
enic
(m
g/L)
0.00
0.05
0.10
0.15
0.20
0.00
0.05
0.10
0.15
0.20
199
100
101
102
103
104
105
3 3 3 3 3 32 2 2 2 2 24 4 4 4 4 4
Retention Tank B827C/D
Sample quarter
Ars
enic
(m
g/L)
0.00
0.02
0.04
0.06
0.08
0.10
0.00
0.02
0.04
0.06
0.08
0.10
199
100
101
102
103
104
105
3 3 3 3 3 32 2 2 2 2 24 4 4 4 4 4
Retention Tank B827E
Surface Impoundments Process WaterArsenic (mg/L)
UCRL−AR−125915−04−4 LLNL Experimental Test Site 300Compliance Monitoring Report for WDR 96−248
Annual/Fourth Quarter Report 2004
A−17
Above RLBelow RL
Sample quarter
Ars
enic
(m
g/L)
0.00
0.02
0.04
0.06
0.08
0.10
0.00
0.02
0.04
0.06
0.08
0.10
199
100
101
102
103
104
105
3 3 3 3 3 32 2 2 2 2 24 4 4 4 4 4
Retention Tank B851
Sample quarter
Bor
on (
mg/
L)
0.0
0.2
0.4
0.6
0.8
1.0
0.0
0.2
0.4
0.6
0.8
1.0
104
105
3 324 4
Retention Tank B806/807
Surface Impoundments Process WaterBoron (mg/L)
UCRL−AR−125915−04−4 LLNL Experimental Test Site 300Compliance Monitoring Report for WDR 96−248
Annual/Fourth Quarter Report 2004
A−18
Above RLBelow RL
Sample quarter
Bor
on (
mg/
L)
0.0
0.2
0.4
0.6
0.8
1.0
0.0
0.2
0.4
0.6
0.8
1.0
104
105
3 324 4
Retention Tank B823A
Sample quarter
Bar
ium
(m
g/L)
0.00
0.02
0.04
0.06
0.08
0.10
0.00
0.02
0.04
0.06
0.08
0.10
199
100
101
102
103
104
105
3 3 3 3 3 32 2 2 2 2 24 4 4 4 4 4
Retention Tank B801
Surface Impoundments Process WaterBarium (mg/L)
UCRL−AR−125915−04−4 LLNL Experimental Test Site 300Compliance Monitoring Report for WDR 96−248
Annual/Fourth Quarter Report 2004
A−19
Above RLBelow RL
Sample quarter
Bar
ium
(m
g/L)
0.00
0.02
0.04
0.06
0.08
0.00
0.02
0.04
0.06
0.08
199
100
101
102
103
104
105
3 3 3 3 3 32 2 2 2 2 24 4 4 4 4 4
Retention Tank B806/807
Sample quarter
Bar
ium
(m
g/L)
0.00
0.04
0.08
0.12
0.00
0.04
0.08
0.12
199
100
101
102
103
104
105
3 3 3 3 3 32 2 2 2 2 24 4 4 4 4 4
Retention Tank B817
Surface Impoundments Process WaterBarium (mg/L)
UCRL−AR−125915−04−4 LLNL Experimental Test Site 300Compliance Monitoring Report for WDR 96−248
Annual/Fourth Quarter Report 2004
A−20
Above RLBelow RL
Sample quarter
Bar
ium
(m
g/L)
0.00
0.02
0.04
0.06
0.08
0.10
0.00
0.02
0.04
0.06
0.08
0.10
199
100
101
102
103
104
105
3 3 3 3 3 32 2 2 2 2 24 4 4 4 4 4
Retention Tank B823A
Sample quarter
Bar
ium
(m
g/L)
0.00
0.01
0.02
0.03
0.04
0.05
0.00
0.01
0.02
0.03
0.04
0.05
199
100
101
102
103
104
105
3 3 3 3 3 32 2 2 2 2 24 4 4 4 4 4
Retention Tank B826
Surface Impoundments Process WaterBarium (mg/L)
UCRL−AR−125915−04−4 LLNL Experimental Test Site 300Compliance Monitoring Report for WDR 96−248
Annual/Fourth Quarter Report 2004
A−21
Above RLBelow RL
Sample quarter
Bar
ium
(m
g/L)
0.0
0.2
0.4
0.6
0.8
0.0
0.2
0.4
0.6
0.8
199
100
101
102
103
104
105
3 3 3 3 3 32 2 2 2 2 24 4 4 4 4 4
Retention Tank B827C/D
Sample quarter
Bar
ium
(m
g/L)
0.00
0.04
0.08
0.12
0.00
0.04
0.08
0.12
199
100
101
102
103
104
105
3 3 3 3 3 32 2 2 2 2 24 4 4 4 4 4
Retention Tank B827E
Surface Impoundments Process WaterBarium (mg/L)
UCRL−AR−125915−04−4 LLNL Experimental Test Site 300Compliance Monitoring Report for WDR 96−248
Annual/Fourth Quarter Report 2004
A−22
Above RLBelow RL
Sample quarter
Bar
ium
(m
g/L)
0.00
0.02
0.04
0.06
0.08
0.10
0.00
0.02
0.04
0.06
0.08
0.10
199
100
101
102
103
104
105
3 3 3 3 3 32 2 2 2 2 24 4 4 4 4 4
Retention Tank B851
Sample quarter
Ber
ylliu
m (
mg/
L)
0e+
004e
−04
8e−
04
0e+
004e
−04
8e−
04
199
100
101
102
103
104
105
3 3 3 3 3 32 2 2 2 2 24 4 4 4 4 4
Retention Tank B801
Surface Impoundments Process WaterBeryllium (mg/L)
UCRL−AR−125915−04−4 LLNL Experimental Test Site 300Compliance Monitoring Report for WDR 96−248
Annual/Fourth Quarter Report 2004
A−23
Above RLBelow RL
Sample quarter
Ber
ylliu
m (
mg/
L)
0e+
002e
−04
4e−
04
0e+
002e
−04
4e−
04
199
100
101
102
103
104
105
3 3 3 3 3 32 2 2 2 2 24 4 4 4 4 4
Retention Tank B806/807
Sample quarter
Ber
ylliu
m (
mg/
L)
0.00
000
0.00
010
0.00
020
0.00
000
0.00
010
0.00
020
199
100
101
102
103
104
105
3 3 3 3 3 32 2 2 2 2 24 4 4 4 4 4
Retention Tank B817
Surface Impoundments Process WaterBeryllium (mg/L)
UCRL−AR−125915−04−4 LLNL Experimental Test Site 300Compliance Monitoring Report for WDR 96−248
Annual/Fourth Quarter Report 2004
A−24
Above RLBelow RL
Sample quarter
Ber
ylliu
m (
mg/
L)
0.00
00.
001
0.00
20.
003
0.00
4
0.00
00.
001
0.00
20.
003
0.00
4
199
100
101
102
103
104
105
3 3 3 3 3 32 2 2 2 2 24 4 4 4 4 4
Retention Tank B823A
Sample quarter
Ber
ylliu
m (
mg/
L)
0.00
00.
002
0.00
40.
006
0.00
8
0.00
00.
002
0.00
40.
006
0.00
8
199
100
101
102
103
104
105
3 3 3 3 3 32 2 2 2 2 24 4 4 4 4 4
Retention Tank B826
Surface Impoundments Process WaterBeryllium (mg/L)
UCRL−AR−125915−04−4 LLNL Experimental Test Site 300Compliance Monitoring Report for WDR 96−248
Annual/Fourth Quarter Report 2004
A−25
Above RLBelow RL
Sample quarter
Ber
ylliu
m (
mg/
L)
0.00
0.01
0.02
0.03
0.04
0.00
0.01
0.02
0.03
0.04
199
100
101
102
103
104
105
3 3 3 3 3 32 2 2 2 2 24 4 4 4 4 4
Retention Tank B827C/D
Sample quarter
Ber
ylliu
m (
mg/
L)
0.00
00.
005
0.01
00.
015
0.02
0
0.00
00.
005
0.01
00.
015
0.02
0
199
100
101
102
103
104
105
3 3 3 3 3 32 2 2 2 2 24 4 4 4 4 4
Retention Tank B827E
Surface Impoundments Process WaterBeryllium (mg/L)
UCRL−AR−125915−04−4 LLNL Experimental Test Site 300Compliance Monitoring Report for WDR 96−248
Annual/Fourth Quarter Report 2004
A−26
Above RLBelow RL
Sample quarter
Ber
ylliu
m (
mg/
L)
0.00
00.
004
0.00
8
0.00
00.
004
0.00
8
199
100
101
102
103
104
105
3 3 3 3 3 32 2 2 2 2 24 4 4 4 4 4
Retention Tank B851
Sample quarter
Cad
miu
m (
mg/
L)
0.00
0.01
0.02
0.03
0.00
0.01
0.02
0.03
199
100
101
102
103
104
105
3 3 3 3 3 32 2 2 2 2 24 4 4 4 4 4
Retention Tank B801
Surface Impoundments Process WaterCadmium (mg/L)
UCRL−AR−125915−04−4 LLNL Experimental Test Site 300Compliance Monitoring Report for WDR 96−248
Annual/Fourth Quarter Report 2004
A−27
Above RLBelow RL
Sample quarter
Cad
miu
m (
mg/
L)
0.00
000.
0005
0.00
100.
0015
0.00
20
0.00
000.
0005
0.00
100.
0015
0.00
20
199
100
101
102
103
104
105
3 3 3 3 3 32 2 2 2 2 24 4 4 4 4 4
Retention Tank B806/807
Sample quarter
Cad
miu
m (
mg/
L)
0.00
00.
002
0.00
40.
006
0.00
00.
002
0.00
40.
006
199
100
101
102
103
104
105
3 3 3 3 3 32 2 2 2 2 24 4 4 4 4 4
Retention Tank B817
Surface Impoundments Process WaterCadmium (mg/L)
UCRL−AR−125915−04−4 LLNL Experimental Test Site 300Compliance Monitoring Report for WDR 96−248
Annual/Fourth Quarter Report 2004
A−28
Above RLBelow RL
Sample quarter
Cad
miu
m (
mg/
L)
0.00
0.02
0.04
0.06
0.00
0.02
0.04
0.06
199
100
101
102
103
104
105
3 3 3 3 3 32 2 2 2 2 24 4 4 4 4 4
Retention Tank B823A
Sample quarter
Cad
miu
m (
mg/
L)
0.00
000.
0005
0.00
100.
0015
0.00
000.
0005
0.00
100.
0015
199
100
101
102
103
104
105
3 3 3 3 3 32 2 2 2 2 24 4 4 4 4 4
Retention Tank B826
Surface Impoundments Process WaterCadmium (mg/L)
UCRL−AR−125915−04−4 LLNL Experimental Test Site 300Compliance Monitoring Report for WDR 96−248
Annual/Fourth Quarter Report 2004
A−29
Above RLBelow RL
Sample quarter
Cad
miu
m (
mg/
L)
0.00
0.05
0.10
0.15
0.00
0.05
0.10
0.15
199
100
101
102
103
104
105
3 3 3 3 3 32 2 2 2 2 24 4 4 4 4 4
Retention Tank B827C/D
Sample quarter
Cad
miu
m (
mg/
L)
0.00
00.
005
0.01
00.
015
0.00
00.
005
0.01
00.
015
199
100
101
102
103
104
105
3 3 3 3 3 32 2 2 2 2 24 4 4 4 4 4
Retention Tank B827E
Surface Impoundments Process WaterCadmium (mg/L)
UCRL−AR−125915−04−4 LLNL Experimental Test Site 300Compliance Monitoring Report for WDR 96−248
Annual/Fourth Quarter Report 2004
A−30
Above RLBelow RL
Sample quarter
Cad
miu
m (
mg/
L)
0.00
00.
005
0.01
00.
015
0.00
00.
005
0.01
00.
015
199
100
101
102
103
104
105
3 3 3 3 3 32 2 2 2 2 24 4 4 4 4 4
Retention Tank B851
Sample quarter
Cob
alt (
mg/
L)
0.00
0.01
0.02
0.03
0.04
0.05
0.00
0.01
0.02
0.03
0.04
0.05
199
100
101
102
103
104
105
3 3 3 3 3 32 2 2 2 2 24 4 4 4 4 4
Retention Tank B801
Surface Impoundments Process WaterCobalt (mg/L)
UCRL−AR−125915−04−4 LLNL Experimental Test Site 300Compliance Monitoring Report for WDR 96−248
Annual/Fourth Quarter Report 2004
A−31
Above RLBelow RL
Sample quarter
Cob
alt (
mg/
L)
0.00
0.01
0.02
0.03
0.04
0.05
0.00
0.01
0.02
0.03
0.04
0.05
199
100
101
102
103
104
105
3 3 3 3 3 32 2 2 2 2 24 4 4 4 4 4
Retention Tank B806/807
Sample quarter
Cob
alt (
mg/
L)
0.00
0.01
0.02
0.03
0.04
0.05
0.00
0.01
0.02
0.03
0.04
0.05
199
100
101
102
103
104
105
3 3 3 3 3 32 2 2 2 2 24 4 4 4 4 4
Retention Tank B817
Surface Impoundments Process WaterCobalt (mg/L)
UCRL−AR−125915−04−4 LLNL Experimental Test Site 300Compliance Monitoring Report for WDR 96−248
Annual/Fourth Quarter Report 2004
A−32
Above RLBelow RL
Sample quarter
Cob
alt (
mg/
L)
0.00
0.01
0.02
0.03
0.04
0.05
0.00
0.01
0.02
0.03
0.04
0.05
199
100
101
102
103
104
105
3 3 3 3 3 32 2 2 2 2 24 4 4 4 4 4
Retention Tank B823A
Sample quarter
Cob
alt (
mg/
L)
0.00
000.
0005
0.00
100.
0015
0.00
000.
0005
0.00
100.
0015
199
100
101
102
103
104
105
3 3 3 3 3 32 2 2 2 2 24 4 4 4 4 4
Retention Tank B826
Surface Impoundments Process WaterCobalt (mg/L)
UCRL−AR−125915−04−4 LLNL Experimental Test Site 300Compliance Monitoring Report for WDR 96−248
Annual/Fourth Quarter Report 2004
A−33
Above RLBelow RL
Sample quarter
Cob
alt (
mg/
L)
0.00
0.01
0.02
0.03
0.04
0.05
0.00
0.01
0.02
0.03
0.04
0.05
199
100
101
102
103
104
105
3 3 3 3 3 32 2 2 2 2 24 4 4 4 4 4
Retention Tank B827C/D
Sample quarter
Cob
alt (
mg/
L)
0.00
00.
004
0.00
8
0.00
00.
004
0.00
8
199
100
101
102
103
104
105
3 3 3 3 3 32 2 2 2 2 24 4 4 4 4 4
Retention Tank B827E
Surface Impoundments Process WaterCobalt (mg/L)
UCRL−AR−125915−04−4 LLNL Experimental Test Site 300Compliance Monitoring Report for WDR 96−248
Annual/Fourth Quarter Report 2004
A−34
Above RLBelow RL
Sample quarter
Cob
alt (
mg/
L)
0.00
0.01
0.02
0.03
0.04
0.05
0.00
0.01
0.02
0.03
0.04
0.05
199
100
101
102
103
104
105
3 3 3 3 3 32 2 2 2 2 24 4 4 4 4 4
Retention Tank B851
Sample quarter
Chr
omiu
m (
mg/
L)
0.00
00.
002
0.00
40.
006
0.00
80.
010
0.00
00.
002
0.00
40.
006
0.00
80.
010
199
100
101
102
103
104
105
3 3 3 3 3 32 2 2 2 2 24 4 4 4 4 4
Retention Tank B801
Surface Impoundments Process WaterChromium (mg/L)
UCRL−AR−125915−04−4 LLNL Experimental Test Site 300Compliance Monitoring Report for WDR 96−248
Annual/Fourth Quarter Report 2004
A−35
Above RLBelow RL
Sample quarter
Chr
omiu
m (
mg/
L)
0.00
00.
002
0.00
40.
006
0.00
8
0.00
00.
002
0.00
40.
006
0.00
8
199
100
101
102
103
104
105
3 3 3 3 3 32 2 2 2 2 24 4 4 4 4 4
Retention Tank B806/807
Sample quarter
Chr
omiu
m (
mg/
L)
0.00
0.01
0.02
0.03
0.04
0.05
0.00
0.01
0.02
0.03
0.04
0.05
199
100
101
102
103
104
105
3 3 3 3 3 32 2 2 2 2 24 4 4 4 4 4
Retention Tank B817
Surface Impoundments Process WaterChromium (mg/L)
UCRL−AR−125915−04−4 LLNL Experimental Test Site 300Compliance Monitoring Report for WDR 96−248
Annual/Fourth Quarter Report 2004
A−36
Above RLBelow RL
Sample quarter
Chr
omiu
m (
mg/
L)
0.00
00.
002
0.00
4
0.00
00.
002
0.00
4
199
100
101
102
103
104
105
3 3 3 3 3 32 2 2 2 2 24 4 4 4 4 4
Retention Tank B823A
Sample quarter
Chr
omiu
m (
mg/
L)
0.00
00.
005
0.01
00.
015
0.00
00.
005
0.01
00.
015
199
100
101
102
103
104
105
3 3 3 3 3 32 2 2 2 2 24 4 4 4 4 4
Retention Tank B826
Surface Impoundments Process WaterChromium (mg/L)
UCRL−AR−125915−04−4 LLNL Experimental Test Site 300Compliance Monitoring Report for WDR 96−248
Annual/Fourth Quarter Report 2004
A−37
Above RLBelow RL
Sample quarter
Chr
omiu
m (
mg/
L)
0.00
0.05
0.10
0.15
0.20
0.25
0.00
0.05
0.10
0.15
0.20
0.25
199
100
101
102
103
104
105
3 3 3 3 3 32 2 2 2 2 24 4 4 4 4 4
Retention Tank B827C/D
Sample quarter
Chr
omiu
m (
mg/
L)
0.00
00.
010
0.02
00.
030
0.00
00.
010
0.02
00.
030
199
100
101
102
103
104
105
3 3 3 3 3 32 2 2 2 2 24 4 4 4 4 4
Retention Tank B827E
Surface Impoundments Process WaterChromium (mg/L)
UCRL−AR−125915−04−4 LLNL Experimental Test Site 300Compliance Monitoring Report for WDR 96−248
Annual/Fourth Quarter Report 2004
A−38
Above RLBelow RL
Sample quarter
Chr
omiu
m (
mg/
L)
0.0
0.1
0.2
0.3
0.4
0.0
0.1
0.2
0.3
0.4
199
100
101
102
103
104
105
3 3 3 3 3 32 2 2 2 2 24 4 4 4 4 4
Retention Tank B851
Sample quarter
Cop
per
(mg/
L)
0.0
0.2
0.4
0.6
0.0
0.2
0.4
0.6
199
100
101
102
103
104
105
3 3 3 3 3 32 2 2 2 2 24 4 4 4 4 4
Retention Tank B801
Surface Impoundments Process WaterCopper (mg/L)
UCRL−AR−125915−04−4 LLNL Experimental Test Site 300Compliance Monitoring Report for WDR 96−248
Annual/Fourth Quarter Report 2004
A−39
Above RLBelow RL
Sample quarter
Cop
per
(mg/
L)
0.00
0.05
0.10
0.15
0.20
0.00
0.05
0.10
0.15
0.20
199
100
101
102
103
104
105
3 3 3 3 3 32 2 2 2 2 24 4 4 4 4 4
Retention Tank B806/807
Sample quarter
Cop
per
(mg/
L)
0.00
0.05
0.10
0.15
0.20
0.25
0.00
0.05
0.10
0.15
0.20
0.25
199
100
101
102
103
104
105
3 3 3 3 3 32 2 2 2 2 24 4 4 4 4 4
Retention Tank B817
Surface Impoundments Process WaterCopper (mg/L)
UCRL−AR−125915−04−4 LLNL Experimental Test Site 300Compliance Monitoring Report for WDR 96−248
Annual/Fourth Quarter Report 2004
A−40
Above RLBelow RL
Sample quarter
Cop
per
(mg/
L)
0.00
0.05
0.10
0.15
0.00
0.05
0.10
0.15
199
100
101
102
103
104
105
3 3 3 3 3 32 2 2 2 2 24 4 4 4 4 4
Retention Tank B823A
Sample quarter
Cop
per
(mg/
L)
0.00
0.02
0.04
0.06
0.08
0.10
0.12
0.00
0.02
0.04
0.06
0.08
0.10
0.12
199
100
101
102
103
104
105
3 3 3 3 3 32 2 2 2 2 24 4 4 4 4 4
Retention Tank B826
Surface Impoundments Process WaterCopper (mg/L)
UCRL−AR−125915−04−4 LLNL Experimental Test Site 300Compliance Monitoring Report for WDR 96−248
Annual/Fourth Quarter Report 2004
A−41
Above RLBelow RL
Sample quarter
Cop
per
(mg/
L)
0.0
0.2
0.4
0.6
0.0
0.2
0.4
0.6
199
100
101
102
103
104
105
3 3 3 3 3 32 2 2 2 2 24 4 4 4 4 4
Retention Tank B827C/D
Sample quarter
Cop
per
(mg/
L)
0.0
0.1
0.2
0.3
0.4
0.0
0.1
0.2
0.3
0.4
199
100
101
102
103
104
105
3 3 3 3 3 32 2 2 2 2 24 4 4 4 4 4
Retention Tank B827E
Surface Impoundments Process WaterCopper (mg/L)
UCRL−AR−125915−04−4 LLNL Experimental Test Site 300Compliance Monitoring Report for WDR 96−248
a MDL = Method detection limit b These discharge limits are found in the Monitoring and Reporting Program No. 96-248, adopted on September 20, 1996, or in Appendix C of the Amended Report of Waste
Discharge (Fisher, 1995) c Results followed by "est" are compounds detected with concentrations estimated between the MDL and the reporting limit for that compound d California soluble threshold limit concentration (STLC), i.e., hazardous waste limit, not noted in WDR 96-248 e NL = No limit
UCRL-AR-125915-04-4 LLNL Experimental Test Site 300 Annual/Fourth Quarter Report 2004 Compliance Monitoring Report for WDR 96-248
WGMG05:030:ER:RB:cc A-97
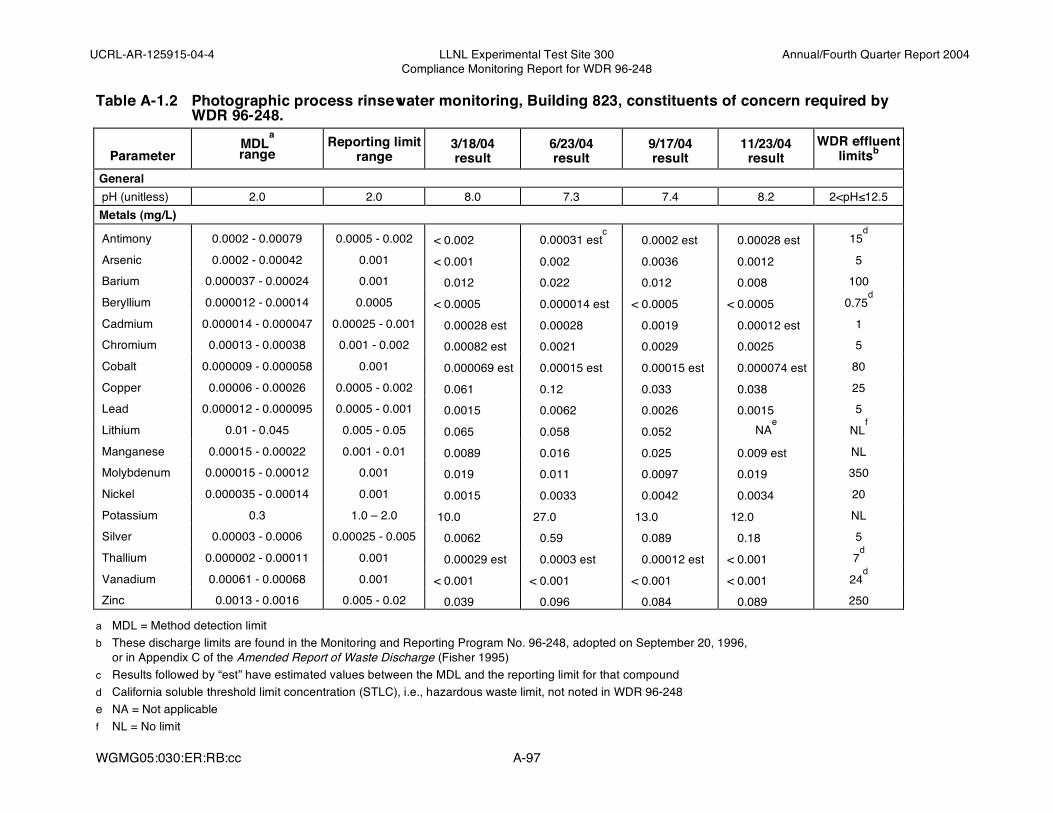
Table A-1.2 Photographic process rinsewater monitoring, Building 823, constituents of concern required by WDR 96-248.
Parameter
MDLa
range Reporting limit
range 3/18/04 result
6/23/04 result
9/17/04 result
11/23/04 result
WDR effluent limitsb
General pH (unitless) 2.0 2.0 8.0 7.3 7.4 8.2 2<pH≤12.5
Metals (mg/L)
Antimony 0.0002 - 0.00079 0.0005 - 0.002 < 0.002 0.00031 estc 0.0002 est 0.00028 est 15
a MDL = Method detection limit b These discharge limits are found in the Monitoring and Reporting Program No. 96-248, adopted on September 20, 1996,
or in Appendix C of the Amended Report of Waste Discharge (Fisher 1995) c Results followed by “est” have estimated values between the MDL and the reporting limit for that compound d California soluble threshold limit concentration (STLC), i.e., hazardous waste limit, not noted in WDR 96-248 e NA = Not applicable
f NL = No limit
UCRL-AR-125915-04-4 LLNL Experimental Test Site 300 Annual/Fourth Quarter Report 2004 Compliance Monitoring Report for WDR 96-248
WGMG05:030:ER:RB:cc A-98
Table A-1.3 Photographic process rinsewater monitoring, Building 851, constituents of concern
a MDL = Method detection limit b These discharge limits are found in the Monitoring and Reporting Program No. 96-248, adopted on September 20, 1996, or in Appendix C of the Amended Report of Waste
Discharge (Fisher, 1995) c California soluble threshold limit concentration (STLC), i.e., hazardous waste limit, not noted in WDR 96-248 d Results followed by "est" are compounds detected with concentrations estimated between the MDL and the reporting limit for that compound e NL = No limit
UCRL-AR-125915-04-4 LLNL Experimental Test Site 300 Annual/Fourth Quarter Report 2004 Compliance Monitoring Report for WDR 96-248
WGMG05:030:ER:RB:cc A-99
Table A-2.1 Chemistry area process wastewater monitoring, Building 827C/D, constituents of concern required by WDR 96-248.
11/10/03 results (discharged 3/4/04)
Parameter MDLa
range Reporting limit range Part 1 Part 2 Part 3 Part 4
b These discharge limits are found in the Monitoring and Reporting Program No. 96-248, adopted on September 20, 1996 or in Appendix C of the Amended Report of Waste Discharge (Fisher, 1995) c NL = No limit
d Results followed by “est” are compounds detected with concentrations estimated between the MDL and the reporting limit for that compound
e Analyzed using an uncertified method (there is no certified method for analysis of TATB)
f No other volatile or semivolatile organic compounds were detected via EPA Methods 624 or 625
UCRL-AR-125915-04-4 LLNL Experimental Test Site 300 Annual/Fourth Quarter Report 2004 Compliance Monitoring Report for WDR 96-248
WGMG05:030:ER:RB:cc A-100
Table A-2.2 Chemistry area process wastewater monitoring, Building 827E, constituents of concern required by WDR 96-248.
b These discharge limits are found in the Monitoring and Reporting Program No. 96-248, adopted on September 20, 1996 or in Appendix C of the Amended Report of Waste Discharge (Fisher, 1995) c NL = No limit
d Analyzed using an uncertified method (there is no certified method for analysis of TATB)
e No other volatile or semivolatile organic compounds were detected via EPA Methods 624 or 625.
f Results followed by “est” are compounds detected with concentrations estimated between the MDL and the reporting limit for that compound.
UCRL-AR-125915-04-4 LLNL Experimental Test Site 300 Annual/Fourth Quarter Report 2004 Compliance Monitoring Report for WDR 96-248
WGMG05:030:ER:RB:cc A-101
Table A-2.3 Chemistry area process wastewater monitoring, Building 827C/D, other constituents.
11/10/03 results (discharged 3/4/04)
Parameter MDLa range Reporting limit range Part 1 Part 2 Part 3 Part 4
b These discharge limits are found in the Monitoring and Reporting Program No. 96-248, adopted on September 20, 1996 or in Appendix C of the Amended Report of Waste Discharge (Fisher, 1995) c NAFL = Not available from laboratory
d California soluble threshold limit concentration (STLC), i.e., hazardous waste limit, not noted in WDR 96-248
e NL = No limit
UCRL-AR-125915-04-4 LLNL Experimental Test Site 300 Annual/Fourth Quarter Report 2004 Compliance Monitoring Report for WDR 96-248
WGMG05:030:ER:RB:cc A-102
Table A-2.4 Chemistry area process wastewater monitoring, Building 827E, other constituents.
a MDL = Method detection limit b These discharge limits are found in the Monitoring and Reporting Program No. 96-248, adopted on September 20, 1996, or in Appendix C of the Amended Report of Waste Discharge
(Fisher, 1995) c NAFL= Not available from laboratory d California soluble threshold limit concentration (STLC), i.e., hazardous waste limit, not noted in WDR 96-248 e NL = No limit
UCRL-AR-125915-04-4 LLNL Experimental Test Site 300 Annual/Fourth Quarter Report 2004 Compliance Monitoring Report for WDR 96-248
WGMG05:030:ER:RB:cc A-103
Table A-3.1 Explosive process area wastewater monitoring, Building 806/807, constituents of concern
a MDL = Method detection limit b These discharge limits are found either in the Monitoring and Reporting Program No. 96-248, adopted on September 20, 1996, or in Appendix C of the
Amended Report of Waste Discharge (1995) c NL = No limit d Results followed by “est” are compounds detected with concentrations estimated between the MDL and the reporting limit for that compound e NA = Not applicable f Analyzed using an uncertified method (there is no certified method for analysis of TATB) g No other volatile or semivolatile organic compounds were detected via EPA Methods 624 or 625
UCRL-AR-125915-04-4 LLNL Experimental Test Site 300 Annual/Fourth Quarter Report 2004 Compliance Monitoring Report for WDR 96-248
WGMG05:030:ER:RB:cc A-105
Table A-3.2 Explosive process area wastewater monitoring, Building 817, constituents of concern
a MDL = Method detection limit b These discharge limits are found either in the Monitoring and Reporting Program No. 96-248, adopted on September 20, 1996, or in Appendix C of the
Amended Report of Waste Discharge (1995) c NL = No limit d Results followed by “est” are compounds detected with concentrations estimated between the MDL and the reporting limit for that compound e NA = Not applicable f Analyzed using an uncertified method (there is no certified method for analysis of TATB) g No other volatile or semivolatile organic compounds were detected via EPA Methods 624 or 625
UCRL-AR-125915-04-4 LLNL Experimental Test Site 300 Annual/Fourth Quarter Report 2004 Compliance Monitoring Report for WDR 96-248
WGMG05:030:ER:RB:cc
Appendix B
Annual Summary Plots and Tables of Surface Impoundments Ground Water
Monitoring Data
UCRL-AR-125915-04-4 LLNL Experimental Test Site 300 Annual/Fourth Quarter Report 2004 Compliance Monitoring Report for WDR 96-248
WGMG05:030:ER:RB:cc B-1
Appendix B This appendix contains graphical and tabular summaries of ground water monitoring data from the surface impoundments ground water monitoring network. The constituents of concern for WDR 96-248 are shown graphically, and the tables at the end of this appendix list all 2004 ground water data. The data plots contain all monitoring data available since 1999.
These plots display the field parameter of ground water elevation, followed by volatile organic compounds (VOCs), trace metals, photographic chemicals (cresols), minerals and nutrients, energetic compounds, and finally, semi-volatile organic compounds (SVOCs). The upgradient (background) monitoring well W-817-01 is always plotted first for each analyte.
Each two-dimensional graph shows concentration plotted on the vertical axis versus time (years divided into four quarterly sampling periods) on the horizontal axis. Units of measure are given on the vertical axis label and in the header at the top of each page. Values above the analytical reporting limit for each analyte are plotted as solid diamonds, values below the reporting limit are plotted as open inverted triangles, and estimated values between the reporting limit and the method detection limit are plotted as crosses. The current statistical limits (SLs) for constituents of concern specified in WDR 96-248 are shown as horizontal dashed lines on the graph.
UCRL-AR-125915-04-4 LLNL Experimental Test Site 300 Annual/Fourth Quarter Report 2004 Compliance Monitoring Report for WDR 96-248
WGMG05:030:ER:RB:cc B-2
This Page Intentionally Left Blank
UCRL-AR-125915-04-4 LLNL Experimental Test Site 300 Annual/Fourth Quarter Report 2004 Compliance Monitoring Report for WDR 96-248
Barium W-817-01 NA <0. 025 0 011 est 0. 012 est 0. 012 estW-817-02 0. 025 0. 0077 est 0 0089 est 0. 0091 est 0. 013 estW-817-03 0. 025 0. 0086 est 0 0083 est 0. 0095 est 0. 0079 estW-817-04 0. 025 0. 008 est 0 0085 est 0. 0097 est 0. 0086 est
a Statistical limit as listed in MRP 96-248, Table 5, modified by CVRWQCB letter (Cohen 1998) dated September 25, 1998.b NA = Not applicable.c Results followed by an "est" have estimated concentrations between the MDL and the reporting limit for that analyte.d The exceedance of the SL was confirmed by retest sample results.e The exceedance of the SL was not confirmed by retest sample results.f NS = Not sampled. Water from well W-817-01 was not analyzed for energetic materials, except for TATB.
result2nd Quarter
result4th Quarter
result3rd Quarter
result1st QuarterStatistical
limit a
WGMG05:030:ER:RB:cc B-112
UCRL-AR-125915-04-4 LLNL Experimental Test Site 300Compliance Monitoring Report for WDR 96-248
Annual/Fourth Quarter Report 2004
Table B-1.2 Fourth quarter ground water analytical results, surface impoundments, constituents of concern required by WDR 96-248.Retest 1 Retest 2
Sample result resultParameter Well date 12/2/04 12/13/04
a MDL = Method detection limit.b Statistical limit as listed in MRP 96-248, Table 5, modified by CVRWQCB letter (Cohen 1998) dated September 25, 1998.c NA = Not applicable.d Results followed by an "est" have estimated concentrations between the MDL and the reporting limit for that analyte.e These concentrations of ammonia may be biased high because ammonia was detected in the field blank sample at a concentration of 0.03 mg/L. See also Appendix F and Table F-2.1.f None of the retest samples collected and analyzed for ammonia from wells W-817-02 and W-817-04 exceeded the SL of 0.02 mg/L.g The retest sample collected from well W-817-03 on Dec. 2, 2004, and analyzed for ammonia exceeded the SL.h NS = Not sampled and analyzed for this COC.
ResultReporting Statistical
NA c
MDL a limit limit b
WGMG05:030:ER:RB:cc B-120
UCRL-AR-125915-04-4 LLNL Experimental Test Site 300Compliance Monitoring Report for WDR 96-248
Annual/Fourth Quarter Report 2004
Table B-2 Fourth quarter ground water analytical results, surface impoundments, other constituents.Sample
Parameter Well dateGeneralGround water elevation W-817-01 13-Dec-04 NA b NA NS c
(meters above mean sea level) W-817-02 13-Dec-04 NA NA 178. 85W-817-03 13-Dec-04 NA NA 174. 49W-817-04 13-Dec-04 NA NA 184. 83
Field pH (unitless) W-817-01 01-Nov-04 NA NA 7. 95W-817-02 13-Dec-04 NA NA 7. 86W-817-03 13-Dec-04 NA NA 7. 88W-817-04 13-Dec-04 NA NA 8. 01
Specific conductance (µmhos/cm) W-817-01 01-Nov-04 NA NA 1377W-817-02 13-Dec-04 NA NA 2023W-817-03 13-Dec-04 NA NA 1658W-817-04 13-Dec-04 NA NA 1760
Water temperature (°Celsius) W-817-01 01-Nov-04 NA NA 20. 7W-817-02 13-Dec-04 NA NA 19 4W-817-03 13-Dec-04 NA NA 20. 6W-817-04 13-Dec-04 NA NA 19. 6
(continued)
ResultMDL aReporting
limit
WGMG05:030:ER:RB:cc B-121
UCRL-AR-125915-04-4 LLNL Experimental Test Site 300Compliance Monitoring Report for WDR 96-248
Annual/Fourth Quarter Report 2004
Table B-2 Fourth quarter ground water analytical results, surface impoundments, other constituents.Sample
W-817-02 29-Oct-04 NA NA NDW-817-03 29-Oct-04 NA NA NDW-817-04 1-Nov-04 NA NA ND
a MDL = Method detection limit.b NA = Not applicable.c NS = Not sampled and anlyzed for this parameter.d No other volatile or semi-volatile organic compounds (other than those listed in Table B-1.2) were detected by EPA Methods 624 and 625.e Results followed by an "est" have estimated concentrations between the MDL and the reporting limit for that analyste.f No other energetic materials (other than those listed in Table B-1.2) were detected by EPA Method 8330 in the fourth quarter.g Tentatively identified compounds (TICs) identified in ground water analyses using EPA Method 625 for semi-volatile organics.h ND = Not detected.
WGMG05:030:ER:RB:cc B-123
UCRL-AR-125915-04-4 LLNL Experimental Test Site 300 Annual/Fourth Quarter Report 2004 Compliance Monitoring Report for WDR 96-248
WGMG05:030:ER:RB:cc
Appendix C
Annual Summary Plots and Tables of Sewage Evaporation and Percolation Ponds
Wastewater Monitoring Data
UCRL-AR-125915-04-4 LLNL Experimental Test Site 300 Annual/Fourth Quarter Report 2004 Compliance Monitoring Report for WDR 96-248
WGMG05:030:ER:RB:cc C-1
Appendix C This appendix contains graphical and tabular summaries of the 2004 sewage evaporation and percolation ponds wastewater monitoring data. The monitoring requirements of WDR 96-248 began in the fourth quarter of 1996. Wastewater influent monitoring at location ISWP consists of pH, electrical conductivity (EC), and biochemical oxygen demand (BOD). Routine wastewater monitoring at location ESWP consists of pH, EC, and dissolved oxygen (DO); BOD was also analyzed only during the first quarter of 2004. A continuous discharge from the sewage evaporation pond into the percolation pond at location DSWP began in December 2003 and continued into the first quarter of 2004. Samples of the continuous discharge were collected on January 27 and February 25, 2004, and analyzed for pH, EC, BOD, nitrate, and fecal and total coliform bacteria. Each two-dimensional graph plots concentration on the vertical axis versus time (years divided into four quarterly sampling periods) on the horizontal axis. Units of measure are given on the vertical axis label and in the header at the top of each page. Values above the analytical reporting limit for each analyte are plotted as solid diamonds, and values below the analytical reporting limit are plotted as open inverted triangles. Data determined not to be valid are not plotted. Tabular summaries of the observations are contained in Tables C-1 to C-4, starting on page C-18.
UCRL-AR-125915-04-4 LLNL Experimental Test Site 300 Annual/Fourth Quarter Report 2004 Compliance Monitoring Report for WDR 96-248
WGMG05:030:ER:RB:cc C-2
This Page Intentionally Left Blank
UCRL-AR-125915-04-4 LLNL Experimental Test Site 300 Annual/Fourth Quarter Report 2004 Compliance Monitoring Report for WDR 96-248
WGMG05:030:ER:RB:cc
Annual Plots of Sewage Evaporation and Percolation Ponds
Wastewater Monitoring Data
Sample quarter
pH (
Uni
ts)
02
46
810
02
46
810
199
100
101
102
103
104
105
3 3 3 3 3 32 2 2 2 2 24 4 4 4 4 4
Influent 3−ISWP−OW
Sewage Ponds WastewaterpH (Units)
UCRL−AR−125915−04−4 LLNL Experimental Test Site 300Compliance Monitoring Report for WDR 96−248
Annual/Fourth Quarter Report 2004
C−3
Above RLBelow RL
Sample quarter
pH (
Uni
ts)
02
46
810
02
46
810
199
100
101
102
103
104
105
3 3 3 3 3 32 2 2 2 2 24 4 4 4 4 4
In−pond 3−ESWP−OW
Sample quarter
pH (
Uni
ts)
02
46
810
02
46
810
199
100
101
102
103
104
105
3 3 3 3 3 32 2 2 2 2 24 4 4 4 4 4
Effluent 3−DSWP−OW
Sewage Ponds WastewaterpH (Units)
UCRL−AR−125915−04−4 LLNL Experimental Test Site 300Compliance Monitoring Report for WDR 96−248
UCRL−AR−125915−04−4 LLNL Experimental Test Site 300Compliance Monitoring Report for WDR 96−248
Annual/Fourth Quarter Report 2004
C−15
Above RLBelow RL
Sample quarter
Nitr
ite (
as N
) (m
g/L)
0.0
0.1
0.2
0.3
0.4
0.5
0.0
0.1
0.2
0.3
0.4
0.5
101
102
103
104
105
3 3 3 32 2 2 24 4 4 4
Effluent 3−DSWP−OW
Sewage Ponds WastewaterNitrite (as N) (mg/L)
UCRL−AR−125915−04−4 LLNL Experimental Test Site 300Compliance Monitoring Report for WDR 96−248
Annual/Fourth Quarter Report 2004
C−16
Above RLBelow RL
Sample quarter
Nitr
ite (
as N
O2)
(m
g/L)
0.0
0.1
0.2
0.3
0.4
0.5
0.0
0.1
0.2
0.3
0.4
0.5
101
102
103
104
105
3 3 3 32 2 2 24 4 4 4
Effluent 3−DSWP−OW
Sewage Ponds WastewaterNitrite (as NO2) (mg/L)
UCRL−AR−125915−04−4 LLNL Experimental Test Site 300Compliance Monitoring Report for WDR 96−248
Annual/Fourth Quarter Report 2004
C−17
Above RLBelow RL
UCRL-AR-125915-04-4 LLNL Experimental Test Site 300 Annual/Fourth Quarter Report 2004 Compliance Monitoring Report for WDR 96-248
WGMG05:030:ER:RB:cc C-18
Table C-1 2004 summary of sewage pond observations.
Month
Freeboarda
Color
Odor
Levee condition January 0.57 b –0.59 b Green – brown-
green Slight Animal burrows and erosion are okay,
weed control is okay February 0.55 b–0.58 b Green – green-brown Slight Animal burrows and erosion are okay,
weed control is okay March 0.55 b–0.63 Green – brown-
green Slight Animal burrows and erosion are okay,
weed control is okay April 0.69-0.71 Green Slight Animal burrows and erosion are okay,
weed control is okay May 0.69-0.74 Green Slight Animal burrows and erosion are okay,
weed control is okay June 0.64-0.72 Green Slight Animal burrows and erosion are okay,
weed control is okay July 0.67 –0.72 Green Slight Animal burrows and erosion are okay,
weed control is okay August 0.68–0.69 Green Slight Animal burrows and erosion are okay,
weed control is okay September 0.69–0.71 Green Slight Animal burrows and erosion are okay,
weed control is okay October 0.65–0.70 Green Slight Animal burrows and erosion are okay,
weed control is okay November 0.62–0.65 Green Slight Animal burrows and erosion are okay,
weed control is okay December
0.59 b-0.62 Green Slight Animal burrows and erosion are okay,
weed control is okay
a Minimum freeboard is 0.61 m = 2 ft. b
Freeboard in the evaporation pond was slightly less than 0.61 m (2 ft), as the evaporation pond overfilled and then continuously discharged to the percolation pond.
a Sample was saturated with dissolved oxygen (DO), according to analytical laboratory. Table C-4 2004 sewage percolation pond discharge location (Location DSWP).
Total coliform (MPN a/100 mL) None 1,600 1,600 Nitrate as NO3 None < 0.5 < 2.2
a MPN = Most probable number (of organisms).
UCRL-AR-125915-04-4 LLNL Experimental Test Site 300 Annual/Fourth Quarter Report 2004 Compliance Monitoring Report for WDR 96-248
WGMG05:030:ER:RB:cc
Appendix D
Annual Summary Plots and Tables of Sewage Evaporation and Percolation Ponds
Ground Water Monitoring Data
UCRL-AR-125915-04-4 LLNL Experimental Test Site 300 Annual/Fourth Quarter Report 2004 Compliance Monitoring Report for WDR 96-248
WGMG05:030:ER:RB:cc D-1
Appendix D This appendix contains graphical and tabular summaries of ground water monitoring data from the sewage ponds ground water network. These plots contain all monitoring data available since LLNL began sampling from upgradient ground water monitoring wells W-7E, W-7ES, and W-7PS; from cross-gradient ground water monitoring well W-35A-04; and from downgradient ground water monitoring wells W-26R-01, W-26R-11, W-26R-05, W-25N-20, and W-7DS in 1987.
The plots display field parameters of ground water elevation, pH, electrical conductivity (EC), total coliform bacteria, fecal coliform bacteria, and finally nitrate (as NO3). The upgradient (background) monitoring wells W-7E, W-7ES, and W-7PS are always plotted first for each analyte.
Each two-dimensional graph shows concentration plotted on the vertical axis versus time (years divided into four quarterly sampling periods) on the horizontal axis. Units of measure are given on the vertical axis label and in the header at the top of each page. Values above the analytical reporting limit for each analyte are plotted as solid diamonds, and values below the reporting limit are plotted as open inverted triangles.
UCRL-AR-125915-04-4 LLNL Experimental Test Site 300 Annual/Fourth Quarter Report 2004 Compliance Monitoring Report for WDR 96-248
WGMG05:030:ER:RB:cc D-2
This Page Intentionally Left Blank
UCRL-AR-125915-04-4 LLNL Experimental Test Site 300 Annual/Fourth Quarter Report 2004 Compliance Monitoring Report for WDR 96-248
WGMG05:030:ER:RB:cc
Annual Plots of Sewage Evaporation and Percolation Ponds
Ground Water Monitoring Data
Sample quarter
GW
Ele
vatio
n (F
eet)
440
460
480
500
520
540
440
460
480
500
520
540
199
100
101
102
103
104
105
3 3 3 3 3 32 2 2 2 2 24 4 4 4 4 4
Upgradient Monitor Well W−7E
Sewage Ponds Ground WaterGW Elevation (Feet)
UCRL−AR−125915−04−4 LLNL Experimental Test Site 300Compliance Monitoring Report for WDR 96−248
Annual/Fourth Quarter Report 2004
D−3
Sample quarter
GW
Ele
vatio
n (F
eet)
440
460
480
500
520
540
440
460
480
500
520
540
199
100
101
102
103
104
105
3 3 3 3 3 32 2 2 2 2 24 4 4 4 4 4
Upgradient Monitor Well W−7ES
Sample quarter
GW
Ele
vatio
n (F
eet)
440
460
480
500
520
540
440
460
480
500
520
540
199
100
101
102
103
104
105
3 3 3 3 3 32 2 2 2 2 24 4 4 4 4 4
Upgradient Monitor Well W−7PS
Sewage Ponds Ground WaterGW Elevation (Feet)
UCRL−AR−125915−04−4 LLNL Experimental Test Site 300Compliance Monitoring Report for WDR 96−248
Annual/Fourth Quarter Report 2004
D−4
Sample quarter
GW
Ele
vatio
n (F
eet)
440
460
480
500
520
540
440
460
480
500
520
540
199
100
101
102
103
104
105
3 3 3 3 3 32 2 2 2 2 24 4 4 4 4 4
Crossgradient Monitor Well W−35A−04
Sample quarter
GW
Ele
vatio
n (F
eet)
440
460
480
500
520
540
440
460
480
500
520
540
199
100
101
102
103
104
105
3 3 3 3 3 32 2 2 2 2 24 4 4 4 4 4
Downgradient Monitor Well W−7DS
Sewage Ponds Ground WaterGW Elevation (Feet)
UCRL−AR−125915−04−4 LLNL Experimental Test Site 300Compliance Monitoring Report for WDR 96−248
Annual/Fourth Quarter Report 2004
D−5
Sample quarter
GW
Ele
vatio
n (F
eet)
440
460
480
500
520
540
440
460
480
500
520
540
199
100
101
102
103
104
105
3 3 3 3 3 32 2 2 2 2 24 4 4 4 4 4
Downgradient Monitor Well W−25N−20
Sample quarter
GW
Ele
vatio
n (F
eet)
440
460
480
500
520
540
440
460
480
500
520
540
199
100
101
102
103
104
105
3 3 3 3 3 32 2 2 2 2 24 4 4 4 4 4
Downgradient Monitor Well W−26R−01
Sewage Ponds Ground WaterGW Elevation (Feet)
UCRL−AR−125915−04−4 LLNL Experimental Test Site 300Compliance Monitoring Report for WDR 96−248
Annual/Fourth Quarter Report 2004
D−6
Sample quarter
GW
Ele
vatio
n (F
eet)
440
460
480
500
520
540
440
460
480
500
520
540
199
100
101
102
103
104
105
3 3 3 3 3 32 2 2 2 2 24 4 4 4 4 4
Downgradient Monitor Well W−26R−05
Sample quarter
GW
Ele
vatio
n (F
eet)
440
460
480
500
520
540
440
460
480
500
520
540
199
100
101
102
103
104
105
3 3 3 3 3 32 2 2 2 2 24 4 4 4 4 4
Downgradient Monitor Well W−26R−11
Sewage Ponds Ground WaterGW Elevation (Feet)
UCRL−AR−125915−04−4 LLNL Experimental Test Site 300Compliance Monitoring Report for WDR 96−248
Annual/Fourth Quarter Report 2004
D−7
Sample quarter
pH (
Uni
ts)
7.5
8.0
8.5
9.0
9.5
7.5
8.0
8.5
9.0
9.5
199
100
101
102
103
104
105
3 3 3 3 3 32 2 2 2 2 24 4 4 4 4 4
Upgradient Monitor Well W−7E
Sewage Ponds Ground WaterpH (Units)
UCRL−AR−125915−04−4 LLNL Experimental Test Site 300Compliance Monitoring Report for WDR 96−248
Annual/Fourth Quarter Report 2004
D−8
Above RLBelow RL
Sample quarter
pH (
Uni
ts)
7.0
7.5
8.0
8.5
7.0
7.5
8.0
8.5
199
100
101
102
103
104
105
3 3 3 3 3 32 2 2 2 2 24 4 4 4 4 4
Upgradient Monitor Well W−7ES
Sample quarter
pH (
Uni
ts)
7.0
7.5
8.0
8.5
7.0
7.5
8.0
8.5
199
100
101
102
103
104
105
3 3 3 3 3 32 2 2 2 2 24 4 4 4 4 4
Upgradient Monitor Well W−7PS
Sewage Ponds Ground WaterpH (Units)
UCRL−AR−125915−04−4 LLNL Experimental Test Site 300Compliance Monitoring Report for WDR 96−248
Annual/Fourth Quarter Report 2004
D−9
Above RLBelow RL
Sample quarter
pH (
Uni
ts)
7.0
7.5
8.0
8.5
7.0
7.5
8.0
8.5
199
100
101
102
103
104
105
3 3 3 3 3 32 2 2 2 2 24 4 4 4 4 4
Crossgradient Monitor Well W−35A−04
Sample quarter
pH (
Uni
ts)
7.0
7.5
8.0
8.5
7.0
7.5
8.0
8.5
199
100
101
102
103
104
105
3 3 3 3 3 32 2 2 2 2 24 4 4 4 4 4
Downgradient Monitor Well W−7DS
Sewage Ponds Ground WaterpH (Units)
UCRL−AR−125915−04−4 LLNL Experimental Test Site 300Compliance Monitoring Report for WDR 96−248
Annual/Fourth Quarter Report 2004
D−10
Above RLBelow RL
Sample quarter
pH (
Uni
ts)
7.0
7.5
8.0
8.5
9.0
7.0
7.5
8.0
8.5
9.0
199
100
101
102
103
104
105
3 3 3 3 3 32 2 2 2 2 24 4 4 4 4 4
Downgradient Monitor Well W−25N−20
Sample quarter
pH (
Uni
ts)
7.0
7.5
8.0
8.5
7.0
7.5
8.0
8.5
199
100
101
102
103
104
105
3 3 3 3 3 32 2 2 2 2 24 4 4 4 4 4
Downgradient Monitor Well W−26R−01
Sewage Ponds Ground WaterpH (Units)
UCRL−AR−125915−04−4 LLNL Experimental Test Site 300Compliance Monitoring Report for WDR 96−248
Annual/Fourth Quarter Report 2004
D−11
Above RLBelow RL
Sample quarter
pH (
Uni
ts)
7.0
7.5
8.0
8.5
9.0
7.0
7.5
8.0
8.5
9.0
199
100
101
102
103
104
105
3 3 3 3 3 32 2 2 2 2 24 4 4 4 4 4
Downgradient Monitor Well W−26R−05
Sample quarter
pH (
Uni
ts)
7.0
7.5
8.0
8.5
9.0
7.0
7.5
8.0
8.5
9.0
199
100
101
102
103
104
105
3 3 3 3 3 32 2 2 2 2 24 4 4 4 4 4
Downgradient Monitor Well W−26R−11
Sewage Ponds Ground WaterpH (Units)
UCRL−AR−125915−04−4 LLNL Experimental Test Site 300Compliance Monitoring Report for WDR 96−248
a NA = Not applicable.b MPN = Most probable number (of organisms).
Reporting WDR 96-248(Aug. 30 - Sep. 14)
None
None
Third quarterresultresult
(Mar. 2 - Mar. 10)
limit limit
None
None
First quarter
None
None None
None
None
WGMG05:030:ER:RB:cc D-34
UCRL-AR-125915-04-4 LLNL Experimental Test Site 300 Annual/Fourth Quarter Report 2004 Compliance Monitoring Report for WDR 96-248
WGMG05:030:ER:RB:cc
Appendix E
Statistical Analyses for Ground Water Data
UCRL-125915-04-04 LLNL Experimental Test Site 300 Annual/Fourth Quarter Report 2004 Compliance Monitoring Report for WDR 96-248
WGMG05:030:ER:RB:cc E-1
Appendix E Statistical Analyses
Statistical Methods Statistical methods are used to detect increases in concentrations of COCs that may indicate releases of COCs to ground water. The CVRWQCB Standard Provisions (1993) accompanying WDR 96-248 require the use of statistical methods from the California Code of Regulations (CCR), Title 23, Chapter 3, Subchapter 15.
Two statistical methods, prediction intervals and control charts, are used to generate concentration limits and statistical test limits (SLs) for COCs in ground water samples from the surface impoundments monitoring network. Both methods are sensitive in indicating COC concentration increases, and both methods require only one sample per monitoring well for each COC per quarter. Prediction intervals are used when COC concentrations are statistically similar in each of the three down gradient wells to those in the upgradient well, W-817-01. The method of control charts is used when COC concentrations in the downgradient wells are statistically different from those in the upgradient well. A COC is considered to have exceeded its concentration limit when a single ground water analytical result exceeds its SL and either of two subsequent re-tests also exceeds the SL (Table B-1.2). Table E-1 provides a summary and status of the reported COCs that have shown statistically significant evidence of release.
Table E-1. Reported COCs showing statistically significant evidence of release.
Constituent
Date first reported
Monitor wells
Status of investigation
Zinc 1/9/97 W-817-02, W-817-03 In progress, CERCLA
Chloride 2/7/97 W-817-03 Complete
Arsenic 4/14/97 W-817-02, W-817-03, W-817-04
In progress, under CERCLA
Chromium 7/14/99 W-817-04 Transferred to CERCLA
Bicarbonate alkalinity 7/2/2001 W-817-04 Complete
Manganese 7/2/2001 W-817-04 Complete
Ammonia, as nitrogen 1/24/2002 1/27/05
W-817-04 W-817-02
Complete In progress
Bromide 10/23/02 W-817-03, W-817-02 Transferred to CERCLA
UCRL-125915-04-04 LLNL Experimental Test Site 300 Annual/Fourth Quarter Report 2004 Compliance Monitoring Report for WDR 96-248
WGMG05:030:ER:RB:cc E-2
RDX 10/24/2004 W-817-03, W-817-04 Complete, no confirmation by retest samples
PETN 10/24/2004 W-817-02 Complete, no confirmation by retest samples
4-Amino-2,6-dinitrotoluene 10/24/2004 W-817-03 Complete, no confirmation by retest samples
UCRL-AR-125915-04-4 LLNL Experimental Test Site 300 Annual/Fourth Quarter Report 2004 Compliance Monitoring Report for WDR 96-248
WGMG05:030:ER:RB:cc
Appendix F
Fourth Quarter Quality Assurance/Quality Control
Monitoring Data Discussion, Surface Impoundments Monitoring Networks
UCRL-AR-125915-04-4 LLNL Experimental Test Site 300 Annual/Fourth Quarter Report 2004 Compliance Monitoring Report for WDR 96-248
WGMG05:030:ER:RB:cc F-1
Appendix F Quality Assurance/Quality Control
1.0 Quality Assurance (QA) Program To ensure data quality, LLNL utilizes an extensive written set of protocols and procedures that covers all aspects of ground water and surface water sampling, sample tracking, and environmental data management. The LLNL Livermore Site and Site 300 Environmental Restoration Project Standard Operating Procedures (Goodrich and Depue, 2004), and the Environmental Monitoring Plan (Althouse et al., 2002) form the set of written instructions to be followed. Observing these protocols prevents inadvertent sample contamination and maintains sample integrity from the sampling location to the analytical laboratories. Data management procedures ensure that all laboratory measurements are received, accurately recorded, and properly stored in a computer database for easy and fast retrieval. Hard copies of the data are also archived. All sample analyses for the surface water impoundments meet the reporting criteria delineated in the Permit as modified by Wendy Cohen of CVRWQCB on September 25, 1998 (Cohen, 1998) (Tables F-1.1 through F-2.2).
1.1 Field Procedures As a part of the QA program, data quality for the sampling activities during each quarter is assessed by the following method: field blanks use analyte-free water for the analyses of organic compounds and high-performance liquid chromatography (HPLC)-grade water for all other required analyses. Field blanks, which are prepared at monitor wells and wastewater sample locations chosen at random, are analyzed for parameters identical to those for the routine samples. Field blank data are reviewed by analysts to determine whether contamination has been introduced into the samples as a result of field conditions or sample handling procedures.
1.1.1 Process Wastewater Influent Field QA procedures include adherence to the Environmental Monitoring Plan (Althouse et al., 2002). These include approved procedures for: sample preparation, handling, preservation, custody, and equipment decontamination procedures. Field activities are recorded on field tracking forms and/or in logbooks, and sample tracking is maintained through the chain-of-custody process. Field QA protocols include the preparation of at least 10 percent duplicate or collocated samples. The purpose of field duplicates is to verify the precision and comparability of the sampling activity. Additionally, temperature blanks are included in each shipping container of samples to verify that the temperature is maintained at 4° ± 2° Celsius until receipt at the analytical laboratories.
UCRL-AR-125915-04-4 LLNL Experimental Test Site 300 Annual/Fourth Quarter Report 2004 Compliance Monitoring Report for WDR 96-248
WGMG05:030:ER:RB:cc F-2
1.1.2 Ground Water Monitoring Field QA procedures include adherence to the sampling and analysis protocols of the LLNL Livermore Site and Site 300 Environmental Restoration Project Standard Operating Procedures (Goodrich and Depue, 2004). These include approved procedures for: sample collection, preparation, handling, preservation, custody, and equipment decontamination procedures. Field activities are recorded on field sampling sheets and/or in logbooks, and sample tracking is maintained through the chain-of-custody process. Field QA protocols include the preparation of at least 10 percent duplicate or collocated samples. The purpose of field collocated samples is to verify the precision of the sampling and analysis activities. Significant differences between duplicate samples (which should have identical results within the margin of sampling and analytical errors) are investigated by the responsible analysts, in collaboration with an LLNL quality control chemist. Field blanks are prepared at random locations to assess sample hygiene and handling practices.
1.2 Analytical Laboratories LLNL contracts with several outside analytical laboratories. They provide routine analytical services that meet the requirements of LLNL’s QA documents, as well as the requirements cited in the Permit. Analytical laboratories used by LLNL and each laboratory’s responsible person are:
• BC Laboratories, Inc. 4100 Atlas Court Bakersfield, CA 93308 Laboratory Responsible Person: Chrissy Herndon
• General Engineering Laboratories P.O. Box 30712 2040 Savage Road Charleston, SC 29414 Laboratory Responsible Person: Cheryl Jones
• Sequoia 885 Jarvis Drive Morgan Hill, CA 95037 Laboratory Responsible Person: Lisa Race
These laboratories perform extensive quality control analyses including: method blank analyses, analyses of laboratory control samples (LCS), matrix spike (MS), and matrix spike duplicates (MSD), and analyses of surrogate samples for organic compounds. Additionally, these laboratories provide data reports of tentatively identified compounds (TICs) for volatile and semivolatile organic compounds (VOCs and SVOCs), analyzed by gas chromatography/mass spectroscopy, and provide estimated concentrations. (TICs are currently reported in the data tables of this report.) Each of these laboratories is accredited by the California Department of Health Services for the analyses
UCRL-AR-125915-04-4 LLNL Experimental Test Site 300 Annual/Fourth Quarter Report 2004 Compliance Monitoring Report for WDR 96-248
WGMG05:030:ER:RB:cc F-3
performed. Résumés of the analysts’ education and qualifications are available through each laboratory.
2.0 Quality Assurance and Quality Control Results
2.1 Process Wastewater Influent Field QA/QC data discussed in this section are contained in Table F-1.1.
Routine fourth quarter photographic process rinsewater samples were submitted to Sequoia and duplicate samples were submitted to BC Laboratories, Inc. for interlaboratory comparison. Metals and pH laboratory QA/QC (i.e., MS/MSD and LCS) data associated with the samples, verified per EPA Functional Guidelines for data review (U.S. Environmental Protection Agency, 1994a and 1994b), showed that all data are usable.
Representative samples were collected from the retention tank at Building 823 on November 23, 2004. Metal concentrations show the variations experienced for certain metals (such as copper, silver and zinc) between the routine and duplicate samples collected from the Building 823 retention tank. No metals were detected in the method blank above laboratory reporting limits (Table F-1.1).
2.2 Ground Water Monitoring Analyte concentrations of routine and duplicate samples collected from down gradient monitor well W-817-02 are in very good agreement for the COCs detected above their respective reporting limits (Table F-2.1).
No COC or non-COC compounds were detected in method blank samples above laboratory reporting limits during the fourth quarter (Tables F-2.1 and F-2.2). Of the COCs, only ammonia as N (0.03 mg/L) and dissolved zinc (0.0059 mg/L est.) were detected in field blank samples at concentrations that could potentially be of regulatory significance (Table F-2.1). Concentrations of ammonia as N in the routine fourth quarter ground water samples collected from all three down gradient wells – W-817-02, W-817-03, and W-817-04 – exceeded the current SL of 0.02 mg/L (Tables B-1.1 and B-1.2). Those analytical results are likely biased high due to the detectable presence of ammonia in the field blank sample (Table F-2.1). Ammonia was detected in only one of the six retest samples collected from those three wells (Table B-1.2). The estimated concentration of 0.0059 mg/L of dissolved zinc detected in the field blank sample indicates that the concentrations detected in the ground water samples collected from all four wells might be biased high due to field contamination. However, this is not a significant issue for zinc because concentrations in the down gradient wells did not exceed any SL for zinc. Recoveries for all LCS samples and for all MS and MSD samples are within laboratory acceptance limits, so that these data meet all requirements for data accuracy as well as precision.
UCRL-AR-125915-04-4 LLNL Experimental Test Site 300 Annual/Fourth Quarter Report 2004 Compliance Monitoring Report for WDR 96-248
WGMG05:030:ER:RB:cc F-4
Laboratory QA/QC (i.e., MS/MSD and LCS) data associated with all ground water samples and evaluated per EPA Functional Guidelines for data review (U.S. Environmental Protection Agency, 1994a and 1994b), showed all parameters within acceptable ranges for data usability.
UCRL-AR-125915-04-4 LLNL Experimental Test Site 300 Annual/Fourth Quarter Report 2004 Compliance Monitoring Report for WDR 96-248
WGMG05:030:ER:RB:cc
F-5
Table F-1.1 Photographic process rinsewater QA/QC results, Building 823, constituents of concern required by WDR 96-248.
Building 823 Sampled 11/23/04
Parameter MDLa Reporting limit Routine sampleb Duplicate sampleb Method blankb General parameters pH (unitless) 2.0 2.0 8.2 NAc NA
Metals (mg/L) Antimony 0.0002 0.0005 0.00028 estd 0.0007 est 0.00021 est Arsenic 0.0002 0.001 0.0012 < 0.002 < 0.001 Barium 0.000037 0.001 0.008 0.0094 est < 0.001 Beryllium 0.000012 0.0005 < 0.0005 < 0.0002 < 0.0005 Cadmium 0.000014 0.00025 0.00012 est 0.0004 est < 0.00025 Chromium 0.00013 0.002 0.0025 0.002 0.00067 est Cobalt 0.000009 0.001 0.000074 est < 0.05 < 0.001 Copper 0.00006 0.0005 0.038 0.05 0.000073 est Lead 0.000012 0.0005 0.0015 0.002 est 0.000025 est Manganese 0.00015 0.01 0.009 est 0.0098 est < 0.01 Molybdenum 0.000015 0.001 0.019 0.022 est 0.000039 est Nickel 0.000035 0.001 0.0034 0.004 0.000043 est Potassium 0.3 1.0 12.0 9.2 < 1.0 Silver 0.0006 0.005 0.18 0.051 < 0.00025 Thallium 0.000002 0.001 < 0.001 < 0.001 < 0.001 Vanadium 0.00068 0.001 < 0.001 < 0.01 < 0.001 Zinc 0.0013 0.005 0.089 0.11 0.00141 est
a MDL = Method detection limit
b Routine sample and blank analyzed by Sequoia Analytical; duplicate sample by BC Laboratories c NA = Not applicable d Results followed by “est” have estimated values between the MDL and the reporting limit for that compound
UCRL-AR-125915-04-4 LLNL Experimental Test Site 300Compliance Monitoring Report for WDR 96-248
Annual/Fourth Quarter Report 2004
Table F-2.1 Ground water field QA/QC results, constituents of concern required by WDR 96-248.Monitoring well
2-amino-4,6-dinitrotoluene 0. 325 1. 00 0. 882 est d 1. 01 <1. 00 <1. 002,6-dinitrotoluene 0. 182 1. 00 <1. 00 <1. 00 <1. 00 <1. 00a MDL = Method detection limit.b Other than those listed in this subheading, no other compounds were detected using EPA Methods 624 or 625.c Other than those listed in this subheading, no other compounds were detected using EPA Method 8330.d Results followed by an "est" have estimated concentrations between the MDL and the reporting limit for that analyte.
Volatile/semivolatile organic compounds (µg/L)b
Field blank Method blankMDLa limit sample sample sample
Reporting
Metal (mg/L)
Routine Duplicatesample
WGMG05:030:ER:RB:cc F-9
Operations & Regulatory Affairs Division, Lawrence Livermore National Laboratory University of California, P.O. Box 808, L-627, Livermore, California 94551