Heider vs Simmel: Emergent Features in Dynamic Structures David Krackhardt 1 and Mark S. Handcock 2, 1 Carnegie Mellon University, Pittsburgh PA 15213-3890, USA [email protected]http://www.andrew.cmu.edu/ ∼ krack 2 University of Washington, Seattle WA 98195-4322, USA [email protected]http://www.stat.washington.edu/ ∼ handcock Abstract. Heider’s balance theory is ubiquitous in the field of social networks as an explanation for why we so frequently observe symmetry and transitivity in social relations. We propose that Simmelian tie the- ory could explain the same phenomena without resorting to motivational tautologies that characterize psychological explanations. Further, while both theories predict the same equilibrium state, we argue that they sug- gest different processes by which this equilibrium is reached. We develop a dynamic exponential random graph model (ERGM) and apply it to the classic panel data collected by Newcomb to empirically explore these two theories. We find strong evidence that Simmelian triads exist and are stable beyond what would be expected through Heiderian tendencies in the data. 1 Heider’s Balance Theory One of the central questions in the field of network analysis is: How do networks form? A cornerstone to our understanding of this process from a structural point of view has been Heider’s (1946) theory of balance[1]. According to this theory, a person is motivated to establish and maintain balance in their relationships. What constitutes balance has been the subject of some debate (e.g., [2, 3]), but the core principle has survived and underlies many of our attempts to model this process of network formation (see, for example, [4]). Heider’s (1946) original formulation of balance theory was broad, including people’s attitudes towards objects and ideas, not just towards other people. The unifying argument was that people felt comfortable if they agreed with others whom they liked; they felt uncomfortable if they disagreed with others they liked. Moreover, people felt comfortable if they disagreed with others whom they dis- liked; and people felt uncomfortable if they agreed with others whom they liked. We gratefully acknowledge the critical feedback we have received from David Hunter, Steve Goodreau and Carter T. Butts. The research of Handcock was supported by Grant DA012831 from NIDA and Grant HD041877 from NICHD. E.M. Airoldi et al. (Eds.): ICML 2006 Ws, LNCS 4503, pp. 14–27, 2007. c Springer-Verlag Berlin Heidelberg 2007
Transcript
Heider vs Simmel:
Emergent Features in Dynamic Structures
David Krackhardt1 and Mark S. Handcock2,�
1 Carnegie Mellon University, Pittsburgh PA 15213-3890, [email protected]
http://www.andrew.cmu.edu/∼krack2 University of Washington, Seattle WA 98195-4322, USA
Abstract. Heider’s balance theory is ubiquitous in the field of socialnetworks as an explanation for why we so frequently observe symmetryand transitivity in social relations. We propose that Simmelian tie the-ory could explain the same phenomena without resorting to motivationaltautologies that characterize psychological explanations. Further, whileboth theories predict the same equilibrium state, we argue that they sug-gest different processes by which this equilibrium is reached. We developa dynamic exponential random graph model (ERGM) and apply it tothe classic panel data collected by Newcomb to empirically explore thesetwo theories. We find strong evidence that Simmelian triads exist andare stable beyond what would be expected through Heiderian tendenciesin the data.
1 Heider’s Balance Theory
One of the central questions in the field of network analysis is: How do networksform? A cornerstone to our understanding of this process from a structural pointof view has been Heider’s (1946) theory of balance[1]. According to this theory,a person is motivated to establish and maintain balance in their relationships.What constitutes balance has been the subject of some debate (e.g., [2, 3]), butthe core principle has survived and underlies many of our attempts to modelthis process of network formation (see, for example, [4]).
Heider’s (1946) original formulation of balance theory was broad, includingpeople’s attitudes towards objects and ideas, not just towards other people. Theunifying argument was that people felt comfortable if they agreed with otherswhom they liked; they felt uncomfortable if they disagreed with others they liked.Moreover, people felt comfortable if they disagreed with others whom they dis-liked; and people felt uncomfortable if they agreed with others whom they liked.
� We gratefully acknowledge the critical feedback we have received from David Hunter,Steve Goodreau and Carter T. Butts. The research of Handcock was supported byGrant DA012831 from NIDA and Grant HD041877 from NICHD.
Heider vs Simmel: Emergent Features in Dynamic Structures 15
Heider noted we can represent like and agreement as positive sentiments, anddislike and disagreement as negative sentiments. Considering all combinations ofsuch sentiments among “entities”, be they people or objects, Heider simplifiedthe predictions of the theory. “In the case of two entities, a balanced state existsif the relation between them is [mutually] positive (or [mutually] negative.... Inthe case of three entities, a balanced state exists if all three relations [among thethree entities] are positive..., or if two are negative and one positive” (p. 110).
Even in his first paper, Heider noted that in the case where one was considering“entities” as people, then two special properties of balance emerge: symmetryand transitivity. In his terminology, positive affect from one person (p) to another(o) was indicated by “pLo”. As noted above, Heider affirms symmetry is basicto balance. His claim for transitivity was more qualified but nonetheless explicit:“Among the many possible cases [of relations among three people, p, o and q]we shall only consider one. (pLo) + (oLq) + (pLq)... This example shows ... thepsychological transitivity of the L relation [under conditions of balance]” (p. 110).
The other critical tenet in Heider’s original formulation was that balancepredicted dynamics. Heider’s claim was that balance was a state of equilibrium.Imbalance was a state of disequilibrium that would motivate an individual tochange something (either a relation or an attitude) that would result in a movetoward balance.
It was Cartwright and Harary[5] who first made explicit the connection be-tween Heider’s cognitive balance theory and mathematical graph theory. Theydemonstrated how the principles of balance could be represented by a signeddirected graph. Further, by applying the principles of graph theory, they demon-strated how an entire digraph could be characterized as balanced or not depend-ing on the product of the signs of each of its semicycles (or, equivalently, whethersemicycles had an even number of negative ties). This extension became the seedfor a series of papers and books, each building on Heider’s original ideas to studysocial network structures.
In a series of papers by Leinhardt, Holland and Davis, two critical extensionsto this work were developed (see [6], for a spirited review). First, there was thegeneral recognition that most network data, if not actual relations among a setof individuals, were restricted to measurements of positive ties and not negativeties. Thus, they began to look at how balance could be re-thought of as a set ofpositive-only relations. The concept of transitivity became the dominant themein these papers. Imbalance was viewed as represented by intransitive triples inthe data (cases where i → j and j → k and not i → k), rather than the numberof negative ties in any semicycle. Balance was viewed as holding if the triple wastransitive (or at least vacuously so).
Second, and equally important, they recognized that structures were hardlyever perfectly balanced. The question, they argued, is not whether structureswere perfectly balanced but rather whether structures tended toward balance,beyond what one would expect by random chance given certain basic featuresof the graph. They developed a set of distributions and statistical tests for as-sessing these tendencies and discovered that, indeed, most observed structures
16 D. Krackhardt and M.S. Handcock
show very high degrees of transitivity, relative to chance [7, 8], 1981). This workhas remained influential to this day, such that new analyses of balance in anynetwork routinely look at the degree of transitivity (and reciprocity) as measuresof balance [4, 9].
2 Simmelian Tie Theory
Simmel, writing at the very start of the 20th century, had a different view ofthe role of relationships in social settings. He began by noting that the dyad,the fundamental unit of analysis for anyone studying relationships, includingsocial networkers, was not the best focus for understanding social behavior.Indeed, he argued that before making any predictions about how two peoplein a relationship might behave, it is important to understand their context.The context, Simmel continues, is determined by the set of third others whoalso engage in various relationships with the two focal parties. In other words,Simmel argued that the triad, not the dyad, is the fundamental social unit thatneeds to be studied.
At the turn of the last century, Simmel provides several theoretical rationalesfor proffering the triad as the basic social unit ([10]: p. 118-169). Primary amongthese is that the dyad in isolation has a different character, different set of expec-tations and demands on its participants, than the dyad embedded in a triad. Thepresence of a third person changes everything about the dyadic relationship. Itis almost irrelevant, according to Simmel, what defines a relationship (marriage,friendship, colleague); Simmel (p. 126-127) even goes so far as to say that “inti-macy [the strength or quality of a relationship] is not based on the content of therelationship” (emphasis his). Rather, it is based on the structure, the panoply ofdemands and social dynamics that impinge on that dyad. And those demandsare best understood by locating the dyad within its larger context, by finding thegroups of people (of at least three persons) that the dyadic members belong to.
Simmel articulates several features that differentiate what he terms the “iso-lated dyad” from the dyad embedded in a threesome. First, the presence of athird party changes the nature of the relationship itself. Members of a dyad ex-perience an “intensification of relation by [the addition of] a third element, orby a social framework that transcends both members of the dyad” (p. 136).
Similarly, members of a dyad are freer to retain their individuality than mem-bers of a group. “[A dyad by itself] favors a relatively greater individuality ofits members.... [W]ithin a dyad, there can be no majority which could outvotethe individual.” (p. 137). Groups, on the other hand, develop norms of behavior;they develop rules of engagement. Individuality is less tolerated in a group, andconformity is more strongly enforced.
Conflict is more easily managed within a triad than in a dyad. Dyadic con-flict often escalates out of control. The presence of a third party can ameliorateany conflict, perhaps through mediation, or perhaps simply through diffuse andindirect connection. “Discords between two parties which they themselves cannot
Heider vs Simmel: Emergent Features in Dynamic Structures 17
remedy are accommodated by the third or by absorption in a comprehensivewhole” (p. 135).
Perhaps most central to Simmel’s idea about triads is that groups develop anidentity, a “super-individual unit” (p. 126). It is a social unit that is larger inmeaning and scope than any of its individual components. A consequence of thissuper-individual identity is that it will outlast its members. That is, people mayleave, they may even die, but the group is presumed to carry on. In a triad, theemergent “super-individual unit ... confronts the individual, while at the sametime it makes him participate in it” (p. 126). In contrast, dyads by themselvesdo not reflect this transition to a larger-than-self unit. The dyad’s existence isdependent on “the immediacy of interaction” of the two members of the dyad(p. 126). Once one person withdraws from the relationship, the dyad ceases toexist. “A dyad... depends on each of its two elements alone — in its death, thoughnot in its life: for its life, it needs both, but for its death, only one” (p. 124).Thus, he argues, the presence of a third party creates a qualitatively differentunit of identity, one that is more stable over time, and one that is more difficultto extricate oneself from.
Finally, Simmel also notes that, while triads are the smallest form of group,increasing group size does not significantly alter its critical features. “[T]he ad-dition of a third person [to dyads] completely changes them, but ... the furtherexpansion to four or more by no means correspondingly modifies the group anyfurther” (p. 138).
Thus, a triad is substantively different from a dyad. The triad is the small-est form of a group. But its existence transforms the nature of all its dyadicconstituencies in several important ways. It makes the relationships stronger; itmakes them more stable; it makes them more controlling of the behavior of itsmembers.
2.1 Simmelian Ties and Simmelian Decomposition
The foregoing line of Simmelian reasoning suggests that knowing the specificcontent, nature and strength of a relationship between pairs of people is insuffi-cient to understand the dynamics that might emerge in a social system. Even atthe dyadic level, it is critical to know whether any particular dyad is embeddedin a group.
To explore the implications of Simmel’s theory, Krackhardt[11] proposed usinggraph theoretic cliques [12] to identify groups. He then defined a Simmelian tieas a tie that was embedded in a clique. Formally, given a directed graph R suchthat Ri,j = 1 implies the directed arc i → j exists in R, then Ri,j is defined asa Simmelian tie if and only if the following are all true:
Ri,j = 1
Rj,i = 1
∃k | Ri,k = 1 ∧ Rk,i = 1 ∧ Rj,k = 1 ∧ Rk,j = 1
18 D. Krackhardt and M.S. Handcock
Gower [13] and more specifically Freeman [14] developed a method ofdecomposing networks into two components: asymmetric (or specifically “skew-symmetric” in their terminology) and symmetric. Freeman showed that by doingso one could capture more clearly the hierarchy that existed in the network data.Krackhardt extended Freeman’s idea by proposing that a directed graph of net-work ties could be decomposed into three mutually exclusive and exhaustivetypes: asymmetric, sole-symmetric and Simmelian[11]. These types are definedon a directed graph R:
Ri,j =
⎧⎪⎨
⎪⎩
Asymmetric, if Ri,j = 1 ∧ Rj,i �= 1;Sole-Symmetric, if Ri,j = 1 ∧ Rj,i = 1 ∧ Ri,j is not Simmelian;Simmelian, if Ri,j meets definitional conditions above
2.2 Evidence for the Strength of Simmelian Ties
Since this definition of Simmelian Tie was proposed, several studies have emergedtesting various elements of Simmel’s theory. Krackhardt [11] re-analyzed the datacollected by Newcomb[15] to determine the stability of Simmelian ties relativeto asymmetric and sole-symmetric ties. Newcomb had collected network dataamong a set of 17 college students assigned to live together in a fraternity house.In exchange for reimbursement for living expenses, each student filled out aquestionnaire each week for 15 consecutive weeks (except for week 9, where thedata were not collected). The network question asked each student to rank orderall the remaining 16 students based on how much he liked the others.
For purposes of his analysis, Krackhardt[11] dichotomized these rankings atthe median: a relatively high ranking of 1-8 was coded as a 1 (the tie exists);a relatively low ranking of 9-16 was coded as a 0 (the tie does not exist). Hethen asked the question, which ties have a higher survival rate: asymmetric ties,sole-symmetric ties, or Simmelian ties?
To address this question, he plotted the conditional probabilities that a tiewould appear again after Δ weeks, where Δ ranged from 1 week to 14 weeks. Thatis, given that a tie of a particular type (asymmetric, sole-symmetric, Simmelian)existed at time t, what is the probability that a tie (of any type) will exist attime t + Δ?
His results are reproduced in Figure 1. As can be seen in the graph, tiesthat were initially embedded in cliques (Simmelian ties) were substantially morelikely to survive over time than either asymmetric or sole-symmetric ties. Sim-melian ties survived at a rate hovering around .9 for up to 4 weeks, and de-cay to a rate of near .7 over a 14 week gap. In contrast, both asymmetric tiesand sole-symmetric ties survived at a rate of .8 over 1 week’s time, droppingquickly to a rate of .7 after 3-4 weeks, and continued down to about .5 after14 weeks. Clearly, Simmelian contexts provided a substantial survival advantagefor ties.
An interesting aside here was that over a large range of time lags (from about6 to 12 weeks lag), asymmetric ties were considerably more durable than sole-symmetric ties. One possible interpretation of this is that reciprocity in ties, one
Heider vs Simmel: Emergent Features in Dynamic Structures 19
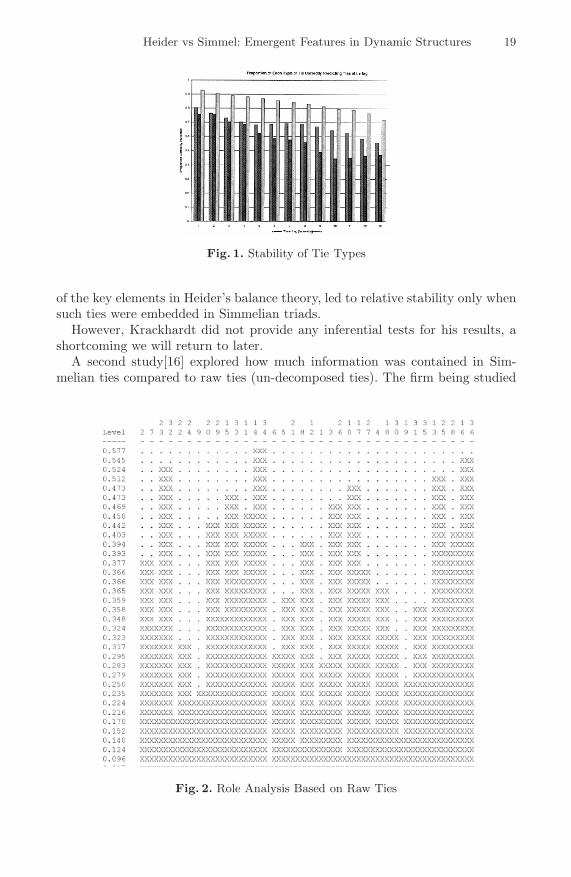
Fig. 1. Stability of Tie Types
of the key elements in Heider’s balance theory, led to relative stability only whensuch ties were embedded in Simmelian triads.
However, Krackhardt did not provide any inferential tests for his results, ashortcoming we will return to later.
A second study[16] explored how much information was contained in Sim-melian ties compared to raw ties (un-decomposed ties). The firm being studied
Fig. 2. Role Analysis Based on Raw Ties
20 D. Krackhardt and M.S. Handcock
had 36 employees, 15 of which were involved in a unionization effort. Some ofthe people involved were in favor of the union; some were against it. Some werevocal about their positions; some were quiet. He was able to demonstrate thatthe dynamics in the union drive and the subsequent defeat of the union wasexplained by observing how several key supporters of the union were “trapped”in Simmelian ties that kept them from freely expressing their views.
As part of this analysis, Krackhardt examined structurally equivalent rolesets for the 36 employees [17]. He noted how clearly these roles emerged in theanalysis of the Simmelian relations. What he failed to do was compare theseroles to what would have been found had he analyzed the roles uncovered in theraw data.
We have re-analyzed his data (Figures 2 and 3) to make this comparison.Figure 2 provides the dendrogram for the role analysis for the raw data, as istypically done in role analysis in network data. The critical values on the left(vertical axis) represent correlations indicating how similar the roles are thatpeople occupy at that particular cutoff level. What is clear from the analysis ofthe raw data in this figure is that roles are not coherent. To reach even a modest.3 correlation, the 36 people had to be divided up into 14 different roles. With anaverage of only a little over 2 people in each role, we learn very little about howrole constraints based on the raw data may be playing a part in understandingthe union dynamics here.
Fig. 3. Role Analysis Based on Simmelian Ties
Heider vs Simmel: Emergent Features in Dynamic Structures 21
Figure 3 conducts the same analysis on the Simmelian ties. In contrast to thedendrogram in Figure 2, the correlations show a much better fit with fewer roles.Indeed, collapsing the 36 employees into 5 roles (an average of over 7 people perrole) yields an average role similarity correlation of .42, a marked improvementover what was observed in the role analysis for raw data. A reasonable interpreta-tion of these results suggests that raw data are noisy, making them difficult to seesystematic patterns of roles and role constraints. Simmelian data appear muchcleaner, crisper, suggesting that they could provide the informational backbonefor structural analysis.
Thus, we have evidence that Simmelian ties are more stable, and that theyprovide a stronger, clearer picture of certain structural features in the network.However, again, these are descriptive measures. There is no stochastic modelhere, and hence no statistical framwork within which we can assess the extentto which these results may be statistical artifacts or perhaps not different fromwhat we would expect by chance. Moreover, these results tell us little about thedynamics of the process of network formation.
3 Dynamic Model Comparison of Heider and Simmel
We return to the central question we started with. What are the forces thatseem to help us understand how networks form? We have presented two possiblemodels, competing in their explanations of network dynamics. Both Heider andSimmel are similar in that they “predict” that one should observe many cliques(symmetric and transitive subgraphs). But their motivational underpinnings andtheir subtle dynamics are radically different.
Heider’s model is a psychologically based one. People are motivated to right animbalance (asymmetric pair or pre-transitive triple) to make it balanced (sym-metric and transitive). Once balance is reached, people are said to have reachedan equilibrium state and are motivated to maintain that balance. Simmel’s the-ory, by contrast, rests in a sociological, structural explanation for the existenceof symmetric and transitive triples. Cliques, once formed, become strong andstable; they resist change. However, there is no inherent motivation to formcliques. It’s just that, once formed, the ties enter a phase that simultaneouslyincreases their strength and reduces their propensity to decay over time. Thus,one could easily predict an equilibrium for each model that would be the same— dominance of symmetric pairs and transitive triples.
To see which model may better represent the real world, we re-analyzed theNewcomb data. These data provide an opportunity to not only see where theequilibrium might be headed but also to uncover what the actual dynamics arethat form the pathway to that equilibrium.
We consider exponential random graph (ERG) models for the network. Thisclass of models allow complex social structure to be represented in an inter-pretable and parsimonious manner [18, 19]. The model is a statistical exponen-tial family for which the sufficient statistics are a set of functions Z(r) of the
22 D. Krackhardt and M.S. Handcock
network r. The statistics Z(r) are chosen to capture the hypothesized socialstructure of the network [20]. Models take the form:
Pθ(R = r) =exp (θ·Z (r))
∑s∈R exp (θ·Z (s))
, (1)
where R is the set of all possible networks and θ is our parameter vector. Inthis form, it is easy to see that
∑s∈R exp (θ·Z (s)) normalizes our probabilities
to ensure a valid distribution. Inference for the model parameter θ can be basedon the likelihood function corresponding to the model (1). As the direct com-putation of the likelihood function is difficult, we approximate it via a MCMCalgorithm [21].
The parameter corresponding to a statistic can be interpreted as the log-odds of a tie conditional on the other statistics in the model being fixed. It isalso the logarithm of the ratio of the probability of a graph to a graph witha count one lower of the statistic (and all other statistics the same). Hence apositive parameter value indicates that the structural feature occurs with greaterfrequency than one would expect by chance (all else being fixed). A negativevalue indicates that the particular structural feature appears less than one wouldexpect by chance.
The space of networks R we consider for the Newcomb data are those thatsatisfy the definition of Section 2.2. Each student has exactly 8 out-ties. Hencethe density and out-degree distribution of the network are fixed. To capture thepropensity for a network to have Heiderian ties and triads we use two statistics:
Z1(r) = number of symmetric dyads in r (2)
Note that the number of edges in the graph is fixed at 17× 8 = 136 and:
number of edges = Z1 + number of asymmetric dyads (3)
and the total number of dyads is(172
)= 136 so
number of asymmetric dyads = 136− Z1
number of null dyads =12Z1
number of symmetric dyads = Z1
Hence Z1 is sufficient to represent the Heiderian dyad census. To represent Hei-derian triads we incorporate the statistic:
Z2(r) = number of Heiderian (i.e., transitive) triads in r
To capture the propensity for the network to have Simmelian triads we incorpo-rate the statistic:
Z3(r) = number of Simmelian triads in r,
that is, the number of complete sub-graphs of size three.
Heider vs Simmel: Emergent Features in Dynamic Structures 23
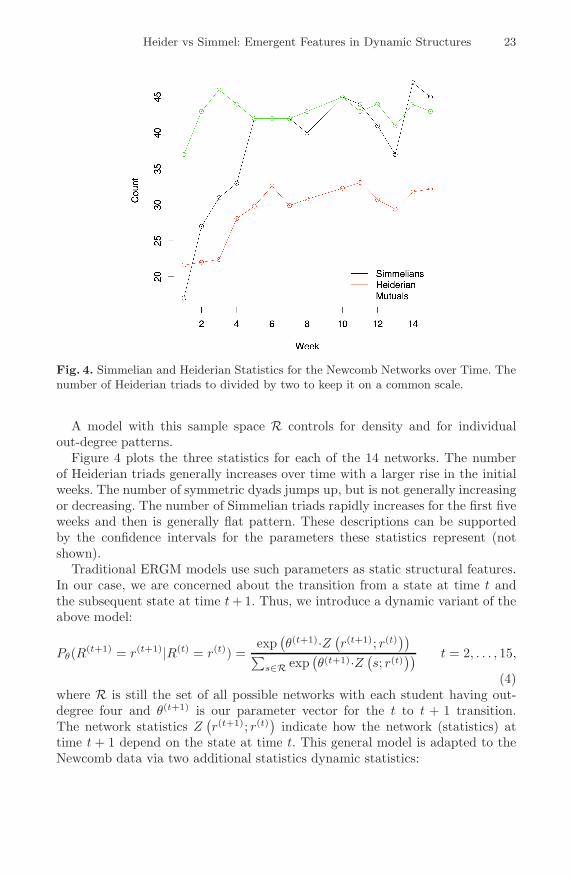
Fig. 4. Simmelian and Heiderian Statistics for the Newcomb Networks over Time. Thenumber of Heiderian triads to divided by two to keep it on a common scale.
A model with this sample space R controls for density and for individualout-degree patterns.
Figure 4 plots the three statistics for each of the 14 networks. The numberof Heiderian triads generally increases over time with a larger rise in the initialweeks. The number of symmetric dyads jumps up, but is not generally increasingor decreasing. The number of Simmelian triads rapidly increases for the first fiveweeks and then is generally flat pattern. These descriptions can be supportedby the confidence intervals for the parameters these statistics represent (notshown).
Traditional ERGM models use such parameters as static structural features.In our case, we are concerned about the transition from a state at time t andthe subsequent state at time t + 1. Thus, we introduce a dynamic variant of theabove model:
Pθ(R(t+1) = r(t+1)|R(t) = r(t)) =exp
(θ(t+1)·Z (
r(t+1); r(t)))
∑s∈R exp
(θ(t+1)·Z (
s; r(t))) t = 2, . . . , 15,
(4)where R is still the set of all possible networks with each student having out-degree four and θ(t+1) is our parameter vector for the t to t + 1 transition.The network statistics Z
(r(t+1); r(t)
)indicate how the network (statistics) at
time t + 1 depend on the state at time t. This general model is adapted to theNewcomb data via two additional statistics dynamic statistics:
24 D. Krackhardt and M.S. Handcock
Z4(r(t+1); r(t)) = number of pre-Heiderian triads in r(t)that are Heiderianin r(t+1)
Z5(r(t+1); r(t)) = number of Simmelian triads in r(t)that persist in r(t+1)
The first follows the dynamics of pre-Heiderian (imbalanced) triads from time tto time t+1. If there is a Heiderian process evolving we expect to see an increasedpropensity for the formation of Heiderian triads from their pre-Heiderian states(all else being equal). The second follows the dynamics of Simmelian (completetriples) triads from time t to time t + 1. If there is a Simmelian process evolvingwe expect to see persistence of Simmelian triads (all else being equal). Notethat this allows a distinct process of Simmelian formation not controlled by thisparameter. By including these statistics in the model, we can follow the dynamicsin the Newcomb data to see how states transitioned from a non-balanced stateand the stability of Simmelian state once formed.
Fig. 5. The persistence of Simmelian triads and the formation of Heiderian triads forthe Newcomb Networks over Time
Figure 5 plots the two dynamic statistics over the 14 weeks of data. We clearlysee the increase persistence of Simmelian triads over time and the decreasingformation of Heiderian triads over time. Both these effects are strongest in theearly weeks with a possible increase in the final weeks.
Both the cross-sectional and dynamic models and figures present overall Hei-derian and Simmelian effects. To understand the interactions we consider thejoint effects through the parameters of a dynamic model. Consider the model (4)
Heider vs Simmel: Emergent Features in Dynamic Structures 25
Fig. 6. The joint effects of the persistence of Simmelian triads, Heiderian dyadic bal-ance, and the formation of Heiderian triads for the Newcomb networks over time. Thevalues plotted are the maximum likelihood estimates of the parameters of model (4)for t = 2, . . . , 15.
with statistics Z1, Z4 and Z5. These measure the overall level of Heiderian dyadsand the dynamics of the two processes. The maximum likelihood estimator ofthe parameter θ(t+1) was estimated for t = 2, . . . , 15.
Figure 6 plots the parameters over the 14 weeks of data. It is importantto note that these measure the simultaneous joint effect of the three factors.Consider the formation of Heiderian triads. We see that is positive for each timepoint indicating that Heiderian formation is substantively higher than due tochance. It is also modestly increasing over time indicating that the propensityfor formation is modestly increasing even in the presence of the other structuralfactors. The pattern for the Simmelian persistence is also positive indicatingsubstantially more persistence of Simmelian triads than expected due to chanceeven adjusting for the Heiderian triadic and dyadic effects. This has an early peakin the fifth week and appear to be increasing in the last weeks. Both these effectsare confirmed by the confidence intervals for the parameters (not shown). Finally,the overall presence of Heiderian dyads is not significantly different from therandom process. This is confirmed by the confidence intervals for the symmetricparameter, and also indicated by the point estimates arranged about zero.
All analyses in this section were implemented using the statnet package fornetwork analysis [22]. This is written in the R language [23] due to its flexibilityand power. statnet provides access to network analysis tools for the fitting, plot-ting, summarization, goodness-of-fit, and simulation of networks. Both R and thestatnet package are publicly available (See websites in the references for details).
26 D. Krackhardt and M.S. Handcock
4 Conclusion
There have been reams of evidence for the frequent occurrence of symmetric andtransitive structures in naturally occurring networks. Most of this work has beenmotivated by Heider’s theory of balance. While Simmel’s work is well-knownamong sociologists, little attention has been paid to his possible explanation ofthe same phenomena.
We have outlined how Simmel’s theory, without resorting to any psychologi-cal motivations, can be used to predict the same structures as Heider’s theory.Indeed, one would expect the same states from each model in equilibrium. But,the dynamics which reach these final states are substantially different. Statisti-cal evidence from the Newcomb data suggest that Simmel’s description of theevolution of these structures is a better fit with the data than Heider’s.
The results of the dynamic modeling of the Newcomb data (Figure 6) indicatethat Simmelian structures are important to the dynamics in the Newcomb dataeven when Heiderian dynamics and propensity have been accounted for. Thusthe tendency to form Simmelian ties that persist most strongly and significantlythroughout time is not just a by-product of a Heiderian process, but exists aboveand beyond that. The results also indicate that the overall level of Heiderianbalance is a product of the dynamic formation of Heiderian triads from pre-Heiderian triads (above and beyond that naturally induced by the numbers ofpre-Heiderian triads that exist at that point in time).
The results here are not conclusive. The Newcomb data are limited in theirgeneralizability. But they are suggestive. Perhaps the dynamics that we haveattributed all these years to Heider and balance theory are at least in partdue to a completely different theory, a structural theory more consistent withSimmel’s interpretation of structural dynamics.
References
[1] Heider, F.: Attitudes and cognitive organization. Journal of Psychology 21 (1946)107–112
[2] Davis, J.A.: Clustering and structural balance in graphs. Human Relations 30(1967) 181–187
[3] Flament, C.: Independent generalizations of balance. In Holland, P.W., Leinhardt,S., eds.: Perspectives on Social Network Research. Academic Press, New York(1979) 187–200
[4] Doreian, P., Krackhardt, D.: Pre-transitive balance mechanisms for signed net-works. Journal of Mathematical Sociology 25 (2001) 43–67
[5] Cartwright, D., Harary, F.: Structural balance: a generalization of heider’s theory.Psychological Review 63 (1956) 277–293
[6] Davis, J.A.: The davis /holland /leinhardt studies: An overview. In Holland,P.W., Leinhardt, S., eds.: Perspectives on Social Network Research. AcademicPress, New York (1979) 51–62
[7] Holland, P.W., Leinhardt, S.: Some evidence on the transitivity of positive inter-personal sentiment. American Journal of Sociology 72 (1972) 1205–1209
Heider vs Simmel: Emergent Features in Dynamic Structures 27
[8] Holland, P.W., Leinhardt, S.: Local structure in social networks. In Heise, D.R.,ed.: Sociological Methodology. Jossey-Bass, San Francisco, CA (1975)
[9] Krackhardt, D., Kilduff, M.: Whether close or far: Perceptions of balance infriendship networks in organizations. Journal of Personality and Social Psychology76 (1999) 770–782
[10] Simmel, G.: The Sociology of Georg Simmel. The Free Press, New York(1908/1950)
[11] Krackhardt, D.: Simmelian ties: Super strong and sticky. In Kramer, R., Neale,M., eds.: Power and Influence in Organizations. Sage, Thousand Oaks, CA (1998)21–38
[12] Luce, R.D., Perry, A.D.: A method of matrix analysis of group structure. Psy-chometrika 14 (1949) 95–116
[13] Gower, J.C.: The analysis of asymmetry and orthogonality. In Barra, J.,Boudreau, F., Romier, G., eds.: Recent Developments in Statistics. North-HollandPublishing Co., New York (1977) 109–123
[14] Freeman, L.C.: Uncovering organizational hierarchies. Computational and Math-ematical Organizational Theory 3(1) (1997) 5–18
[15] Newcomb, T.N.: The Acquaintance Process. Holt, Rinehart and Winston, NewYork (1961)
[16] Krackhardt, D.: The ties that torture: Simmelian tie analysis in organizations.Research in the Sociology of Organizations 16 (1999) 183–210
[17] Lorrain, F., White, H.: Structural equivalence of individuals in social networksblockstructures with covariates. Journal of Mathematical Sociology 1 (1971)49–80
[18] Holland, P.W., Leinhardt, S.: An exponential family of probability distributionsfor directed graphs. Journal of the American Statistical Association 76(373)(1981)
[19] Frank, O., Strauss, D.: Markov graphs. Journal of the American StatisticalAssociation 81(395) (1986) 832–842
[20] Morris, M.: Local rules and global properties: Modeling the emergence of networkstructure. In Breiger, R., Carley, K., Pattison, P., eds.: Dynamic Social NetworkModeling and Analysis. Committee on Human Factors, Board on Behavioral, Cog-nitive, and Sensory Sciences. National Academy Press: Washington, DC (2003)174–186
[21] Hunter, D.R., Handcock, M.S.: Inference in curved exponential family models fornetworks. Journal of Computational and Graphical Statistics 15 (2005) 482–500
[22] Handcock, M.S., Hunter, D.R., Butts, C.T., Goodreau, S.M., Morris, M.:statnet: An R package for the Statistical Modeling of Social Networks.http://csde.washington.edu/statnet. (2003)
[23] R Development Core Team: R: A Language and Environment for StatisticalComputing. R Foundation for Statistical Computing, Vienna, Austria. (2006)ISBN 3-900051-07-0.


![Brain Research Bulletin - TOP - 生理学研究所...272 Y. Morito et al. / Brain Research Bulletin 79 (2009) 271–280 Baron-Cohen [2], Heider and Simmel had evoked mentalization](https://static.documents.pub/doc/80x56/5e7b112c957fb414ac4ec69f/brain-research-bulletin-top-cccc-272-y-morito-et-al-brain.jpg)


