19
LNG AS A KEY DRIVER FOR MALAYSIA AND REGIONAL MARKETS – CHALLENGES AND PROSPECTS By Datuk Ir. Ahmad Fauzi Hasan Energy Commission

LNG AS A KEY DRIVER FOR MALAYSIA AND REGIONAL MARKETS
– CHALLENGES AND PROSPECTS
By
Datuk Ir. Ahmad Fauzi Hasan
Energy Commission

Source: Draft - National Energy Balance 2011
2
Final Use of Commercial Energy

Source: Draft - National Energy Balance 2011
3
Commercial Energy Supply

Indigenous Gas
1600mmscfd
(71%)
PM3 CAA
50mmscfd
(2%)
West Natuna ‘B’
250mmscfd
(11%)
Joint Development
Area (JDA)
350mmscfd
(16%)
Gas
Processing
Plant (GPP)
PGU System
Power Sector
1100mmscfd
(49%)
Non-Power
Sector
Export
200mmscfd
(9%)
PETRONAS
Customers
590mmscfd
(26%)
Gas Malaysia Bhd
360mmscfd
(16%)
Peninsular Malaysia Gas Value Chain

Peninsula Natural Gas Pricing Situation
May 1997 – June 2008:
October 2002:
June 2008:
March 2009:
June 2011:

Electricity Generation Fuel Mix:
From Oil to Gas and Coal Dependency
46%
45%
4%
5%

0
50
100
150
200
250
300
350
1999 2000 2001 2002 2003 2004 2005 2006 2007 2008 2009 2010 2011 2012
60.2 63.9 62.4 68.4
77.6
126.2
186.9
252.39
277.55 291.26
280.01
306.87
325.19 332.37
Nat
ura
l Gas
Co
nsu
mp
tio
n ,
mm
scfd
Year
Gas Consumption Via the Natural Gas Distribution System

200
400
600
800
1,000
1,200
1,400
1,600
1-Jan 1-Feb 1-Mar 1-Apr 1-May 1-Jun 1-Jul 1-Aug 1-Sep 1-Oct 1-Nov 1-Dec
2009 2010 2011 2012
Date
GAS NOMINATION FOR 2009, 2010, 2011 & 2012
Gas volume supplied in 2012 decreased by 10.12% compared to 2009 but electricity
generation increased by 12.65% from 94,748 GWh to 108,473 GWh.
Year 2009 2010 2011 2012 Unit
Average (daily) 1,224 1,139 1,050 1,100 mmscfd
Maximum (daily) 1,398 1,270 1,288 1,261 mmscfd
Minimum (daily) 700 750 833 822 mmscfd
Total 446,639 415,682 383,356 401,404 mmscf
8
The Gas Supply Challenge

Global Natural Gas Pricing Situation

10
Peak Demand *(MW)
15,072 17,671 20,847 24,770
Energy Generated (GWh)
100,991 118,420 140,613 169,250
*Peninsula Malaysia
0%
20%
40%
60%
80%
100%
2010 2015 2020 2030
5% 4% 4% 4%
58% 53%
35% 28%
37%
39%
53%
43%
9%
5%
5% 8% 10%
Hydro Gas Coal Nuclear Interconnection RE
Towards A More Diversified And Affordable Fuel Mix

0
500
1000
1500
2000
2500
3000
2013 2016 2019 2022 2025
mm
scfd
Domestic Gas Supply*
Forecasted Gas Demand**
Gas shortfall to be addressed by importing LNG
* Includes JDA, Natuna and PM3
** Demand growth projected for power and non-power sectors
Domestic gas supply is not
able to support additional
gas demand
Peninsula Gas Supply and Demand Projection

The Gas Supply Challenges
• Depleting domestic productions due to high decline rates
• Technically and commercially challenging new fields
• Rapid demand growth has led to over-stretching of the supply
system
• Reduced reliability of ageing upstream facilities has led to frequent
supply interruptions and shortfalls
• Increasingly dependent on gas supplies from other pipeline gas
sources such as Joint Development Area (JDA) (Thailand),
West Natuna (Indonesia) and PM3 (Vietnam)
• LNG imports are required to address supply shortfall and increasing
demand

Melaka
Kuantan
Segamat
Jerneh
(1992)
Kuala Lumpur
Lawit (1997)
Bekok
THAILAND
JDA
(2005)
PM-3
(2003)
Angsi (2002)
SONGKHLA
Bintang
(2003)
Resak (2000)
KERTIH
Duyong (1984)
Kangar
West Natuna ‘B’
(Indonesia - 2002)
SOURCE: PETRONAS
13
Boosting Gas Supply to the Peninsula for Local
Consumption

14
Bintulu
Kimanis
Sabah Sarawak gas pipeline (under construction)
Sepangar Bay Kota Kinabalu
ERB WEST
SEMARANG
Patricia
Mahkota
E11, E13, F13
Helang
Congkak
Golok
Labuan
Betty Miri Crude Oil Terminal
Miri
SOURCE: PGB
RGT Lahad Datu
(2016)
SOGT
SAMUR
Boosting Gas Supply to Sabah and Sarawak for Local
Consumption and Export

APEC’s Technically Recoverable Conventional and Unconventional Gas Resource Base, in MToe
Economy Conventional
Gas
Unconventional Gas
Conventional &
Unconventional Gas
2009
Production
Years of
Production Shale Gas
Coal Bed
Methane Tight Gas Total
China 5 225 22 150 9 625 na 31 775 37 000 76.7 482
US 30 750 14 475 3 500 13 000 30 975 61 725 532.7 116
Australia 5 700 9 950 10 975 500 21 425 27 125 38.1 712
Canada 8 650 2 250 1 125 4 250 7 625 16 275 147.6 110
Mexico 2 375 7 425 100 na 7 525 9 900 49.1 202
Russia 86 125 1 825 50 na 1 875 88 000 474.9 185
Source: APERC
Abundant Future Natural Gas Resources In APEC
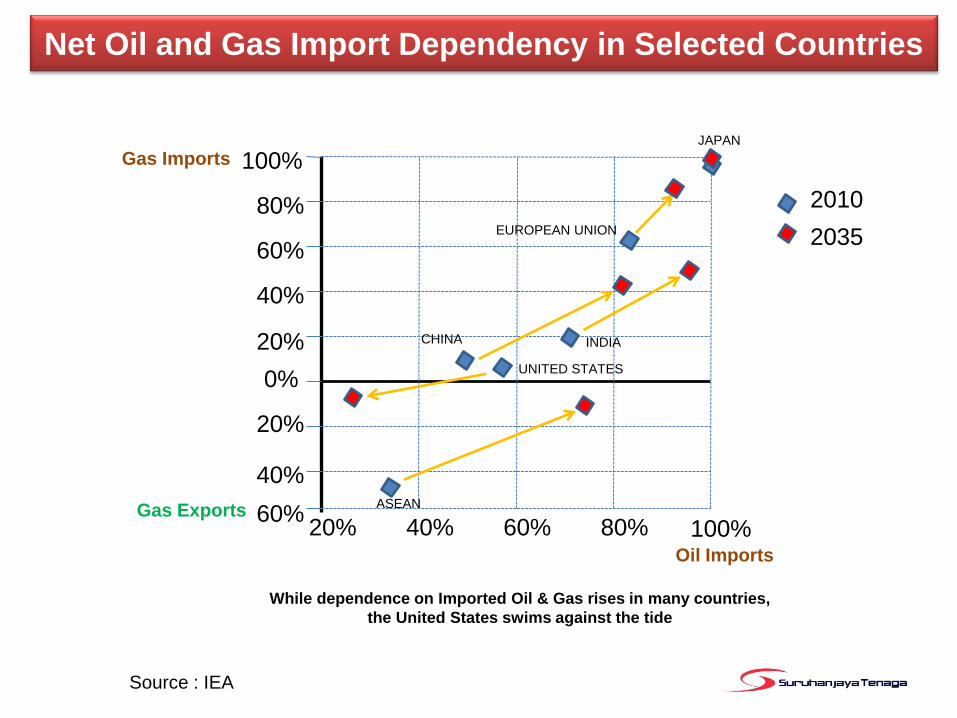
100%
80%
60%
40%
20%
0%
20%
40%
60% 20% 40% 60% 80% 100%
ASEAN
CHINA
UNITED STATES
INDIA
EUROPEAN UNION
JAPAN
Gas Exports
Oil Imports
While dependence on Imported Oil & Gas rises in many countries,
the United States swims against the tide
Gas Imports
2010
2035
Net Oil and Gas Import Dependency in Selected Countries
Source : IEA
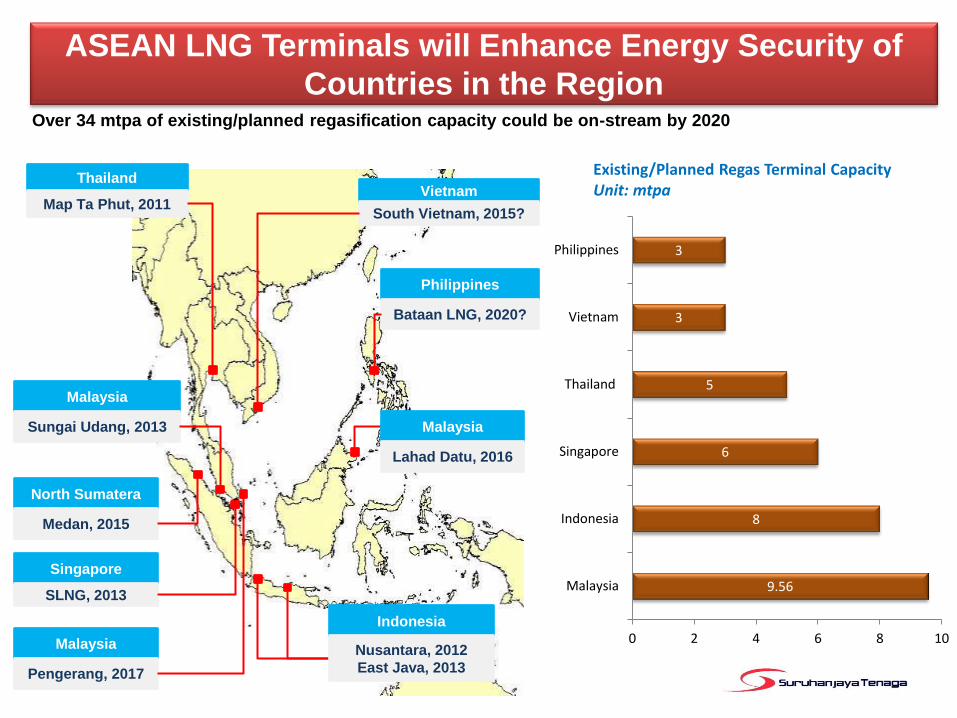
Over 34 mtpa of existing/planned regasification capacity could be on-stream by 2020
Thailand
Map Ta Phut, 2011 Vietnam
South Vietnam, 2015?
Malaysia
Sungai Udang, 2013
Philippines
Bataan LNG, 2020?
Indonesia
Nusantara, 2012
East Java, 2013
North Sumatera
Medan, 2015
Singapore
SLNG, 2013
Malaysia
Lahad Datu, 2016
Malaysia
Pengerang, 2017
Existing/Planned Regas Terminal Capacity Unit: mtpa
9.56
8
6
5
3
3
0 2 4 6 8 10
Malaysia
Indonesia
Singapore
Thailand
Vietnam
Philippines
ASEAN LNG Terminals will Enhance Energy Security of
Countries in the Region

• PETRONAS is intensifying exploration, recovery enhancement from depleted
fields and marginal fields development
• PETRONAS is developing LNG Regasification Terminals (RGTs) at :
• Sungai Udang, Melaka (2013)
• Lahad Datu, Sabah (2016)
• Pengerang, Johor (2016)
• RGT facilities plus transmission and distribution system will be made accessible to
third party gas and utility companies to import and deliver gas to consumers.
• Government is moving towards market-based gas pricing with discounts for local
consumptions
• Power sector is moving towards a more diversified and balanced fuel mix
• Government is planning the national strategic gas reserve
• Unconventional gas developments in APEC and increasing LNG regasification
capacity in ASEAN will enhance overall future supply security in the region
Positive Developments In Meeting Gas Supply Challenges

Thank You


